Abstract
Background and objective:
In this work, we address the problem of detecting and discriminating acute psychological stress (APS) in the presence of concurrent physical activity (PA) using wristband biosignals. We focused on signals available from wearable devices that can be worn in daily life because the ultimate objective of this work is to provide APS and PA information in real-time management of chronic conditions such as diabetes by automated personalized insulin delivery. Monitoring APS noninvasively throughout free-living conditions remains challenging because the responses to APS and PA of many physiological variables measured by wearable devices are similar.
Methods:
Various classification algorithms are compared to simultaneously detect and discriminate the PA (sedentary state, treadmill running, and stationary bike) and the type of APS (non-stress state, mental stress, and emotional anxiety). The impact of APS inducements is verified with commonly used self-reported questionnaires (The State-Trait Anxiety Inventory (STAI)). To aid the classification algorithms, novel features are generated from the physiological variables reported by a wristband device during 117 hours of experiments involving simultaneous APS inducement and PA. We also translate the APS assessment into a quantitative metric for use in predicting the adverse outcomes.
Results:
An accurate classification of the concurrent PA and APS states is achieved with an overall classification accuracy of 99% for PA and 92% for APS. The average accuracy of APS detection during sedentary state, treadmill running, and stationary bike is 97.3, 94.1, and 84.5%, respectively.
Conclusions:
The simultaneous assessment of APS and PA throughout free-living conditions from a convenient wristband device is useful for monitoring the factors contributing to an elevated risk of acute events in people with chronic diseases like cardiovascular complications and diabetes.
Keywords: Acute psychological stress, Physical activity, Discrimination of physical and psychological stressors, Wearable devices, Machine Learning
1. Introduction
Continuous monitoring of the modifiable risk factors in chronic diseases such as cardiovascular (CV) diseases, hypertension, and diabetes can provide valuable information for interventions that mitigate the risks of undesirable outcomes. Acute psychological stress (APS) causes an immediate physiological response that is associated with an acute and transient increase in the risk of hyperglycemic and CV events. In addition to APS, vigorous physical activity (PA) is also an independent risk factor for cardiovascular events, though regular habitual PA reduces the risks of coronary heart disease events. PA can have a positive impact on glucose regulation in diabetes and is recommended to people with diabetes. Monitoring the APS of a person throughout everyday life and in free-living conditions can allow for preventative measures to mitigate APS-mediated diseases and risks. However, the physiological response of APS is not a distinctly unique signature. Similar to APS, structured exercise and routine PA in daily-living can also cause physiological responses that may lead to ischemia, metabolic imbalances, glycemic excursions, and morbidities caused by these conditions. Enabling the continuous monitoring and assessment of the possibly simultaneous occurrences of APS and PA in free-living conditions requires protocols and algorithms that can discriminate between the simultaneous stressors. Detection and discrimination of APS and PA can be complemented by determining the characteristics of these physiological and psychological stressors to propose individualized intervention strategies and mitigate their effects. In the case of diabetes, these interventions could lead to automated insulin delivery by adaptive multivariable artificial pancreas systems.
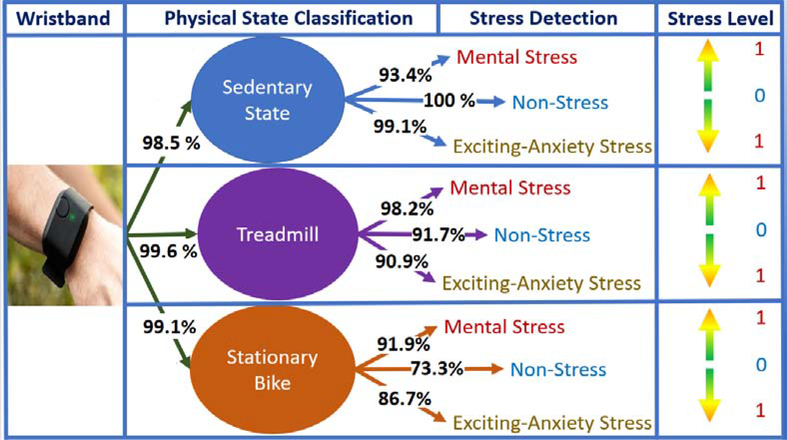
Several devices and algorithms can characterize APS and PA in clinical environments with high accuracy. Outside of clinical settings in free-living environments, the sensors are limited to those that can be worn comfortably and would be accepted as part of regular clothing or accessories. Recent advances in wearable devices provided wristbands with 3-axis accelerometers and sensors for measuring skin temperature, electrodermal activity, and blood volume pulse. The data reported by these sensors can be refined and interpreted to incorporate the effects of APS and PA in treatment decisions. Our focus has been on the development of automated insulin delivery systems (artificial pancreas) [5–8] that use this additional knowledge along with the continuous glucose measurements in predicting future glucose concentrations used by model predictive control to optimize insulin infusion decisions. This paper is focused on the detection of APS, PA and their coexistence (they may cause opposite effects on glucose levels) and the identification of their types and intensities (Fig. 1). Both APS and PA lead to the activation of the sympathetic nervous system.
Figure 1:
Overview of Proposed Method (Stress Level: Normalized APS Estimates [0–1]), (Numbers: Percentage Classification Accuracy (Testing) for Each Individual Branch)
The sympathetic division of the autonomic nervous system responds to PA by increasing the heart rate, blood pressure, and respiration rate, and by stimulating the release of glucose from the liver for energy. The general physiological response of APS is similar to PA, though exercise normally elicits a larger response. The physical fitness level, individual traits, and personal experiences affect transient neuroendocrine and physiological responses to APS. These factors make it challenging to reliably monitor psychological and physical stress by using only the measured variables and necessitates the use of detection, classification, and estimation techniques based on meticulously selected features derived from the measurements [1, 9, 10].
Several indicators can be considered for monitoring APS-related changes. The secretion of stress hormones, such as cortisol, is shown to be a marker of APS. However, continuous and noninvasive monitoring of hormonal levels in free-living conditions is not practical. A simple and easy-to-measure indicator of APS can be developed by using wearable devices. Recent developments in wristband technologies enable high-frequency collection and real-time streaming of several physiological variables from a single device [11, 12] (Table 1, Fig. 2). These conveniently measured biosignals can be used for APS detection as they can detect the physiological responses arising due to the activation of the sympathoadrenal medullary system. Galvanic skin response (GSR) is an indicator of sweating rate, therefore a strong correlation exists between GSR and PA intensity. Since sympathetic activation stimulates the sweat glands, GSR is also correlated with the APS level. Blood volume pulse (BVP) is a commonly used signal for extracting HRV variability features, which are useful indicators to understand different changes in cardiac output, thereby metabolic variations due to APS and/or PA. Skin temperature is useful to capture abrupt changes in skin functions, which are indicative of thermoregulation, insulation, sweating, and control of blood flow. Capturing changes in blood flow control and thermoregulation is useful to capture the effects of PA or APS. Accelerometer (ACC) plays a key role in distinguishing PA from APS, since there is no correlation between ACC and APS, though a strong association exists with PA. (Table 1). Due to the multifaceted response of APS, a multivariable measurement and assessment approach is required for the robust and reliable detection of APS in free-living conditions, especially in the presence of PA. Previous studies indicate that APS can be accurately detected using wristband devices [1, 10, 13–22]. A few studies report the classification of different types of APS, such as mental stress and emotional anxiety [1, 10, 18]. Detecting the concurrent presence and the type of APS is further complicated by the presence of different types and intensities of physical activities. Glucose level excursions during training for a race are different from the glucose variations during and before the race. Falling while bicycling, driving during rush hour, or hearing the screams of a young child while doing house chores are instances where APS co-exists with PA.
Table 1:
Noninvasively Measurable Biosensor and Their Physiological Indicators (PI)
| Sensor | Measurement | PI | PA | APS |
|---|---|---|---|---|
| GSR | Electrical conductance of the skin, sweat gland activation | Sympathetic nervous system (SNS) activation | Increase due to the sweating | Increase due to sweat gland stimulus as a result of SNS |
| BVP | Absorption of light by the blood flowing through the vessels | Heart rate variability (HRV) as it is affected due to SNS activation [1] | HRV altered due to SNS activation [1] | HRV altered due to SNS activation [1] |
| ST | Accurate temperature measurement of the skin surface | The response of systemic vasoconstriction and thermoregulation | Drop due to segmental vasoconstriction caused by a reflex in the spinal cord [2] | Temperature of thermoregulatory tissues drop [3] |
| 3-D ACC | Tool which can measures proper acceleration | Movement, speed, acceleration, stability, position | Intensity of PA is highly correlated with changes of the ACC signal [4] | No correlation exists [4] |
| HR | Derived from BVP (Inter-beat Interval) | Individual cardiovascular condition | Intensity of PA is highly correlated with increase of the HR signal | Intensity of APS is highly correlated with increase of the HR signal |
Figure 2:
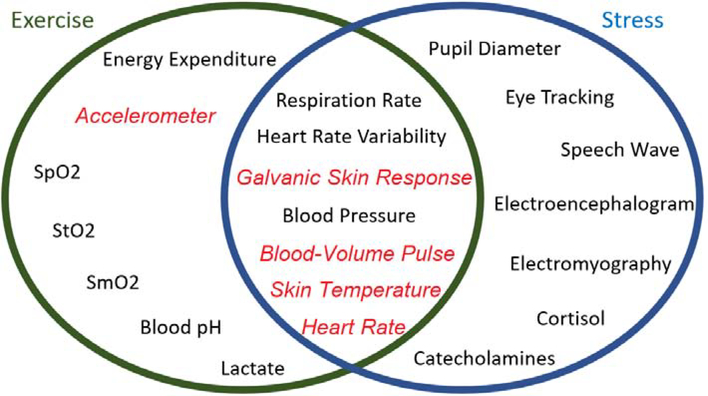
Signals for Discriminating Exercise from APS (Red and italics) Can Measured by Empatica E4 [1, 10, 11, 18–22]
In this work, we address the problem of detecting the presence of PA and APS and their simultaneous existence, and determining their types and intensities, through interpretation of physiological signals measured by a wristband (Fig. 2). Extending on previous work that considers APS or PA exclusively, in this work we discriminate among the types of APS (non-stress state, mental stress, and emotional anxiety) and the concurrent PA (sedentary state, treadmill run, stationary bike). We also develop quantifiable metrics that convey the level of the APS and the intensity of the PA. To enable the simultaneous detection and assessment of APS and PA, we rely on the physiological variables that can be noninvasively measured by a single wearable wristband device (Fig. 2) [1, 10, 18–22]. Although many physiological variables can help distinguish APS from PA, such as eye-tracking [23], speech wave analysis [24], and lactate and cortisol levels, we restricted our selection to physiological variables that can be conveniently measured during daily life. We use the Empatica E4 wristband that reports five physiological variables and streams data in real-time, including ACC readings, BVP, GSR, skin temperature (ST), and heart rate (HR) computed by an internal algorithm of E4 from BVP [11]. The measured physiological variables are used to generate informative features and train machine learning algorithms.
2. Procedure
2.1. Data Collection
Thirty-four subjects participated in 166 clinical experiments that included staying in sedentary state (SS) or performing a physical activity (treadmill run [TR] or stationary bike [SB]) and while there are no psychological stressors (non-stress [NS]), or APS is induced (mental stress [MS] or emotional anxiety stress [EAS]). The experiments were approved by the Institutional Review Board of the university. Ten different participants are involved in SS activities. The SS experiments are divided into three subcategories: (1) non-stressful events where participants watch neutral videos, read books, or surf the internet; (2) EAS inducement where data are collected during meetings with supervisors, driving a car, and solving test problems in the allotted time; and (3) MS inducement where a subject undergoes the Stroop test, IQ test, mental arithmetic or mathematics exam, or puzzle games. Any problem that involves mental stress is considered as MS inducement, while unusual scenarios where individuals feel anxiety or unease are considered as EAS inducement. The APS inducement methods are recognized in the literature to reliably induce APS and are considered standard techniques that are widely accepted and implemented in similar studies [1, 8, 10, 18–22, 25–33].
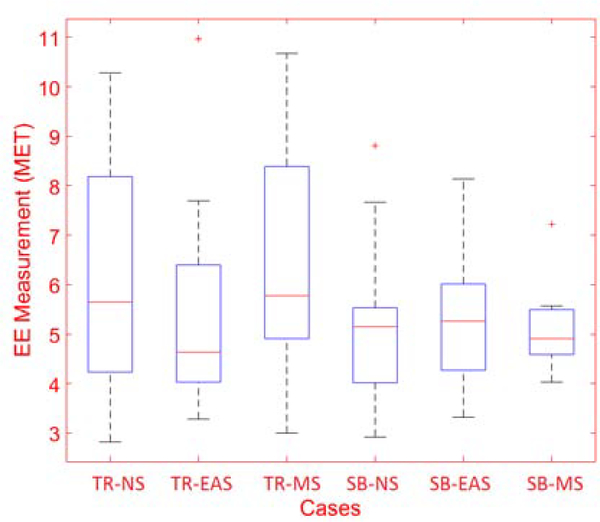
TR exercises are similarly divided into three categories: (1) NS events such as watching nature videos or listening to music; (2) EAS inducement where subjects watch surgery video or car crash videos; and (3) MS inducement where subjects solve mental math problems (mental multiplication of two-digit numbers) during the experiment [1, 8, 10, 20, 21, 25–28, 31]. The energy expenditure is measured and compared across the NS, EAS, and MS experiments to ensure the physical activity is consistent across the experiments. A portable indirect calorimetry system (Cosmed K5, Rome, Italy [34]) is used for energy expenditure (EE) measurements to determine the intensity of the physical activity, with some experiments analyzed using EE estimates computed through the use of a wristband device [4]). We found that the distribution of EE measurements for each class of experiments does not have any statistically significant difference (p-value > 0.05). Therefore, the subjects performed similar intensity physical activity during the different experiments (during TR and SB exercise) (Fig. 3).
Figure 3:
Energy Expenditure Measurements for Each Cases (TR: Treadmill, NS: Non-Stress, EAS: Exciting-Anxiety Stress, MS: Mental-Stress, BK: Bike Exercise)
SB experiments are conducted with 19 participants. They are divided into three categories based on APS inducement, similar to the protocol of TR exercise. Table 2 lists all experiments conducted along with information about training and test data. The Empatica E4 data are recorded during all experiments [11]. Demographic information of participants and experiment information (APS type, duration, starting time, activity type, EE (Fig. 3), etc) are also recorded.
Table 2:
Experiments Conducted for Data Collection
| Different PS with Various APS Inducements | |||
| Physical Act. | Number of Experiments | Number of Subject | Minutes |
| Resting | 89 | 10 | 3172 |
| Treadmill | 57 | 20 | 2164 |
| Sta. Bike | 61 | 19 | 1713 |
| Sedentary State Ex. with APS Inducement | |||
| Physical Act. | Number of Experiments | Number of Subject | Minutes |
| Non-Stress | 28 | 6 | 846 |
| Excitement | 29 | 9 | 1129 |
| Mental Stress | 32 | 6 | 1197 |
| Treadmill Experiments with APS Inducement | |||
| Physical Act. | Number of Experiments | Number of Subject | Minutes |
| Non-Stress | 28 | 20 | 1162 |
| Excitement | 12 | 12 | 676 |
| Mental Stress | 17 | 8 | 326 |
| Stationary Bike Experiments with APS Inducement | |||
| Physical Act. | Number of Experiments | Number of Subject | Minutes |
| Non-Stress | 29 | 19 | 891 |
| Excitement | 24 | 12 | 585 |
| Mental Stress | 8 | 7 | 237 |
Additionally, to assess the anxiety response of participants, The State-Trait Anxiety Inventory (STAI) [35–37] self-reported questionnaire data is collected both before and after each nonstress and emotional anxiety stress inducement experiments. STAI-T (Trait) and STAI-S (State) scores are calculated for each participant. STAI-T scores indicates the feelings of stress, anxiety or discomfort that one experiences on a day-to-day basis. STAI-S scores indicates temporal fear, nervousness, discomfort and the arousal of the autonomic nervous system induced by different situations that are perceived as stressful conditions [35–37].
2.2. Pre-Processing
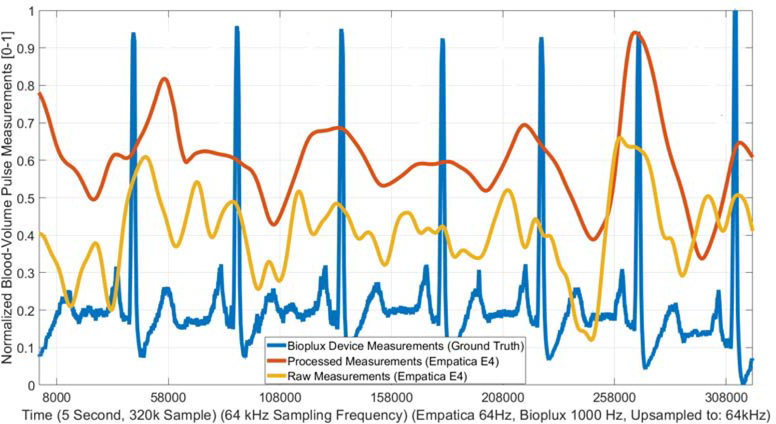
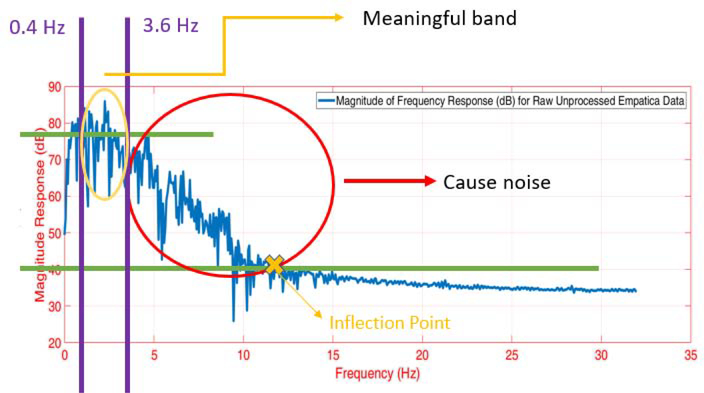
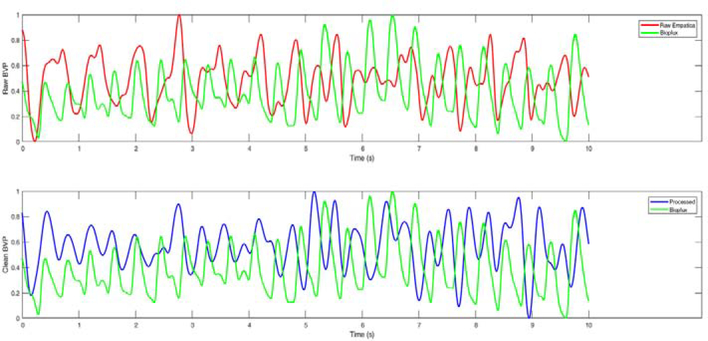
Empatica E4 collects biosignals at high- frequency; ACC: 32 Hz, BVP: 64 Hz, GSR: 4 Hz, ST: 4 Hz and HR: 1 Hz) [11]. The raw signals collected from the device are corrupted by noise and motion artifacts. Various signal processing techniques are used to obtain the denoised signals. The Savitzky-Golay (SG) filter is used for denoising the ACC [38], ST [39], HR [40], GSR [39] measurements. After tuning the parameters of the SG filter, the order and frame length parameters are determined for the measurements as: ACC (order: 7 and frame length: 15), ST (5 and 9), HR (5 and 9), and GSR (5 and 11). The motion artifacts corrupting the BVP data have signatures and frequencies similar to the underlying BVP signal, which makes their filtering a nontrivial task. Since the BVP is a useful biosignal for discriminating among APS and PA, we utilize a sequential signal processing technique involving an initial bandpass filter (Butterworth filter, cut off frequencies: [ 0.3 Hz - 3.5 Hz]) followed by an adaptive noise cancellation algorithm based on nonlinear recursive least squares (NRLS) filtering and wavelet decomposition algorithm (Symlets 4 wavelet function, 4 level decomposition) [41–43]. The details of our implementation is presented in the Appendix B. The uncorrupted and denoised BVP signal is obtained from the raw signal using the cascaded signal processing technique (Fig. 4) [44].
Figure 4:
Example Processed and Raw BVP Signal (Details In: Appendix B)
2.3. Feature Extraction
Features are extracted from the filtered biosignals at one-minute intervals (Table 2). Statistical features (mean, standard deviation, kurtosis, skewness, etc.), mathematical features (derivative, area under the curve, arccosine, etc.) and data specific features (zero-cross of ACC readings, total-energy response of GSR, maximum amplitude of the low frequency BVP variations, etc.) are extracted [1, 45–51]. The ratios of extracted features can be valuable to distinguish among APS and PA. For example, during a stressful SS episode, the ACC readings are relatively stable (mean magnitude of ACC), while the GSR (mean magnitude of GSR) values increase because of the incremental increase in sweating rate in response to the stress. Therefore, the ratio of the mean magnitudes of ACC and GSR is informative for detecting APS. We extracted additional secondary features as the ratios of various primary features. A total of 2068 feature variables are obtained, with 718 primary features and 1350 secondary features. A total of 225 primary features are extracted from the 3-D ACC, 148 from the processed and denoised BVP [44], 98 from the HR, 111 from the ST, 136 from the GSR readings. Some of the extracted features are highly correlated with each other and do not provide additional information for training the machine learning algorithms.
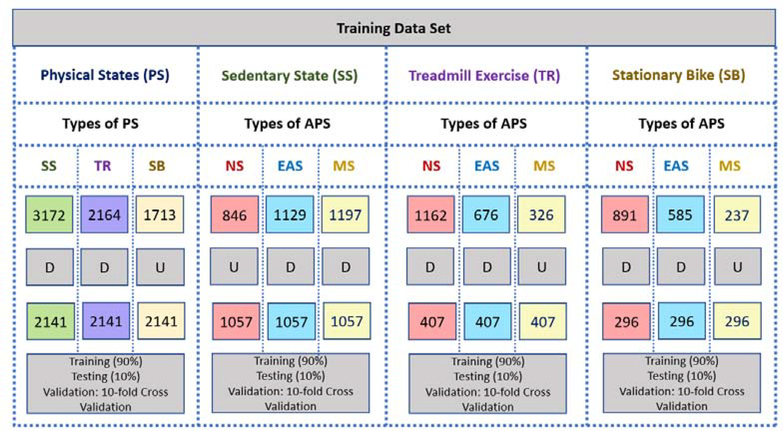
Due to the lack of physical exertion, the SS experiments are longer in duration than the other experiments, which causes an imbalance among the classes. Since imbalances in class sizes may result in bias and poor classification accuracy, a combination of up-sampling (Adaptive Synthetic Sampling (ADASYN) [52]) and down-sampling method are used. The impact of upsampling the minor class is reduced by simultaneously downsampling the major class by retaining the unique samples as determined by the similarity measure of k-means clustering. We also studied what effect different levels of upsampling the minor class has on the accuracy of the physical state and acute psychological stress classification results. The upsampling of the minor class by 10%, 25%, and 40%, is considered and the results for the testing data set are compared for the three different upsampling levels. We found that the highest accuracy is achieved with 25% upsampling of the minor class (Table 9). After balancing the data set, 2141 minutes of training data are obtained for each of the SS, TR, and SB activities. In addition, 1057 minutes of data are obtained for each of NS, EAS, and MS experiments during the SS, 407 minutes of data are obtained for each of NS, EAS, and MS experiments during SB exercise, and 296 minutes of data are obtained for NS, EAS, and MS experiments during TR exercise (Fig. 5). The final data set is divided into training data (90% of samples), and testing data (10% of samples), respectively, and 10-fold cross-validation is utilized for validation and hyperparameter optimization.
Table 9:
Testing Accuracy Comparison For Different Levels of Upsampling (Results are reported based on best algorithm for each cases)
| Maximum (%) | PS | APS-SS | APS-TR | APS-SB |
|---|---|---|---|---|
| Upsampling | ||||
| 10 | 99.6 (SVM) | 97.1 (LD) | 89.6 (SVM) | 88.1 (EL) |
| 25 | 99.1 (SVM) | 97.1 (LD) | 94.1 (SVM) | 84.5 (SVM) |
| 40 | 99.0 (SVM) | 97.3 (LD) | 92.5 (SVM) | 84.5 (EL) |
Figure 5:
Data Preparation and Separation (D: Downsampling with k-means Clustering, U: Upsampling with Adaptive Synthetic Sampling (ADASYN) (Maximum Upsampling Rate: 25%), NS: Non-Stress, EAS: Exciting-Anxiety Stress, MS: Mental Stress, SS: Sedentary State, TR: Treadmill, SB: Stationary Bike, PS: Physical State, APS: Acute Psychological Stress)
2.4. Feature Reduction
To mitigate the effects of over-fitting the models to redundant feature variables, feature reduction methods are used. We considered various features reduction approaches including forward/backward selection method. This method exhaustively searches the feature domain in an iterative procedure and is computationally intractable, especially with large data sets [53, 54]. Therefore the computational intractability of the forward/backward selection method precludes its use for this data set, though it will be studied in future work. Instead, we used the t-test statistic to find the set of feature variables that are significantly different for each class [55, 56]. Since the selected features through the use of the t-test statistic can still be a set of highly correlated feature variables, we reduce the dimensionality of the selected feature variables using principal components [57]. The details of feature selection and reduction are discussing in the following section.
We compute the p-values for the feature variables between pairs of PA classes and the feature variables are retained at a 1% confidence level, which yields 1750 retained features. All feature variables are found to be normally distributed, and outliers in the extracted feature variables are removed by retaining only the values that lie within the 1st and 99th percentiles for the distribution of the values. Some extracted features can be highly correlated, such as the median and the mean of HR, which can bias the training of the machine learning algorithms. Principal component analysis (PCA) is used to generate a reduced number of uncorrelated latent variables from the 1750 retained features [45, 57, 58]. After principal component analysis is used to reduce the dimension of the feature variables, we retain only the principal components for building the machine learning models for classification. The number of principal components to retain is determined through explicit enumeration by optimizing the classification accuracy using 10-fold cross-validation, and the number of retained components are varied between explaining 70% and 99% of the variance in the data set of feature variables. The number of principal components retained for training the physical state classification models to discriminate among SS, TR and SB exercises is 250 (90% variance explained), and the number of principal components retained for training the APS classification models during SS, TR and SB exercises are 300, 250 and 200, respectively, corresponding to 92%, 92%, and 95% is variances explained, respectively. The primary ACC features are not used for the classification among APS types because there is no rational link between APS and the ACC data. Secondary ACC features can be used to discriminate among APS types because the secondary features will capture an increase in a particular variable relative to the primary features of the ACC readings.
2.5. Machine Learning (ML) Algorithms
The normalized principal components are used with various ML algorithms, including k-nearest neighbors (k-NN), support vector machine (SVM), decision tree (DT), naive Bayes (NB), ensemble learning (EL), linear discriminant, (LD), and deep-learning (DL). The key features of these ML techniques are summarized in Appendix A. Four different ML-based classification models are developed, one for the classification of PA, and three for the classification of APS during SS, TR, SB classes (Figure 7). Each classification node has its own unique classification algorithm selected as the best performing algorithm from among the seven different algorithms that are evaluated as candidates for each classification task to select the best model based on validation data.
Figure 7:
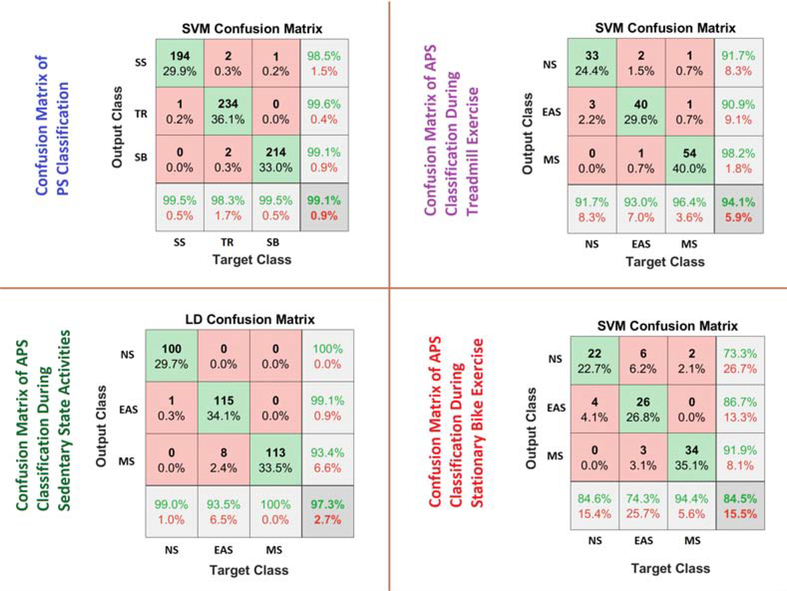
Confusion Matrices of PS and APS Classification Algorithms (10% Testing Data Set)
Bayesian optimization with expected improvement acquisition function is used to optimize the hyperparameters for each algorithm. Distance and number of neighbors (k-NN), Box-constraints and kernel scale (SVM), number of ensemble learning cycle, ensemble aggregation method, minimum leaf size and learning rate (EL), lambda and learner (LR), distribution and width (NB), minimum leaf size (DT) are optimized for 100 iterations with 10-fold cross-validation to achieve the minimum objective the value. Table 4 summarizes optimal hyperparameters of the selected best ML algorithms for each PS. The number of the hidden neurons, number of layers and structure of the DL algorithm are iteratively optimized based on accuracy improvements with the validation data set.
Table 4:
Hyperparameter (HP) Optimization (Opt. Value: Optimum Value, PS: Physical State, Const: Constraints, NL: Number of Learning, MLF: Minimum Leaf Size)
| PS | Best ML | HP-1 | Opt. Value | HP-2 | Opt. Value |
|---|---|---|---|---|---|
| All | SVM | Box Const. | 998.20 | Kernel-Scale | 44.43 |
| SS | LD | Delta | 0.0255 | Gamma | 0.4174 |
| TR | SVM | Box Const. | 109.80 | Kernel-Scale | 25.72 |
| SB | EL | NL | 304 | Learning-Rate | 0.99 |
| SB | EL | Method | Adaboost | MLF | 5 |
3. Results
3.1. Physical Activity Classification
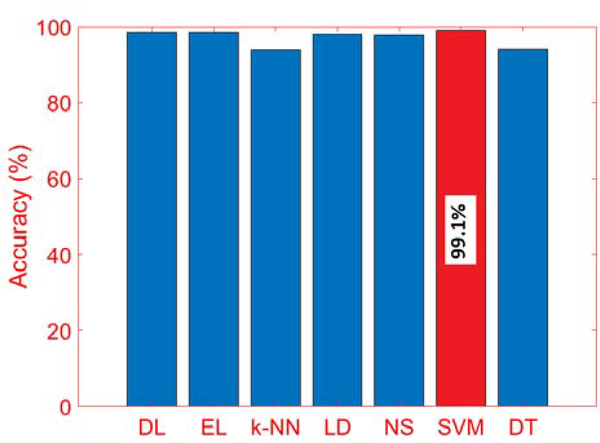
The testing data is evaluated with the various classification algorithms, and SVM performed slightly better than the other algorithms with more than 99% classification accuracy (Figs. 6 and 7). Achieving a high accuracy for PS classification is important because inaccuracies in PA classification can have an effect on APS detection.
Figure 6:
Comparison of Accuracy of PS Classification with Different Algorithms
The confusion matrix for the SVM algorithm (Fig. 7) shows that the TR exercise are classified with high accuracy (99.6%), while a few SS activities misclassified as SB exercise. The ACC readings can readily distinguish between TR and SB exercises, though a few subjects hold the handle-bar during the TR exercise, which causes the physiological variables during TR to resemble the SB and leads to misclassifications (1%).
Table 5 presents the results of recall, precision and F- score calculations for the PS classification algorithm. We presented only the most accurate three algorithms, which are SVM, EL, and LD, respectively. SVM performs slightly better with all indexes.
Table 5:
Recall, Precision and F-Score for PS Classification
| Algorithm | Recall | |||
| SS | SB | TR | Mean | |
| SVM | 0.986 | 0.974 | 0.986 | 0.982 |
| EL | 0.971 | 0.973 | 0.972 | 0.972 |
| LD | 0.970 | 0.948 | 0.966 | 0.961 |
| Algorithm | Precision | |||
| SS | SB | TR | Mean | |
| SVM | 0.984 | 0.995 | 0.990 | 0.990 |
| EL | 0.989 | 0.987 | 0.981 | 0.986 |
| LD | 0.989 | 0.987 | 0.963 | 0.980 |
| Algorithm | F-score | |||
| SS | SB | TR | Mean | |
| SVM | 0.988 | 0.982 | 0.988 | 0.986 |
| EL | 0.978 | 0.979 | 0.979 | 0.979 |
| LD | 0.975 | 0.963 | 0.973 | 0.970 |
3.2. Acute Psychological Stress Classification
The performance of the APS classification algorithm with the testing data is evaluated, and the APS classification during SS activities yields up to a 97.3% accuracy with LD algorithms, which is slightly better than other algorithms. The SVM algorithm performed well in APS classification for both the TR and SB exercises. The confusion matrix of the APS classification results during SS, TR, and SB activities are presented in Fig. 1, Fig. 7 and Fig. 9. Since the score scales and calculations are different for each ML algorithm, for providing consistent APS level estimation, SVM is chosen as the single algorithm to be used and, which yields 99.19% (PS classification), 94.07% (APS-SS), 94.17% (APS-TR), and 86.21% (APS-SB) accuracy.
Figure 9:
Classification of Different APS by Various ML Algorithms During Different Physical Activities
During SS activities, NS is distinguished from MS/EAS with up to a 100% accuracy. The MS detection achieves slightly lower accuracy with 93%. During TR exercise, all instances of NS inducement are accurately identified. The SVM algorithm is able to distinguish different types of APS with 84% accuracy during SB exercise. We calculate the commonly used performance metrics (recall, precision and F-score values) for the algorithms and various APS types (Table 6–8).
Table 6:
Recall for APS Classifications
| PS | Algorithm | Recall | |||
|---|---|---|---|---|---|
| NS | EAS | MS | Mean | ||
| SS | LD | 0.965 | 0.911 | 0.975 | 0.950 |
| SS | EL | 0.934 | 0.899 | 0.945 | 0.926 |
| SS | SVM | 0.962 | 0.908 | 0.963 | 0.944 |
| SB | EL | 0.618 | 0.558 | 0.814 | 0.663 |
| SB | LD | 0.706 | 0.575 | 0.841 | 0.707 |
| SB | SVM | 0.714 | 0.647 | 0.797 | 0.719 |
| TR | SVM | 0.858 | 0.871 | 0.903 | 0.877 |
| TR | EL | 0.702 | 0.777 | 0.888 | 0.789 |
| TR | LD | 0.884 | 0.831 | 0.919 | 0.878 |
Table 8:
F-Score for APS Classifications
| PS | Algorithm | F-Score | |||
|---|---|---|---|---|---|
| NS | EAS | MS | Mean | ||
| SS | LD | 0.974 | 0.953 | 0.964 | 0.963 |
| SS | EL | 0.973 | 0.966 | 0.974 | 0.971 |
| SS | SVM | 0.972 | 0.951 | 0.956 | 0.960 |
| SB | EL | 0.855 | 0.837 | 0.935 | 0.875 |
| SB | LD | 0.858 | 0.777 | 0.920 | 0.851 |
| SB | SVM | 0.858 | 0.777 | 0.920 | 0.851 |
| TR | SVM | 0.837 | 0.865 | 0.939 | 0.880 |
| TR | EL | 0.845 | 0.862 | 0.927 | 0.878 |
| TR | LD | 0.834 | 0.859 | 0.936 | 0.876 |
The normalized APS levels obtained are analyzed for nine different cases (Fig. 8), each of the three PA with each of the APS categories. NS, EAS, and MS categories are statistically evaluated using a two-way analysis of variance (ANOVA) and estimated APS level, and the classifications are found to be statistically significant (p-values < 0.05). Hence, the proposed approach has good potential to distinguish different types of PA and PA dependent various type of APS. Also testing data APS level values are analyzed with two-way ANOVA statistical test. Without exception, all levels for 9 different categories are found to be statistically different (p-value < 0.05).
Figure 8:
APS Level Estimation During Different Physical Activities
We compare the accuracies for each group with a two-way ANOVA. Excluding the SB-NS case (which has low accuracy), eight different groups of PS and APS are compared (SS-NS, SS-EAS, SS-MS, TR-NS, TR-EAS, TR-MS, SB-EAS, and SB-MS) and the p-values for PS, APS, and the interaction of PS and APS are 0.44, 0.30, and 0.78, respectively. We therefore conclude that the proposed approach has the potential to distinguish the different types of PA and for each of them different type of APS.
We validate the stress inducement with calculated STAI scores [35, 36]. Since the number of observations is not large enough, the outcome of the regular statistical comparison methods are significantly affected by outliers. To overcome this challenge, we decided to develop a robust linear regression model for statistical comparison. Robust models eliminate the effects of the outliers on the statistical outcomes [59]. We statistically compared the differences between the STAI-T questionnaire before stress inducement (STAI-Tbefore) and after stress inducement (STAI-Tafter) for APS-EAS and APS-NS experiments. We found that test scores are not statistically different (p-value: 0.56). In addition, we also compared differences between the STAI-S questionnaire before stress inducement (STAI-Sbefore) and after stress inducement (STAI-Safter) for APS-EAS and APS-NS experiments. We found that test scores are statistically different as a result of the developed robust linear regression model (p-value: 0.0007<0.05).
4. Discussion of the Results
APS detection is quite popular research interest. However the majority of the previous studies focus on APS detection only during SS activities. Since the the alterations of the significant biosensors measurements may present similar trend during PA and APS events, the distinguishing PA and PA depended APS is a challenging task and still unsolved. To achieve this, we present a multisensor fusion method to take into account the different physiological indicators simultaneously. In addition, we demonstrate a novel approach with two layer classification structure. The first layer classifies the PA of participants. The second layer, which is dependent to the first layer, classifies the APS type of subjects and estimates the level of APS. Therefore presented two layer based cascade approach allows to identify the types of PA and depend on APS level and type.
Data from nine experiments are used to test the algorithms developed. The nine experiments correspond to one from each of SS-NS, SS-EAS, SS-MS, TR-NS, TR-EAS, TR-MS, SB-NS, SB-EAS, and SB-MS. The data set is from subjects not included in the model development stage. Table 10 reports APS accuracy and APS level estimations. The algorithms report three stress scores each minute, which are normalized between [0–1]. All the APS instances are classified with 87.16% accuracy across all the experiments. Some categories such as NS during SS and MS inducement during SB exercise are classified with 100% accuracy. EAS inducement during TR exercise yields the lowest accuracy with 65.8%.
Table 10:
Results of APS Level Estimation and APS Accuracy Along All Separated Testing Experiments (Exp: Experiment, Avg: Average, NS: Non-Stress, MS: Mental Stress, EAS: Exciting-Anxiety Stress, SS: Sedentary State, SB: Stationary Bike, TR: Treadmill, Acc: Accuracy, Avg: Average, Minute: Min)
| Exp. Type | Acc. of APS (%) | Time (min) | Avg. of APS Level | p-value (Friedman Test) | ||
|---|---|---|---|---|---|---|
| NS | EAS | MS | ||||
| SS-NS | 100 | 32 | 0.867 | 0.559 | 0.293 | 4 * 10−12 |
| TR-NS | 93.5 | 31 | 0.709 | 0.388 | 0.408 | 9 * 10−8 |
| SB-NS | 76.9 | 65 | 0.802 | 0.634 | 0.199 | 8 * 10−15 |
| SS-EAS | 100 | 31 | 0.489 | 0.905 | 0.401 | 3 * 10−15 |
| TR-EAS | 65.8 | 41 | 0.256 | 0.378 | 0.289 | 0.03 |
| SB-EAS | 100 | 11 | 0.299 | 0.888 | 0.202 | 4 * 10−5 |
| SS-MS | 68.3 | 31 | 0.601 | 0.178 | 0.808 | 3 * 10−7 |
| TR-MS | 83.8 | 31 | 0.399 | 0.501 | 0.766 | 5 * 10−5 |
| SB-MS | 100 | 10 | 0.290 | 0.122 | 0.908 | 9 * 10−3 |
Fig. 8 illustrates APS level estimation during SS activities and TR/SB exercises. The presence of APS is accurately captured during the occurrence of various types of APS. The APS level is estimated in the presence of different PA and under various types of APS inducement.
The STAI-T score indicates the day-to-day anxiety level of participants rather than acute changes in stress or anxiety levels. Therefore, comparing STAI-S scores is appropriate to capture the influence of temporal changes due to particular stress inducement experiments. For this reason, differences in the scores of STAI-Sbefore and STAI-Safter questionnaires for APS-EAS and APS-NS experiments are compared. The analysis of the STAI-S scores demonstrate the experiments conducted produce a temporal impact on the APS level of the participants, while their general psychological stress characteristics remain steady.
The APS and PA inducement protocols authorized and approved by the Institutional Review Board (IRB) committee were employed in this work to avoid causing adverse effects or harms to the subjects. The IRB committee rightfully prioritizes the health and safety of subjects. Due to the limitations imposed by the IRB, we conducted experiments involving mild APS inducement techniques that assure and prioritize the safety of subjects, while inducing sufficient APS for the study.
The detection of either individual or concurrent instances of PA and/or APS is achieved using machine learning techniques and the large number of input feature variables is decreased to a lower number with dimension reduction techniques. Despite the promising results, the proposed methods are not based on a robust and optimal feature selection technique. The excessive computational load of the forward/backward feature selection method rendered such robust feature selection methods intractable for our use. Moreover, we have a cascaded classification problem, and each classification problem requires the selection of a subset of feature variables. All computations were conducted using a computer with a Intel Core i7 6500U processor, 32 GB 2400 MHz DDR4 memory, 2TB HD storage, and 4GB GDDR5 1392 MHz graphics card. We will consider implementing a robust and computationally tractable feature selection approach in future work using a server system and employing parallel processing techniques that effectively mitigate the excessive computational load of the robust forward/backward feature selection method.
A limitation of the current work is that the data collected is not sufficient to develop advanced deep learning models. More data is needed to appropriately train advanced deep learning models. Thus, we used traditional machine learning approaches, though future research will consider collecting additional data to develop and test the performance of deep-learning approaches.
The presented approach covers the common PA in daily life, though it is not exhaustive of all daily events. Accurate classification during all kinds of daily activities requires extending the presented approach to include other classification scenarios. In future work, we will employ the developed models with people with Type 1 diabetes to track the PA and APS trends. The algorithms developed in this work will enable the real-time assessment of the physical and psychological stressors experienced by people with Type 1 diabetes.
5. Conclusions
The simultaneous classification of APS during various PA presents a promising approach to monitor physical and acute psychological stresses throughout ambulatory conditions. This work compares several classification algorithms to evaluate their performance using a representative data set. The outcomes of the classifiers are useful for monitoring of people living with chronic conditions, such as cardiovascular complications or diabetes and enabling multivariable artificial pancreas development that can automatically mitigate the effects of physical activities and acute psychological stress on glucose levels.
Table 3:
Partially List of Informative Features (Std: Standard Deviation, V. Low: Very Low, Tr: Treadmill, Sta. Bike: Stationary Bike)
| Features for Different PS with Various APS Inducements |
| (Std of Processed BVP)/(Std of Norm of ACC (X-Y-Z)) |
| (Mean of Norm of ACC)/(3rd Quartile of Norm of ACC) |
| (Mean of HR)/(Mean of Norm of ACC (X-Y-Z)) |
| Number of local maximums of BVP Signal |
| Features for Sedentary State Experiments with APS Inducement |
| (Median of HR)/(Median of Norm of ACC (X-Y-Z)) |
| 1st Quartile of Heart Rate (HR) |
| Number of local maximums of Processed BVP Signal |
| (Max of V. Low Freq of GSR) - (Min of V. Low Freq of GSR) |
| Features for Different Types of APS Classification During Tr. Ex. |
| (Maximum of GSR)/(Mean of GSR) |
| Min. of Consecutive Differences of Local Max and Local Min of BVP |
| Zero Cross of BVP |
| (Std of ST)/(Std of GSR) |
| Features for Different Types of APS Classification During Sta. Bike |
| Standard Deviation (STD) of Processed Blood-Volume Pulse (BVP) |
| Band power of Skin Temperature (ST) |
| Energy response of Galvanic Skin Response (GSR) |
| Mean of ST |
Table 7:
Precision for APS Classifications
| PS | Algorithm | Precision | |||
|---|---|---|---|---|---|
| NS | EAS | MS | Mean | ||
| SS | LD | 0.927 | 0.990 | 0.966 | 0.961 |
| SS | EL | 0.987 | 0.980 | 0.944 | 0.971 |
| SS | SVM | 0.915 | 0.990 | 0.966 | 0.957 |
| SB | EL | 0.833 | 0.869 | 0.931 | 0.878 |
| SB | LD | 0.791 | 0.869 | 0.896 | 0.852 |
| SB | SVM | 0.791 | 0.869 | 0.896 | 0.852 |
| TR | SVM | 0.931 | 0.785 | 0.938 | 0.885 |
| TR | EL | 0.896 | 0.785 | 0.959 | 0.880 |
| TR | LD | 0.931 | 0.750 | 0.959 | 0.880 |
HIGHLIGHTS.
Algorithms are developed for detecting and discriminating acute psychological stress in the presence of concurrent physical activities.
Wristband biosignals are used for conducting the detection and discrimination under daily free-living.
Various classification algorithms are compared to simultaneously detect the physical activities (sedentary state, treadmill running, and stationary bike) and the type of psychological stress (non-stress state, mental stress, and emotional anxiety).
Accurate classification of concurrent physical activities (PA) and acute psychological stress (APS) is achieved with an overall classification accuracy of 96% for PA and 92% for APS.
Acknowledgments
Financial support from the NIH under the grants 1DP3DK101075 and 1DP3DK101077 and JDRF under grant 2-SRA-2017-506-M-B made possible through collaboration between the JDRF and The Leona M. and Harry B. Helmsley Charitable Trust is gratefully acknowledged.
Appendix A. Machine Learning Algorithms
Appendix A.1. k-Nearest Neighbors
The k-NN algorithm is a non-parametric classification algorithm that classifies the test data relative to the classes observed in the training samples. The test data sample is classified based on a majority vote of its neighbors, and the class label for the test data is assigned to the most common class amongst its k-nearest neighbors as defined by a distance function. In this work, the distance function and the number of nearest neighbors is optimized to maximize the classification accuracy, resulting in the optimal distance (Table 4) metric as the Spearman distance with two nearest neighbors considered. The Spearman distance, dij, between two samples xi and xj in an n-dimensional feature space is given by
| (A.1) |
The advantages of the k-NN algorithm are that the classes do not need to be linearly separable or unimodal distributed, and the learning process is simple. The disadvantages are that the time to find the nearest neighbors in a large data set may be excessive and the algorithm may be sensitive to noisy or uninformative feature variables.
Appendix A.2. Support Vector Machine
The SVM algorithm is based on statistical learning theory and the structural risk minimization principle and aims to determine an optimally separating hyperplane between classes. Given the class-labelled training data {xi, yi}, i ∈ {1,…,N}, where and y ∈ {+1,−1}n, the SVM classifier is determined as the solution of the following optimization problem
| (A.2) |
where the training data xi are mapped into a higher-dimensional space by the function φ(xi) and C > 0 is the parameter penalizing the error term. Moreover, K (xi, xj) = ϕ (xi)T ϕ (xi) is the kernel function for projecting the training data to a higher-dimensional space. In this work, the radial basis function is used for the kernel function
| (A.3) |
where γ is a kernel scale parameter. The solution to the optimization problem maximizes the margin, the distance between the separating hyperplane and instances of the training data on either side of the hyperplane. The SVM algorithm may require relatively more computational resources for the solution to the optimization problem, especially in large data sets with multiple classes. While conducting the classification in a higher-dimensional space improves performance even if the data are not linearly separable in the original feature space, the computational load may be a concern.
Appendix A.3. Decision Tree
A decision tree is comprised of nodes and connecting edges, with each node evaluating the predictive feature variable to make a decision. A decision tree may be generated by recursively partitioning the input data according to measure of impurity or node error. In this work, the Gini impurity of a node is used, given by
| (A.4) |
where J is the number of classes and pi is the fraction of samples in class i relative to the size of the data set. Partitions are generated in the feature space following an induction method as ai < s, with ai the value of feature variable for a sample and s is a cut-point. The cut-points are determined over the range of the feature variable such that a minimum weighted impurity is achieved, where the weights are given by the number of samples that lie in the branches following the split. The DT algorithm is easy to implement and can approximate complex decision boundaries by using a large enough decision tree, though large decision trees can cause over-fitting problems. Some over-fitting can be mitigated by pruning rules to reduce or eliminate branches.
Appendix A.4. Naive Bayes
The Bayes classifier uses the class posterior probabilities P (c | x) based on Bayes theorem
| (A.5) |
given the feature variables to make decisions, where c is the class label, x is the feature variables, and P (x) can be neglected as it is constant among classes. The Bayes classifier finds the maximum posterior probability (MAP) for the given features variables as
| (A.6) |
The estimation of the class-conditional probability distributions P (x | ci) may be challenging if the feature space is high-dimensional. Approximations are commonly used to imply that the feature variables are independent given the class, yielding the NB classifier as
| (A.7) |
The advantages of the NB algorithm are that it is easy to implement and has good computational efficiency, given the probabilities are well represented, though the estimations of the probability distributions may require large data sets. In this work, the class-conditional probabilities of distributions are assumed to be Gaussian and constant priors.
Appendix A.5. Ensemble Learning
The EL approach combines multiple base classifiers to obtain a final classification result, with each base classifier as any kind of classification algorithms such as DT, neural networks, or SVMs. Bootstrap aggregating, also known as bagging, involves each base classifier being trained on a subset of the training data set, with the training data for each base classifier sampled by bootstrap sampling. The classification of a test sample is obtained from a simple majority voting scheme. The boosting algorithm develops classifiers sequentially where the subsequent classifier assigns a higher weight to the errors of the preceding classifier. As the subsequent classifiers assign higher weights to the misclassified samples, a final classification is obtained from a weighted combination of the base classifiers. Three different weak learners are considered; decision tree, discriminant analysis (both linear and quadratic), and k-nearest neighbor classifier with three different methods; bagging, boosting, and subspace. Except for the subspace method, all boosting and bagging algorithms are based on tree learners. Subspace can use either discriminant analysis or k-nearest neighbor learners. Method and weak learners are considered as a hyperparameter (Table 4) of the EL model which is optimized with Bayesian optimization.
Appendix A.6. Linear Discriminant
The linear discriminant finds the projection matrix W that maximizes the ratio of between-class scatter to average within-class scatter in the lower-dimensional space. The matrix W is obtained as the solution to the optimization problem
| (A.8) |
where SB and SW are the between and within classes scatter matrices defined as
| (A.9) |
| (A.10) |
where is the overall mean of the data and μc is the mean of data within class c. The solution to the optimization problem can be obtained by eigenvalue decomposition. A limitation of the classical LD is that the within-class scatter matrix can be singular if the training sample size is small. Moreover, the algorithm does not perform well if the samples have heteroscedastic non-Gaussian distributions as it neglects boundaries among classes.
Appendix A.7. Deep Learning
A model comprising of a deep multilayer perceptron architecture can automatically learn complex functions that map the input feature space to output class labels. The DL model has multiple layers, where each layer maps its input to a hidden feature space, and the final output layer maps from the hidden space to the output class labels through a softmax function. The hidden layers map the inputs ui to the hidden feature space ti as ti = g(Wui +b), where W is a matrix of weights, b is a vector of offsets, and g (·) is a known activation function, typically considered as a rectified linear unit or sigmoid function. The softmax decoder maps the hidden representation to a set of positive numbers that sum to 1, which are considered as the class probabilities. The model parameters, including the neuron weight coefficients, are learned by minimizing a loss function representing the difference between true labels yi and predicted scores from the model f (xi) over the training data as
| (A.11) |
The training phase involves learning the model parameters (W, b) using stochastic gradient descent to minimize the loss function. During training, the samples are propagated forward through the network to generate output activations and the errors are backpropagated through the network to update the weights and offsets with adaptive moment estimation optimizer (ADAM). To avoid overfitting in the DL framework with numerous parameters, the dropout regularization technique is used to randomly zero the inputs to subsequent layers with a specified probability. The dropout layer regularizes the network and prevents overfitting, and is similar to the ensemble techniques, like bagging or model averaging. The structure of the DL model consists of the input layer, fully connected layer (7 hidden layers), dropout layer (50%), fully connected layer (5 hidden layers), softmax layer and classification layer, respectively. The ability of DL to handle large amounts of data and automatically extract important features and complex interactions is an advantage, though smaller data sets and suboptimal networks may degrade the parameter convergence and performance.
Appendix B. Details of PPG Signal Processing Approach
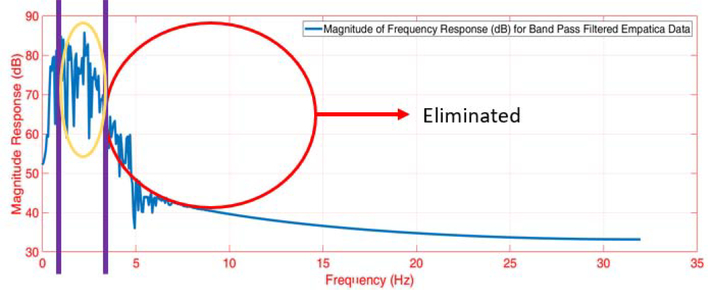
Since the photoplethysmography (PPG) technique that measures blood volume pulse (BVP) is highly susceptible to noise and motion artifacts, the PPG signal requires denoising and removal of motion artifacts. The motion artifacts are removed using an adaptive noise cancellation (ANC) approach that employs the reference accelerometer (ACC) data. In this work, we use three different signal processing techniques to obtain the denoised PPG signal from the raw PPG (Fig. B.10).
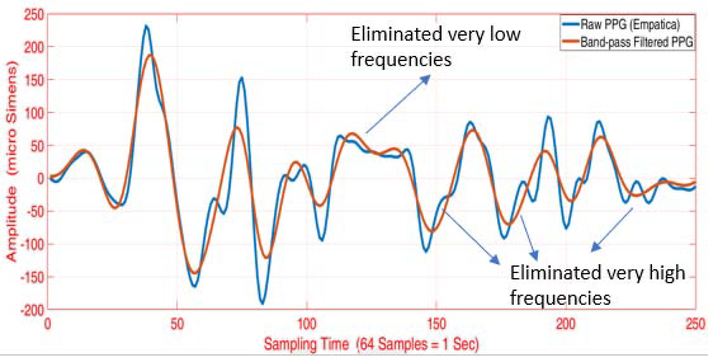
Both the raw ACC and PPG signals are normalized to lie within [−1,1] range. The ACC data (sampled at 32 Hz) is upsampled to obtain the same sampling frequency as the PPG data (64 Hz). By testing different delays in the measured signals, a 1-second time delay between the ACC and the PPG signals is found. A bandpass filter is applied to both the ACC and the PPG readings to retain frequencies within a physiologically plausible range. The heart rate (HR) typically varies between 30–210 BPM (0.5–3.5 Hz), and other studies also consider this range of allowable frequencies for the bandpass filter [60, 61]. Therefore, we also employed this allowable range of frequencies for the bandpass filter to denoise the ACC and PPG data. We considered different filtering methods such as the Butterworth, Chebyshev Type I/II, and Elliptic filters. Based on the performance, we settled on the 4th-order Butterworth bandpass filter with the specified cut-off frequencies. The bandpass filter yields a denoised signal that primarily retains the plausible HR frequencies within the allowable range. An example of the bandpass filtering result is illustrated in Figs. B.11, B.12 and B.13. Despite the bandpass filtering, motion artifacts may still affect the PPG data filtering because the frequencies of the motion artifacts may lie within the allowable frequency region of 0.5–3.5 Hz. Therefore, additional steps are required to remove the motion artifacts from the data.
Figure B.10:
Overview of PPG Signal Processing
Figure B.11:
Raw Data Frequency Domain Analysis
We utilize adaptive noise cancellation (ANC) to remove motion artifacts from the PPG signal [62, 63]. Several different algorithms are proposed for ANC, including recursive least squares filter and least mean squares filter.
Figure B.12:
Bandpass Filtered BVP Data Frequency Domain Analysis
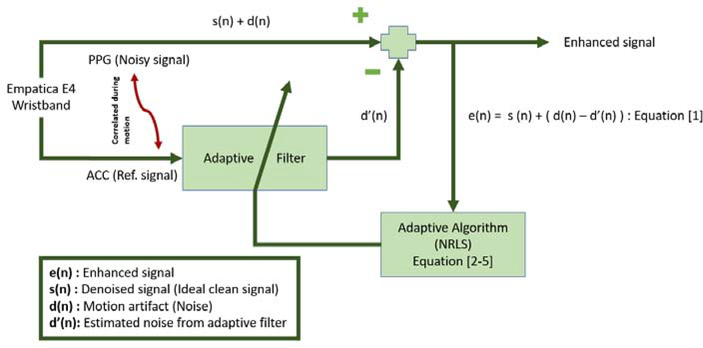
Nonlinear recursive least squares (NRLS) filters are used for ANC, with the PPG as the noisy signal requiring removal of motion artifacts that are correlated with the ACC data. The NRLS algorithm extends on the typical recursive least squares algorithm by using the Volterra series expansion to incorporate additional non-linear terms [63]. The nonlinearity between the PPG and ACC data is modeled using a second-order Volterra-series expansion. The parameters of the NRLS algorithm are the filter length (M) and the forgetting factor (λ), which are specified as 6 and 0.999, respectively. The algorithm is initialized by the initial covariance matrix (P) and initial weight vector (ω) as 1000×IM and [0, …, 0], respectively. The RLS algorithm is mathematically expressed as
| (B.1) |
| (B.2) |
| (B.3) |
| (B.4) |
where U denotes the accelerometer measurements, e(k) denotes the enhancement signal, s(k) is the ideal signal free of motion artifacts, d(k) denotes the unknown motion artifacts that are to be estimated and removed, and d′(k) is the estimate of the motion artifacts. The adaptive filter minimizes d(k)−d′(k) to obtain a signal as close as possible to s(k). Fig. B.14 illustrates the structure for ANC using the NRLS algorithm. The NRLS algorithm is applied three times in series for the X, Y and Z axis, resulting in the signal with significantly reduced motion artifacts.
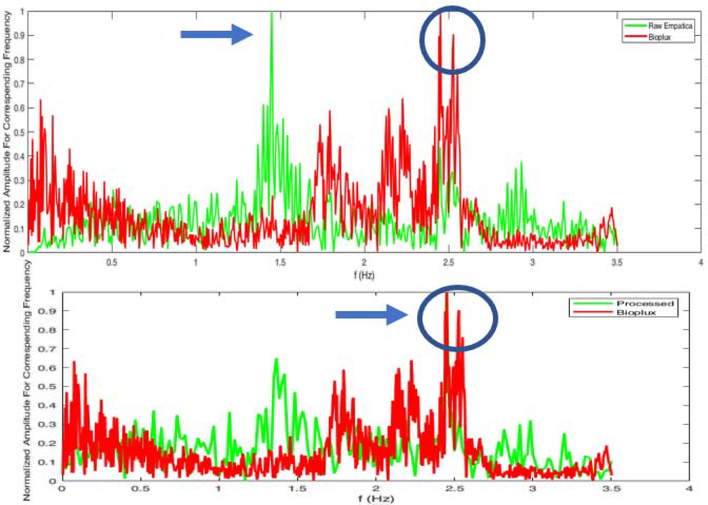
Figures B.15 and B.16 present additional examples of improvement in the BVP signal in the time and frequency domains.
The ANC approach works well when the motion artifacts are captured by the terms in the NRLS algorithm. Therefore, some motion artifacts and noise may still affect the signals after the bandpass filtering and ANC algorithms. Wavelet decomposition is used to further denosise the PPG data by dividing the original signal into different frequency components and discarding the components deemed to represent noise [61, 63, 64]. The Symlets 4 wavelet
Figure B.13:
Time Domain Analysis - After Bandpass Filter Design
Figure B.14:
Noise Cancellation with NRLS Adaptive Filter
Figure B.15:
Improvement in the BVP data from the proposed signal processing approach to remove noise and motion artifacts. (top: raw PPG data and the bioPlux data; bottom: processed PPG data and the bioPlus data)
function is used with 4 decomposition levels for denoising the PPG signal. The processed signal is compared to a ground-truth measurement to evaluate the efficiency of the denoising and motion artifact removal techniques. To obtain the ground-truth data, a limited number of experiments are conducted using the bioPLUX finger-tip PPG device that samples the PPG at a 1 kHz sampling frequency [65]. The bioPlux measurements are collected with subjects maintaining a stable hand and finger to avoid noise and motion artifacts from affecting the ground-truth measurements, while subjects simultaneously wore the Empatica E4 wristband during TR exercise on the other arm. The results of the signal processing algorithms are compared with the raw Empatica E4 BVP measurements, the processed Empatica E4 BVP measurements, and the bioPlux data as the ground-truth measurement. Figure 4 shows the improvement in the quality of the BVP signal due to the proposed signal processing method. It is readily observed that the filtering and artifact removal techniques enhance the signal quality.
Figure B.16:
Frequency domain analysis of the improvement in the BVP data from the proposed signal processing approach to remove noise and motion artifacts. (top: raw PPG data and the bioPlux data; bottom: processed PPG data and the bioPlus data)
Footnotes
Declaration of Competing Interest
The authors declare that they have no conflicts of interest.
Publisher's Disclaimer: This is a PDF file of an unedited manuscript that has been accepted for publication. As a service to our customers we are providing this early version of the manuscript. The manuscript will undergo copyediting, typesetting, and review of the resulting proof before it is published in its final form. Please note that during the production process errors may be discovered which could affect the content, and all legal disclaimers that apply to the journal pertain.
References
- [1].Sevil M, Hajizadeh I, Samadi S, Feng J, Lazaro C, Frantz N, Yu X, Brandt R, Maloney Z, Cinar A, Social and competition stress detection with wristband physiological signals, in: 2017 IEEE 14th International Conference on Wearable and Implantable Body Sensor Networks (BSN), IEEE, 2017, pp. 39–42. [Google Scholar]
- [2].NAKAYAMA T, OHNUKI Y, NIWA K.-i., Fall in skin temperature during exercise, The Japanese journal of physiology 27 (4) (1977) 423–437. [DOI] [PubMed] [Google Scholar]
- [3].Herborn KA, Graves JL, Jerem P, Evans NP, Nager R, McCafferty DJ, McKeegan DE, Skin temperature reveals the intensity of acute stress, Physiology & behavior 152 (2015) 225–230. [DOI] [PMC free article] [PubMed] [Google Scholar]
- [4].Sevil M, Rashid M, Maloney Z, Hajizadeh I, Samadi S, Askari MR, Hobbs N, Brandt R, Park M, Quinn L, et al. , Determining physical activity characteristics from wristband data for use in automated insulin delivery systems, IEEE Sensors Journal. [DOI] [PMC free article] [PubMed] [Google Scholar]
- [5].Turksoy K, Hajizadeh I, Samadi S, Feng J, Sevil M, Park M, Quinn L, Littlejohn E, Cinar A, Real-time insulin bolusing for unannounced meals with artificial pancreas, Control Engineering Practice 59 (2017) 159–164. [Google Scholar]
- [6].Hajizadeh I, Rashid M, Samadi S, Feng J, Sevil M, Hobbs N, Lazaro C, Maloney Z, Brandt R, Yu X, et al. , Adaptive and personalized plasma insulin concentration estimation for artificial pancreas systems, Journal of diabetes science and technology 12 (3) (2018) 639–649. [DOI] [PMC free article] [PubMed] [Google Scholar]
- [7].Hajizadeh I, Rashid M, Turksoy K, Samadi S, Feng J, Sevil M, Hobbs N, Lazaro C, Maloney Z, Littlejohn E, et al. , Incorporating unannounced meals and exercise in adaptive learning of personalized models for multivariable artificial pancreas systems, Journal of diabetes science and technology 12 (5) (2018) 953–966. [DOI] [PMC free article] [PubMed] [Google Scholar]
- [8].Sevil M, Rashid M, Hajizadeh I, Maloney Z, Samadi S, Askari MR, Brandt R, Hobbs N, Park M, Quinn L, et al. , Assessing the effects of stress response on glucose variations, in: 2019 IEEE 16th International Conference on Wearable and Implantable Body Sensor Networks (BSN), IEEE, 2019, pp. 1–4. [Google Scholar]
- [9].Garcia-Ceja E, Osmani V, Mayora O, Automatic stress detection in working environments from smartphones accelerometer data: a first step, IEEE journal of biomedical and health informatics 20 (4) (2015) 1053–1060. [DOI] [PubMed] [Google Scholar]
- [10].Sun F-T, Kuo C, Cheng H-T, Buthpitiya S, Collins P, Griss M, Activity-aware mental stress detection using physiological sensors, in: International conference on Mobile computing, applications, and services, Springer, 2010, pp. 282–301. [Google Scholar]
- [11].McCarthy C, Pradhan N, Redpath C, Adler A, Validation of the empatica e4 wristband, in: 2016 IEEE EMBS International Student Conference (ISC), IEEE, 2016, pp. 1–4. [Google Scholar]
- [12].Imboden MT, Nelson MB, Kaminsky LA, Montoye AH, Comparison of four fitbit and jawbone activity monitors with a research-grade actigraph accelerometer for estimating physical activity and energy expenditure, British Journal of Sports Medicine 52 (13) (2018) 844–850. [DOI] [PubMed] [Google Scholar]
- [13].Ollander S, Godin C, Campagne A, Charbonnier S, A comparison of wearable and stationary sensors for stress detection, in: 2016 IEEE International Conference on Systems, Man, and Cybernetics (SMC), IEEE, 2016, pp. 004362–004366. [Google Scholar]
- [14].Sandulescu V, Andrews S, Ellis D, Bellotto N, Mozos OM, Stress detection using wearable physiological sensors, in: International Work-Conference on the Interplay Between Natural and Artificial Computation, Springer, 2015, pp. 526–532. [Google Scholar]
- [15].Cvetković B, Gjoreski M, Šorn J, Maslov P, Kosiedowski M, Bogdański M, Stroiński A, Luštrek M, Real-time physical activity and mental stress management with a wristband and a smartphone, in: Proceedings of the 2017 ACM International Joint Conference on Pervasive and Ubiquitous Computing and Proceedings of the 2017 ACM International Symposium on Wearable Computers, 2017, pp. 225–228. [Google Scholar]
- [16].Can YS, Arnrich B, Ersoy C, Stress detection in daily life scenarios using smart phones and wearable sensors: A survey, Journal of biomedical informatics (2019) 103139. [DOI] [PubMed] [Google Scholar]
- [17].Minguillon J, Perez E, Lopez-Gordo MA, Pelayo F, Sanchez-Carrion MJ, Portable system for real-time detection of stress level, Sensors 18 (8) (2018) 2504. [DOI] [PMC free article] [PubMed] [Google Scholar]
- [18].Haak M, Bos S, Panic S, Rothkrantz L, Detecting stress using eye blinks and brain activity from eeg signals, Proceeding of the 1st driver car interaction and interface (DCII 2008) (2009) 35–60. [Google Scholar]
- [19].Cvetković B, Gjoreski M, Šorn J, Maslov P, Kosiedowski M, Bogdański M, Stroiński A, Luštrek M, Real-time physical activity and mental stress management with a wristband and a smartphone, in: Proceedings of the 2017 ACM International Joint Conference on Pervasive and Ubiquitous Computing and Proceedings of the 2017 ACM International Symposium on Wearable Computers, ACM, 2017, pp. 225–228. [Google Scholar]
- [20].Zhai J, Barreto A, Stress detection in computer users based on digital signal processing of noninvasive physiological variables, in: 2006 international conference of the IEEE engineering in medicine and biology society, IEEE, 2006, pp. 1355–1358. [DOI] [PubMed] [Google Scholar]
- [21].de Santos Sierra A, Ávila CS, Casanova JG, del Pozo GB, A stress-detection system based on physiological signals and fuzzy logic, IEEE Transactions on Industrial Electronics 58 (10) (2011) 4857–4865. [Google Scholar]
- [22].Kurniawan H, Maslov AV, Pechenizkiy M, Stress detection from speech and galvanic skin response signals, in: Proceedings of the 26th IEEE International Symposium on Computer-Based Medical Systems, IEEE, 2013, pp. 209–214. [Google Scholar]
- [23].Sanchez A, Vazquez C, Marker C, LeMoult J, Joormann J, Attentional disengagement predicts stress recovery in depression: An eye-tracking study., Journal of abnormal psychology 122 (2) (2013) 303. [DOI] [PubMed] [Google Scholar]
- [24].Schuller B, Rigoll G, Lang M, Hidden markov model-based speech emotion recognition, in: 2003 IEEE International Conference on Acoustics, Speech, and Signal Processing, 2003. Proceedings.(ICASSP’03), Vol. 2, IEEE, 2003, pp. II–1. [Google Scholar]
- [25].Hosseini SA, Khalilzadeh MA, Emotional stress recognition system using eeg and psychophysiological signals: Using new labelling process of eeg signals in emotional stress state, in: 2010 international conference on biomedical engineering and computer science, IEEE, 2010, pp. 1–6. [Google Scholar]
- [26].Rincon J, Julian V, Carrascosa C, Costa A, Novais P, Detecting emotions through non-invasive wearables, Logic Journal of the IGPL 26 (6) (2018) 605–617. [Google Scholar]
- [27].Zheng BS, Murugappan M, Yaacob S, Human emotional stress assessment through heart rate detection in a customized protocol experiment, in: 2012 IEEE Symposium on Industrial Electronics and Applications, IEEE, 2012, pp. 293–298. [Google Scholar]
- [28].Rincon JA, Costa Â, Novais P, Julian V, Carrascosa C, Using non-invasive wearables for detecting emotions with intelligent agents, in: International Joint Conference SOCO16-CISIS16-ICEUTE16, Springer, 2016, pp. 73–84. [Google Scholar]
- [29].Karthikeyan P, Murugappan M, Yaacob S, A review on stress inducement stimuli for assessing human stress using physiological signals, in: 2011 IEEE 7th International Colloquium on Signal Processing and its Applications, IEEE, 2011, pp. 420–425. [Google Scholar]
- [30].Matthews G, Dorn L, Hoyes TW, Davies DR, Glendon AI, Taylor RG, Driver stress and performance on a driving simulator, Human Factors 40 (1) (1998) 136–149. [DOI] [PubMed] [Google Scholar]
- [31].Shi Y, Nguyen MH, Blitz P, French B, Fisk S, De la Torre F, Smailagic A, Siewiorek DP, alAbsi M, Ertin E, et al. , Personalized stress detection from physiological measurements, in: International symposium on quality of life technology, 2010, pp. 28–29. [Google Scholar]
- [32].Rani P, Sims J, Brackin R, Sarkar N, Online stress detection using psychophysiological signals for implicit human-robot cooperation, Robotica 20 (6) (2002) 673–685. [Google Scholar]
- [33].de Santos Sierra A, Ávila CS, del Pozo GB, Casanova JG, Stress detection by means of stress physiological template, in: 2011 Third World Congress on Nature and Biologically Inspired Computing, IEEE, 2011, pp. 131–136. [Google Scholar]
- [34].Perez-Suarez I, Martin-Rincon M, Gonzalez-Henriquez JJ, Fezzardi C, Perez-Regalado S, Galvan-Alvarez V, Juan-Habib JW, Morales-Alamo D, Calbet JA, Accuracy and precision of the cosmed k5 portable analyser, Frontiers in physiology 9 (2018) 1764. [DOI] [PMC free article] [PubMed] [Google Scholar]
- [35].Marteau TM, Bekker H, The development of a six-item short-form of the state scale of the spielberger statetrait anxiety inventory (stai), British journal of clinical Psychology 31 (3) (1992) 301–306. [DOI] [PubMed] [Google Scholar]
- [36].Spielberger CD, Sydeman SJ, Owen AE, Marsh BJ, Measuring anxiety and anger with the State-Trait Anxiety Inventory (STAI) and the State-Trait Anger Expression Inventory (STAXI)., Lawrence Erlbaum Associates Publishers, 1999. [Google Scholar]
- [37].Spielberger CD, Reheiser EC, Measuring anxiety, anger, depression, and curiosity as emotional states and personality traits with the stai, staxi, and stpi, Comprehensive handbook of psychological assessment 2 (2003) 70–86. [Google Scholar]
- [38].Li Q, Chen X, Xu W, Noise reduction of accelerometer signal with singular value decomposition and Savitzky-Golay filter, Journal of Information & Computational Science 10 (15) (2013) 4783–4793. [Google Scholar]
- [39].Mohammad Y, Nishida T, Using physiological signals to detect natural interactive behavior, Applied Intelligence 33 (1) (2010) 79–92. [Google Scholar]
- [40].Sevil M, Hajizadeh I, Samadi S, Feng J, Lazaro C, Frantz N, Yu X, Brandt R, Maloney Z, Cinar A, Social and competition stress detection with wristband physiological signals, in: 2017 IEEE 14th International Conference on Wearable and Implantable Body Sensor Networks (BSN), IEEE, 2017, pp. 39–42. [Google Scholar]
- [41].Zhang Z, Photoplethysmography-based heart rate monitoring in physical activities via joint sparse spectrum reconstruction, IEEE transactions on biomedical engineering 62 (8) (2015) 1902–1910. [DOI] [PubMed] [Google Scholar]
- [42].Zhang Z, Pi Z, Liu B, Troika: A general framework for heart rate monitoring using wrist-type photoplethysmographic signals during intensive physical exercise, IEEE Transactions on biomedical engineering 62 (2) (2014) 522–531. [DOI] [PubMed] [Google Scholar]
- [43].Askari MR, Rashid M, Sevil M, Hajizadeh I, Brandt R, Samadi S, Cinar A, Artifact removal from data generated by nonlinear systems: Heart rate estimation from blood volume pulse signal, Industrial & Engineering Chemistry Research. [Google Scholar]
- [44].Sevil M, Rashid M, Askari R, Mohammad S, Samadi I, Hajizadeh A Cinar, Psychological stress detection using photoplethysmography, in: 2019 IEEE EMBS International Conference on Biomedical & Health Informatics, IEEE, 2019, pp. 1–4. [Google Scholar]
- [45].Zhou G, Hansen JH, Kaiser JF, Nonlinear feature based classification of speech under stress, IEEE Transactions on speech and audio processing 9 (3) (2001) 201–216. [Google Scholar]
- [46].Mannini A, Sabatini AM, Machine learning methods for classifying human physical activity from on-body accelerometers, Sensors 10 (2) (2010) 1154–1175. [DOI] [PMC free article] [PubMed] [Google Scholar]
- [47].San-Segundo R, Montero JM, Barra-Chicote R, Fernández F, Pardo JM, Feature extraction from smartphone inertial signals for human activity segmentation, Signal Processing 120 (2016) 359–372. [Google Scholar]
- [48].Bornoiu I-V, Grigore O, A study about feature extraction for stress detection, in: 2013 8th International Symposium on Advanced Topics in Electrical Engineering (ATEE), IEEE, 2013, pp. 1–4. [Google Scholar]
- [49].Seoane F, Mohino-Herranz I, Ferreira J, Alvarez L, Buendia R, Ayllón D, Llerena C, Gil-Pita R, Wearable biomedical measurement systems for assessment of mental stress of combatants in real time, Sensors 14 (4) (2014) 7120–7141. [DOI] [PMC free article] [PubMed] [Google Scholar]
- [50].Bastos-Filho TF, Ferreira A, Atencio AC, Arjunan S, Kumar D, Evaluation of feature extraction techniques in emotional state recognition, in: 2012 4th International conference on intelligent human computer interaction (IHCI), IEEE, 2012, pp. 1–6. [Google Scholar]
- [51].Trost SG, Wong W-K, Pfeiffer KA, Zheng Y, Artificial neural networks to predict activity type and energy expenditure in youth, Medicine and science in sports and exercise 44 (9) (2012) 1801. [DOI] [PMC free article] [PubMed] [Google Scholar]
- [52].He H, Bai Y, Garcia EA, Li S, Adasyn: Adaptive synthetic sampling approach for imbalanced learning, in: 2008 IEEE International Joint Conference on Neural Networks (IEEE World Congress on Computational Intelligence), IEEE, 2008, pp. 1322–1328. [Google Scholar]
- [53].Ververidis D, Kotropoulos C, Sequential forward feature selection with low computational cost, in: 2005 13th European Signal Processing Conference, IEEE, 2005, pp. 1–4. [Google Scholar]
- [54].Guyon I, Elisseeff A, An introduction to variable and feature selection, Journal of machine learning research 3 (March) (2003) 1157–1182. [Google Scholar]
- [55].Zhou N, Wang L, A modified t-test feature selection method and its application on the hapmap genotype data, Genomics, proteomics & bioinformatics 5 (3–4) (2007) 242–249. [DOI] [PMC free article] [PubMed] [Google Scholar]
- [56].Wang D, Zhang H, Liu R, Lv W, Wang D, t-test feature selection approach based on term frequency for text categorization, Pattern Recognition Letters 45 (2014) 1–10. [Google Scholar]
- [57].Jolliffe IT, Cadima J, Principal component analysis: a review and recent developments, Philosophical Transactions of the Royal Society A: Mathematical, Physical and Engineering Sciences 374 (2065) (2016) 20150202. [DOI] [PMC free article] [PubMed] [Google Scholar]
- [58].Al Shalabi L, Shaaban Z, Normalization as a preprocessing engine for data mining and the approach of preference matrix, in: 2006 International Conference on Dependability of Computer Systems, IEEE, 2006, pp. 207–214. [Google Scholar]
- [59].Müller S, Welsh A, Outlier robust model selection in linear regression, Journal of the American Statistical Association 100 (472) (2005) 1297–1310. [Google Scholar]
- [60].Temko A, Accurate heart rate monitoring during physical exercises using ppg, IEEE Transactions on Biomedical Engineering 64 (9) (2017) 2016–2024. [DOI] [PubMed] [Google Scholar]
- [61].Biswas D, Simões-Capela N, Van Hoof C, Van Helleputte N, Heart rate estimation from wrist-worn photoplethysmography: A review, IEEE Sensors Journal 19 (16) (2019) 6560–6570. [Google Scholar]
- [62].Chowdhury SS, Hyder R, Hafiz MSB, Haque MA, Real-time robust heart rate estimation from wrist-type ppg signals using multiple reference adaptive noise cancellation, IEEE journal of biomedical and health informatics 22 (2) (2016) 450–459. [DOI] [PubMed] [Google Scholar]
- [63].Ye Y, Cheng Y, He W, Hou M, Zhang Z, Combining nonlinear adaptive filtering and signal decomposition for motion artifact removal in wearable photoplethysmography, IEEE Sensors Journal 16 (19) (2016) 7133–7141. [Google Scholar]
- [64].Joseph G, Joseph A, Titus G, Thomas RM, Jose D, Photoplethysmogram (ppg) signal analysis and wavelet de-noising, in: 2014 Annual International Conference on Emerging Research Areas: Magnetics, Machines and Drives (AICERA/iCMMD), IEEE, 2014, pp. 1–5. [Google Scholar]
- [65].Bioplux Device, https://www.biosignalsplux.com/index.php/bvp-blood-volume-pulse, Accessed: 2020-06-16.


