

Abstract
Transient angiotensin-converting enzyme (ACE) inhibition in spontaneously hypertensive rats (SHR) is known to protect against future injury-induced cardiac inflammation, fibrosis, and dysfunction; however, the mechanisms of protection have not been delineated. Here, we used single cell RNA sequencing (scRNA-Seq) to test the hypothesis that transient ACE inhibitor treatment would induce a persistent shift in cardiac fibroblast subpopulations. Adult male SHRs (11 weeks old, hypertensive with cardiac hypertrophy) were treated for two weeks with an ACE inhibitor, Enalapril (30mg/kg/day, p.o.), or water (untreated SHR) followed by a 2-week washout period (n=7/group). Cardiac fibroblasts were isolated from the left ventricle and subjected to scRNA-Seq. Nine clusters of fibroblasts were identified, with 98% of cells in clusters 0–6. The transient treatment produced significant changes both within and across clusters. Cluster 1 depicted a highly fibrogenic gene profile, with cluster 6 serving as a gateway to cluster 1. Transient inhibition depleted the gateway and expanded cluster 0, which was the least fibrogenic profile. Moreover, within cluster 1 fibroblasts, ACE inhibition reduced expression of individual fibrosis genes (e.g., COL1A1, COL3A1, and FN1; all p<1×10⁻³⁵). Clusters 2–5 reflected proliferative, moderately fibrogenic, translationally active, and less inflammatory subsets of fibroblasts, all of which exhibited attenuated fibrogenic gene expression after transient ACE inhibition. In conclusion, transient ACE inhibition shifts cardiac fibroblast subpopulations and degree of activation resulting in an overall reduced fibrogenic phenotype.
Keywords: cardiac fibroblast, hypertension, single cell RNA-Seq, extracellular matrix, ACE inhibitor
Graphical Abstract
Summary
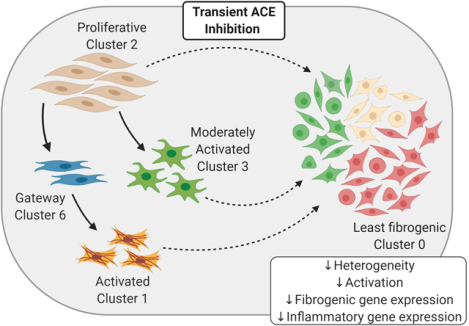
Cardiac fibroblasts isolated from the hypertensive rat heart cluster into distinct subpopulations of varying degrees of activation status. Prior treatment with an ACE inhibitor shifts the composition of these subsets, altering the trajectory of cells in favor of a more homogenous homeostatic pool of fibroblasts. The gateway to activation is depleted, and the expression of genes associated with wound healing is reduced. The cellular memory of cardiac fibroblasts from previously treated rats provides a mechanism for the attenuation of future adverse cardiac remodeling.
Introduction:
Heart failure secondary to hypertension is attributed to adverse cardiac remodeling orchestrated, in part, by cardiac fibroblasts1,2. Inhibition of the renin-angiotensin system (RAS) with angiotensin converting enzyme (ACE) inhibitors reduces mean arterial pressure, both in humans3 and animal models4. ACE inhibition also reduces pressure overload-induced inflammation and fibrosis in the left ventricle (LV)5–7. We have shown cardioprotection afforded by ACE inhibitors persists long after stopping treatment. ACE inhibition in adult spontaneously hypertensive rats (SHR) for two weeks, followed by a two-week washout period, protects against future injury by nitric oxide synthase (NOS) inhibition. Protection includes reduced macrophage infiltration, attenuation of pathologic cardiac remodeling, and preservation of cardiac function8–10.
Cardiac fibroblasts isolated from rats transiently treated with an ACE inhibitor before NOS inhibition revealed reduced chemokine production, proliferation rate, and collagen gene expression compared to fibroblasts from L-NAME treated naïve (i.e., no prior ACE inhibition) rats11. While the observation of fibroblast-mediated cardioprotection afforded by ACE inhibitors has been validated, the mechanisms whereby the protection occurs have not been elucidated. How ACE inhibition changes the fibroblast landscape on an individual cell basis has not been explored. Increasing our understanding of cardiac fibroblast genotype and phenotype in the hypertensive heart may help identify novel therapeutic targets that work to reduce inflammation and excess extracellular matrix (ECM) critical for treatment and preventions of heart failure.
Single cell RNA sequencing (scRNA-seq) can be used to classify the heterogeneity of cells in the heart that collectively comprise the cardiac cellulome12. A similar approach has uncovered multiple cardiac fibroblast subpopulations in models of cardiac stress13–15, which likely reflect altered functional states (i.e. homeostatic, proliferative, inflammatory, and activated) influenced by the microenvironment. With evidence of distinct cardiac fibroblast subpopulations coming to light, the identity and function of these subsets, particularly in response to pressure overload and treatment for pressure overload, are understudied. Gaining an understanding of cardiac fibroblast gene expression profiles in the hypertensive heart and the alterations that influence them may reveal novel therapueutic targets to reduce heart failure mortality. As cardiac fibroblasts are much more dynamic than previously thought, we sought to determine the genomic underpinnings by which prior ACE inhibitor treatment reduces fibrogenic capacity11. We hypothesized that transient ACE inhibitor treatment would induce a persistent shift in hypertensive cardiac fibroblast subpopulations.
Methods:
All sequencing data have been made publicly available in GEO and can be accessed at https://www.ncbi.nlm.nih.gov/geo/query/acc.cgi?acc=GSE155699. Additonal data and materials are available from the corresponding author upon reasonable request. An expanded methods section is available in the online Data Supplement.
Animals and Treatments:
All procedures were approved by the University of Arizona Institutional Animal Care and Use Committee. All animals used in this study were cared for in accordance with recommendations in the National Institutes of Health Guide for the Care and Use of Laboratory Animals (Eighth edition, revised 2011)16. Adult (11-week-old) male SHRs were divided into two treatment groups: untreated (water, n=7) and ACE inhibitor (enalapril, n=7). At this age, SHRs are hypertensive and exhibit left ventricular hypertrophy compared to normotensive Wistar and Wistar-Kyoto rats and are a well-accepted model of primary (essential) hypertension17,18. An advantage of the SHR model is that the phenotype is more similar to the majority of individuals with hypertension who go on to experience cardiac events. At 11 weeks of age, the rats have had established hypertension for more than 7 weeks, as well as left ventricular hypertrophy, without extensive interstitial fibrosis. Using SHR at this age allows us to identify the degree to which an intervention would alter future susceptibility to fibrosis. ACE inhibitor rats were treated for 2 weeks with enalapril (30 mg/kg/day p.o.) followed by a 2-week washout period8,10. At 15 weeks of age, cardiac fibroblasts were isolated from the LV.
Cardiac Fibroblast Isolation:
Cardiac fibroblasts were isolated from the LV of untreated (n =7) and ACE inhibitor (n=7) rats, as previously described11. As our long-term goal is to evaluate cardiac fibrosis, we cast a wide net to capture adherent collagen-producing cells from the left ventricle. We defined a cardiac fibroblast as any cell in the heterogeneous population of stromal cells that synthesizes ECM and was Col1a1+/CD45-/CD68-/CD31-19. Cells were cultured in 15% fetal bovine serum on plastic tissue culture dishes for three days. Passage 0 cardiac fibroblasts were used for evaluation.
Single Cell RNA-Seq (scRNA-seq):
Single-cell suspensions from each individual rat were processed by the Chromium Controller using single Cell 3’ Reagent Kit v3 (10x Genomics). Single cell libraries were sequenced in parallel with 254 bp paired-end reads with Illumina HiSeq4000.
Statistics:
Raw single-cell sequencing data were demultiplexed, and QC reports were generated using Cell Ranger (v3.0.2, 10X Genomics). RStudio (v1.3.1056)20, R (v3.5.3)21, and the Seurat package (v3.1.0)22 were used for downstream analyses. Genes with a statistically significant fold change (p<0.05) after FWER adjustment were considered differentially expressed. Pseudotime trajectory analysis was performed using the Monocle 3 package (v0.1.3)23. Gene lists were uploaded into David Bioinformatics Database24,25, and the functional annotation tool was used to identify relevant pathways to cardiac remodeling (GO Biological Functions). For LV mass and cell proportion data, the strength and direction of their linear relationship (combined or split by group; untreated and ACE inhibitor) were evaluated via the Pearson correlation coefficient. Between-group effects were evaluated using the Student’s t-test. Data were expressed as the mean ± standard error of the mean (SEM), and statistical significance was set at p<0.05. All traditional analyses were performed using Prism (v8.0.2, GraphPad).
Results:
There were nine cardiac fibroblast subpopulations in the hypertensive LV.
Two weeks after stopping ACE inhibitor treatment, the LV mass relative to body weight was significantly lower than that of untreated SHR (ACE inhibitor 2.44±0.04 g/kg, Untreated: 2.73±0.06, p=0.002). Cardiac fibroblasts were isolated from the LV, analyzed for gene expression by scRNA-seq, and individually annotated by their unique gene profiles, thereby establishing the distinct subpopulations. Nine distinct clusters (numbered 0–8) were identified from 28,977 total cardiac fibroblasts averaging 1,851±251 cells per untreated LV and 2,288±164 cells per ACE inhibitor-treated LV (p=0.17) (Figure 1A). These patterns were consistent with nine cardiac fibroblast clusters previously identified in AngII-infused mice by scRNA-seq15. The majority (98%) of the fibroblasts clustered into subsets 0–6, and thus subsequent analyses focused on these clusters.
Figure 1.
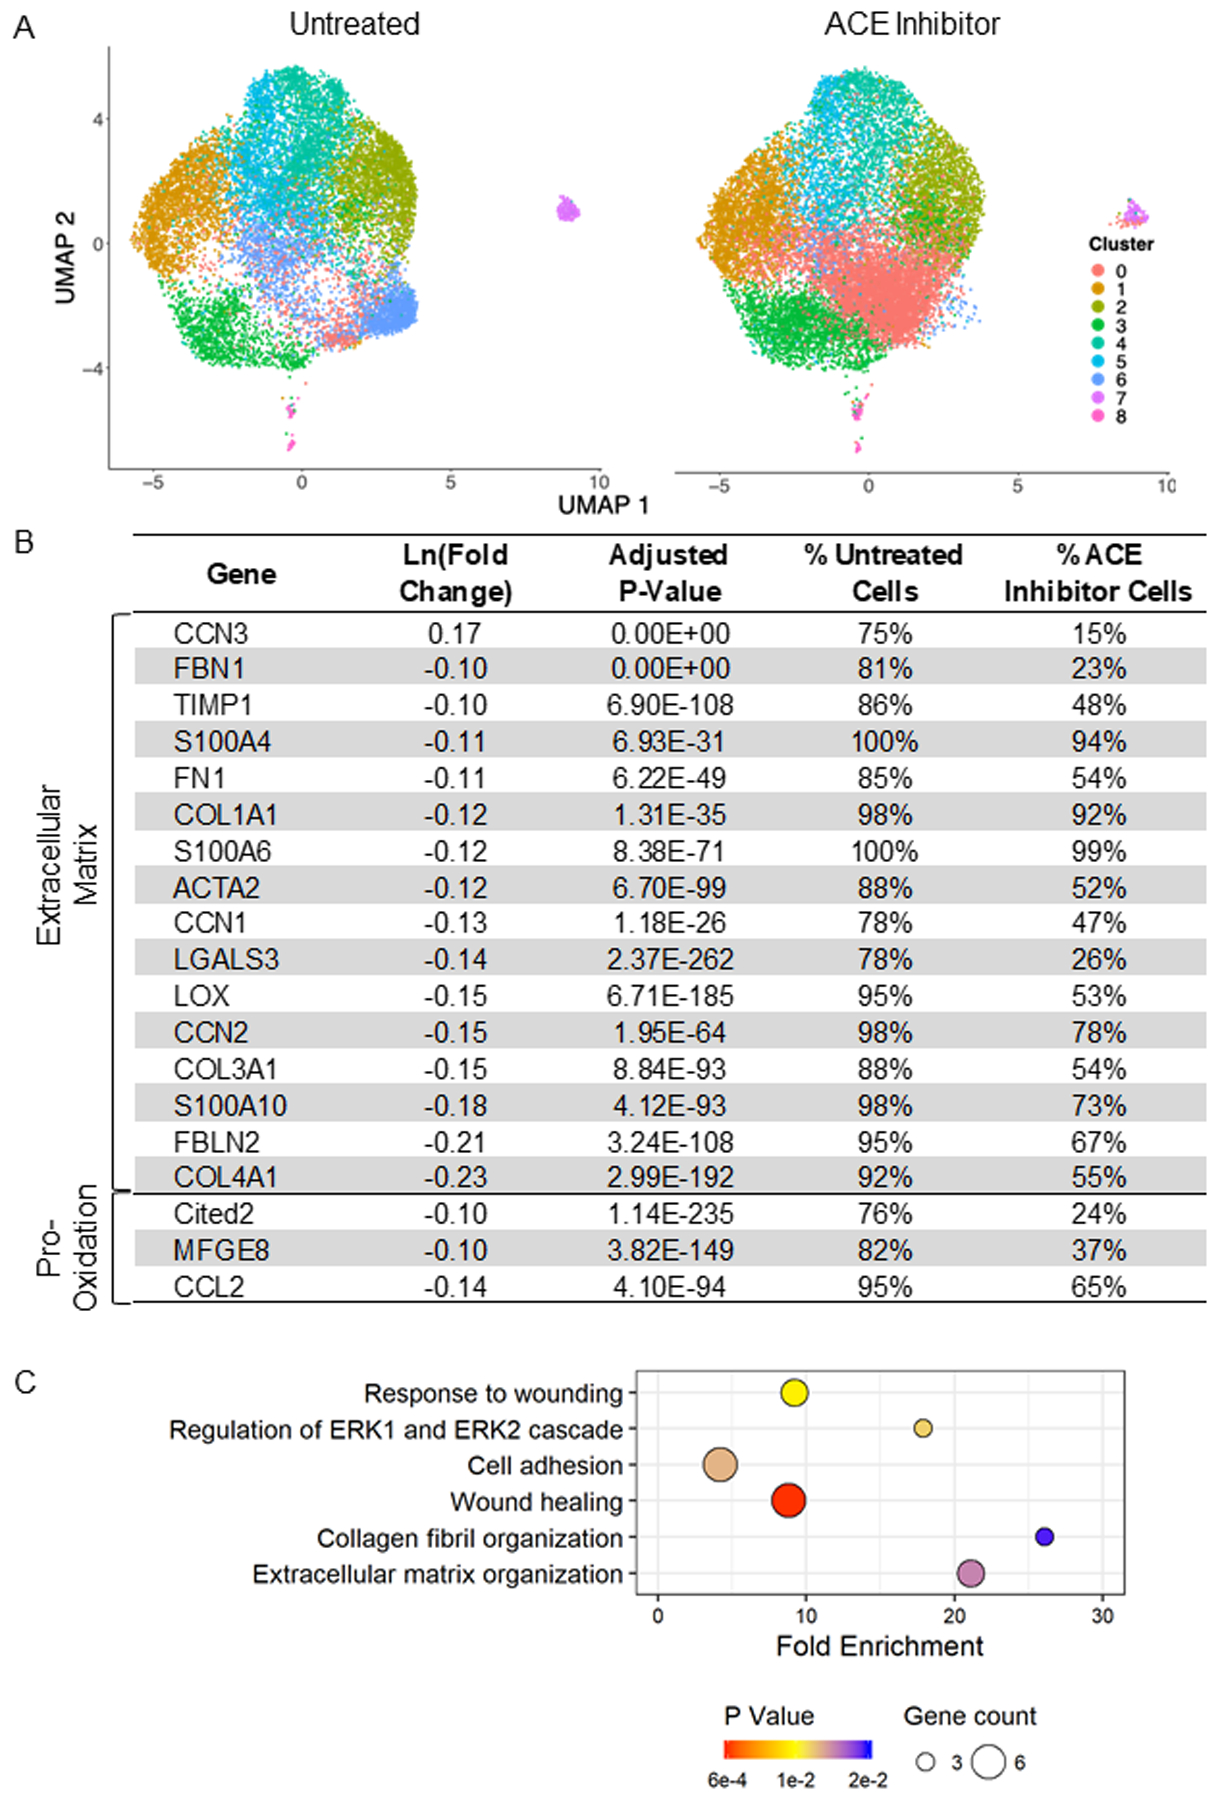
Cardiac fibroblasts from the hypertensive heart cluster into nine distinct subpopulations (numbered 0–8). Transient angiotensin converting enzyme (ACE) inhibitor treatment results in significant downregulation of genes related to fibrosis (i.e., extracellular matrix (ECM) and inflammation). A) Uniform manifold approximation and projection (UMAP) analysis reveals the relative clustering of fibroblasts from untreated and ACE inhibitor-treated rats; n=7/group. B) Differential expression of select genes associated with fibrosis that are impacted by ACE inhibition. Percentages represent the proportion of all untreated and all ACE inhibitor cells in which these genes were detected. C) Related GoTerm biological processes involved in fibrosis that are impacted by transient ACE inhibition. Bubble size represents the number of affected genes in the pathway, and color represents the p-value.
Persistent impact of transient ACE inhibition
Transient ACE inhibition produced persistent changes in the cluster composition and genome of the cardiac fibroblasts. The impact of treatment was initially examined with UMAP analysis (Figure 1A), where there was an expansion of cluster 0 and depletion of cluster 6, indicating subpopulation shift. Overall, there were 117 genes differentially expressed by transient ACE inhibitor treatment when compared to untreated SHR. Of these, 115 (97%) genes were downregulated. The differentially expressed genes and pathways highlighted key impacts of treatment on pathways, including wound healing, cell adhesion, and ECM organization (Figure 1B and 1C). Genes encoding ECM components (COL1A1, COL3A1, FN1, FBLN2, TIMP1), markers of fibroblast activation (ACTA2, LGALS3, S100A4, CCN1, CCN2), and inflammatory mediators (CCL2, CITED2) were all significantly downregulated in cells from treated SHR. In addition to a reduction in expression, these genes were detected in a lower percentage of cells from ACE inhibitor-treated compared to untreated SHR. Aside from the significant alterations that would impact fibrosis, groups of genes associated with biological processes of RNA processing and protein translation were also reduced with treatment (Supplementary File).
Cluster Identification
Differential expression analysis was performed to identify uniquely expressed genes within each cluster, comparing each cluster to all others. The gene profiles of each cluster allowed for the identification of unique phenotypes, which were supported by the top five upregulated and downregulated genes by fold change for clusters 0–6 (Table 1). A heat map of the relative expression for select genes encoding for ECM, matricellular proteins, oxidative stress, and proliferation in clusters 0 through 6 and the associated pathways are displayed in Figure 2B and 2C.
Table 1.
Top five highest and lowest expressed genes by fold change in clusters 0–6.
| Cluster 0: Least fibrogenic, Homeostatic | Highest | ||||
| Adj P-Val | |||||
| Lowest | |||||
| Adj P-Val | 3.5E-130 | 1.3E-274 | 5.4E-182 | 7.2E-195 | 3.5E-225 |
| Cluster 1: Pro-inflammatory, Activated | Highest | ||||
| Adj P-Val | 0.0E+00 | 0.0E+00 | 8.8E-237 | 7.7E-124 | 1.1E-218 |
| Lowest | |||||
| Adj P-Val | 2.9E-88 | 6.0E-256 | 9.3E-211 | 4.3E-123 | 4.2E-170 |
| Cluster 2: Proliferative | Highest | ||||
| Adj P-Val | 0.0E+00 | 0.0E+00 | 1.5E-279 | 0.0E+00 | 5.4E-161 |
| Lowest | |||||
| Adj P-Val | 2.7E-23 | 7.6E-67 | 5.7E-25 | 4.3E-60 | 1.2E-05 |
| Cluster 3: Moderately fibrogenic, Inflammation Suppressing | Highest | ||||
| Adj P-Val | 1.3E-166 | 5.2E-145 | 5.6E-36 | 7.2E-56 | 1.7E-80 |
| Lowest | |||||
| Adj P-Val | 0.0E+00 | 2.3E-60 | 1.3E-132 | 6.9E-235 | 2.5E-241 |
| Cluster 4: Translationally active | Highest | ||||
| Adj P-Val | 1.2E-224 | 4.6E-201 | 6.3E-175 | 7.4E-154 | 8.5E-192 |
| Lowest | |||||
| Adj P-Val | 4.4E-50 | 8.5E-22 | 9.0E-91 | 8.9E-59 | 2.0E-66 |
| Cluster 5: Low Inflammation | Highest | ||||
| Adj P-Val | 0.0E+00 | 0.0E+00 | 3.4E-274 | 3.9E-228 | 1.0E-109 |
| Lowest | |||||
| Adj P-Val | 3.9E-22 | 3.0E-14 | 2.2E-97 | 9.5E-16 | 1.5E-44 |
| Cluster 6: Mildly fibrogenic, “Gateway” | Highest | ||||
| Adj P-Val | 9.9E-190 | 2.9E-41 | 2.9E-171 | 1.7E-37 | 5.5E-38 |
| Lowest | |||||
| Adj P-Val | 4.0E-70 | 6.2E-30 | 1.2E-43 | 1.3E-114 | 1.0E-243 |
Figure 2.
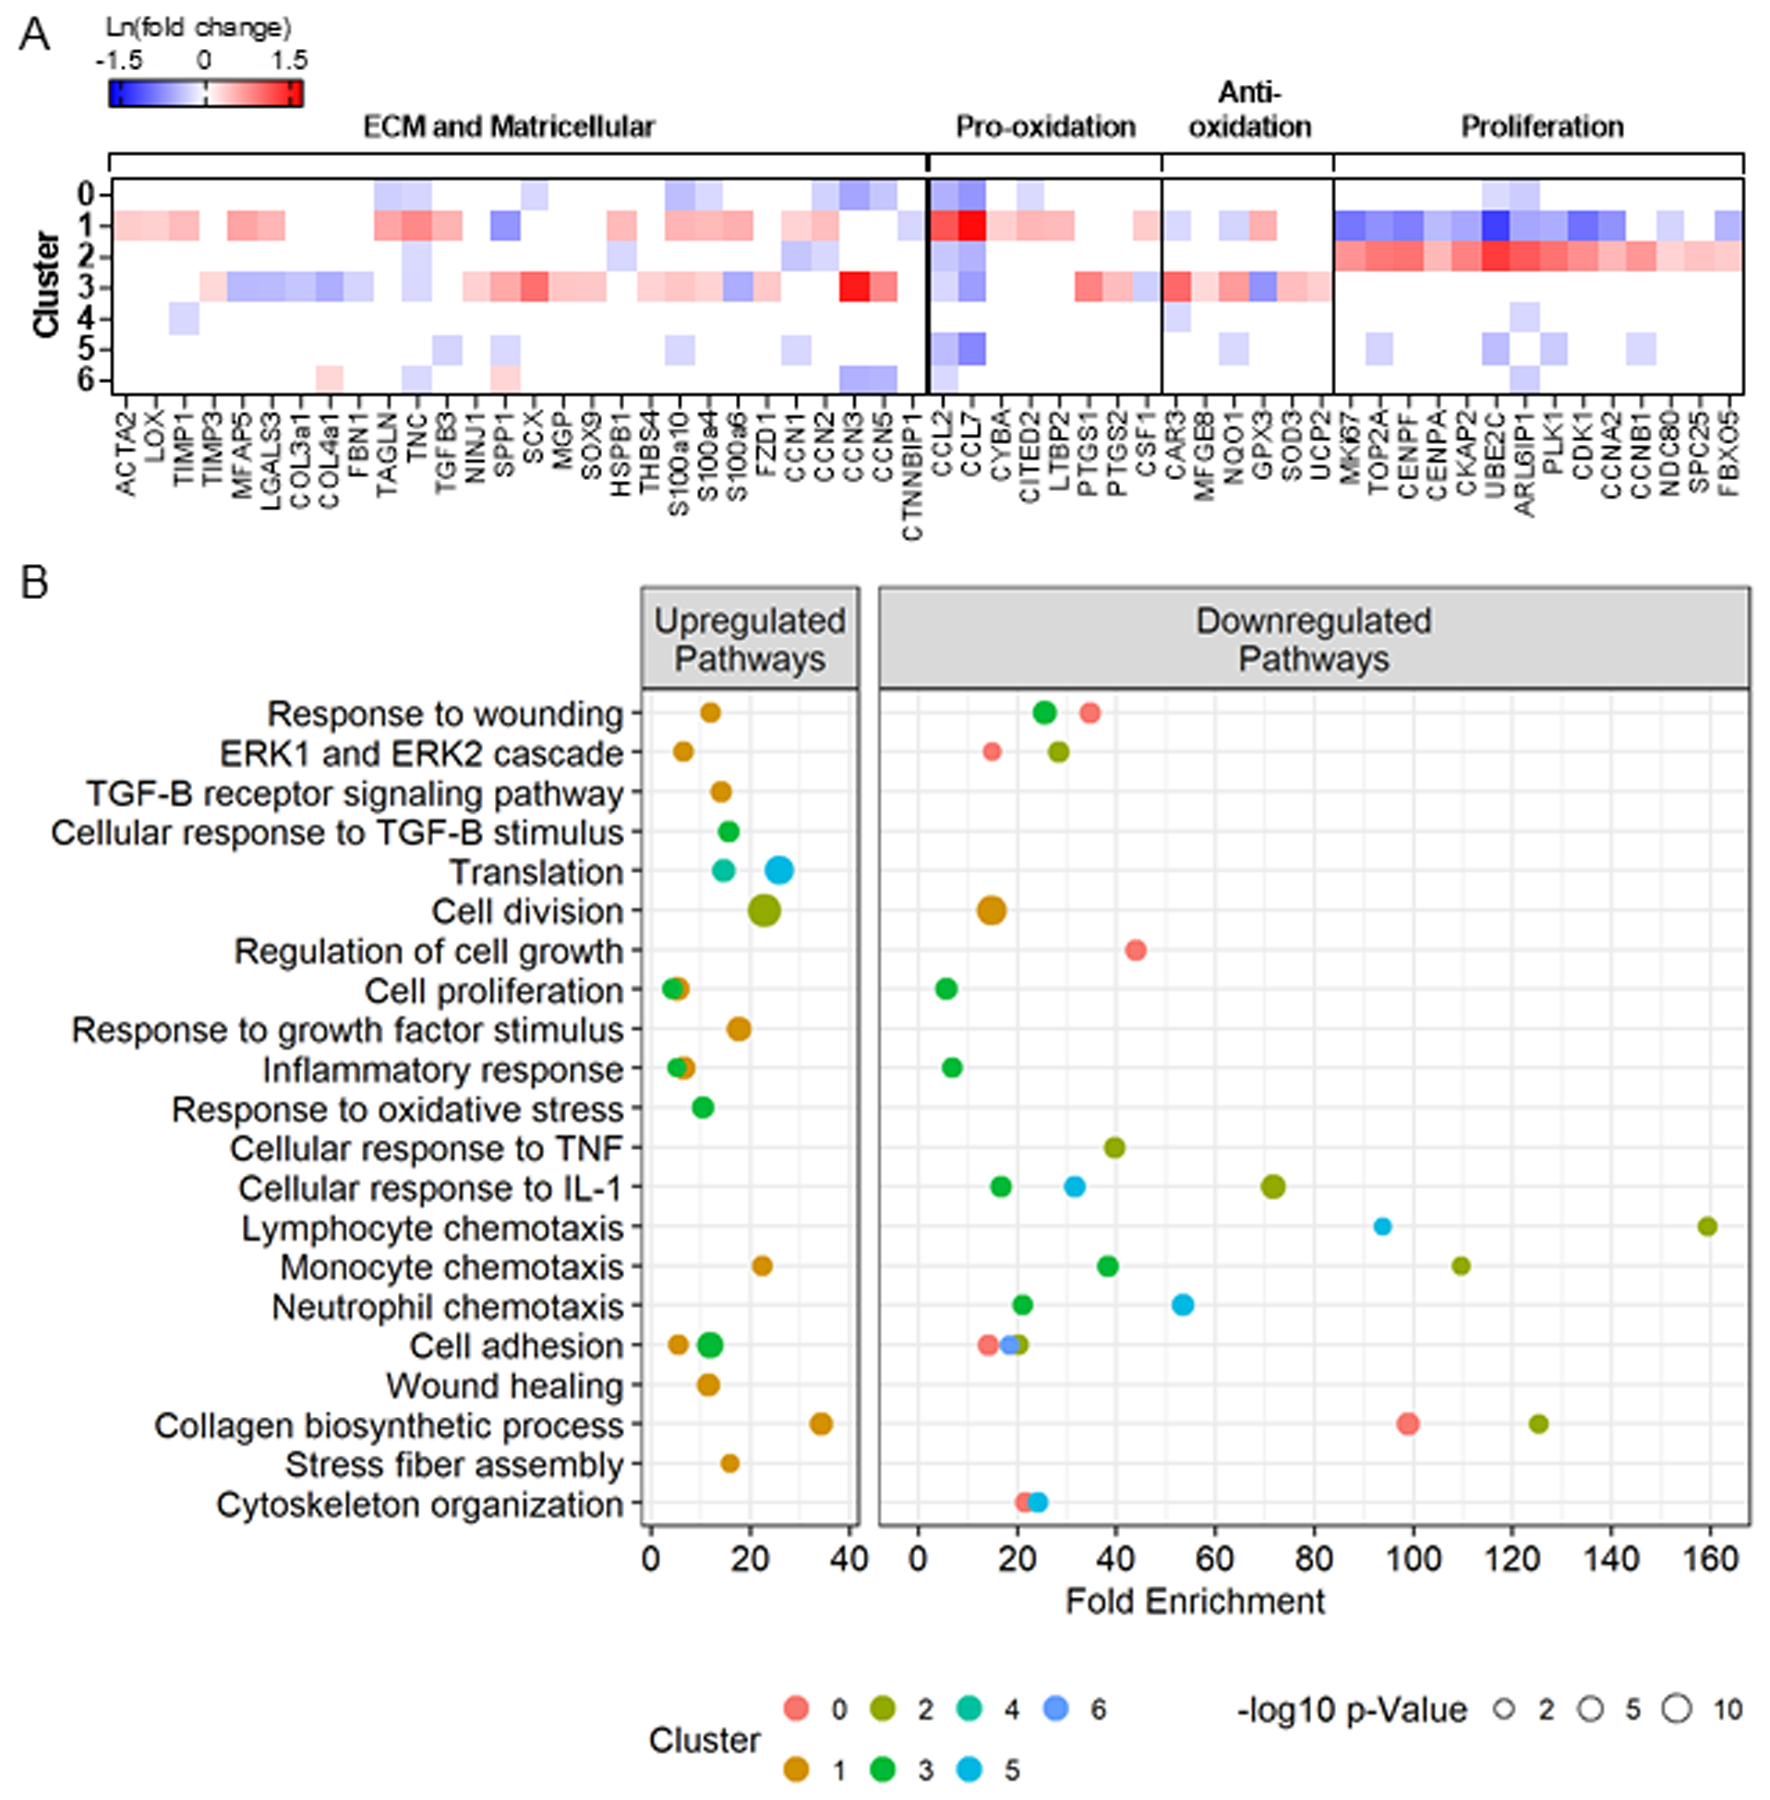
Differential gene expression between the cardiac fibroblasts in each cluster compared to all other clusters identified the unique gene profiles of each cluster. The majority (98%) of the fibroblasts clustered into subsets 0–6, and thus analyses focused on these clusters. A) Relative expression of select genes (all p-adjusted <0.05) and B) related GoTerm biological processes (all p<0.02) involved in fibrosis in clusters 0–6 reveals phenotypic signatures for each cluster.
Cluster 7 was enriched with genes associated with the innate immune system, including LYZ2 (23-fold) and TYROBP (7-fold), but were negative for CD45, indicating they are not hematopoietic in origin. Cluster 8 was distinguished by the downregulation of FBLN2 (−2.7-fold), ACTA2 (−2.3-fold), POSTN (−1.9-fold), COL1a1 (−1.9-fold) highlighting its low fibrogenic profile. Given the small proportion of cells that make up clusters 7 and 8 (<2% of total), these clusters were excluded from further analysis. The complete lists of differentially expressed genes and associated pathways (GoTerm biological processes, p<0.02) that characterize clusters 0–8 are reported in the Supplementary File.
Next, we evaluated the degree to which prior ACE inhibition impacted each cluster by performing differential expression between cardiac fibroblasts from ACE inhibitor treated versus the Untreated SHR group within each cluster. Among subsets 0–6, prior ACE inhibitor treatment resulted in 2,544 downregulated and 435 upregulated distinct genes (Figure 3A). Treatment induced a differential effect on each cluster, with clusters 0 and 6 demonstrating the greatest number of altered genes. Twenty-four genes were downregulated in all seven clusters that significantly influence pathways related to protein translation and the mitochondrial electron transport chain indicating suppressed metabolic activity (Supplementary File). The relative changes in select genes encoding for ECM, matricellular proteins, oxidative stress, and proliferation due to transient ACE inhibition within clusters 0–6 and the associated pathways are displayed in Figure 3B and 3C. The complete lists of differentially expressed genes and significantly impacted pathways (GoTerm biological processes) by transient ACE inhibition within clusters 0–6 are reported in the Supplementary File. Overall, ACE inhibitor treatment targeted multiple pathways resulting in net reductions in fibrogenic and inflammatory signaling. This impact of treatment varied across the different subpopulations, indicating heterogeneity in response. We assigned phenotypes to each cluster based on their distinct gene profiles and determined the unique impact of transient ACE inhibition on each cluster.
Figure 3.
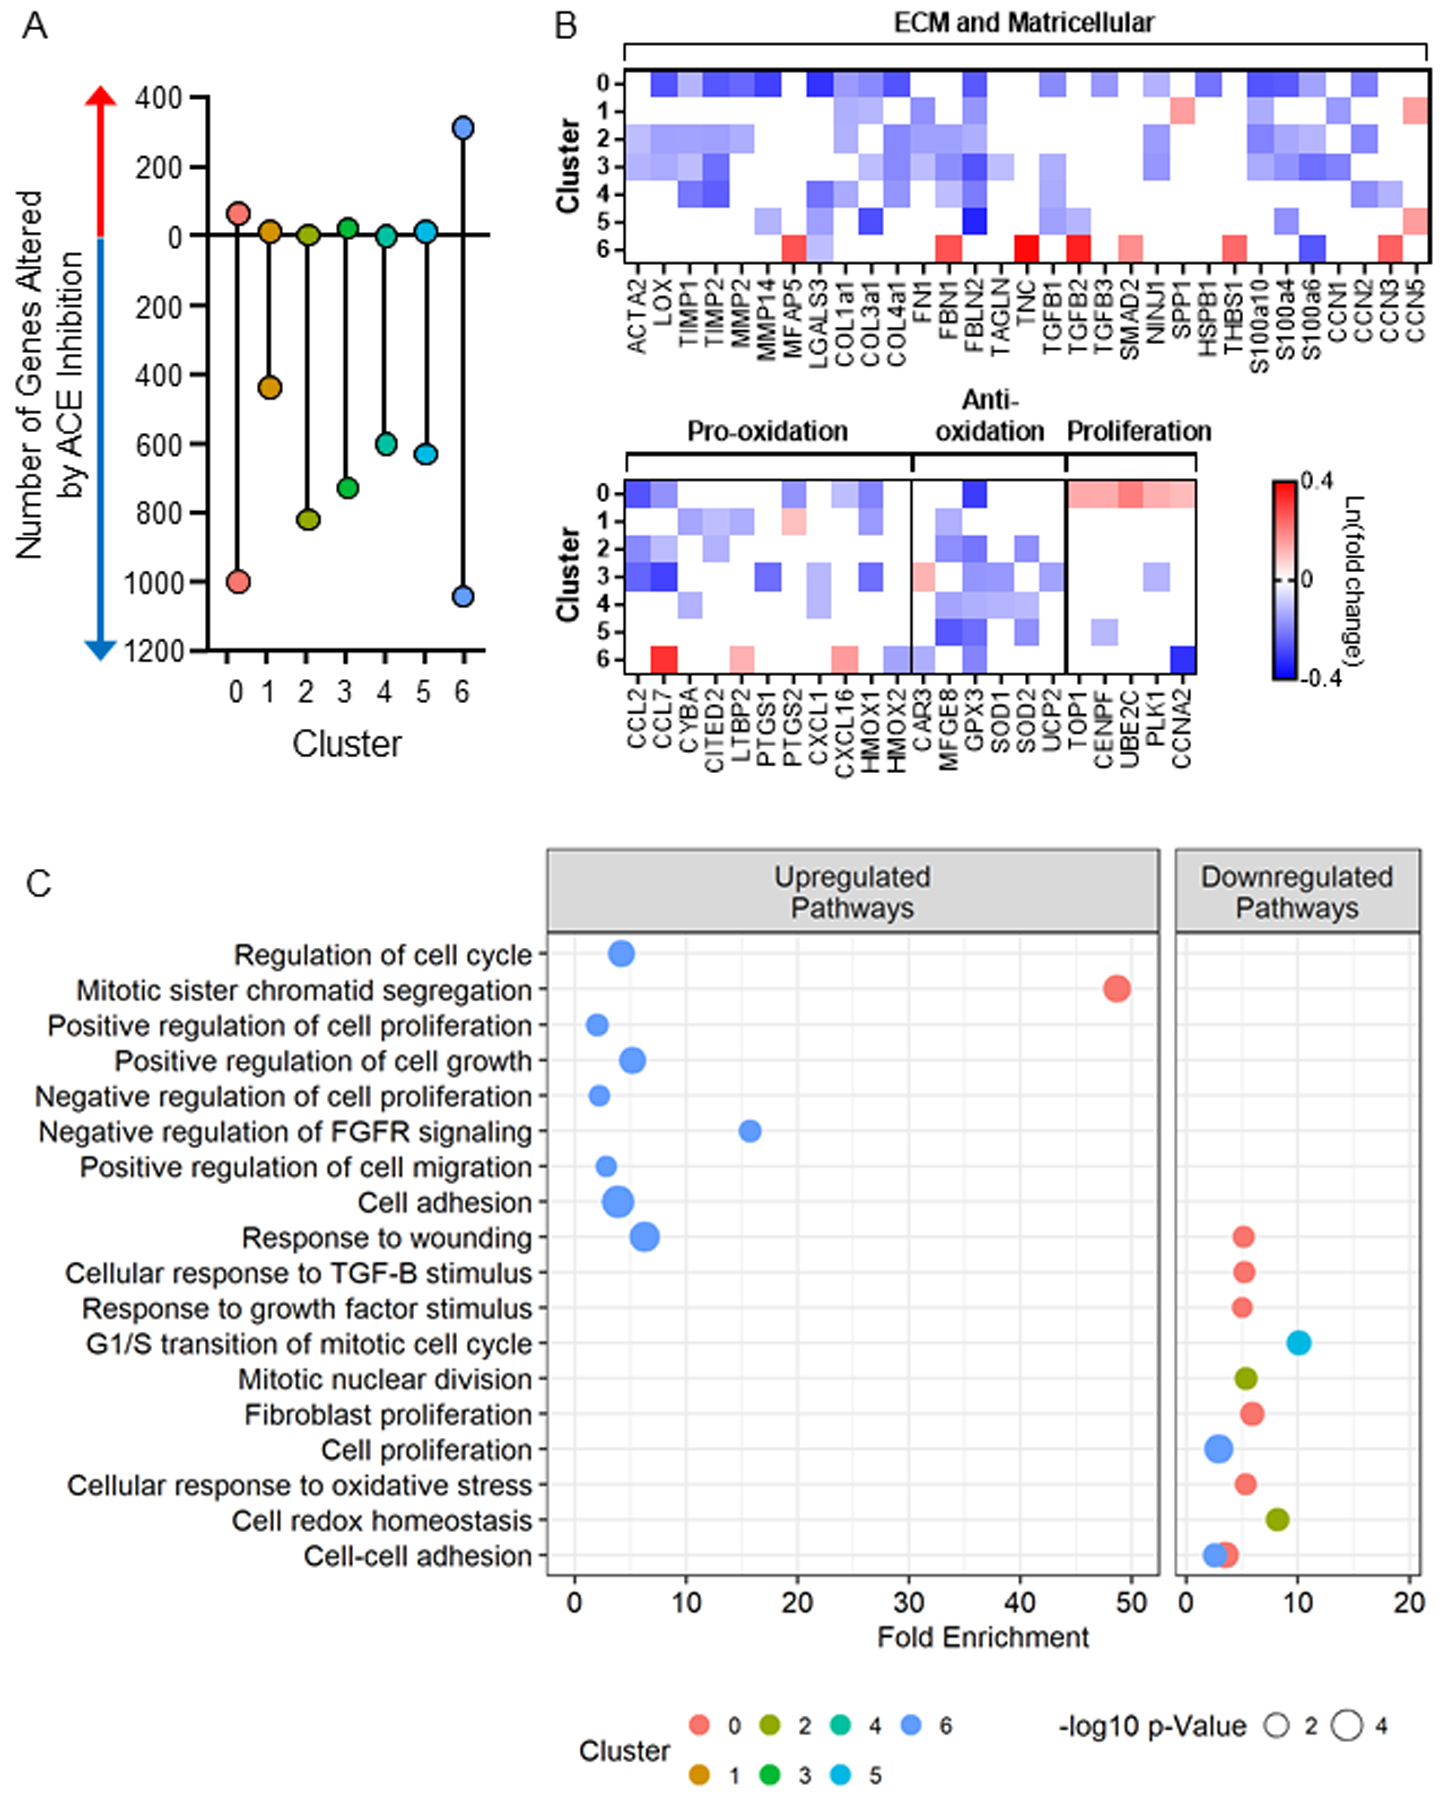
Differential gene expression between fibroblasts from the angiotensin converting enzyme (ACE) inhibitor-treated hearts vs. untreated within each cluster reveals variable responses to ACE inhibition among the clusters with clusters 0 and 6 representing the most highly responsive. The majority (98%) of the fibroblasts clustered into subsets 0–6, and thus analyses focused on these clusters. A) The number of significantly altered genes following ACE inhibition reveals the net downregulation of gene expression. B) Relative expression of select genes (all p-adjusted <0.05) and B) related GoTerm biological processes (all p<0.02) involved in fibrosis that are altered by ACE inhibitor treatment within each cluster.
Cluster 0 reflects homeostatic fibroblasts.
Fibroblasts in cluster 0 were characterized by a lower expression of only 19 genes compared to all other clusters in the combined SHR cohort. The five genes with the lowest expression by fold change were CCL7, CCN3, CCL2, S100a10, and CCN5 (Table 1). Overall, cluster 0 was characterized by low expression of genes involved in fibrosis and inflammation indicative of a homeostatic pool responsible for the maintenance of the ECM (Figure 2A). The gene composition signifies reduced response to wounding, cell adhesion, and collagen biosynthesis (Figure 2B), indicating a lower level or suppression of these processes. Cluster 0 was the least fibrogenic of the identified fibroblast subsets.
ACE inhibitor treatment reduced the expression of 998 genes in cluster 0 compared to the untreated SHR cohort. ECM genes, including COL1a1, COL3a1, TGFB1, LGALS3, MMP2, TIMP1, and LOX, and inflammatory genes, including CCL2, CCL7, and PTGS2, were reduced with treatment (Figure 3B). Genes regulating cell cycle and proliferation were increased in cluster 0 following ACE inhibitor treatment. Pathway analysis revealed suppression of pathways including response to wounding, response to transforming growth factor beta stimulus, and cellular response to oxidative stress, while mitotic sister chromatid segregation was upregulated with treatment in cluster 0 (Figure 3C). These phenotypic changes are consistent with the observed expansion of low fibrogenic cluster 0 in the treated SHR hearts, which may underlie the reduced fibrotic response in SHR following transient ACE inhibition8.
Cluster 1 was the most pro-inflammatory activated subpopulation of fibroblasts.
The top five enriched genes in cluster 1 by fold change compared to the other clusters were CCL7, CCL2, AKAP12, TNC, and CKB (Table 1). CCL7, CCL2, and TNC are chemoattractants associated with other pro-inflammatory genes elevated in cluster 1, such as CITED2 and CYBA (Figure 2A). In total, cluster 1 gene representation was defined by 80 genes, ~40 of which related to fibrosis and inflammation compared to all other clusters in the combined SHR cohort (Supplementary File). Other known markers of fibroblast activation were also highly expressed ACTA2 (1.4-fold), MFAP5 (1.8-fold), LGALS3 (1.6-fold), and TIMP1 (1.6-fold) along with two pro-fibrotic Wnt signaling components, CCN1 and CCN226–28, and reduced CTNNBIP1, a Wnt pathway inhibitor. There were no changes in the expression of matrix metalloproteinase genes in cluster 1. Pathway analysis reveals enhanced signaling for response to wounding, transforming growth factor beta receptor signaling, inflammatory response, monocyte chemotaxis, and stress fiber assembly in cluster 1, relative to all other clusters (Figure 2B).
Cluster 1 had reduced expression of 107 genes compared to the other clusters in the combined SHR cohort, and the five least expressed were UBE2C, HMGB2l1, RRM2, STMN1, and CDK1, all of which are related to cell cycle progression. There were ~50 genes associated with cell division and proliferation decreased in cluster 1, relative to all other clusters. Components of the p53 pathway, including SERPINE1 (plasminogen activator inhibitor 1) and GADD45, are also increased in cluster 1 and may indicate cell cycle arrest. A similar pro-inflammatory and anti-proliferative phenotype is observed in a subset of fibroblasts at one day post-myocardial infarction29.
In response to ACE inhibitor treatment, 437 genes were downregulated, including 16 genes that are uniquely enriched in cluster 1 compared to all other clusters. These include fibrogenic CCN1 and inflammatory CYBA, CITED2, and LTBP2 genes. Following ACE inhibition, fibroblasts exhibited a tempered ECM synthesis profile, with reduced expression of COL1A1, COL3A1, FN1, and FBLN2 and increased CCN5, a repressor of fibrotic signaling30 (Figure 3B). Treatment did not change the gene expression of matrix metalloproteinases in cluster 1, suggesting a reduced synthesis profile without an impact on proteolysis. There was not a marked change in antioxidant enzymes following ACE inhibitor treatment. In cluster 1, the impact of the treatment is two-fold: to downregulate the expression of some cluster-defining genes while also reducing additional fibrogenic and inflammatory genes.
Cluster 2 represented proliferative fibroblasts.
Cluster 2 showed higher expression of 57 genes that were depleted in cluster 1. The top five enriched genes by fold change in cluster 2 compared to all others in the combined SHR cohort were UBE2C, ARL6IP1, PLK1, CNEPF, and TOP2A, all involved in cellular proliferation (Table 1). Markers of proliferation that were increased in cluster 2 were Mki67 (2.1-fold), TOP2A (2.5-fold), CCNB1 (2-fold), centromere proteins (CENPF, CENPE, CENPA), aurora kinases (AURKA and AURKB), kinesins (KIF23, KIF20, KIF11, KIFc1, KIF4A) and cell division cycle members (CDC20, CDCA8, CDCA3, CDCA2). Several ECM and pro-inflammatory genes (TNC, HSPB1, CCN1, CCN2, CCL2, and CCL7) were reduced in cluster 2 compared to all others (Figure 2A). Based on pathway analysis, these genes enrich cell division and suppress cellular responses to tumor necrosis factor, lymphocyte chemotaxis, cell adhesion, and collagen biosynthesis (Figure 2B).
ACE inhibitor treatment resulted in the downregulation of 817 genes in cluster 2, supporting a less fibrogenic and less inflammatory phenotype with the reduction of 15 ECM genes, including ACTA2, COL1a1, FN1, CCN2, CCL2, and CCL7 (Figure 3B). Significant decreases in antioxidant genes were also induced by treatment, while the proliferative profile of cluster 2 was not impacted by prior ACE inhibition.
Cluster 3 reflects moderately fibrogenic and inflammation suppressing fibroblasts
Cluster 3 cells expressed variable changes in fibrogenic and inflammatory gene expression. By fold change, the top five enriched genes were CCN3, CYP1a1, CAR3, SCX, and FIBIN, and the five lowest expressed genes were AKAP12, GPX3, CCL7, ADAM19, and S100a6 (Table 1). A subset of fibrogenic genes, including MFAP5, LGALS3, COL3a1, FBN1, TNC, was reduced compared to other clusters, while CCN3 and CCN5, known to have anti-fibrotic effects30–32, were elevated. Others that are associated with fibroblast activation, SCX, THBS4, and SPP1 (encoding osteopontin), were increased. Pro-inflammatory (CCL2, CCL7, PTGS1, PTGS2, CSF1) and inflammation suppressing (NQO1, GPX3, SOD3, UCP2, CAR3, MFGE8) genes were either increased or decreased in cluster 3 compared to other clusters contributing to an overall neutralizing phenotype for oxidative stress. Pathways that distinguished cluster 3 show both up and downregulation of fibrotic and inflammatory responses that characterize this cluster as moderately fibrogenic (Figure 2B).
In response to ACE inhibition, cluster 3 exhibited downregulation of 725 genes, including 16 that are uniquely enriched in cluster 3 such as S100a4, S100a10, NINJ1, and PTGS1. Overall, transient ACE inhibition reduces ECM-related (ACTA2, COL3a1, FN1, TGFB1, TAGLN, and CCN1), pro-inflammatory (CCL2, CCL7, PTGS1 [encodes for COX-1], and CXCL1, a neutrophil chemoattractant33), and antioxidant genes compared to untreated SHR (Figure 3B).
Clusters 4 and 5 reflect intermediate fibroblast phenotypes
The top five enriched genes in cluster 4 were CRIP1, RPL37a, RPS29, SNRPF, RPS21 (Table 1). As such, cluster 4 was characterized by increased protein translation. The five least expressed genes were also related to translation. However, reduced EEF1A1 may suggest cellular senescence34 of the fibroblasts in cluster 4. Transient ACE inhibition downregulated the expression of 599 genes, including ten associated with ECM, including COL1a1, TIMP1, LGALS3, TGFB1, CCN2, and CCN3 in cluster 4 (Figure 3B). Pro-oxidants CYBA and CXCL1 were also reduced in cluster 4 treated cells. Like cluster 4, the top five enriched genes in cluster 5 were RPL34, RPL32, FTL, EEF1a1, and RPS10, all relating to protein translation (Table 1). Genes related to fibrosis (SPP1, CCN1, TGFB3), inflammation (CCL2, CCL7, S100A10, NQO1), and proliferation (TOP2A, PLK1, CDK1, CCNB1) were significantly lower in comparison to other clusters. Following transient ACE inhibition, cluster 5 exhibited downregulation of 627 genes with seven genes related to ECM, including COL3a1, FBLN2, LGALS3, and TGFB1 (Figure 3B). Treatment also increased CCN5, a repressor of fibrotic signaling, suggesting beneficial changes following treatment.
Cluster 6 reflected a gateway pool of fibroblasts to feed Cluster 1.
Compared to all the other clusters, cluster 6 had 20 differentially expressed genes. The top five enriched genes were CDKN3, HMGN2, FEN1, SPP1, and RPL22l1 (Table 1), and the five lowest expressed genes were CCN3, CCN5, RPL38, RPL39, and Arl6ip1. ACE inhibition downregulated the expression of 1,040 genes, including fibrogenic genes, and upregulated 315 genes. Six markers of fibroblast activation (MFAP5, SMAD2, FBN1, TNC, TGFB2, and THBS1) and pro-inflammatory genes CCL7 and CXCL16 were increased following treatment in cluster 6 (Figure 3B). Pathway analysis revealed the upregulation of response to wounding, proliferation, and cell adhesion (Figure 3C). Together, these findings illustrate that cluster 6 was highly vulnerable to transient ACE inhibition.
Pseudotime trajectory analysis
Fibroblasts were projected onto pseudotime trajectory analysis to gain insight into the potential relationship among the clusters in time (cells colored by cluster and treatment group Figure 4A and 4B). This analysis reflects predicted biological progression through cell fate decisions as phenotypes shift in response to environmental cues. There was a striking pattern of separation between cells from untreated versus ACE inhibitor-treated hearts highlighting the significant impact of ACE inhibition on the global fibroblast genome. The distinct trajectories between clusters in the cells from the Untreated group’s hearts suggest that uninterrupted pressure overload provides stimuli that direct cardiac fibroblasts into various activation states, thus priming them for enhanced ECM deposition seen with fibrotic cardiac remodeling. Fibroblasts from the ACE Inhibitor group’s hearts lost these differentiation patterns and became more homogeneous.
Figure 4.
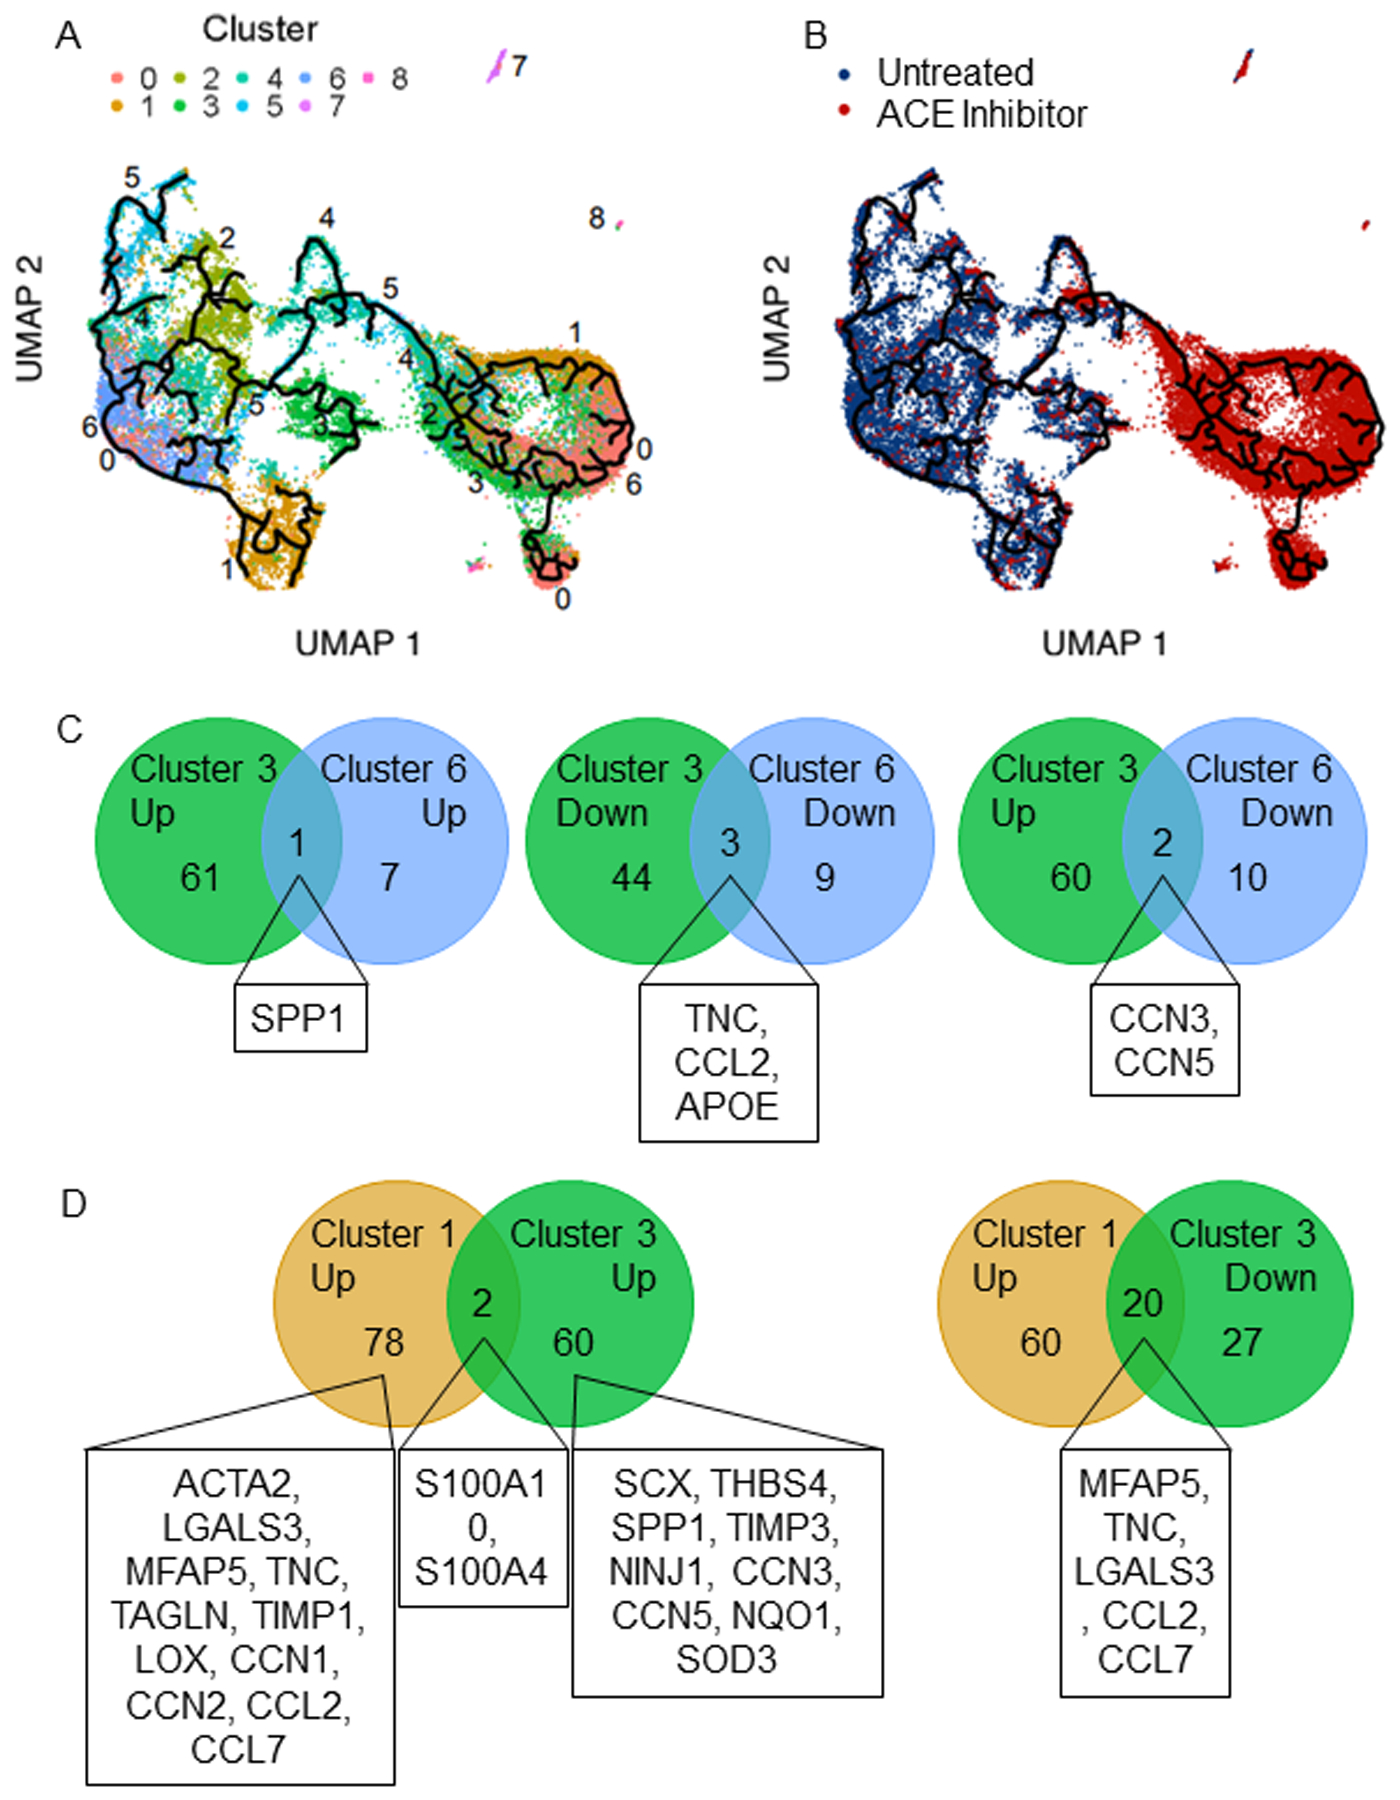
Cardiac fibroblast clusters were arranged by pseudotime analysis revealing reduced heterogeneity following angiotensin converting enzyme (ACE) inhibitor treatment. A) Cardiac fibroblasts colored by cluster and B) by treatment reveal altered heterogeneity and a distinct impact of treatment on cell fate trajectory. Clusters 1 and 3 are terminal phenotypes, while cluster 6 is a gateway to cluster 1. C) Comparison of clusters 3 and 6 reveals that few essential genes differentiate them, while D) comparison of clusters 1 and 3 reveals distinct lists of fibrogenic genes that differentiate them. The highlighted genes are those that relate to fibrotic processes.
In the Untreated SHR group only, cluster 2 signified a pool of precursor cells for clusters 3, 4, and 6, with cluster 6, then serving as a precursor for cluster 1. Thus, activated fibroblasts are derived from cluster 2 via cluster 6. Of these three fate choices (clusters 3, 4, or 6), cluster 4 yielded a homogenous subpopulation of fibroblasts from ACE inhibitor-treated rats representing a non-pathological outcome. The divergence between cluster 3 and cluster 6 is primarily due to the expression of CCN3 and CCN5 (Figure 4C). These are the two lowest expressed genes in cluster 6, while they are in the top 9 highly expressed genes in cluster 3, with CCN3 being the highest. As two terminal destinations, cluster 3, and cluster 1 represent pools of fibrogenic fibroblasts with unique activation profiles (Figure 4D). They only share two enriched (S100a10, S100a4) and two depleted (SNRPF, APOE) genes leaving their profiles distinct. The fibrogenic genes in cluster 1 (ACTA2, LGALS3, CCN1, CCN2, TNC, MFAP5, TAGLN, LOX, HSPB1, TIMP1) differ from and are more closely aligned with an activated phenotype than those in cluster 3 (SCX, THBS4, SPP1, TIMP3, NINJ1). Out of 80 elevated genes in cluster 1 relative to other clusters, 20 are reduced in cluster 3, including MFAP5, TNC, CCL7, CCL2, and LGALS3, depicting less activation. An additional differentiating factor is that cluster 1 is pro-inflammatory, while cluster 3 is not.
Cluster proportions and the impact of ACE inhibition
The distribution of fibroblasts underwent a marked shift from cluster 6 to cluster 0 following transient ACE inhibitor treatment (Figure 5A). In the total pool of fibroblasts isolated from treated rats, 36% were in cluster 0, while only 1.5% were in cluster 6, diminishing the gateway to cluster 1. In contrast, cluster 0 and cluster 6 make up 6% and 16% of the pool of fibroblasts from untreated rats, respectively. When the percentage of cells from Untreated and ACE Inhibitor group hearts were quantified within-cluster, clusters 0 and 6 mirrored each other (Supplemental Figure S1). Cluster 6 was comprised of 90% untreated cells, while cluster 0 was 88% treated, suggesting that these subpopulations are uniquely susceptible to ACE inhibitor treatment. Thus, cluster 0 vs. cluster 6 differentially expressed genes and associated pathways were determined. ECM (COL1A1, COL3A1, TAGLN, TIMP1, LOX), activated fibroblast markers (ACTA2, SPP1, LGALS3, HSPB1), pro-fibrotic CCN genes (CCN1 and CCN2), and markers of inflammation (CCL2) were all expressed at a higher level in cluster 6, relative to cluster 0 (Figure 5B). Moreover, the proportion of cells in which these genes were detected is much lower in cluster 0 than in cluster 6. The pathways significantly downregulated in cluster 0 compared to cluster 6 involved wound healing, growth factor stimulation, proliferation, and cytokine responses shown in Figure 5C. The complete list of differentially expressed genes and pathways significantly downregulated in cluster 0 vs. cluster 6 are displayed in the Supplementary File.
Figure 5.
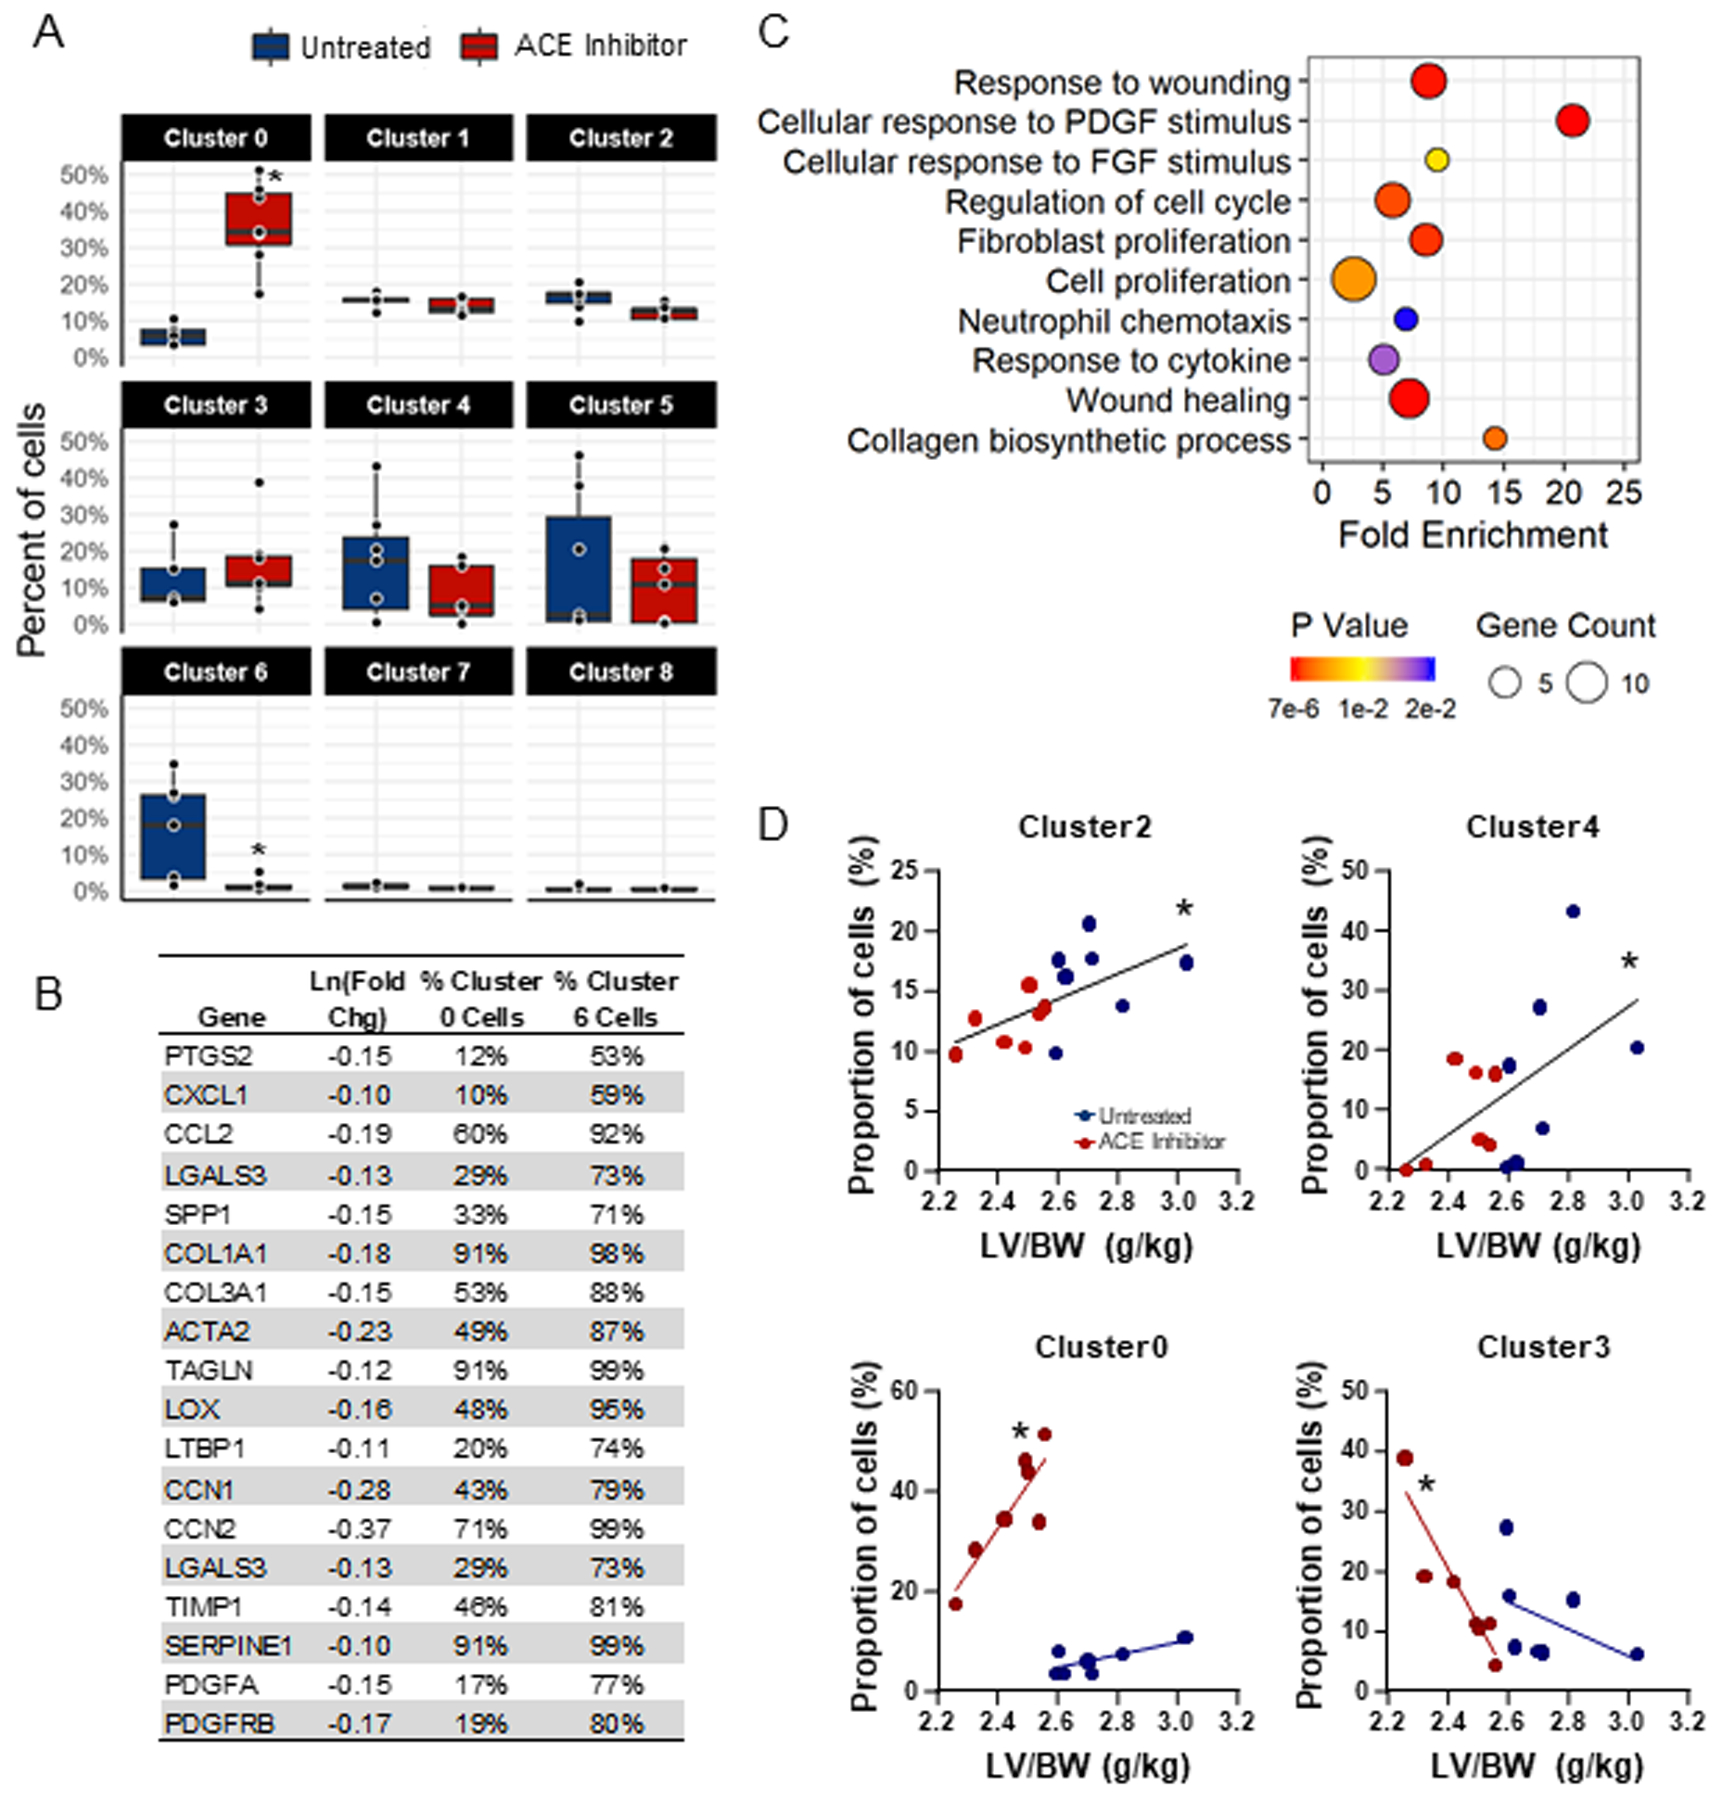
Angiotensin converting enzyme (ACE) inhibition results in the expansion of cluster 0 and depletion of cluster 6, reducing fibrogenic gene expression. A) Analysis of the proportion of cells from untreated and ACE inhibitor-treated hearts that group into each cluster reveals a significant reduction of cells from ACE inhibitor-treated hearts in cluster 6 and a significant increase in cluster 0. B) Differential gene expression between cardiac fibroblasts in cluster 0 vs. cluster 6 reveals the downregulation of fibrosis-related genes in cluster 0 compared to cluster 6. Percentages represent the proportion of all cluster 0 and all cluster 6 cells in which these genes were detected (p<0.05). C) GoTerm biological processes downregulated in cluster 0 compared to cluster 6 (p<0.02). D) Pearson correlation coefficients of left ventricular mass/body weight (LV/BW) vs. the proportion of cells reveals correlations between hypertrophy and clusters 0, 2, 3, and 4.
Relationship between cluster dominance and LV hypertrophy
The proportion of cells in each cluster were correlated with LV mass to determine relationships between fibroblast phenotype and cardiac hypertrophy (Figure 5D). Proliferative cluster 2 (r2=0.3806, p=0.0188) and translationally active cluster 4 (r2=0.3134, p=0.0374) positively correlated with LV mass. Fibroblast expansion and increased synthesis of ECM proteins are processes necessary for the fibrogenic response during cardiac remodeling. In fibroblasts from hearts previously treated with an ACE inhibitor, cluster 0 positively correlated (r2=0.7600, p=0.0105), while cluster 3 negatively correlated with LV mass (r2=0.8476, p=0.0033).
Discussion:
The goal of this study was to determine the degree to which cardiac fibroblast subpopulations in SHR LV change in response to transient ACE inhibitor treatment, leading to persistent cardioprotective phenotypes to pressure-overload11. The most salient findings were: a) the hypertensive heart of SHRs contains clusters that suggest distinct phenotypes including activated (cluster 1), proliferative (cluster 2), moderately fibrogenic (cluster 3), low fibrogenic (cluster 0); b) transient ACE inhibitor treatment reduced cardiac fibroblast heterogeneity in the hypertensive heart and produced significant downregulation of genes associated with fibrosis, inflammation, protein translation, and oxidative phosphorylation; and c) ACE inhibitor treatment dramatically shifted cluster 6, which served as a gateway the activated cluster 1, towards the less inflammatory and less fibrogenic cluster 0. Collectively, the data reveal that transient ACE inhibitor treatment shifts the flow of cardiac fibroblast progenitors away from activation and toward a homogenous population characterized by lower expression of genes associated with ECM production and inflammation.
While the pseudotime analysis of our results suggests fluidity among functional states within a continuum, a main finding is that the clusters are more distinct phenotypically in untreated hearts, and following treatment, these clusters become more homogenous. In the heterogeneously characterized fibroblasts from the untreated SHR hearts, proliferative cluster 2 serves as a pre-pre-activation state to the terminal cluster 1 by way of cluster 6. Among the many markers of proliferation in cluster 2, that CKAP4 is not one of them distinguishes this pressure overloaded profile from that of post-MI29. Activated cardiac fibroblasts mediate fibrosis in the overloaded heart35, are commonly referred to as myofibroblasts, expand from the resident fibroblast population and express markers, including alpha-smooth muscle actin36. Though fibrogenic markers were highly expressed in cluster 1, we have intentionally not defined this cluster as myofibroblasts. The precise definition of a myofibroblast is evolving as the field seeks to more accurately target this cell type. Similar studies to ours have termed more than one fibroblast subpopulation as myofibroblasts based on separate collections of gene markers13,37,38. Increased oxidative stress is another defining characteristic of fibroblast activation. In the activated cluster 1, enrichment of the p22phox subunit of NADPH oxidase (NOX)39 CYBA is linked with NOX2 and NOX4-mediated ROS production in cardiac fibroblasts40. ACE inhibition induced reductions of CYBA and HMOX1, an inducible monooxygenase that is upregulated with oxidative stress, and promotes superoxide anion41, works to combat the predisposition for ROS production. However, in cluster 1, CCL2 and CCL7 are not attenuated by ACE inhibition, which may be linked to the paradoxical increase in osteopontin (SPP1). Osteopontin signaling includes stimulation of CCL2-encoded monocyte chemoattractant protein 1 (MCP-1), thus leaving the inflammatory status of cluster 1 unchanged following transient ACE inhibition. It is possible that upon a future injury, cells in cluster 6 are most readily mobilized into the activated state reflected in cluster 1. However, significant depletion of the gateway with prior ACE inhibitor treatment reduces that pool of cells, which highlights that cluster 6 is a potential target for anti-fibrotic therapies.
The moderately fibrogenic cluster 3 is an alternative terminal destination to cluster 1 that uniquely expresses THBS4, SCX, and MFGE8. THBS4+ cells are associated with interstitial fibrosis but in the absence of increased alpha-smooth muscle actin15, similar to cluster 3. The fibrogenic transcription factor scleraxis (SCX)42 has also been shown to be expressed alongside THBS4 in myofibroblasts from a single cell analysis seven days post-myocardial infarction37, illustrating the potential fibrogenic capacity of cluster 3. However, the unique combination of THBS4 and MFGE8 may liken them to matrifibrocytes found in mature scar43, a stable fibroblast state essential for maintenance, also described by Mouton et al29. MFGE8 is a negative regulator of hypertrophy and fibrosis44, and MFGE8+ cells are capable of engulfing apoptotic cells and assuming an anti-inflammatory role45. With low levels of cytokines and high levels of antioxidants, cluster 3 may represent a unique subpopulation of inflammation suppressing fibroblasts with reduced fibrogenic capacity that provides a favorable destination for expanding cluster 2 cells.
Cluster 0, which expands upon ACE inhibitor treatment, represents the least fibrogenic pool of fibroblasts and may act as neo-homeostatic fibroblasts in the treated hearts similar to what is seen at seven days after myocardial infarction29. The observed reductions in fibrogenic and inflammatory gene expression in this expanded cluster 0 provide additional support for our previously reported reduction in NOS-induced fibrosis and macrophage infiltration following transient ACE inhibition in the hypertensive rat heart8–10. Moreover, cluster 0 represents the highest proportion of cells from treated hearts. Cardiac fibrosis is brought about by the expansion and activation of resident fibroblasts, which inherently requires differentiation into activation states. Similar to the cardiac fibroblast activation continuum observed after MI46, hypertension induces altered phenotypes that span the progression of pathology. This study is the first to attempt to map the subtypes of cardiac fibroblasts that reside in the hypertensive heart and are influenced by transient ACE inhibition. This study addresses the existing knowledge gap by showing that cardiac fibroblasts from rats transiently treated with an ACE inhibitor exhibit decreased heterogeneity, evidenced by a loss of precise cluster trajectories and blunted fibrogenic phenotypes compared to cells from untreated SHRs. The persistent impact of transient ACE inhibition, therefore, now includes cardioprotective alterations at the gene level to support the already known beneficial protection against pathological remodeling and cardiac dysfunction9.
Fibroblasts from ACE inhibitor treated SHRs also exhibit reduced ribosomal proteins (RPL26, RPL34, and RPL37) indicative of less ribosome biogenesis and protein translation47. Untreated SHRs had significantly higher LV mass than treated, and this correlated with the proportion of cells in proliferative cluster 2 and translationally active cluster 4 with implications of increased fibroblast number and ECM production. Suppressed expression of ECM (ACTA2, FN1, COL1A1, COL3A1), matricellular proteins, and Wnt-related CCN genes indicate lower fibroblast activation48,49. Members of the CCN group of proteins (CCN1–6) are involved mainly in fibrotic signaling32,50–52, which were also shown to be persistently altered by transient ACE inhibition. In addition to their role in promoting ECM production, activated fibroblasts perpetuate inflammation, which in turn exacerbates fibrosis in hypertensive hearts53,54. Reduced CCL2 and LGALS3 work to attenuate macrophage infiltration and reduce inflammation and fibrosis in the hypertensive heart55. The findings in the present paper support a fibroblast-driven mechanism to explain the reduced macrophage infiltration and fibrosis in response to NOS inhibition in SHRs transiently treated with an ACE inhibitor8–10.
This study analyzed passage 0 cardiac fibroblasts that were briefly cultured in serum on plastic after isolation, which allowed for expansion of the fibroblast pool for optimal scRNA-seq conditions while also maintaining individual biological replicates. We have previously demonstrated that fibroblasts isolated from control and ACE inhibitor treated hearts and cultured in this manner up to passage 1 maintain changes in cell physiology consistent with in vivo physiology8,10, similar to what others report29,43. Taken together, our current and previous findings demonstrate that the cells retain memory of their in vivo environment. Thus, any changes that occurred as a result of culture conditions were not sufficient to impact fibroblast phenotype.
Perspectives
Transient ACE inhibitor treatment reduces the heterogeneity of cardiac fibroblasts, diminishes the gateway to activation, and attenuates fibrogenic phenotypes to establish a neo-homeostatic pool of fibroblasts in the heart. Notably, following the withdrawal of treatment, we have previously shown that the cardiac components of the RAS are not different from untreated SHR10,56. Thus, the findings revealed herein are not due to sustained RAS inhibition and align with previously shown benefits of this treatment scheme on fibrosis, macrophage infiltration, cardiac function, and cardiac fibroblast phenotype following NOS inhibition8–11. Ang II is pro-fibrogenic57,58, which further supports the shift in cardiac fibroblast subpopulations with ACE inhibition. Collagen secretion by fibroblasts is contingent on Ang II binding to its AT1 receptor59, indicating that the effect of ACE inhibition is directly linked to reduced Ang II bioactivity. These data provide in-depth insight into the mechanism underlying cardioprotection by ACE inhibitors and move us closer to identifying novel targets of potential anti-fibrotic therapies. This is an important area of investigation given that no clinically available interventions can stop or reverse fibrotic remodeling of the heart.
Supplementary Material
Novelty and Significance.
What is New?
Transient ACE inhibition in hypertensive rats yields a persistent downregulation of pro-fibrotic and pro-inflammatory gene expression in cardiac fibroblasts.
Attenuation of fibrogenic gene expression is accompanied by the expansion of the least fibrogenic subpopulation of cardiac fibroblasts after ACE inhibition
What is Relevant?
The reduction of fibrogenic and inflammatory capacity of cardiac fibroblasts following transient ACE inhibition may underlie previous reports of protection against post-injury cardiac dysfunction and associated macrophage infiltration.
Genes, or more broadly, fibroblast subpopulations altered by transient treatment may reveal novel targets for anti-fibrotic therapies.
Sources of Funding
NIH NHLBI HL141165 (TMH, MJH), HL129823 and HL137319 (MLL), American Heart Association 19AIREA34460000 (TMH) and 19POST34410055 (AMG), and the Biomedical Laboratory Research and Development Service of the Veterans Affairs Office of Research and Development under Award Numbers 5I01BX000505 (MLL)
Footnotes
Disclosures
None
References:
- 1.Frohlich ED, Susic D. Pressure overload. Heart failure clinics. 2012;8(1):21–32. [DOI] [PubMed] [Google Scholar]
- 2.Khalil H, Kanisicak O, Prasad V, Correll RN, Fu X, Schips T, Vagnozzi RJ, Liu R, Huynh T, Lee S-J, Karch J, Molkentin JD. Fibroblast-specific TGF-β–Smad2/3 signaling underlies cardiac fibrosis. The Journal of Clinical Investigation. 2017;127(10):3770–3783. [DOI] [PMC free article] [PubMed] [Google Scholar]
- 3.Brilla CG, Funck RC, Rupp H. Lisinopril-mediated regression of myocardial fibrosis in patients with hypertensive heart disease. Circulation. 2000;102(12):1388–1393. [DOI] [PubMed] [Google Scholar]
- 4.Hale TM, Bushfield TL, Woolard J, Pang JJ, Rees-Milton KJ, Adams MA. Changes critical to persistent lowering of arterial pressure in spontaneously hypertensive rat occur early in antihypertensive treatment. Journal of hypertension. 2011;29(1):113–122. [DOI] [PubMed] [Google Scholar]
- 5.Liang B, Leenen FHH. Prevention of salt induced hypertension and fibrosis by angiotensin converting enzyme inhibitors in Dahl S rats. British journal of pharmacology. 2007;152(6):903–914. [DOI] [PMC free article] [PubMed] [Google Scholar]
- 6.Kong P, Christia P, Frangogiannis NG. The pathogenesis of cardiac fibrosis. Cellular and molecular life sciences. 2014;71(4):549–574. [DOI] [PMC free article] [PubMed] [Google Scholar]
- 7.Ham O, Jin W, Lei L, Huang HH, Tsuji K, Huang M, Roh J, Rosenzweig A, Lu HAJ. Pathological cardiac remodeling occurs early in CKD mice from unilateral urinary obstruction, and is attenuated by Enalapril. Sci Rep. 2018;8(1):16087–16087. [DOI] [PMC free article] [PubMed] [Google Scholar]
- 8.Hale TM, Robertson SJ, Burns KD, deBlois D. Short-term ACE inhibition confers long-term protection against target organ damage. Hypertension research : official journal of the Japanese Society of Hypertension. 2012;35(6):604–610. [DOI] [PubMed] [Google Scholar]
- 9.Biwer LA, Broderick TL, Xu H, Carroll C, Hale TM. Protection against L-NAME-induced reduction in cardiac output persists even after cessation of angiotensin-converting enzyme inhibitor treatment. Acta physiologica (Oxford, England). 2013;207(1):156–165. [DOI] [PubMed] [Google Scholar]
- 10.Biwer LA, D’Souza KM, Abidali A, Tu D, Siniard AL, DeBoth M, Huentelman M, Hale TM. Time course of cardiac inflammation during nitric oxide synthase inhibition in SHR: impact of prior transient ACE inhibition. Hypertension research : official journal of the Japanese Society of Hypertension. 2016;39(1):8–18. [DOI] [PubMed] [Google Scholar]
- 11.D’Souza KM, Biwer LA, Madhavpeddi L, Ramaiah P, Shahid W, Hale TM. Persistent change in cardiac fibroblast physiology after transient ACE inhibition. American journal of physiology Heart and circulatory physiology. 2015;309(8):H1346–1353. [DOI] [PubMed] [Google Scholar]
- 12.Pinto AR, Ilinykh A, Ivey MJ, Kuwabara JT, D’antoni ML, Debuque R, Chandran A, Wang L, Arora K, Rosenthal NA. Revisiting cardiac cellular composition. Circulation research. 2016;118(3):400–409. [DOI] [PMC free article] [PubMed] [Google Scholar]
- 13.Gladka MM, Molenaar B, De Ruiter H, Van Der Elst S, Tsui H, Versteeg D, Lacraz GP, Huibers MM, Van Oudenaarden A, Van Rooij E. Single-cell sequencing of the healthy and diseased heart reveals cytoskeleton-associated protein 4 as a new modulator of fibroblasts activation. Circulation. 2018;138(2):166–180. [DOI] [PubMed] [Google Scholar]
- 14.Schafer S, Viswanathan S, Widjaja AA, Lim W-W, Moreno-Moral A, DeLaughter DM, Ng B, Patone G, Chow K, Khin E. IL-11 is a crucial determinant of cardiovascular fibrosis. Nature. 2017;552(7683):110. [DOI] [PMC free article] [PubMed] [Google Scholar]
- 15.McLellan MA, Skelly DA, Dona MS, Squiers GT, Farrugia GE, Gaynor TL, Cohen CD, Pandey R, Diep H, Vinh A. High-resolution transcriptomic profiling of the heart during chronic stress reveals cellular drivers of cardiac fibrosis and hypertrophy. bioRxiv. 2019:854026. [DOI] [PMC free article] [PubMed] [Google Scholar]
- 16.National Research Council Committee for the Update of the Guide for the C, Use of Laboratory A. The National Academies Collection: Reports funded by National Institutes of Health In: Guide for the Care and Use of Laboratory Animals. Washington (DC): National Academies Press (US) Copyright © 2011, National Academy of Sciences; 2011. [Google Scholar]
- 17.Sen S, Tarazi RC, Khairallah PA, Bumpus FM. Cardiac Hypertrophy in Spontaneously Hypertensive Rats. Circulation research. 1974;35(5):775–781. [DOI] [PubMed] [Google Scholar]
- 18.Kokubo M, Uemura A, Matsubara T, Murohara T. Noninvasive evaluation of the time course of change in cardiac function in spontaneously hypertensive rats by echocardiography. Hypertension research. 2005;28(7):601–609. [DOI] [PubMed] [Google Scholar]
- 19.Van Linthout S, Miteva K, Tschöpe C. Crosstalk between fibroblasts and inflammatory cells. Cardiovascular research. 2014;102(2):258–269. [DOI] [PubMed] [Google Scholar]
- 20.Team R. RStudio: integrated development for R. RStudio, Inc, Boston, MA: URL http://www.rstudiocom 2015;42:14. [Google Scholar]
- 21.Team RC. R: A language and environment for statistical computing. In: Vienna, Austria; 2013. [Google Scholar]
- 22.Stuart T, Butler A, Hoffman P, Hafemeister C, Papalexi E, Mauck WM III, Hao Y, Stoeckius M, Smibert P, Satija R. Comprehensive integration of single-cell data. Cell. 2019;177(7):1888–1902. e1821. [DOI] [PMC free article] [PubMed] [Google Scholar]
- 23.Qiu X, Hill A, Packer J, Lin D, Ma Y-A, Trapnell C. Single-cell mRNA quantification and differential analysis with Census. Nature methods. 2017;14(3):309–315. [DOI] [PMC free article] [PubMed] [Google Scholar]
- 24.Huang da W, Sherman BT, Lempicki RA. Systematic and integrative analysis of large gene lists using DAVID bioinformatics resources. Nat Protoc. 2009;4(1):44–57. [DOI] [PubMed] [Google Scholar]
- 25.Huang da W, Sherman BT, Lempicki RA. Bioinformatics enrichment tools: paths toward the comprehensive functional analysis of large gene lists. Nucleic Acids Res. 2009;37(1):1–13. [DOI] [PMC free article] [PubMed] [Google Scholar]
- 26.Löbel M, Bauer S, Meisel C, Eisenreich A, Kudernatsch R, Tank J, Rauch U, Kühl U, Schultheiss H-P, Volk H-D, Poller W, Scheibenbogen C. CCN1: a novel inflammation-regulated biphasic immune cell migration modulator. Cellular and Molecular Life Sciences. 2012;69(18):3101–3113. [DOI] [PMC free article] [PubMed] [Google Scholar]
- 27.Kurundkar AR, Kurundkar D, Rangarajan S, Locy ML, Zhou Y, Liu R-M, Zmijewski J, Thannickal VJ. The matricellular protein CCN1 enhances TGF-β1/SMAD3-dependent profibrotic signaling in fibroblasts and contributes to fibrogenic responses to lung injury. The FASEB Journal. 2016;30(6):2135–2150. [DOI] [PMC free article] [PubMed] [Google Scholar]
- 28.Wang X, McLennan SV, Allen TJ, Tsoutsman T, Semsarian C, Twigg SM. Adverse effects of high glucose and free fatty acid on cardiomyocytes are mediated by connective tissue growth factor. American Journal of Physiology-Cell Physiology. 2009;297(6):C1490–C1500. [DOI] [PubMed] [Google Scholar]
- 29.Mouton AJ, Ma Y, Rivera Gonzalez OJ, Daseke MJ, Flynn ER, Freeman TC, Garrett MR, DeLeon-Pennell KY, Lindsey ML. Fibroblast polarization over the myocardial infarction time continuum shifts roles from inflammation to angiogenesis. Basic research in cardiology. 2019;114(2):6. [DOI] [PMC free article] [PubMed] [Google Scholar]
- 30.Jeong D, Lee M-A, Li Y, Yang DK, Kho C, Oh JG, Hong G, Lee A, Song MH, LaRocca TJ. Matricellular protein CCN5 reverses established cardiac fibrosis. Journal of the American College of Cardiology. 2016;67(13):1556–1568. [DOI] [PMC free article] [PubMed] [Google Scholar]
- 31.Abd El Kader T, Kubota S, Janune D, Nishida T, Hattori T, Aoyama E, Perbal B, Kuboki T, Takigawa M. Anti-fibrotic effect of CCN3 accompanied by altered gene expression profile of the CCN family. J Cell Commun Signal. 2013;7(1):11–18. [DOI] [PMC free article] [PubMed] [Google Scholar]
- 32.Yoon PO, Lee M-A, Cha H, Jeong MH, Kim J, Jang SP, Choi BY, Jeong D, Yang DK, Hajjar RJ. The opposing effects of CCN2 and CCN5 on the development of cardiac hypertrophy and fibrosis. Journal of molecular and cellular cardiology. 2010;49(2):294–303. [DOI] [PubMed] [Google Scholar]
- 33.Sawant KV, Poluri KM, Dutta AK, Sepuru KM, Troshkina A, Garofalo RP, Rajarathnam K. Chemokine CXCL1 mediated neutrophil recruitment: Role of glycosaminoglycan interactions. Sci Rep. 2016;6(1):33123. [DOI] [PMC free article] [PubMed] [Google Scholar]
- 34.Lu Y, Wang J, Dapeng C, Wu D, Cai G, Chen X. Bioinformatics analysis of proteomics profiles in senescent human primary proximal tubule epithelial cells. BMC nephrology. 2016;17(1):39. [DOI] [PMC free article] [PubMed] [Google Scholar]
- 35.Moore-Morris T, Guimarães-Camboa N, Banerjee I, Zambon AC, Kisseleva T, Velayoudon A, Stallcup WB, Gu Y, Dalton ND, Cedenilla M. Resident fibroblast lineages mediate pressure overload–induced cardiac fibrosis. The Journal of clinical investigation. 2014;124(7):2921–2934. [DOI] [PMC free article] [PubMed] [Google Scholar]
- 36.Kanisicak O, Khalil H, Ivey MJ, Karch J, Maliken BD, Correll RN, Brody MJ, Lin S-CJ, Aronow BJ, Tallquist MD. Genetic lineage tracing defines myofibroblast origin and function in the injured heart. Nature communications. 2016;7(1):1–14. [DOI] [PMC free article] [PubMed] [Google Scholar]
- 37.Farbehi N, Patrick R, Dorison A, Xaymardan M, Janbandhu V, Wystub-Lis K, Ho JW, Nordon RE, Harvey RP. Single-cell expression profiling reveals dynamic flux of cardiac stromal, vascular and immune cells in health and injury. Elife. 2019;8. [DOI] [PMC free article] [PubMed] [Google Scholar]
- 38.McLellan MA, Skelly DA, Dona MSI, Squiers GT, Farrugia GE, Gaynor TL, Cohen CD, Pandey R, Diep H, Vinh A, Rosenthal NA, Pinto AR. High-Resolution Transcriptomic Profiling of the Heart During Chronic Stress Reveals Cellular Drivers of Cardiac Fibrosis and Hypertrophy. Circulation. 0(0). [DOI] [PMC free article] [PubMed] [Google Scholar]
- 39.Ambasta RK, Kumar P, Griendling KK, Schmidt HHHW, Busse R, Brandes RP. Direct Interaction of the Novel Nox Proteins with p22phox Is Required for the Formation of a Functionally Active NADPH Oxidase. Journal of Biological Chemistry. 2004;279(44):45935–45941. [DOI] [PubMed] [Google Scholar]
- 40.Song Q, Liu L, Yu J, Zhang J, Xu M, Sun L, Luo H, Feng Z, Meng G. Dihydromyricetin attenuated Ang II induced cardiac fibroblasts proliferation related to inhibitory of oxidative stress. Eur J Pharmacol. 2017;807:159–167. [DOI] [PubMed] [Google Scholar]
- 41.Rochette L, Zeller M, Cottin Y, Vergely C. Redox functions of heme oxygenase-1 and biliverdin reductase in diabetes. Trends in Endocrinology & Metabolism. 2018;29(2):74–85. [DOI] [PubMed] [Google Scholar]
- 42.Bagchi RA, Roche P, Aroutiounova N, Espira L, Abrenica B, Schweitzer R, Czubryt MP. The transcription factor scleraxis is a critical regulator of cardiac fibroblast phenotype. BMC Biol. 2016;14:21. [DOI] [PMC free article] [PubMed] [Google Scholar]
- 43.Fu X, Khalil H, Kanisicak O, Boyer JG, Vagnozzi RJ, Maliken BD, Sargent MA, Prasad V, Valiente-Alandi I, Blaxall BC, Molkentin JD. Specialized fibroblast differentiated states underlie scar formation in the infarcted mouse heart. The Journal of Clinical Investigation. 2018;128(5):2127–2143. [DOI] [PMC free article] [PubMed] [Google Scholar]
- 44.Deng K-Q, Li J, She Z-G, Gong J, Cheng W-L, Gong F-H, Zhu X-Y, Zhang Y, Wang Z, Li H. Restoration of Circulating MFGE8 (Milk Fat Globule-EGF Factor 8) Attenuates Cardiac Hypertrophy Through Inhibition of Akt Pathway. Hypertension (Dallas, Tex : 1979). 2017;70(4):770–779. [DOI] [PubMed] [Google Scholar]
- 45.Nakaya M, Watari K, Tajima M, Nakaya T, Matsuda S, Ohara H, Nishihara H, Yamaguchi H, Hashimoto A, Nishida M, et al. Cardiac myofibroblast engulfment of dead cells facilitates recovery after myocardial infarction. The Journal of Clinical Investigation. 2017;127(1):383–401. [DOI] [PMC free article] [PubMed] [Google Scholar]
- 46.Ma Y, Iyer RP, Jung M, Czubryt MP, Lindsey ML. Cardiac fibroblast activation post-myocardial infarction: current knowledge gaps. Trends in pharmacological sciences. 2017;38(5):448–458. [DOI] [PMC free article] [PubMed] [Google Scholar]
- 47.Nishimura K, Kumazawa T, Kuroda T, Katagiri N, Tsuchiya M, Goto N, Furumai R, Murayama A, Yanagisawa J, Kimura K. Perturbation of ribosome biogenesis drives cells into senescence through 5S RNP-mediated p53 activation. Cell Rep. 2015;10(8):1310–1323. [DOI] [PubMed] [Google Scholar]
- 48.Ivey MJ, Tallquist MD. Defining the Cardiac Fibroblast. Circulation Journal. 2016;80(11):2269–2276. [DOI] [PMC free article] [PubMed] [Google Scholar]
- 49.González-Santamaría J, Villalba M, Busnadiego O, López-Olañeta MM, Sandoval P, Snabel J, López-Cabrera M, Erler JT, Hanemaaijer R, Lara-Pezzi E, Rodríguez-Pascual F. Matrix cross-linking lysyl oxidases are induced in response to myocardial infarction and promote cardiac dysfunction. Cardiovascular research. 2015;109(1):67–78. [DOI] [PubMed] [Google Scholar]
- 50.Yang GP, Lau LF. Cyr61, product of a growth factor-inducible immediate early gene, is associated with the extracellular matrix and the cell surface. Cell Growth Differ. 1991;2(7):351–357. [PubMed] [Google Scholar]
- 51.Peidl A, Perbal B, Leask A. Yin/Yang expression of CCN family members: Transforming growth factor beta 1, via ALK5/FAK/MEK, induces CCN1 and CCN2, yet suppresses CCN3, expression in human dermal fibroblasts. PloS one. 2019;14(6):e0218178. [DOI] [PMC free article] [PubMed] [Google Scholar]
- 52.Riser BL, Najmabadi F, Perbal B, Peterson DR, Rambow JA, Riser ML, Sukowski E, Yeger H, Riser SC. CCN3 (NOV) is a negative regulator of CCN2 (CTGF) and a novel endogenous inhibitor of the fibrotic pathway in an in vitro model of renal disease. Am J Pathol. 2009;174(5):1725–1734. [DOI] [PMC free article] [PubMed] [Google Scholar]
- 53.Lijnen P, Papparella I, Petrov V, Semplicini A, Fagard R. Angiotensin II-stimulated collagen production in cardiac fibroblasts is mediated by reactive oxygen species. Journal of hypertension. 2006;24(4):757–766. [DOI] [PubMed] [Google Scholar]
- 54.Lindner D, Zietsch C, Tank J, Sossalla S, Fluschnik N, Hinrichs S, Maier L, Poller W, Blankenberg S, Schultheiss HP, Tschöpe C, Westermann D. Cardiac fibroblasts support cardiac inflammation in heart failure. Basic research in cardiology. 2014;109(5):428. [DOI] [PubMed] [Google Scholar]
- 55.González GE, Rhaleb NE, D’Ambrosio MA, Nakagawa P, Liao TD, Peterson EL, Leung P, Dai X, Janic B, Liu YH, Yang XP, Carretero OA. Cardiac-deleterious role of galectin-3 in chronic angiotensin II-induced hypertension. American journal of physiology Heart and circulatory physiology. 2016;311(5):H1287–h1296. [DOI] [PMC free article] [PubMed] [Google Scholar]
- 56.Smallegange C, Hale TM, Bushfield TL, Adams MA. Persistent lowering of pressure by transplanting kidneys from adult spontaneously hypertensive rats treated with brief antihypertensive therapy. Hypertension (Dallas, Tex : 1979). 2004;44(1):89–94. [DOI] [PubMed] [Google Scholar]
- 57.Xu J, Carretero OA, Liao TD, Peng H, Shesely EG, Xu J, Liu TS, Yang JJ, Reudelhuber TL, Yang XP. Local angiotensin II aggravates cardiac remodeling in hypertension. American journal of physiology Heart and circulatory physiology. 2010;299(5):H1328–1338. [DOI] [PMC free article] [PubMed] [Google Scholar]
- 58.Crawford DC, Chobanian AV, Brecher P. Angiotensin II induces fibronectin expression associated with cardiac fibrosis in the rat. Circulation research. 1994;74(4):727–739. [DOI] [PubMed] [Google Scholar]
- 59.Thibault G, Lacombe MJ, Schnapp LM, Lacasse A, Bouzeghrane F, Lapalme G. Upregulation of alpha(8)beta(1)-integrin in cardiac fibroblast by angiotensin II and transforming growth factor-beta1. Am J Physiol Cell Physiol. 2001;281(5):C1457–1467. [DOI] [PubMed] [Google Scholar]
Associated Data
This section collects any data citations, data availability statements, or supplementary materials included in this article.