Abstract
Cryopreserved tissues are increasingly needed in biomedical applications. However, successful cryopreservation is generally only reported for thin tissues (≤ 1 mm). This work presents several innovations to reduce CPA toxicity and improve tissue cryopreservation, including (1) improved tissue warming rates through radiofrequency metal form and field optimization, and (2) an experimentally verified predictive model to optimize CPA loading and rewarming to reduce toxicity. CPA loading was studied by μCT imaging, rewarming by thermal measurements and modeling, and viability was measured after loading and/or cryopreservation by alamarBlue and histology. Loading conditions for 3 common CPA cocktails (6, 8.4 and 9.3 M) were designed and then fast cooling and metal forms rewarming (up to 2000 °C/min) achieved ≥ 90% viability in cryopreserved 1–2 mm arteries with various CPAs. Despite high viability by alamarBlue, histology showed subtle changes after cryopreservation suggesting some degree of cell damage especially in the central portions of thicker arteries up to 2 mm. While further studies are needed, these results show careful CPA loading and higher metal forms warming rates can help reduce CPA loading toxicity and improve outcomes from cryopreservation in tissues while also offering new protocols to preserve larger tissues ≥ 1 mm in thickness.
Keywords: Tissue cryopreservation, porcine aorta, 2mm-thick
Graphical Abstract
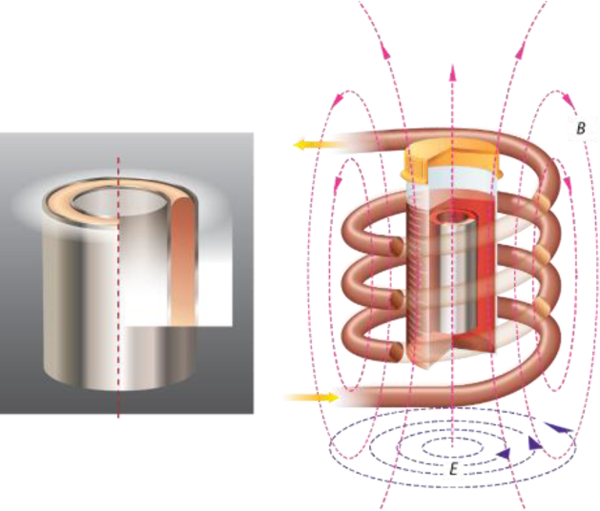
Thick tissues can be successfully cryopreserved and rewarmed with the help of ultra-rapid metal form heating. The first case of successful cryopreservation and rewarming of 2 mm-thick porcine aorta is theoretically predicted and experimentally achieved, and the model which is validated by the arterial tissue can also be applied to other tissue systems.
1. Introduction
Long-term preservation of biological tissues has the potential to revolutionize transplantation, regenerative medicine and biological research. Vitrification as a means of cryopreservation has a distinct advantage over other methods because it almost completely eliminates ice formation and the resulting damage. Vitrification and rewarming of thick tissues remain a problem, however, due to the inability to rapidly heat these systems.
Vascular grafts are used for a range of surgical procedures including transplant, dialysis access, and bypassing diseased or infected vascular structures. Currently vascular grafts are preserved in storage solutions at 0–4 °C for 24–48 hours with good viabilities, called cold storage.[1] Some groups have focused on developing better storage solutions that increase the storage time to weeks maintaining the structural integrity, but viability reduced to 70% after 2 weeks and, while used for some specific applications such as vascular reconstruction in transplant surgery, this has not translated to common clinical practice.[2] In order to preserve arteries for up to years, vitrification of the artery in an amorphous glassy (i.e. ice-free) state at cryogenic temperature below the glass transition temperature is needed.[3] Such capability for cryobanking could alleviate the shortage of arteries needed for coronary-artery bypass grafting, a well-established treatment for patients with extensive coronary artery disease and other restorative procedures.[4] We aim to eventually cryopreserve multiple human arterial grafts with various thicknesses, as shown in Figure 1, e.g., human common carotid artery (0.7–0.8mm),[5] common iliac artery (1.0–1.1 mm),[6] abdominal aorta (1.4–1.6mm) and thoracic aorta (1.6–1.7mm),[7] etc. In this paper, we used porcine carotid arteries, iliac arteries and abdominal aortas with similar sizes as the model system to develop and improve the vitrification and rewarming protocol.
Figure 1.
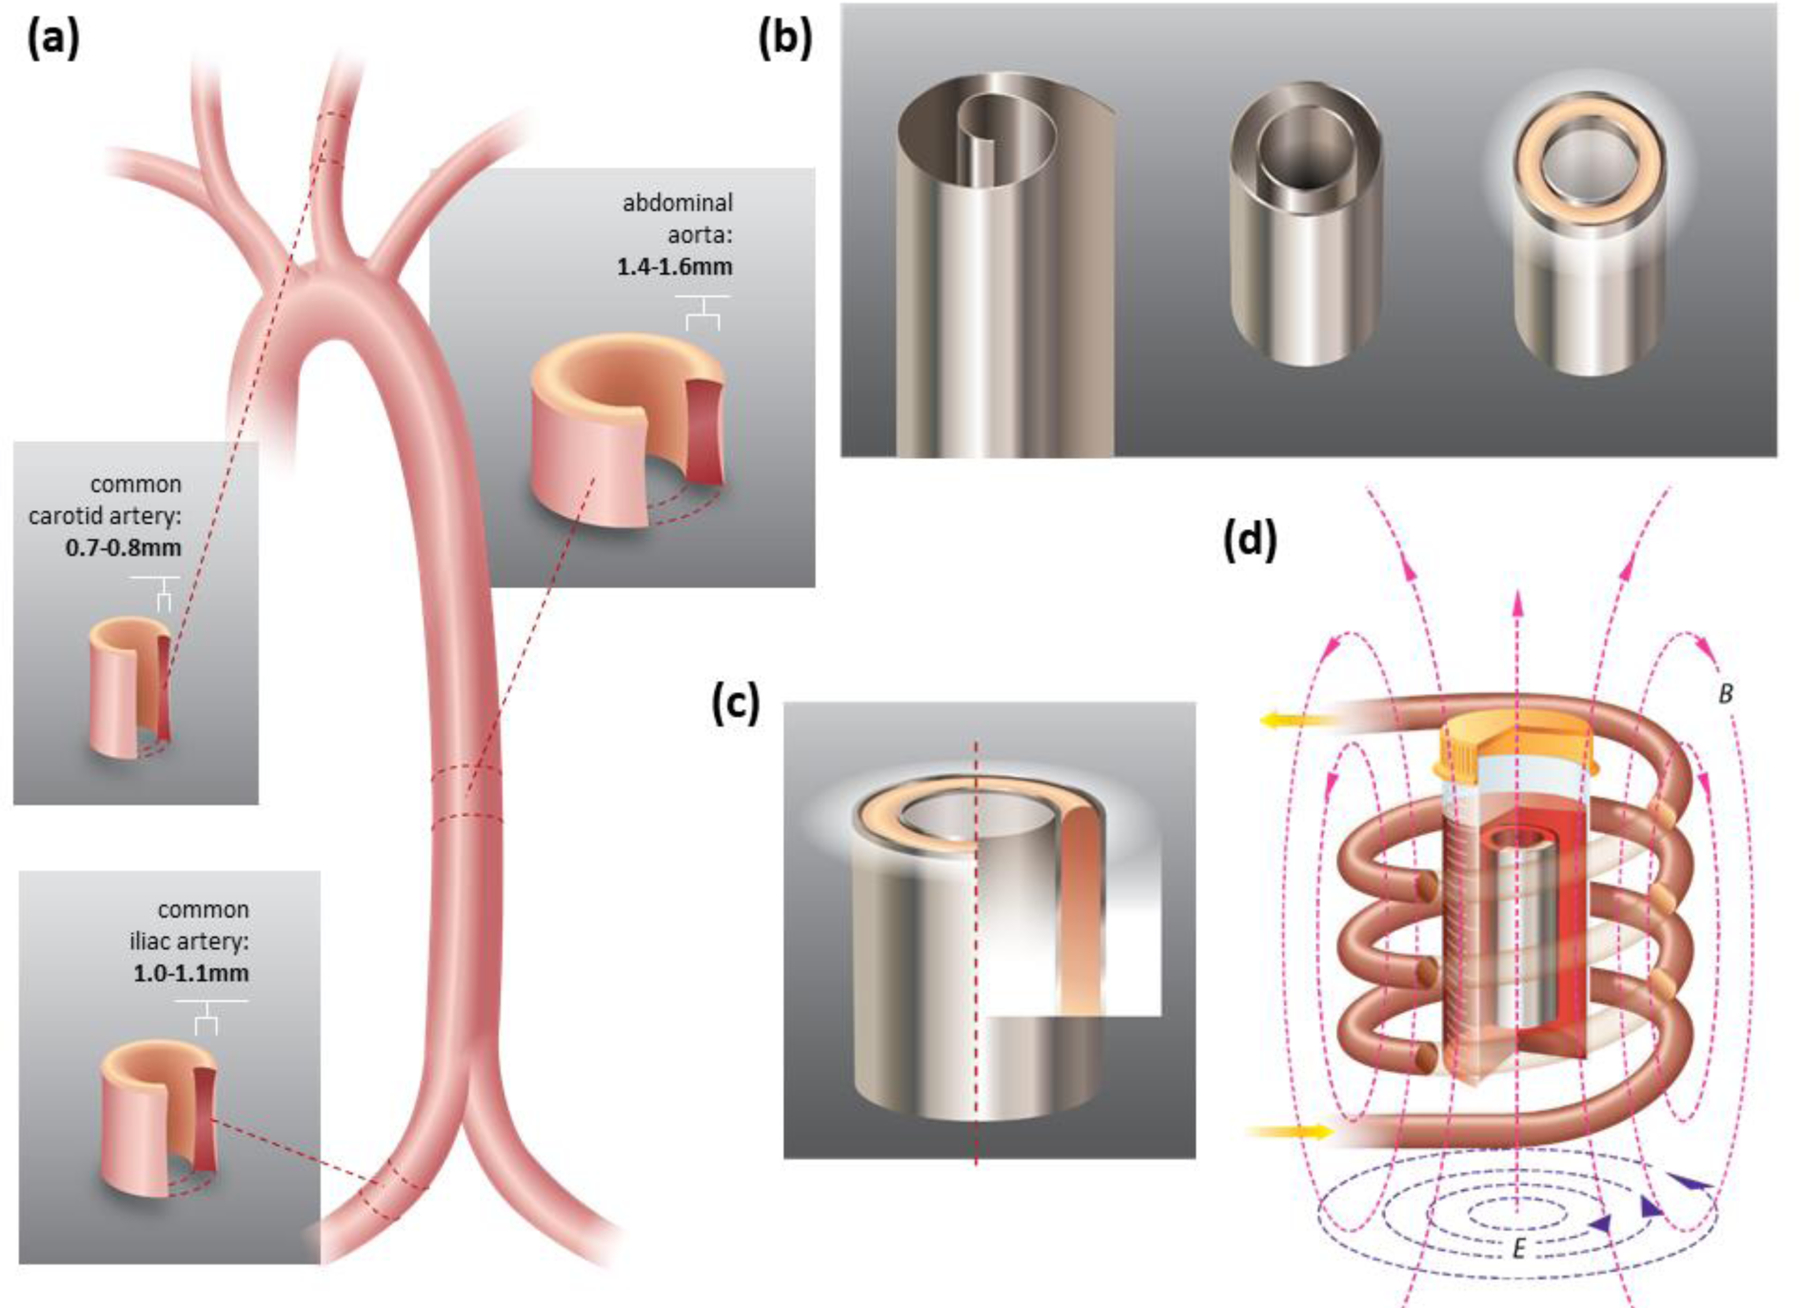
Anatomy of human arteries and heat transfer geometry. (a) Anatomies of human carotid arteries, iliac arteries, and abdominal aortas. The dimensions are listed for human arteries, in experiments, we used porcine carotid arteries, iliac arteries and abdominal aortas as a model. (b) 0.25 mm Al foil, concentric Al foil heating setup, and tissues placed in between the Al foils. (c) Cross section of the Al-Artery-Al heating set up. (d) Al foil and tissues are put into an AMF, creating eddy current and Joule heating.
To achieve vitrification, tissues must be loaded with CPA to block ice crystal formation during cooling to below the glass transition temperature.[8] CPAs slow the dynamics of ice crystal formation, but do not entirely prevent it. Thus, tissues must also be cooled faster than a critical cooling rate (CCR) to avoid ice formation prior to reaching a stable, glassy state.[9] In general, the higher the CPA molarity, the lower the CCR and the better tissue protection during the cooling process. The three most commonly used CPAs, DP6 (6 M), VS55 (8.4 M), and M22 (9.3 M), have CCRs of 40 °C/min,[10] 2.5 °C/min,[11] and 0.1 °C/min,[4a] respectively, as shown in Table 1. Also included in the table are the critical warming rates (CWRs) for each CPA, defined as the warming rate required to prevent ice crystallization during warming.[4a, 12] Increasing the CPA concentration can decrease the CCR and CWR but can also result in toxicity, either by osmotic shock experienced during loading and unloading hypertonic solutions, or through direct chemical toxicity. Osmotic shock can be minimized by gradually increasing CPA concentration in small increments during diffusional loading.[13] This process, however, increases the exposure time of the tissue to the CPA, thus potentially increasing the toxicity. Therefore, successful cryopreservation requires a balance between achieving low enough CPA concentrations to avoid toxicity while achieving high enough cooling and warming rates to exceed the CCR and CWR of the system, respectively.
Table 1.
Properties of the three most common CPAs (DP6, VS55, and M22)
To date, all of the CCRs in Table 1 have been achieved for bulk tissue systems.[13c, 14] On the tissue level, carotid arteries have been successfully vitrified using DP6 and VS55 [13c, 15], and on the organ level, whole rabbit kidneys have been vitrified using M22.[14b] While vitrification and rewarming have been successfully achieved in up to 1 mm-thick tissue systems,[13a, 13c, 15] no applications beyond this thickness have been successful due to the physical limitation of conventional rewarming processes. There are two reasons for this. First, as with CCRs, CWRs are inversely related to CPA molarity, but are orders of magnitude higher than the CCR (see Table 1). Secondly, the rewarming has to be spatially uniform enough to avoid cracking due to thermal stress.[16]
A conventional water bath is the gold standard for rewarming vitrified tissues at rates between 60 and 150 °C/min.[13a, 15, 17] However, as the thickness of the tissue increases, heat and mass transfer limitations result in warming rates lower than the CWR at the center of the preserved tissue. Thus, finding a technology that enables rapid, uniform warming is the key to successfully cryopreserving and recovering thicker arteries.[12c] Other rewarming technologies have been attempted including microwave, nanowarming, and metal form warming. In the case of microwave warming, heat is generated volumetrically and at a much faster rate than convective warming since electromagnetic fields heat the tissue by dielectric coupling. However, dielectric properties of tissues are very temperature- and tissue-dependent,[18] which can easily lead to “hot spots” and therefore non-uniform heating and/or thermal run away. [4b, 19] Nanowarming generally includes laser nanowarming and radiofrequency (RF) nanowarming. Laser nanowarming using India ink or gold nanoparticles can generate warming rates up to 107 °C/min and has been applied to successfully cryopreserve small scale biological samples, e.g. oocytes and embryos.[20] However, laser nanowarming will be very difficult to scale up to cryopreservation of tissues and organs. RF nanowarming, on the other hand, can be applied to both small scale (e.g. oocytes) and large scale (e.g. carotid artery) biological systems.[13c, 21] RF nanowarming using iron oxide nanoparticles (IONPs) under alternating magnetic fields (AMFs) can generate volumetrically more uniform heat from hysteresis attributed to Néelian, Brownian relaxation, or Ferromagnetic domain wall motion in the distributed nanoparticles.[22] Heating rates depend on IONP properties, nanoparticle concentration, and magnetic field strength and frequency, with typical values reaching several hundred °C/min in cryopreserved tissue samples. RF nanowarming is a promising application in thin tissues to perfusion loaded organs. For instance, it has been applied to the cryopreservation of 1 mm thick porcine carotid arteries.[13c] However, due to the current limitations in warming rates achieved (hundreds of °C/min), high molarity CPA loading throughout the tissue is required, which implies a complicated relationship between diffusion loading and toxicity, as discussed further in this paper.[14c] Thus, faster forms of heating are still urgently needed in the field.
Metal forms (illustrated in Figure 1), due to their high induced eddy current, provide a promising approach to rewarm thin or thick tissues at rates in excess of 1000 °C/min as demonstrated by Manuchehrabadi, Shi et al using metal foils, foams, and meshes.[14c] Radiofrequency AMF induces circular eddy currents in conductors with concurrent resistive losses that generate heat. These fast rates can benefit thin tissue cryopreservation by minimizing CPA concentrations and thick tissue cryopreservation where only partial loading of CPA is possible in the central zone of the tissue.
In this paper, we achieved a heating rate of 2000 °C/min by using Al foil metal form heating and successfully vitrified and rewarmed 2 mm thick porcine aortas (Figure 1). We also established a model factoring in both diffusional CPA loading and heating under AMF to predict the success of cryopreservation, which agrees with the 1–2 mm thick porcine artery experimental data. This model can be further applied to design loading and heating protocols for other tissue systems across the field.
2. Results and Discussion
2.1. CPA loading
2.1.1. µCT results
We studied CPA diffusion behavior using μCT by calibrating to arteries equilibrated to varying concentrations of CPA and then monitoring cases of dynamic CPA loading to estimate the diffusion coefficient. Figure 2 shows the μCT measurement of three CPAs with various concentrations (0–100%) and the three arteries saturated with CPAs for the corresponding concentrations. Figure 2a shows the calibration curves of three CPA solutions. Note that the carrier solutions of the tested CPAs are different: Euro-Collins (carrier solution of VS55 and DP6) showed a higher Hounsfield units (HU) value than LM5 (carrier solution of M22). DP6, VS55 and M22 are made from different components and each component has a specific attenuation of X-ray;[23] therefore, even at the same molarity, different cocktails show different HU values. For instance, DP6 and VS55 are both diluted in EC, so they have the same HU value at 0 molarity. However, DP6 is composed of 3M DMSO and 3M propylene glycol (PG), while VS55 is composed of 3.1M DMSO, 2.2M PG, and 3.1M formamide, thus leading to different HU at the same molarity.
Figure 2.
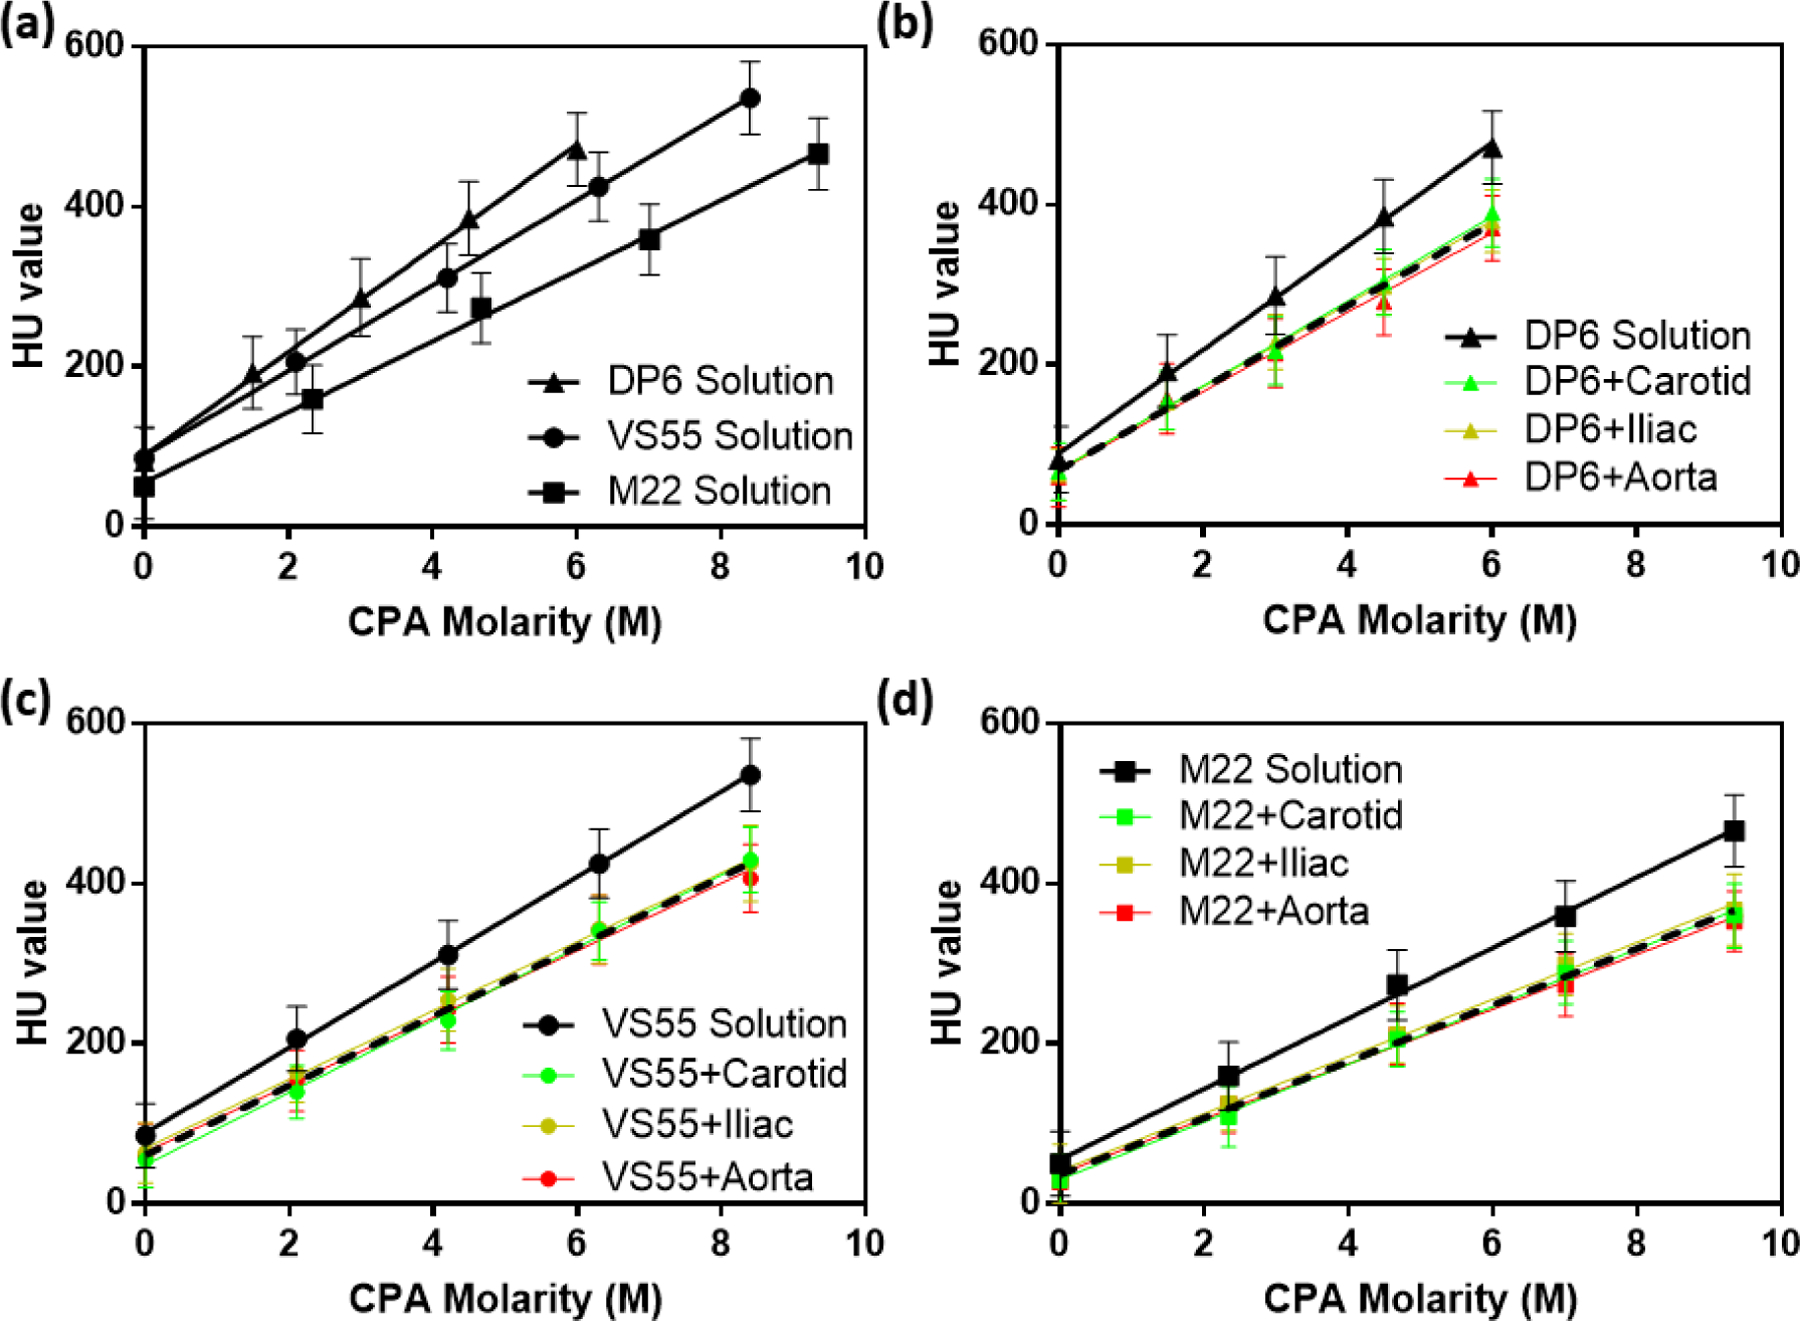
HU obtained by μCT for diluted CPA solutions (0, 25, 50, 75, and 100%) and CPA-equilibrated arteries. (a) Three cocktail CPAs. (b) DP6 solution and DP6-diffused arteries. (c) VS55 solution and VS55-diffused arteries. (d) M22 solution and M22-diffused arteries. Black solid lines represent CPA solutions without arteries, green lines represent CPA-equilibrated carotid arteries, yellow lines represent CPA-equilibrated iliac arteries, and red lines represent CPA-equilibrated aortas. Black dash lines represent the pooled curves for all three types of arteries equilibrated with the same CPA.
Figure 2b–d show curves of each type of CPA solution and 3 types of arteries diffused by the corresponding CPAs. All the CPA-saturated tissues showed smaller HU than the CPA solutions at the same CPA concentration. All the calibration curves in Figure 2 show a very good linear relationship between HU and CPA molarity, which provides the foundation for determining the CPA concentration inside the tissue after step-wise loading. We further explored the similarity of the three types of arteries diffused with the same CPA, and the results appeared to be independent of artery type (plotted as the dotted lines in Figures 2b–d).
CPA permeation kinetics were studied experimentally with μCT by modifying previous methods.[13c] Figure 3a shows the CPA-diffused arteries at different concentrations in pseudocolor image using the iliac arteries diffused by DP6 as an example (VS55 and M22 data is shown in Figure S1). HU values are uniform inside the arteries, which indicates the equilibration of CPA diffusion. Figure 3b shows the pseudocolor image of the arteries after 15 min step-wise loading (one CT scan takes 30 min to finish, we started the scan at the beginning of the last loading step and finished 15 min after the loading. Thus, the signal for one point will be the average of the start time point and end time, which is assumed to represent the signal at the middle time point, i.e., the end of the 15 min loading). By using ImageJ (NIH), we obtained grayscale value of 30 lines along the artery cross section, calculated the average, and converted into HU. Referring to the corresponding calibration curve, we were able to obtain the CPA distribution inside the tissue from the HU value. The black line in Figure 3c shows the obtained CPA distribution in cross-section view. Using COMSOL to model the diffusion curve by varying the diffusion coefficient, the best fit diffusivities for DP6, VS55, and M22 are 6.4 ± 0.2, 7.0 ± 0.3, 6.7 ± 0.3 ×10⁻¹¹ m2/s, respectively (n=3 for each type of CPA). The statistical analysis did not demonstrate a significant difference between the measured diffusivities of the three CPAs (p=0.0679 for DP6 and VS55 diffusivities comparison, p=0.5015 for DP6 and M22 diffusivities comparison, and p=0.3034 for VS55 and M22 diffusivities comparison). To keep the model’s simplicity, we used 6.5 ×10⁻¹¹ m2/s as a representative diffusivity which can fit well to the concentration curves of all three types of CPAs. This is reasonable since these CPAs are comprised of similar components and in some cases are derivatives of each other (i.e. DP6 is VS55 without formamide).[4a, 24] However, the slight differences in diffusivity values could be studied further, if higher resolution modeling was required.
Figure 3.
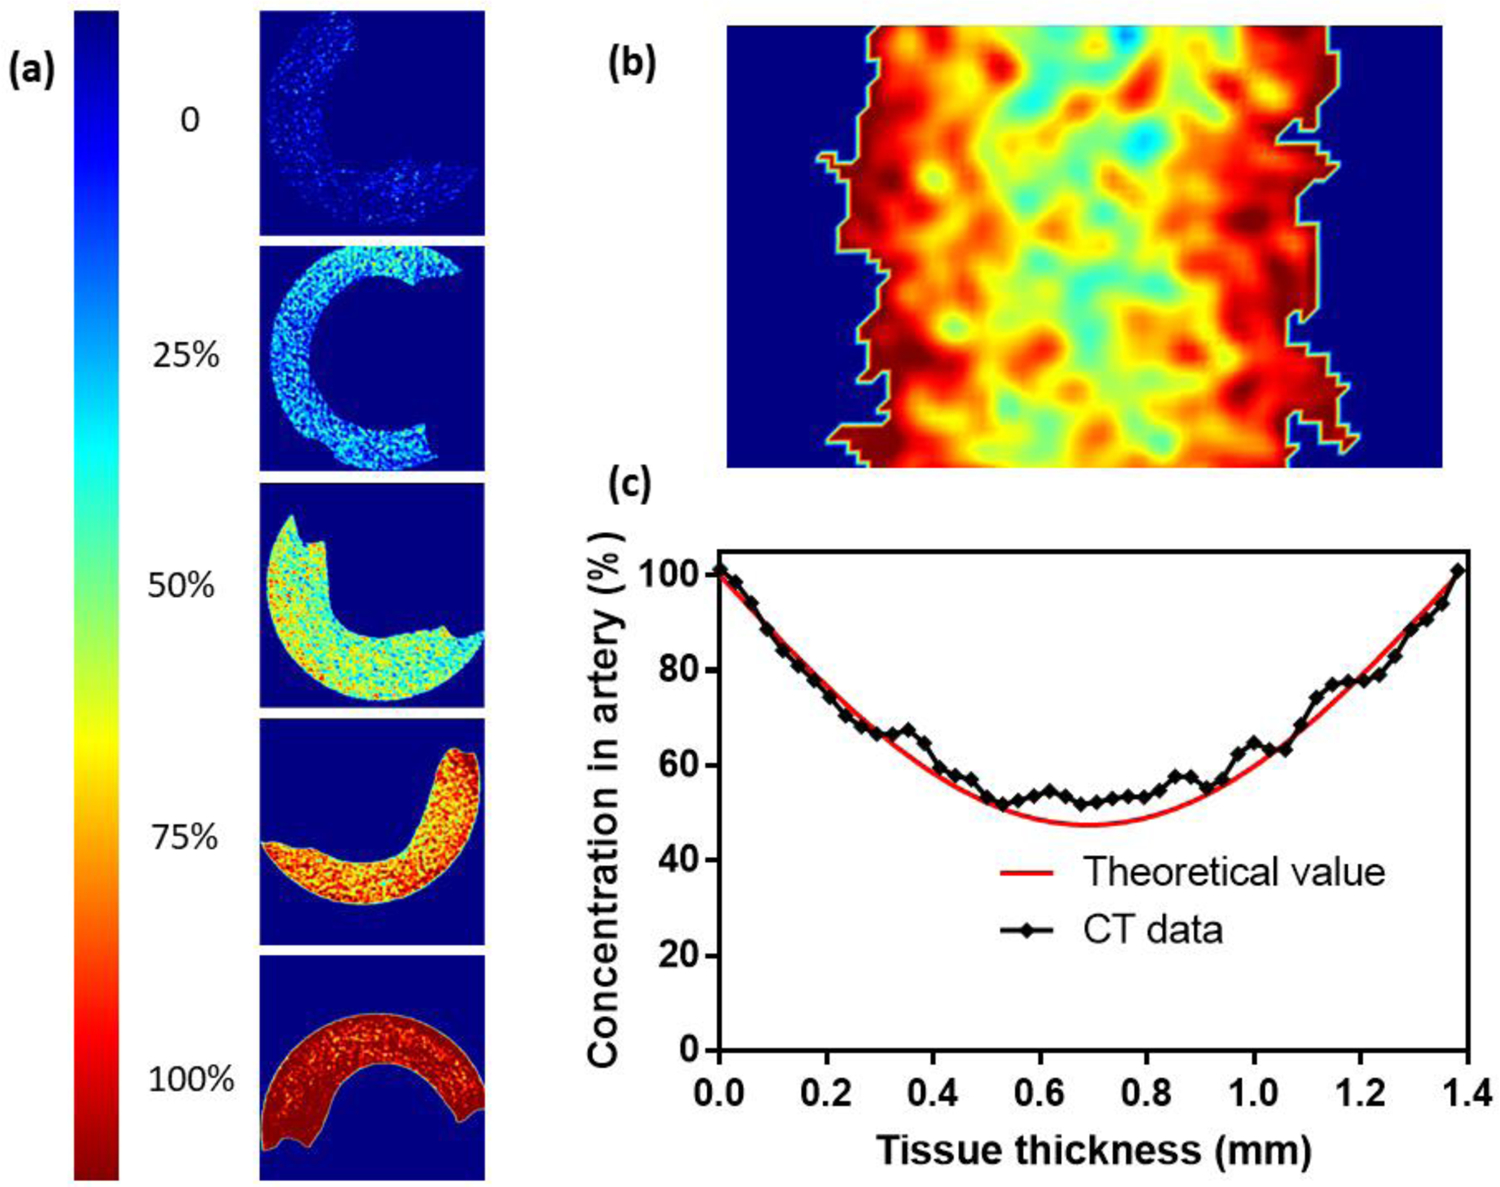
Pseudocolor images for CPA equilibrated tissues and CPA concentration distribution after step loading. (a) Pseudocolor image for arteries diffused by diluted CPA (0 – 100%, 0 means carrier solution (Euro-Collins or LM5) only and 100% represents full strength CPA in carrier solution), here we present iliac arteries equilibrated with DP6 as an example. (b) Pseudocolor image for CPA distribution inside the arteries after 15 min step-wise loading. (c) Values for CPA distribution on cross section obtained by µCT compared to theoretical values. Here we present concentration curve of DP6 loaded iliac artery as an example (both b and c). The best fit diffusivity value for this sample is 6.5 ×10⁻¹¹ m2/s, R2 = 0.97.
2.1.2. Diffusional loading of CPA
Figure 4a shows the cross-section of the 1D planar CPA diffusion model. The modeled arteries have thicknesses ranging from 1mm to 2mm. All arteries were loaded and unloaded with CPA in a step-wise manner (Figure 4b) by passive diffusion. Based on the diffusion coefficient obtained by μCT, the CPA concentration distributions in the arteries predicted by the diffusion model after the last loading step are shown in Figure 4c. For all arteries, the center regions of the arteries have the poorest loading with CPA (lowest concentration). Our predictions suggested that by using 15 min step-wise loading for a 1 mm-thick carotid artery, the center would achieve 60% equilibration with full strength CPA. For a 1.5 mm-thick iliac artery, this value would be only 30%, while 2 mm-thick aortas would be less than 20% equilibrated with full strength CPA in the center. Extending the loading time to 20 or 25 min for each loading step greatly increased the final concentration after step loading, which will be beneficial for thick artery vitrification and rewarming.
Figure 4.
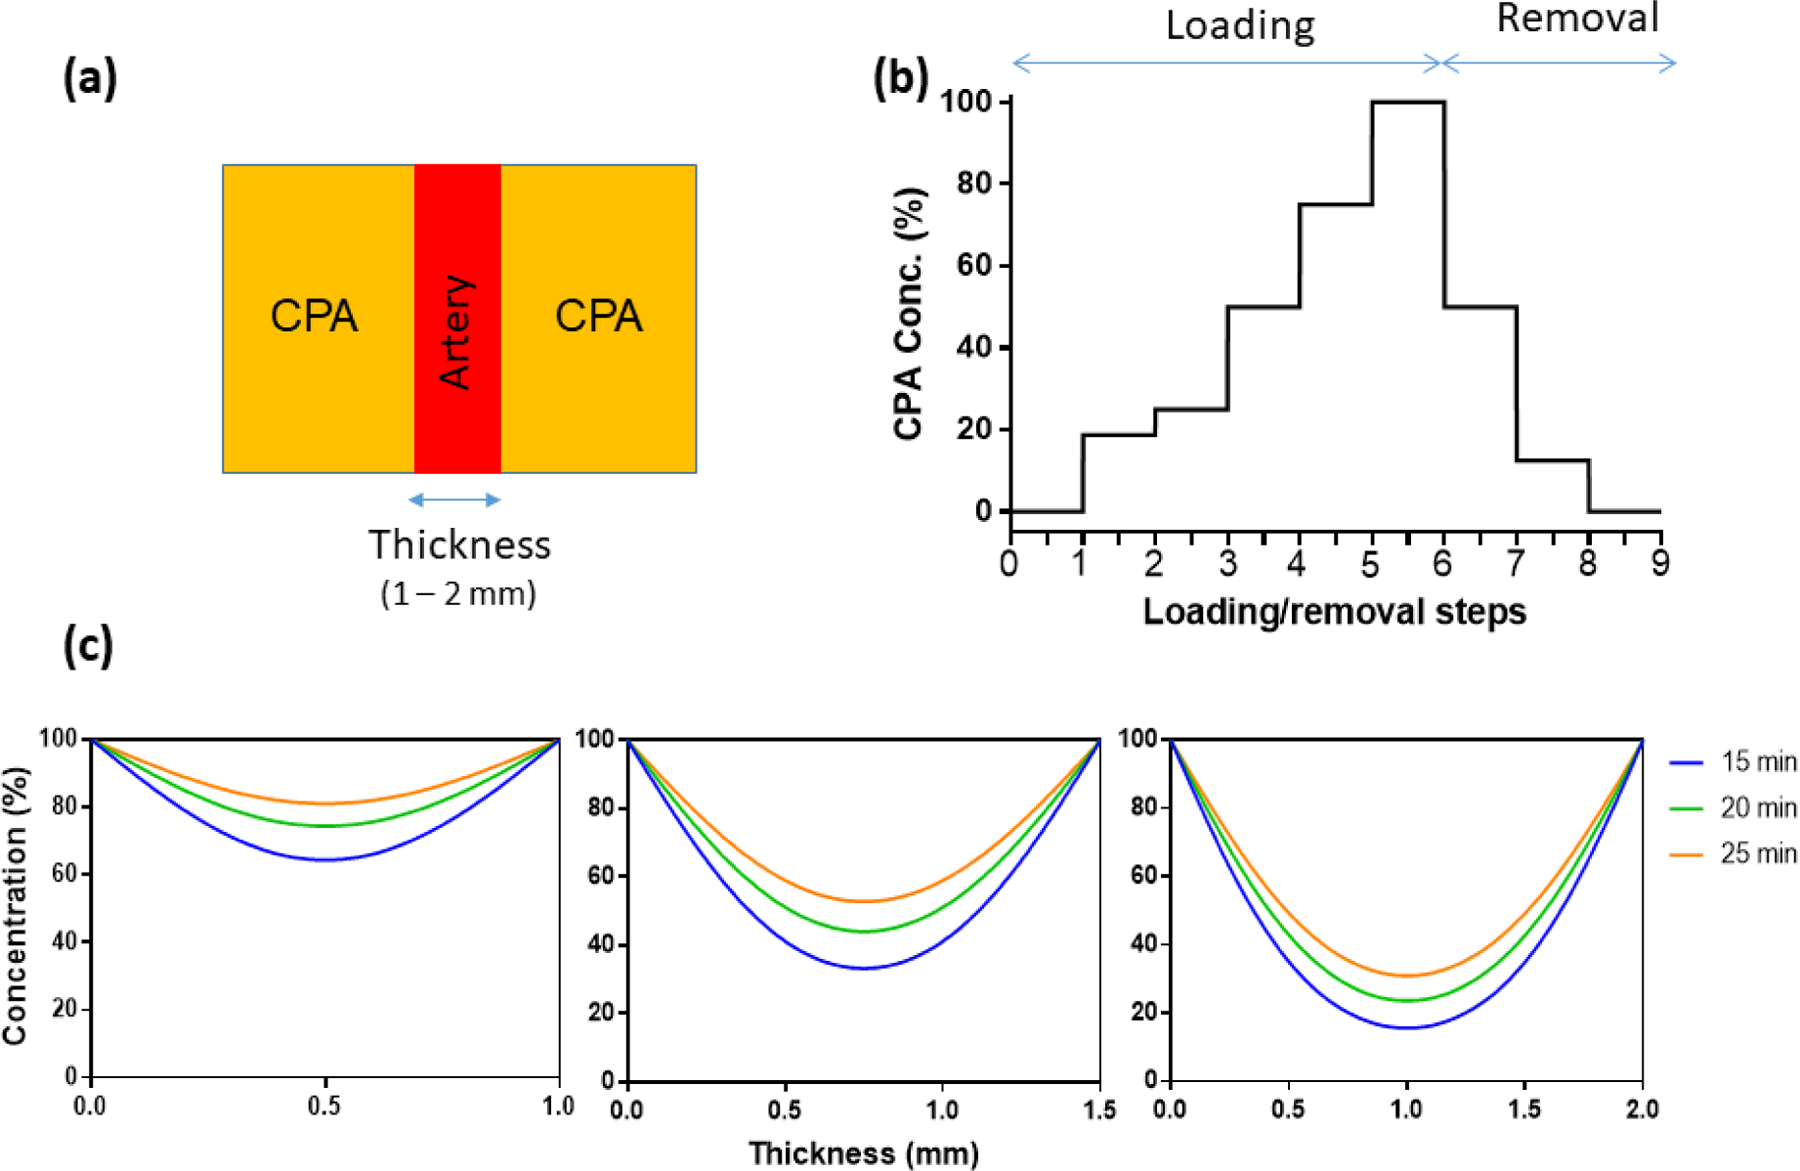
CPA diffusion of arteries: diffusion geometry, diffusion boundary conditions, and diffusion results. (a) 1D geometry of arteries and surrounding CPA, cross-section view. (b) Concentration of CPA at every step during step-wise loading and removal. Concentrations are 0, 18.7, 25, 50, 75, 100% for loading, and 50, 12.5, and 0% for removal. (c) CPA distribution after step-wise loading (D = 6.5 ×10⁻¹¹ m2/s) with different time spans for carotid arteries (1mm), iliac arteries (1.5mm) and aortas (2mm).
2.2. CCR and CWR vs. CPA concentration
CCR and CWR mainly depend on CPA formulation and concentration. In general, for a given CPA, lower concentrations require high cooling rates and even higher warming rates to avoid ice formation.[25] In Figure 5, we included the CCRs and CWRs of the three CPAs at full strength and fitting as discussed previously,[26] which combined more than 150 data points of more than 10 types of CPAs to predict the behavior of CPA cocktails (the figure in the published work was re-plotted in Figure S2). The fitting equations are displayed on the figures, which can be used to predict the required cooling and warming rates given CPA concentrations in the absence of directly measured data at lower concentrations.
Figure 5.
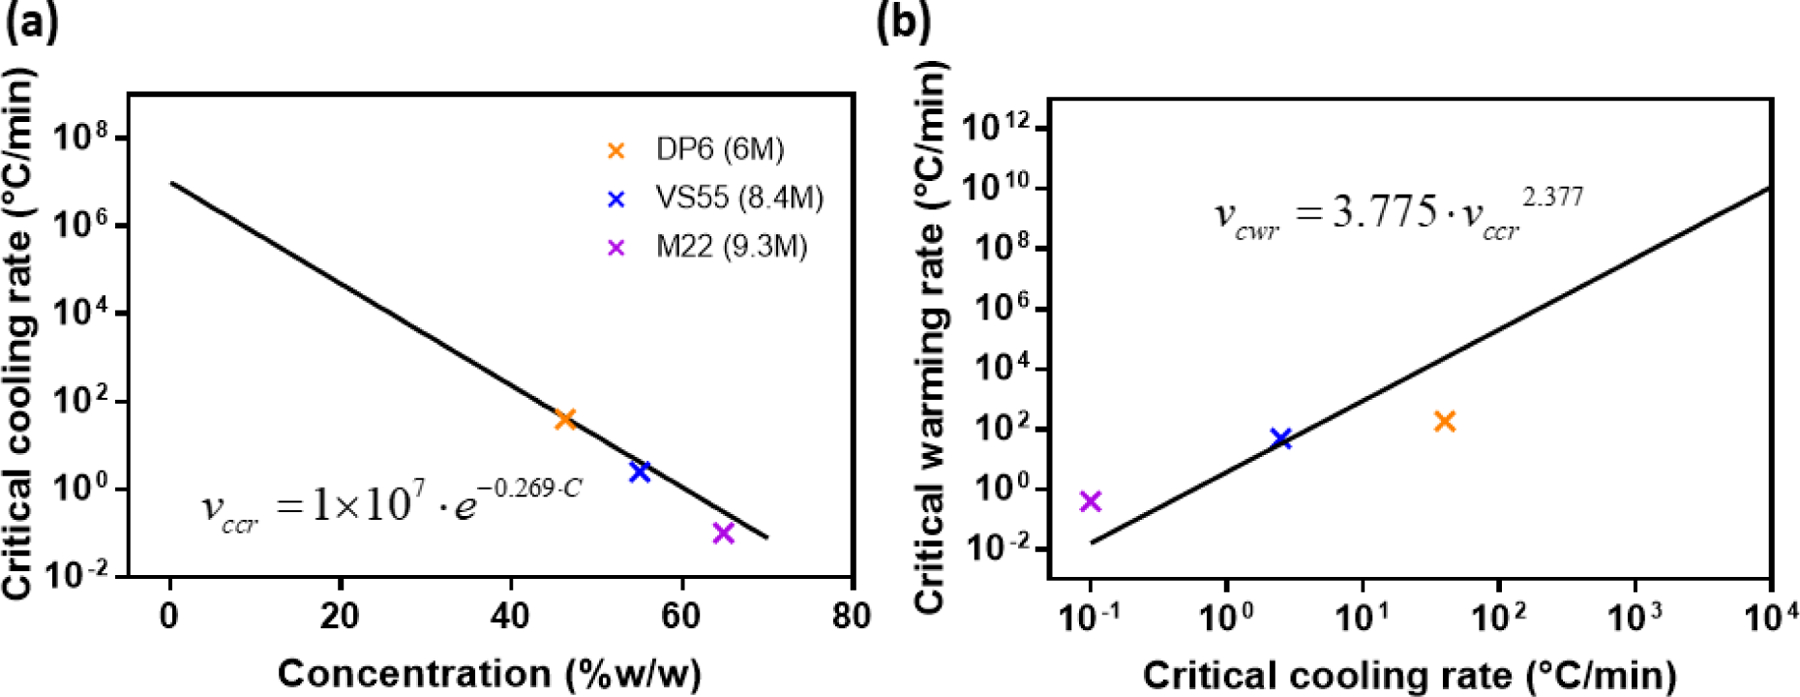
(a, b) CCR and CWR data points for full concentration CPA cocktails and the fitting curve obtained from previous research.[26]
2.3. Model prediction, experimental warming rates and viability data
Metal form warming at two different magnetic field strengths was tested as a means of obtaining ultra-rapid warming rates. From Figure 6a, the RF nanowarming approach can achieve a warming rate of 130 °C/min (20 kA/m) in CPA solution, which is faster and more uniform than the gold standard water bath convective warming approach.[13a, 15, 17] The ultra-rapid Al foil heating approach yielded an order of magnitude higher warming rate of approximately 1300 °C/min in CPA solution (measured by thermocouple at the CPA-tissue interface) at a magnetic field strength of 20 kA/m. By increasing the field strength further to 30 kA/m, Al foil heating can achieve a warming rate over 2000 °C/min.
Figure 6.
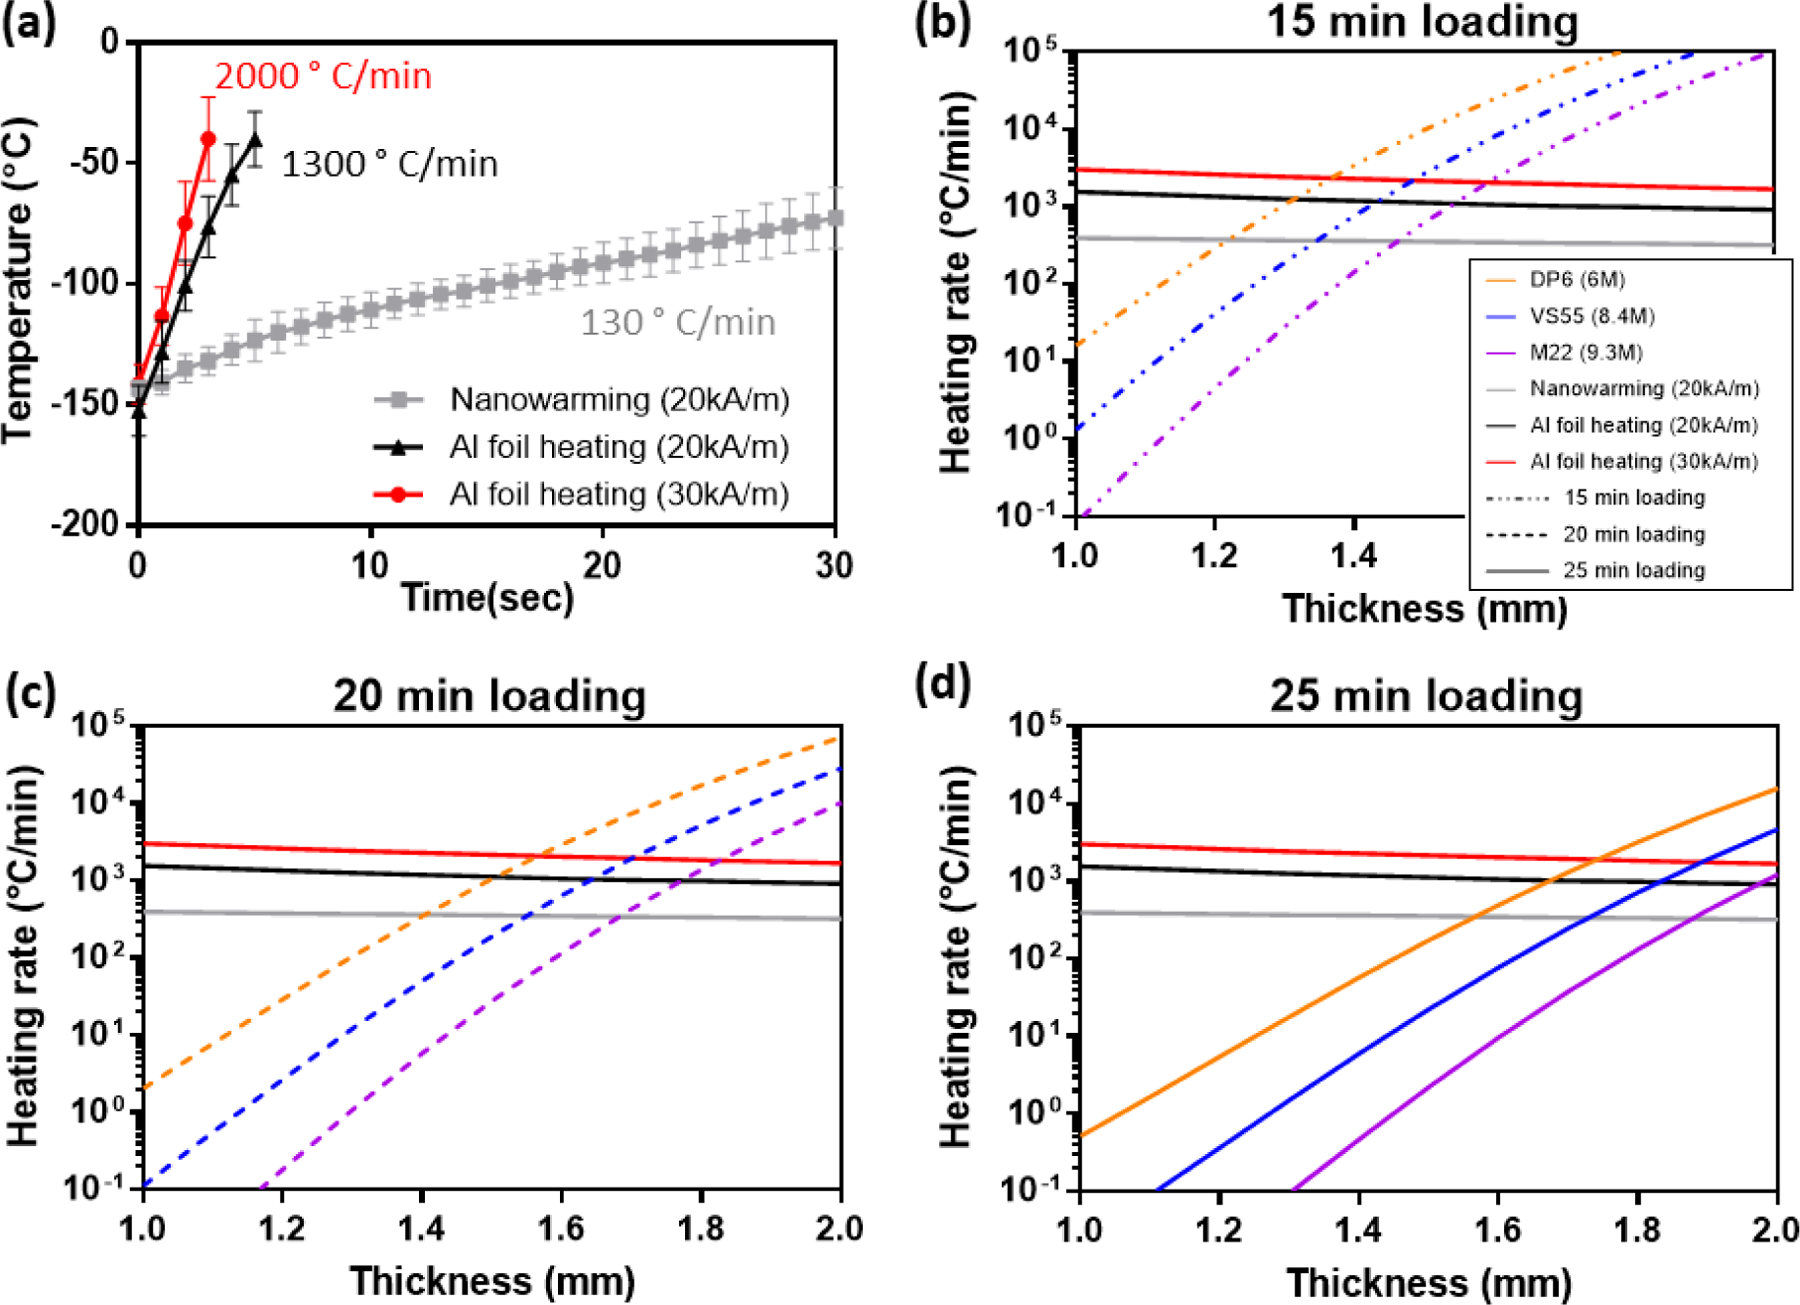
Thermal history for heating rates determination and model predictions results. (a) Heating rates for nanowarming (20 kA/m) and Al foil heating at 2 different magnetic field strengths (20 and 30 kA/m). (b–d) Required CWR using 3 types of CPAs after 15–25 min step-wise loading (dot dash line = 15 min, dot line = 20 min, and solid line = 25 min) and the heating rates obtained by nanowarming (20kA/m) and Al foil heating at 2 magnetic field strengths (20 and 30kA/m).
The specific absorption rate (SAR, W/m3) value was estimated with CPA between the metal forms and a thermocouple placed within the CPA. We assume that this SAR value will remain the same for the tissue case and have applied it directly in the model. An average volumetric SAR of the metal form was determined by an iterative fitting method from the experimental heating history curve. To predict the heating rates that might be achieved in the center of the rewarmed tissue using Al foils, we built a 1D finite-element model in COMSOL (heat transfer module) where there’s only CPA in between the Al foils, and we adjusted the SAR value for the metal form in the model to match the experimental heating curve to obtain an estimated SAR value for the metal form. Neglecting the radial effect in the Al foil layer (that is, assuming a uniform volumetric heating source inside the Al foil), we obtained the values of SAR at two field strengths: at 20 kA/m, SAR equals 350 ×106 W/m3, and at 30 kA/m, SAR equals 650 ×106 W/m3. Then the SAR values were substituted in the computational model where arteries were added between the Al foils, allowing us to calculate the heating rate in the center region of the arteries. Due to the difference of heat transfer parameters between CPA and the arteries, the heating rates in the arteries are slightly lower than those in the CPA solution. Moreover, due to diffusional heat-transfer limitations, the center regions of thicker arteries experience a lower warming rate.
Based on the CPA concentration results calculated by the diffusion model and the relationship between CPA molarity and CWR, we predicted the required CWR in the center region diffused by DP6, VS55, and M22 separately for 15, 20, or 25 min step-loading for arteries with thicknesses ranging from 1 mm to 2 mm, as plotted in Figure 6(b–d). The warming rates that can be achieved in the center regions of the 1–2mm arteries by RF nanowarming (20 kA/m) and metal form heating at two magnetic field strengths (20 kA/m and 30 kA/m) were also plotted in Figure 6(b–d), represented by different colors. The thickness (and therefore size/volume) of the sample has been accounted for in our model by using different tissue thickness in equation (2). One can note the slight drop in warming rates as the thickness (size/volume) increases in Figure 6. The intersections between the CPA curves and the heating curves is the predicted limiting case; i.e., the thickest artery that can be rewarmed without devitrification in the given choice of CPA, loading step duration, and heating rate.
To validate the model and to successfully cryopreserve and rewarm the 1.5-mm thick iliac arteries and 2-mm thick aortas, we used multiple CPA loading and heating protocols. All the model predictions were in agreement with the alamarBlue viability data obtained experimentally, thus validating the model. In Figure 7a, we presented the successes of rewarming 1mm and 1.3 mm carotid arteries, 1.5 mm iliac artery, and 2 mm aorta by applying different loading and heating protocols. Carotid arteries were loaded with DP6 for 15 min step-wise loading and heated by Al heating at 20 kA/m. Iliac arteries were loaded with M22 for 15 min step-wise loading and heated by Al heating at 20 kA/m. Aortas were loaded with M22 for 25 min step-wise loading and heated by Al heating at 30 kA/m.
Figure 7.
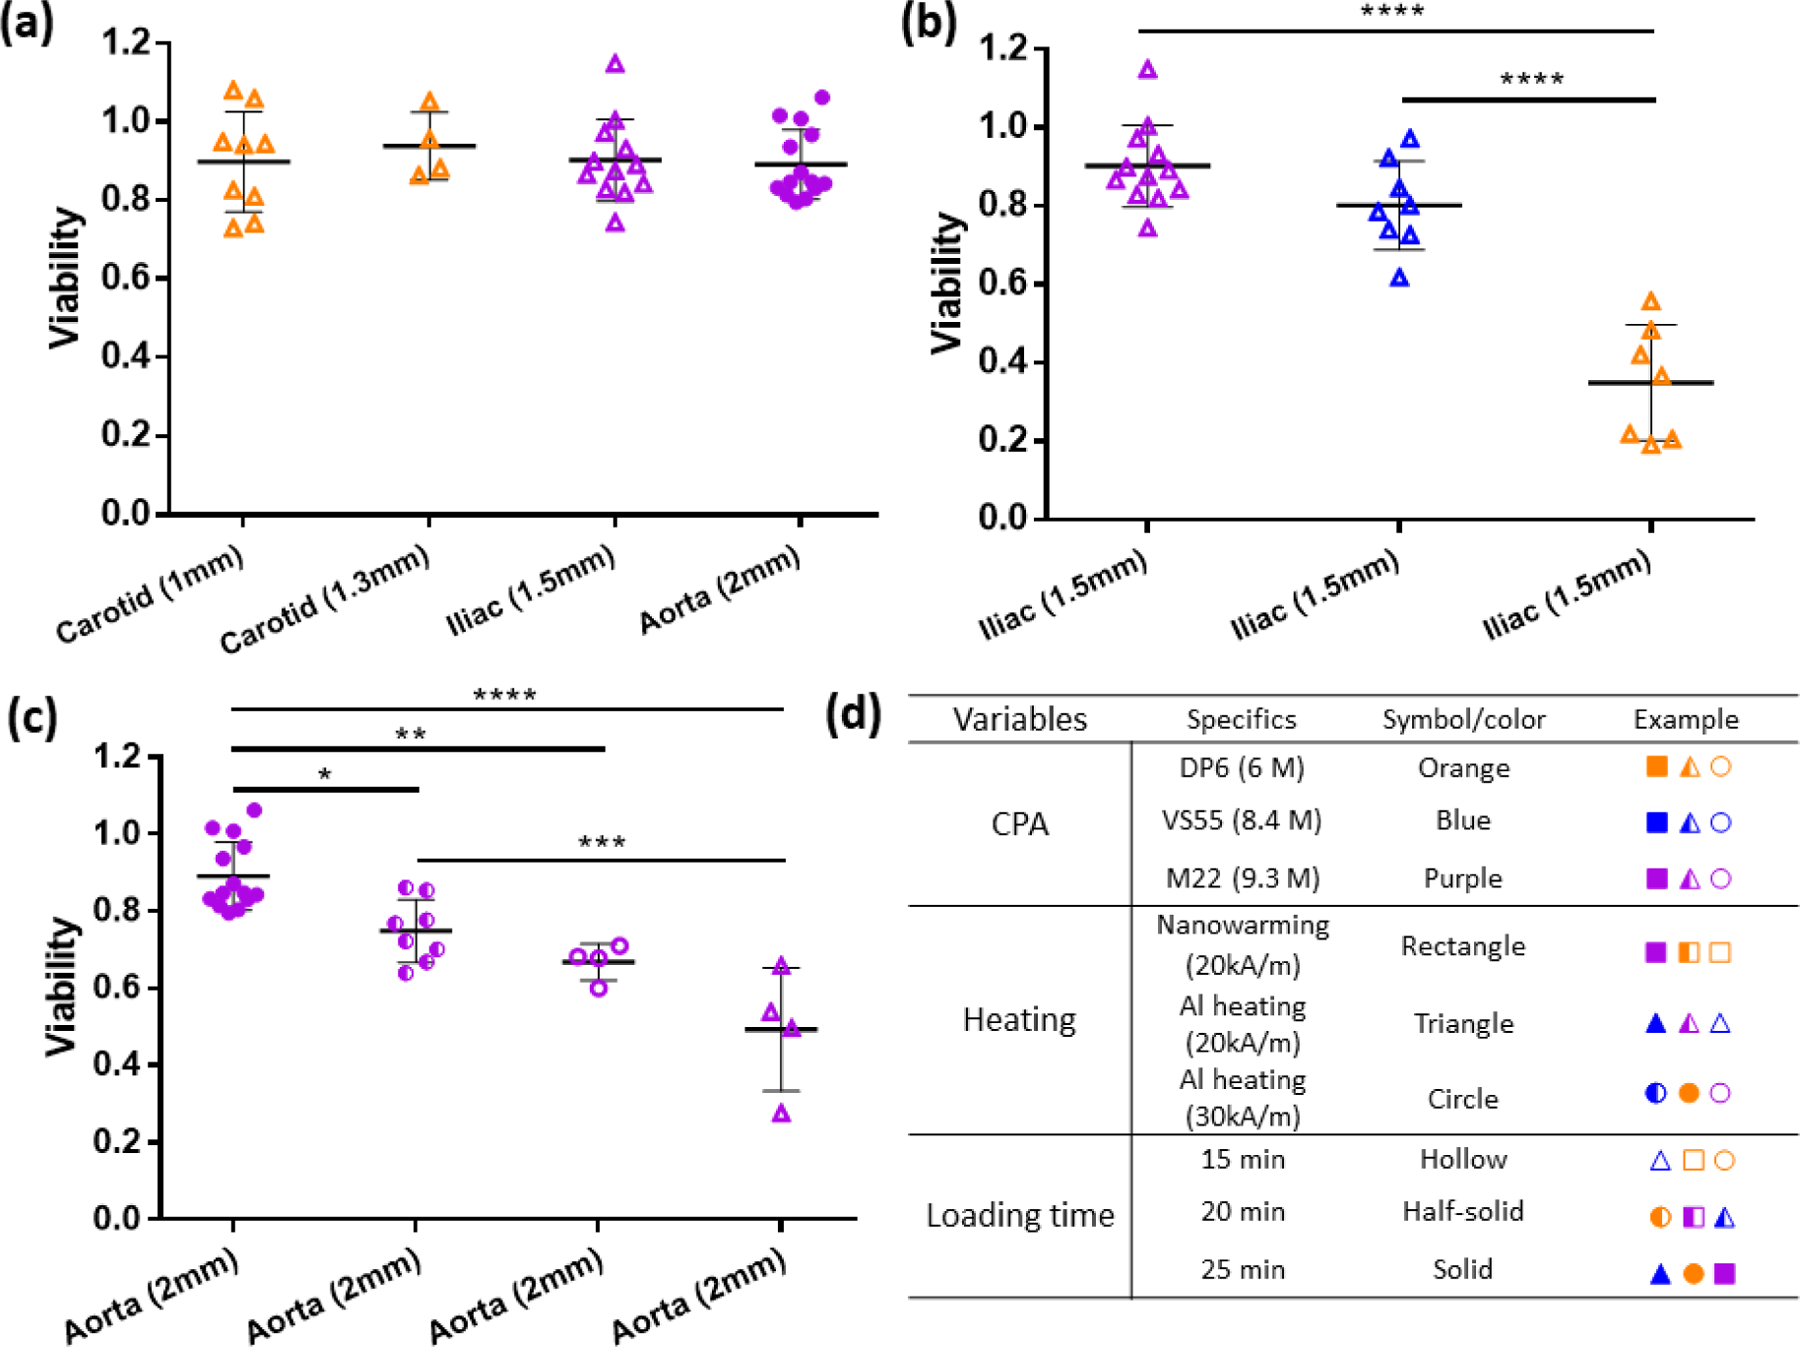
Viabilities for arterial tissues with various thickness (1–2 mm) using different loading and heating protocols. (a) Viabilities for the first cases of successful cryopreservation of 1.3 mm-thick carotid arteries, 1.5 mm-thick iliac arteries, and 2 mm-thick aortas using different CPA loading+heating combinations (n=4 to 14). (b) Viabilities for 1.5 mm iliac arteries after cryopreservation by using Al heating at 20kA/m and 15 min step-wise loading, but with different CPAs (n=7 to 12). (c) Viabilities for 2 mm aortas after cryopreservation using M22 but different heating rates and loading times (n=4 to 14). Data presented as mean ± SD, p-values are calculated using one-way ANOVA with Tukey’s multiple comparison tests, * p < 0.05; ** p < 0.01; *** p < 0.001; **** p < 0.0001. (d) Table for the symbols used in the viability figures.
Figure 7b shows viabilities of iliac arteries treated by different CPA loading by alamarBlue. Maintaining the loading time as 15 min for each step and Al heating at 20 kA/m, we tried different CPAs to cryopreserve 1.5 mm iliac arteries. Using DP6 resulted in a viability of < 40%, VS55 brought viability up to ~80%, and M22 increased viability even further to ~90%. These experimental results agreed with the model prediction shown in Table 2. Applying the combination of 15 min stepwise loading and Al heating at 20 kA/m, we can cryopreserve 1.30, 1.40, and 1.50 mm arteries using DP6, VS55, and M22, respectively.
Table 2.
Model predicted maximum limit for tissues with a combination of CPA loading + heating
| Modeling max limit (mm) | ||||
|---|---|---|---|---|
| CPA╲Heating | Nanowarming (20kA/m) | Al foil heating (20kA/m) | Al foil heating (30kA/m) | |
| 15 min loading | DP6 (6 M) | 1.20 | 1.30 | 1.35 |
| VS55 (8.4 M) | 1.35 | 1.40 | 1.45 | |
| M22 (9.3 M) | 1.45 | 1.50 | 1.55 | |
| 20 min loading | DP6 (6 M) | 1.35 | 1.50 | 1.55 |
| VS55 (8.4 M) | 1.55 | 1.60 | 1.65 | |
| M22 (9.3 M) | 1.70 | 1.75 | 1.80 | |
| 25 min loading | DP6 (6 M) | 1.55 | 1.65 | 1.70 |
| VS55 (8.4 M) | 1.70 | 1.80 | 1.85 | |
| M22 (9.3 M) | 1.90 | 1.95 | > 2.00 | |
Figure 7c presents the viabilities for 2 mm aortas treated by different loading and heating protocols. Keeping the CPA as M22, we first tried 15 min stepwise loading and Al heating at 20 kA/m, with the resulting viability ~50%. 15 min loading and Al heating at 30 kA/m brought the viability up to 70%, 20 min loading and Al heating at 30 kA/m increased the viability to 80%, and finally 25 min loading and Al heating at 30 kA/m showed viability of 90% by alamarBlue. Again, the experimental data agreed with the tissues thickness limit shown in Table 2, corresponding to 1.50, 1.55, 1.80, and 2 mm, respectively.
2.4. Histology data
Histological examination of H&E stained sections of aorta showed subtle changes in the more central regions of the tunica media of vitrified compared to control aortas, with effects on spacing of elastic lamellae and on smooth muscle cells, as shown in Figure 8. Specifically, increased separation between elastic lamellae was observed, an effect possibly related to tissue alterations during CPA loading/unloading or possibly a small amount of ice crystal formation (i.e. in tissue middle with least CPA loading). In addition, intervening smooth muscle cells often had shrunken, pale-staining, faintly granular cytoplasm and dark, condensed, hyperchromatic nuclei, findings that are suggestive of damage to, or possible death of, cells. No clear evidence of acute cell death (e.g. lytic or coagulative necrosis) was observed however. In addition, elastic lamellae in vitrified aortas were often faintly hypereosinophilic to hyalinized in appearance. No specific histological finding was observed at the metal form-tissue interface. More H&E figures supporting the findings are shown in SI, Figure S3–8. The interpretation of these changes was not altered after examination of sections stained with Masson’s trichrome or Verhoff’s van Gieson stains. The ultimate functional significance of our current findings is unclear however, and clarification will require transplant studies.
Figure 8.
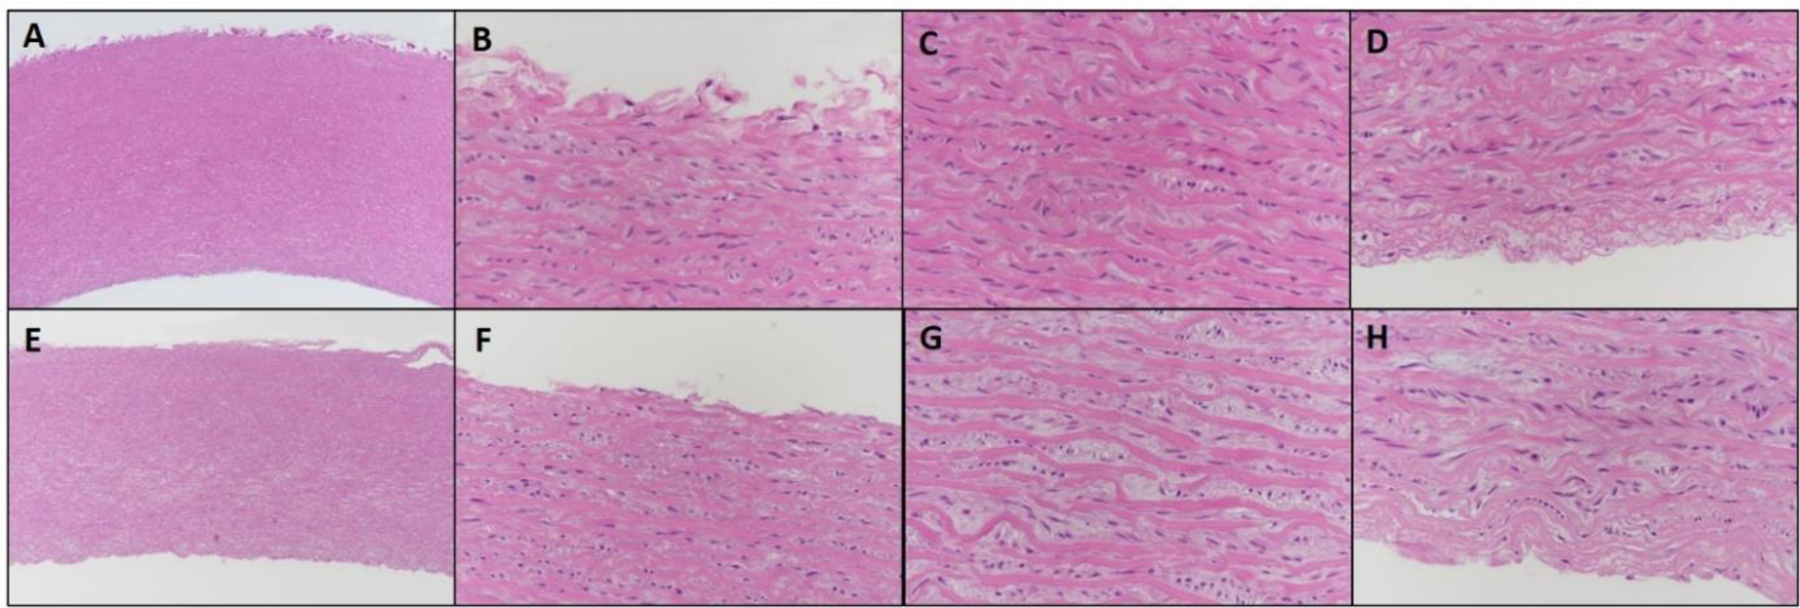
H&E images of 2 mm thick control vs. vitrified aorta at 5x and 40x magnification. A–D: Control aorta. E–H: Vitrified aorta. A, E. Low magnification cross section of arteries (5 x). B, F: Tunica adventitia (40x). C, G: Tunica media (40x). D, H: Tunica intima (40x). Vitrified tissues show increased separation between elastic lamellae, compared to control tissues, and smooth muscle cells have shrunk, granular cytoplasm and dark, hyperchromatic nuclei. In vitrified tissues, this change is more often observed and more pronounced in the middle of the tunica media (G), as compared to the edge of the tunica media near the intima and adventitia (F, H), but is not entirely absent. Elastic fibers in vitrified tissues in general have slightly variable staining, often with more intense eosinophilia and faint hyalinization.
2.5. Application to other tissue systems
We developed a theoretical model combining mass and heat diffusion to predict the success of rewarming vitrified arteries with varying thicknesses, which was also experimentally validated by the results on porcine carotid and iliac arteries and aortas. Experimental results in agreement with model predictions (Figure 6 and 7) demonstrated a promising approach to cryopreserving and rewarming a wide variety of tissue systems (Table 3). With the benefit of an ultra-rapid 2000 °C/min heating rate, we speculate that we can cryopreserve thin tissues with the least amount of CPA or use full strength CPA to cryopreserve thicker (2 mm and perhaps beyond) tissues. We are particularly interested in tissues such as skin, cartilage, and precision-cut organ slices where viability is traditionally low (50 – 80%) in conventional cryopreservation, compared to our 90% after vitrification and rewarming.[27]
Table 3.
Summary of the potential application tissue systems
| Tissue | Thickness | Current dilemma | Where our model can help |
|---|---|---|---|
| Skin | 0.3 – 2.5 mm | Diffusion limit | Modify the CPA loading protocol |
| Cartilage | 1 – 4 mm | Diffusion limit | Predict the required heating rate |
| Organ slices | 0.25 – 10 mm | Balancing toxicity, CPA diffusion, and heating rate | Modify the loading protocol therefore decrease the toxicity effect |
Full-thickness skin graft consists of the epidermis and the entire thickness of the dermis, for human, the thickness could be up to 2.5 mm.[28] Stratum corneum (SC), the outermost layer of epidermis, is a tough, physical and elastic barrier, comprised of keratinized dead skin cells, which makes diffusing the CPAs to the layers beneath difficult. Therefore, most skin cryopreservation research focused on split-thickness skin (0.3 – 0.5 mm thick), but even at these thinner geometries, the viabilities after cryopreservation are only 50 – 80%.[29] Full-thickness skin grafts have less contraction compared to the split-thickness grafts, which has a distinct cosmetic and functional advantages in such applications as facial skin grafting,[30] and full-thickness skin transplantation could be applied to other body parts if readily available at high viability. Our model can guide the CPA loading protocol for full-thickness skin graft, and with the benefit of the 2000 °C/min metal form heating, it is promising to cryopreserve human full-thickness skin grafts.
The success of cartilage cryopreservation, similar to skin grafts cryopreservation, depends on the thickness of the tissue.[31] In order to preserve the functionality, we need to cryopreserve the full size cartilage, which can have a thickness up to 4–6 mm.[32] In previous work, the full size cartilage (6 mm) showed really poor viability (< 50%) after cryopreservation and convective warming.[33] With our model, we can predict the required heating rate based on the CPA diffusion, and with the current or further improved metal form heating, we can potentially cryopreserve full size cartilage.
Cryopreservation of precision-cut tissue slices would significantly expand the availability of in vitro human models for predicting in vivo drug metabolism and toxicity.[27] The thickness for the tissue slices ranges from 0.2 to 10 mm (but mostly ~0.5mm).[34] For the thin tissue cryopreservation, the toxicity effect becomes more obvious, previous study using high concentration CPAs can only remain 50 – 80% after cryopreservation with a warming rate of 200 °C/min.[27] If we apply the metal form heating with a rate of 2000 °C/min, our model can predict a lower CPA concentration needed, which will decrease the toxicity effect.
In summary, the model which has been validated by arterial systems cryopreservation has a very promising applications in multiple tissue systems and provide a guidance for optimizing CPA loading and heating protocol.
3. Conclusion
We achieved maintenance of viability after vitrification and rewarming in 1 to 2-mm thick arteries using variable molarity (6 – 9.3 M) CPAs. Furthermore, at full strength CPA we are able for the first time to cryopreserve 2 mm thick porcine aortas with the help of metal forms that achieve ultra-rapid warming rates of up to 2000 °C/min. One of the limitations we encountered was even under optimal cryopreservation conditions there were histologic features that differed from control tissue. The significance of these difference is uncertain and can only be determined in further biologic characterization including in vivo transplants.
Additionally, we present a model combining diffusion and heat transfer to 1) investigate the limits of this cryopreservation approach by predicting the limiting cases, and 2) reduce CPA concentrations to a minimum in thinner tissues when faster rates from metal forms are available. The model was experimentally validated by the results on arterial tissue system (1–2 mm thick), and can be applied to other thin or thick tissue systems.
4. Experimental Section
Arteries:
Porcine carotid arteries, iliac arteries, and aortas (Figure 1a) obtained postmortem were used in this study. Porcine tissues were procured from skeletally immature domestic Yorkshire cross farm pigs (65–95 kg, aged 16– 18 weeks) from the Visible Heart Laboratory at the University of Minnesota. Arteries were removed within 30 min of sacrifice following Institutional Animal Care and Use Committee (IACUC)-approved research protocols at the University of Minnesota. Cold ischemic time was 2–3 hours in Krebs-Henseleit Buffer placed on ice. The arteries were sectioned into segments ~ 1cm in axial length. The carotid arteries wall thicknesses were 1.1 ± 0.2 mm thick, iliac arteries were 1.5 ± 0.1 mm thick, and the abdominal aortas were 2.1 ± 0.2 mm thick, measured by calipers. Fresh artery segments were rinsed with DMEM (Dulbecco’s modified Eagle’s medium, Thermo Fisher) with 1% antibiotic-antimycotic (Thermo Fisher), and adherent fatty tissue was resected and discarded. Fresh arteries were incubated at 37 °C for 3 hours for viability testing in alamarBlue. Arteries were then loaded with CPA in a step-wise manner as previously reported.[13, 17] After the last step of the loading process, the artery was placed between two aluminum foils to create an Al-Artery-Al sandwich structure (Figure 1b), and the sandwich structure was put into a cryovial filled with full concentration CPA and vitrified in a Dewar storage flask. After the cooling, warming, and CPA removal processes, the arteries then were incubated at 37 °C for another 3 hours for the second alamarBlue viability test.
Preparation of aluminum foil:
We used 0.25 mm aluminum foil (Alfa Aesar, Ward Hill, MA) made into a concentric annulus structure, as shown in Figure 1b. To ensure the two layers of Al foil could fit into the 1.8 ml cryovial (Fisher), the height of the aluminum foil hollow cylinder was made to be 13 mm. For the outer Al foil layer, the outer diameter was 9 mm, and we built the inner layer annulus structures with different diameters to ensure the arteries of different thicknesses could fit in the space between the two layers.
CPA step loading and removal:
All arteries were loaded and unloaded with CPA at 0–4 °C in a step-wise manner by passive diffusion to avoid osmotic injury and minimize toxicity.[13, 17] Loading studies showed that concentration loadings per step of 0% (CPA carrier solutions alone), 18.7%, 25%, 50%, 75%, and 100% of the CPA, were tolerated for 15 to 25 minutes of loading per step (Figure S9). [13c] DP6 and VS55 were diluted with carrier solution Euro-Collins made in the laboratory, and M22 was diluted with carrier solution LM5 purchased from 21st Century Medicine (Fontana, CA). Following CPA loading, the tissue was placed between the two concentric aluminum layers (shown in Figure 1c) and prepared for cooling and rewarming. After rewarming was complete, the arteries were immersed in 50%, 12.5% and 0% diluted CPA in a step-wise removal process using the same time increments (15 – 25 minute steps) as loading.
Cooling and thermometry:
Each 1.8 mL cryovial loaded with Al foil, an artery, and CPA were lowered into a large Dewar storage flask (1000 mL) filled with liquid nitrogen and held in the vapor phase. To achieve different cooling rates, the vials were placed at different heights above the surface of the liquid. Being closer to the surface will have a low boundary temperature and higher heat transfer coefficient therefore higher cooling rates. Vials loaded with DP6 and VS55 were placed just above the liquid surface to ensure cooling exceeding the CCRs for each CPA, while M22-loaded vials were placed about 2 cm above the surface since CCR for M22 is less stringent. Temperature was monitored using a T-type thermocouple (OMEGA Engineering, Inc., Norwalk, CT) placed in between the two aluminum foils (i.e. touching the artery sample, in the CPA solution phase). When the temperature cooled to near the glass transition temperature (−123 °C for VS55,[35] −119 °C for DP6,[36] −123.3 °C for M22[14a]), the vial was taken out of the flask for annealing a little above the glass transition temperature until the temperature held constant for a few seconds, which reduced the residual thermal stress to avoid cracking.[22, 35] Finally, we used a pair of forceps to quickly transport the cryovials from the liquid nitrogen vapor in the cooling system to a −150 °C freezer (Panasonic, Japan) within a few seconds to ensure the temperature did not exceed the glass transition for storage.
Metal foil rewarming:
We have described our ultra-rapid metal form warming technique previously, as shown in Figure 1d.[14c] In the current study, we optimized the Al foil thickness and the magnetic field (Figure S10) to achieve better heating performance. The cryovials that were stored at −150 °C were quickly transferred into the coil of a 1-kW Hotshot inductive heating system. The RF system has a 2.5–turn watercooled copper coil (Ameritherm Inc., Scottsville, NY) and was set at a magnetic field frequency of 360 kHz. Two magnetic field strengths were used: 20 kA/m and 30 kA/m (peak, volume-averaged field strength, characterized previously[13c, 37]) to achieve different warming rates. The metal forms were inductively heated in the RF field, which subsequently heat the tissue through conduction. This leads to a temperature difference from the center to edge of the artery, as shown in Figure S11. Nevertheless, the maximum temperature differential which occurs after 2.3 s is 52.1 °C, which based on Steif et al., [38] produces a thermal stress of 2.03 MPa, which is less than the critical tensile stress (3.2 MPa), thereby making cracking unlikely. A layer of Styrofoam was placed between the vial and the inner wall of the coil to reduce convective heating. The RF coil was turned off when the temperature between the Al foil layers reached −20 °C to avoid overheating and ensure that the CPA was above the melting point while still below 0 °C thereby minimizing toxicity effects that increase with temperature.[8, 14b, 24b]
μCT imaging:
μCT was used to determine the CPA concentration in the arteries.[22, 39] The samples were scanned in a μCT imaging system (NIKON XT H 225, Nikon Metrology, MI). The accelerating voltage was set 65 kV, and the current was set to 95 μA. The resolution was 0.029 mm. The X-ray attenuation is represented in Hounsfield units (HU), a clinical measurement which normalizes X-ray attenuation values by the difference between those of water and air at 20 °C. Diluted CPA solutions with Euro-Collins/LM5 ranging from 0 to 100% were imaged first to set up solution calibration curves, as shown in Figure 2a. Porcine arteries were loaded with various concentrations (0 to 100%) of CPA solutions for 1 week to ensure diffusion equilibration (the calculated characteristic diffusion time is 17 hours). The arteries were then imaged for the tissue calibration curves, shown in Figure 2b–d. The images were reconstructed to reduce the beam hardening effect and improve image quality (3D CT pro, Nikon Metrology, MI). The images were then imported as unsigned 16-bit float images, post-processed (VGstudio Max 3.2, Volume Graphics, NC), and exported as DICOM images for a final analysis using MATLAB (MathWorks). We randomly selected 3 Z slices for the analysis of each sample to decrease the noise.
The next imaging study focused on CPA distribution within the tissue after step loading. The HU value obtained for the arteries can be converted into the CPA concentrations using calibration standards described above, which exhibit a linear relationship between HU and CPA concentration. We then fit the theoretical diffusion curves by mass transfer modeling (discussed below) to the CT-obtained CPA concentration curves, to estimate the diffusion coefficient of the CPA in the arteries.
Viability studies:
Viability was assessed by incubating the tissues with 10% alamarBlue (Thermo Fisher) media solution at 37 °C for 3 hours. AlamarBlue, which functions as an indicator of mitochondria metabolic activity, has been used to assess the success and failure of cryopreservation protocols in a range of cells and tissues.[14c, 15a, 40] However, due to the semi-quantitative nature of the assay and standard deviations in the data, the average of an experimental group normalized to control can occasionally be above 1 even though there is no statistical difference from the control. While this does not invalidate the use of alamarBlue as a screening assay, it does underscore the need for more than one viability assay when performing cryopreservation protocol assessment,[41] which is why complimentary histological examination of H&E stained sections of aorta was performed on the groups (control group aortas were prepared after the cold ischemia, and vitrified group aortas were prepared immediately after removal of CPA). Based on our calculation shown in Figure S12, 3 hours is enough time for alamarBlue to penetrate 2 mm thick aorta, therefore the obtained signal represents the viability of all cells across the tissue. Fluorescence of the supernatant was read on a plate reader (Synergy HT, BioTek) at 590 nm. Arteries were incubated before and after cryopreservation with fluorescence values obtained at each point. The viabilities were calculated by the ratio of the two values from the same piece of artery.
Mass transfer model:
Since we cut open the arteries along the axial direction before we loaded the CPA, the arterial loading structure was modeled as a 1D planar diffusion model (Figure 4a). The governing equation for CPA diffusion process is Fick’s 2nd law:
| (1) |
where C is the concentration of the CPA, t is the diffusion time, x is the position point in the tissue, and D is the effective diffusion coefficient, m2/s. The diffusion coefficient was assumed to be a constant, with an estimated value of 6.5 ×10⁻¹¹ m2/s for CPA diffusion into arteries, obtained from this study (empirical fit as discussed in the Results section). The full concentration values were normalized to 1 for all the CPAs. COMSOL Multiphysics was used to compute the numerical results of the CPA concentration distribution after step-wise loading.
Heat transfer model:
The Al-Artery-Al sandwich structure heating was modeled at two different magnetic field strengths as a multi-layer cylindrical heat conduction problem. For times t > 0, energy is generated in the interior and exterior aluminum layers at a rate of SAR (specific absorption rate) [W/m3], while the energy is dissipated to the artery and surrounding CPA solution. The mathematical formulation of this heat conduction problem is given as follows. The partial differential equations for each layer are
| (2) |
where T is the temperature at a point in different layers and r is the distance from the symmetrical axis; i =1, 2, 3 indicating the interior Al layer, tissue layer, and exterior Al layer, respectively. While incomplete contact between the Al foil and artery during processing may occur, any small gaps will be filled with CPA during the final cryopreservation step. As CPA thermal conductivity and that of the CPA filled tissues are relatively similar,[42] we believe our modeling represents a reasonable representation of the process. Detailed derivation for the analytical solution is described elsewhere.[43] We assumed the thermal diffusivity (α) as independent of temperature. However, in reality, thermal diffusivity is the thermal conductivity, κ [W/(m·K)], divided by density, ρ [kg/m3], and specific heat, cp [J/(kg·K)], all of which depend on temperature. The analytical solution for this problem would be extremely complex, so we built our heat transfer model in COMSOL, where the density and specific heat are temperature-dependent. We used temperature-dependent values of density, ρ, and specific heat, cp, of VS55 (assuming DP6 and M22 behave like VS55), which were published previously,[22] and due to the lack of data, we used the thermal conductivity assumed to be a constant with a value of 0.566 W/(m·K).[44] More detailed characterization of specific CPA thermal properties is needed in the field, but this should offer an initial approximation of performance across the CPAs used.
Statistical analysis:
All the viability experiment were repeated for at least four times. Statistical significance is indicated with asterisks: * p < 0.05; ** p < 0.01; *** p < 0.001; **** p < 0.0001. Data are presented as mean ± SD, the error bars are standard deviations. The one-way analysis of variance (ANOVA) with Tukey’s multiple comparison tests (GraphPad Prism, GraphPad® Software, Inc.) was performed on viability data.
Supplementary Material
Acknowledgements
Dr. Anirudh Sharma and Dr. Zhe Gao contributed equally to this work. This work was supported by NIH R01HL135046–01. We thank the Visible Heart Laboratory’s Alex Deakyne for access to porcine arteries.
Footnotes
Supporting Information
Supporting Information is available from the Wiley Online Library or from the author.
Contributor Information
Zonghu Han, Department of Mechanical Engineering, University of Minnesota, 111 Church St. Minneapolis, MN, 55455, USA.
Anirudh Sharma, Department of Mechanical Engineering, University of Minnesota, 111 Church St. Minneapolis, MN, 55455, USA.
Zhe Gao, Department of Mechanical Engineering, University of Minnesota, 111 Church St. Minneapolis, MN, 55455, USA.
Timothy W. Carlson, Department of Veterinary Population Medicine, Comparative Pathology Shared Resource, Masonic Cancer Center, University of Minnesota, 1988 Fitch Avenue, Saint Paul, MN 55108, USA
M. Gerard O’Sullivan, Department of Veterinary Population Medicine, Comparative Pathology Shared Resource, Masonic Cancer Center, University of Minnesota, 1988 Fitch Avenue, Saint Paul, MN 55108, USA.
Erik B. Finger, Department of Surgery, University of Minnesota, 420 Delaware Street SE, Minneapolis, MN 55455, USA
John C. Bischof, Department of Mechanical Engineering, Department of Biomedical Engineering, University of Minnesota, 111 Church St. Minneapolis, MN, 55455, USA.
References
- [1].a) Neil DA, Lynch SV, Hardie IR, Effeney DJ, American Journal of Transplantation 2002, 2, 400; [DOI] [PubMed] [Google Scholar]; b) Janßen H, Janßen PH, Broelsch CE, Liver Transpl 2004, 10, 1514; [DOI] [PubMed] [Google Scholar]; c) Bastiaanse J, Nanhekhan LV, Slaaf DW, Boeckx WD, oude Egbrink MG, J. Surg. Res 2006, 131, 41. [DOI] [PubMed] [Google Scholar]
- [2].Wille T, de Groot H, Rauen U, J. Vasc. Surg 2008, 47, 422. [DOI] [PubMed] [Google Scholar]
- [3].a) Fahy G, Prog. Clin. Biol. Res 1986, 224, 305; [PubMed] [Google Scholar]; b) Wowk B, Cryobiology 2010, 60, 11. [DOI] [PubMed] [Google Scholar]
- [4].a) Fahy GM, Wowk B, Wu J, Phan J, Rasch C, Chang A, Zendejas E, Cryobiology 2004, 48, 157; [DOI] [PubMed] [Google Scholar]; b) Robinson MP, Wusteman MC, Wang L, Pegg DE, Phys. Med. Biol 2002, 47, 2311. [DOI] [PubMed] [Google Scholar]
- [5].Folsom AR, Eckfeldt JH, Weitzman S, Ma J, Chambless LE, Barnes RW, Cram KB, Hutchinson RG, Stroke 1994, 25, 66. [DOI] [PubMed] [Google Scholar]
- [6].Schriefl AJ, Zeindlinger G, Pierce DM, Regitnig P, Holzapfel GA, Journal of the Royal Society Interface 2012, 9, 1275. [DOI] [PMC free article] [PubMed] [Google Scholar]
- [7].Zarins CK, Xu C, Glagov S, Atherosclerosis 2001, 155, 157. [DOI] [PubMed] [Google Scholar]
- [8].Fahy GM, MacFarlane D, Angell C, Meryman H, Cryobiology 1984, 21, 407. [DOI] [PubMed] [Google Scholar]
- [9].Wowk B, Darwin M, Harris SB, Russell SR, Rasch CM, Cryobiology 1999, 39, 215. [DOI] [PubMed] [Google Scholar]
- [10].Eisenberg DP, Rabin Y, J. Biomech. Eng 2015, 137, 081007. [DOI] [PMC free article] [PubMed] [Google Scholar]
- [11].Arnaud FG, Khirabadi B, Fahy GM, Cryobiology 2003, 46, 289. [DOI] [PubMed] [Google Scholar]
- [12].a) Boutron P, Cryobiology 1993, 30, 86; [Google Scholar]; b) Macfarlane DR, Cryobiology 1986, 23, 230; [Google Scholar]; c) Seki S, Mazur P, Cryobiology 2009, 59, 75. [DOI] [PMC free article] [PubMed] [Google Scholar]
- [13].a) Pegg DE, Wusteman MC, Boylan S, Cryobiology 1997, 34, 183; [DOI] [PubMed] [Google Scholar]; b) Baicu S, Taylor M, Chen Z, Rabin Y, Cell Preserv. Technol 2006, 4, 236; [DOI] [PMC free article] [PubMed] [Google Scholar]; c) Manuchehrabadi N, Gao Z, Zhang J, Ring HL, Shao Q, Liu F, McDermott M, Fok A, Rabin Y, Brockbank KG, Sci. Transl. Med 2017, 9, eaah4586. [DOI] [PMC free article] [PubMed] [Google Scholar]
- [14].a) Fahy GM, Wowk B, Wu J, Rejuvenation research 2006, 9, 279; [DOI] [PubMed] [Google Scholar]; b) Fahy GM, Wowk B, Pagotan R, Chang A, Phan J, Thomson B, Phan L, Organogenesis 2009, 5, 167; [DOI] [PMC free article] [PubMed] [Google Scholar]; c) Manuchehrabadi N, Shi M, Roy P, Han Z, Qiu J, Xu F, Lu TJ, Bischof J, Ann. Biomed. Eng 2018, 46, 1857. [DOI] [PMC free article] [PubMed] [Google Scholar]
- [15].a) Song YC, Khirabadi BS, Lightfoot F, Brockbank KG, Taylor MJ, Nat. Biotechnol 2000, 18, 296; [DOI] [PubMed] [Google Scholar]; b) Baicu S, Taylor M, Chen Z, Rabin Y, Cryobiology 2008, 57, 1. [DOI] [PMC free article] [PubMed] [Google Scholar]
- [16].Rabin Y, Steif PS, International Journal of Solids and Structures 2000, 37, 2363. [Google Scholar]
- [17].Song Y, Pegg D, Hunt C, Cryobiology 1995, 32, 405. [DOI] [PubMed] [Google Scholar]
- [18].a) Brace CL, presented at 2008 30th Annual International Conference of the IEEE Engineering in Medicine and Biology Society 2008; [Google Scholar]; b) Ji Z, Brace CL, Phys. Med. Biol 2011, 56, 5249; [DOI] [PMC free article] [PubMed] [Google Scholar]; c) Lazebnik M, Converse MC, Booske JH, Hagness SC, Phys. Med. Biol 2006, 51, 1941; [DOI] [PubMed] [Google Scholar]; d) Gabriel C, Gabriel S, y. Corthout E, Phys. Med. Biol 1996, 41, 2231. [DOI] [PubMed] [Google Scholar]
- [19].Burdette E, Karow A Jr, Jeske A, Cryobiology 1978, 15, 152. [DOI] [PubMed] [Google Scholar]
- [20].a) Jin B, Kleinhans F, Mazur P, Cryobiology 2014, 68, 419; [DOI] [PMC free article] [PubMed] [Google Scholar]; b) Jin B, Mazur P, Sci. Rep 2015, 5, 9271; [DOI] [PMC free article] [PubMed] [Google Scholar]; c) Khosla K, Wang Y, Hagedorn M, Qin Z, Bischof J, ACS nano 2017, 11, 7869; [DOI] [PubMed] [Google Scholar]; d) Khosla K, Zhan L, Bhati A, Carley-Clopton A, Hagedorn M, Bischof J, Langmuir 2018, 35, 7364. [DOI] [PMC free article] [PubMed] [Google Scholar]
- [21].a) Wang J, Zhao G, Zhang Z, Xu X, He X, Acta Biomater 2016, 33, 264; [DOI] [PMC free article] [PubMed] [Google Scholar]; b) Liu X, Zhao G, Chen Z, Panhwar F, He X, ACS applied materials & interfaces 2018, 10, 16822; [DOI] [PMC free article] [PubMed] [Google Scholar]; c) Gao Z, Ring HL, Sharma A, Namsrai B, Tran N, Finger EB, Garwood M, Haynes CL, Bischof JC, Advanced Science 2020, 7, 1901624. [DOI] [PMC free article] [PubMed] [Google Scholar]
- [22].Etheridge ML, Xu Y, Rott L, Choi J, Glasmacher B, Bischof JC, Technology 2014, 2, 229. [Google Scholar]
- [23].Buzug TM, in Springer Handbook of Medical Technology, Springer; 2011, p. 311. [Google Scholar]
- [24].a) Taylor M, Song Y, Brockbank K, Life in the Frozen State, Fuller BJ, Lane N, and EE Benson, eds., CRC Press, Boca Raton, FL: 2004, 604; [Google Scholar]; b) Brockbank KG, Chen Z, Greene ED, Campbell LH, in Cryopreservation and freeze-drying protocols, Springer; 2015, p. 399. [Google Scholar]
- [25].a) Mullen S, Fahy G, Principles & practice of fertility preservation Cambridge University Press, Cambridge: 2011, 145; [Google Scholar]; b) Fahy GM, Rall WF, Vitrification in Assisted Reproduction, A User’s Manual and Trouble-Shooting Guide, Informa Healthcare, London: 2007, 1. [Google Scholar]
- [26].Han Z, Bischof JC, Cryoletters 2020, 41, 185. [Google Scholar]
- [27].de Graaf IA, Draaisma AL, Schoeman O, Fahy GM, Groothuis GM, Koster HJ, Cryobiology 2007, 54, 1. [DOI] [PubMed] [Google Scholar]
- [28].Wei JC, Edwards GA, Martin DJ, Huang H, Crichton ML, Kendall MA, Sci. Rep 2017, 7, 1. [DOI] [PMC free article] [PubMed] [Google Scholar]
- [29].a) Zieger M, Tredget E, McGann L, Cryobiology 1996, 33, 376; [DOI] [PubMed] [Google Scholar]; b) Erdag G, Eroglu A, Morgan JR, Toner M, Cryobiology 2002, 44, 218; [DOI] [PubMed] [Google Scholar]; c) Castagnoli C, Alotto D, Cambieri I, Casimiri R, Aluffi M, Stella M, Alasia ST, Magliacani G, Burns 2003, 29, 759; [DOI] [PubMed] [Google Scholar]; d) Gaucher S, Elie C, Vérola O, Jarraya M, Cell Tissue Banking 2012, 13, 147. [DOI] [PubMed] [Google Scholar]
- [30].Osman OF, Emara S, World journal of plastic surgery 2018, 7, 159. [PMC free article] [PubMed] [Google Scholar]
- [31].Abazari A, Jomha NM, Elliott JA, McGann LE, Cryobiology 2013, 66, 201. [DOI] [PubMed] [Google Scholar]
- [32].Jomha NM, Law GK, Abazari A, Rekieh K, Elliott JA, McGann LE, Cryobiology 2009, 58, 110. [DOI] [PubMed] [Google Scholar]
- [33].Brockbank KG, Chen ZZ, Song YC, Cryobiology 2010, 60, 217. [DOI] [PMC free article] [PubMed] [Google Scholar]
- [34].a) Glöckner R, Rost M, Pissowotzki K, Müller D, Toxicology 2001, 161, 103; [DOI] [PubMed] [Google Scholar]; b) Fisher RL, Hasal SJ, Sanuik JT, Scott KS, Gandolfi AJ, Brendel K, Cryobiology 1993, 30, 250. [DOI] [PubMed] [Google Scholar]
- [35].Mehl PM, Cryobiology 1993, 30, 509. [DOI] [PubMed] [Google Scholar]
- [36].Rabin Y, Taylor MJ, Walsh JR, Baicu S, Steif PS, Cell Preserv. Technol 2005, 3, 169. [DOI] [PMC free article] [PubMed] [Google Scholar]
- [37].Etheridge M, Bischof JC, Ann. Biomed. Eng 2013, 41, 78. [DOI] [PubMed] [Google Scholar]
- [38].Steif PS, Palastro MC, Rabin Y, Cell Preserv. Technol 2007, 5, 104. [DOI] [PMC free article] [PubMed] [Google Scholar]
- [39].Bischof JC, Mahr B, Choi J, Behling M, Mewes D, Ann. Biomed. Eng 2007, 35, 292. [DOI] [PubMed] [Google Scholar]
- [40].a) Taylor MJ, Baicu S, Organogenesis 2009, 5, 155; [DOI] [PMC free article] [PubMed] [Google Scholar]; b) Song YC, An YH, Kang QK, Li C, Boggs JM, Chen Z, Taylor MJ, Brockbank KG, J. Invest. Surg 2004, 17, 65; [DOI] [PubMed] [Google Scholar]; c) Cook JR, Eichelberger H, Robert S, Rauch J, Baust JG, Taylor MJ, Buskirk RGV, Tissue Eng 1995, 1, 361; [DOI] [PubMed] [Google Scholar]; d) Taylor M, Campbell L, Rutledge R, Brockbank K, presented at Transplant. Proc. 2001; [DOI] [PubMed] [Google Scholar]; e) Song YC, Lightfoot FG, Chen Z, Taylor MJ, Brockbank KG, Cell Preserv. Technol 2004, 2, 67; [Google Scholar]; f) Jomha NM, Elliott JA, Law GK, Maghdoori B, Forbes JF, Abazari A, Adesida AB, Laouar L, Zhou X, McGann LE, Biomaterials 2012, 33, 6061. [DOI] [PubMed] [Google Scholar]
- [41].Pegg D, Cryobiology 1989, 26, 212. [DOI] [PubMed] [Google Scholar]
- [42].Choi J, Bischof JC, Cryobiology 2010, 60, 52. [DOI] [PMC free article] [PubMed] [Google Scholar]
- [43].Özisik MN, Özısık MN, Özışık MN, Heat conduction, John Wiley & Sons, 1993. [Google Scholar]
- [44].Steif PS, Palastro M, Wan C-R, Baicu S, Taylor MJ, Rabin Y, Cell Preserv. Technol 2005, 3, 184. [DOI] [PMC free article] [PubMed] [Google Scholar]
- [45].Wowk B, Fahy GM, Ahmedyar S, Taylor MJ, Rabin Y, Cryobiology 2018, 82, 70. [DOI] [PMC free article] [PubMed] [Google Scholar]
Associated Data
This section collects any data citations, data availability statements, or supplementary materials included in this article.


