

Summary
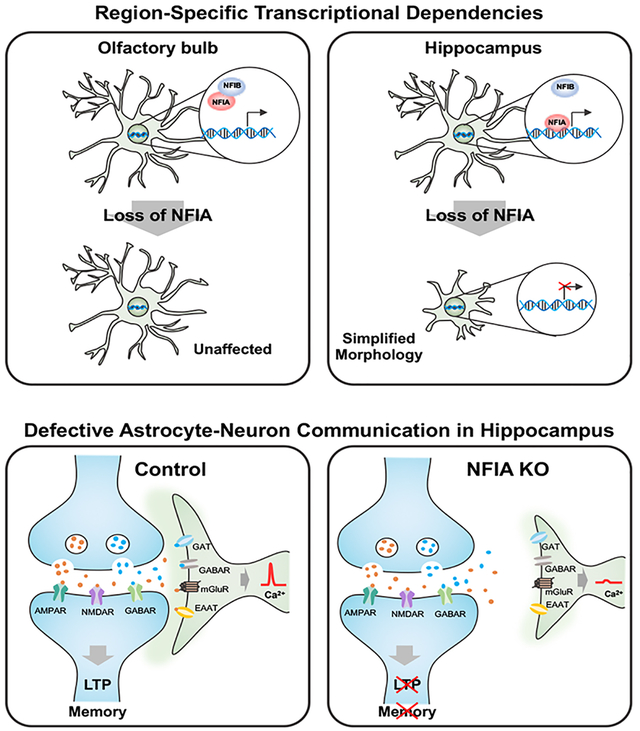
Astrocytes play essential roles in brain function by supporting synaptic connectivity and associated circuits. How these roles are regulated by transcription factors is unknown. Moreover, there is emerging evidence that astrocytes exhibit regional heterogeneity and the mechanisms controlling this diversity remain nascent. Here we show that conditional deletion of the transcription factor NFIA in astrocytes in the adult brain results in region-specific alterations in morphology and physiology that are mediated by selective DNA binding. Disruptions in astrocyte function following loss of NFIA are most pronounced in the hippocampus, manifested by impaired interactions with neurons, coupled with diminution of learning and memory behaviors. These changes in hippocampal astrocytes did not affect basal neuronal properties, but specifically inhibited synaptic plasticity, which is regulated by NFIA in astrocytes through calcium-dependent mechanisms. Together, our studies reveal region-specific transcriptional dependencies for astrocytes and identify astrocytic NFIA as a key transcriptional regulator of hippocampal circuits.
Graphical Abstract
ETOC
Astrocytes play essential roles in brain function by supporting synaptic connectivity and associated circuits. We found the transcription factor NFIA is required to maintain astrocyte function in the hippocampus, through region-specific DNA binding mechanisms. Alterations in astrocyte-neuron communication disrupt hippocampal circuit function, resulting in impaired learning and memory behaviors.
Introduction
Brain function relies on the coordinated efforts of neurons and glia for the development and maintenance of neural circuits. While synaptic connections between neurons remains the defining feature of circuit function, direct roles for astrocytes in circuit function have recently emerged (Haim and Rowitch, 2017; Khakh and Sofroniew, 2015). Astrocytes are the most abundant glial cell in the brain and occupy a variety of roles essential for brain development, function, and homeostasis (Allen, 2014; Molofsky and Deneen, 2015). Among these roles, their affiliation with neuronal synapses results in key functions linked to neurotransmission and ion homeostasis that directly influence neural circuits throughout the brain (Khakh and Sofroniew, 2015; Papouin et al., 2017). These functions of astrocytes are mediated in part by their distinct morphology, which is comprised of an elaborate network of branches and processes that allow a single astrocyte to contact between tens to hundreds of thousands of synapses in the rodent brain (Bushong et al., 2002; Halassa et al., 2007). Another defining feature of astrocytes is their expression of channels and transporters that allow for the uptake of neurotransmitters and release of neuroactive agents(Anderson and Swanson, 2000; Boddum et al., 2016; Woo et al., 2012). While significant advances have been made in understanding how these facets of astrocyte biology influence circuit function, the transcriptional mechanisms that oversee these processes in mature astrocytes in the adult brain remain undefined.
Given the diverse ensemble of neural circuits and the vast spectrum of associated neuronal subtypes in the brain, it is possible that astrocytes also exhibit cellular diversity that accommodates the local needs of neurons and associated circuits. Recent studies have defined the unique cellular, molecular, and functional properties of diverse astrocyte populations occupying distinct brain regions (Chai et al., 2017; John Lin et al., 2017; Tsai et al., 2012), illustrating regional-specialization of mature astrocytes in the brain. There is evidence for both circuit-based (Khakh, 2019; Perea et al., 2014) and developmental patterning paradigms as prospective mechanisms that guide the generation of diverse astrocyte populations, however the molecules driving this phenomenon remain elusive (Chai et al., 2017; Farmer et al., 2016; Hochstim et al., 2008). The involvement of patterning-associated mechanisms suggests that transcription factors regulate key aspects of astrocyte diversity, however whether region-specific transcription factors selectively regulate astrocyte function in the adult brain is unknown.
Development offers a potential venue in which to prospectively identify transcription factors that operate in mature glial lineages. In oligodendrocytes, Olig2 and Sox10 are expressed throughout lineage development, from specification into mature myelinating oligodendrocytes, playing critical roles in both developing and mature lineages in the adult (Cai et al., 2007; Stolt et al., 2002). Using this parallel for astrocytes, the transcription factor Nuclear Factor I-A (NFIA) is induced during the early stages of glial specification and continues to be expressed throughout astrocyte differentiation and maturation (Deneen et al., 2006; Kang et al., 2012). Studies on NFIA have shown that it plays an essential role in both early gliogenesis and astrocyte differentiation in the developing spinal cord (Deneen et al., 2006). Moreover, studies on NFIA germline knockout lines revealed early post-natal lethality, coupled with severe cortical abnormalities, indicating that it is plays an essential role in brain development and other non-CNS lineages (das Neves et al., 1999). Despite these well-defined roles in early glial development, whether NFIA contributes to mature astrocyte function in the adult brain remains unknown.
As recent transcriptomic data from mature astrocytes revealed that NFIA is expressed in astrocyte populations found in numerous brain regions (Chai et al., 2017; John Lin et al., 2017), we aimed to delineate its role in the adult brain through temporal-conditional knockout. Analysis of astrocytes across several brain regions revealed region-specific alterations in their morphology, physiology, gene expression signatures, and capacity of NFIA to bind DNA. These region-specific dependencies were most pronounced in the hippocampus, where NFIA-deficient astrocytes demonstrated impaired calcium activities, detection of neurotransmitters, and decreased proximity to neurons. These changes in astrocyte physiology impacted hippocampal circuits, where long term potentiation (LTP) was inhibited and learning and memory behaviors were impaired. Together, these studies reveal novel transcriptional mechanisms that oversee adult astrocyte function in a region-specific manner and identify NFIA function in astrocytes as a key regulator of hippocampal circuits.
Results
Loss of NFIA selectively reduces morphological complexity of adult astrocytes
To confirm that NFIA is expressed in mature astrocytes from diverse regions of the adult brain, we performed co-immunostaining with NFIA and GFP in 12-week-old Aldh1l1 -GFP reporter mice. This analysis revealed that >80% of Aldh111 -GFP expressing astrocytes co-expressed NFIA in several brain regions, indicating that it is expressed in astrocytes throughout the adult brain (Fig. 1A–D, J; Supplemental Fig. S1A–I).
Figure 1. Deletion of NFIA in mature astrocytes selectively reduces morphological complexity.
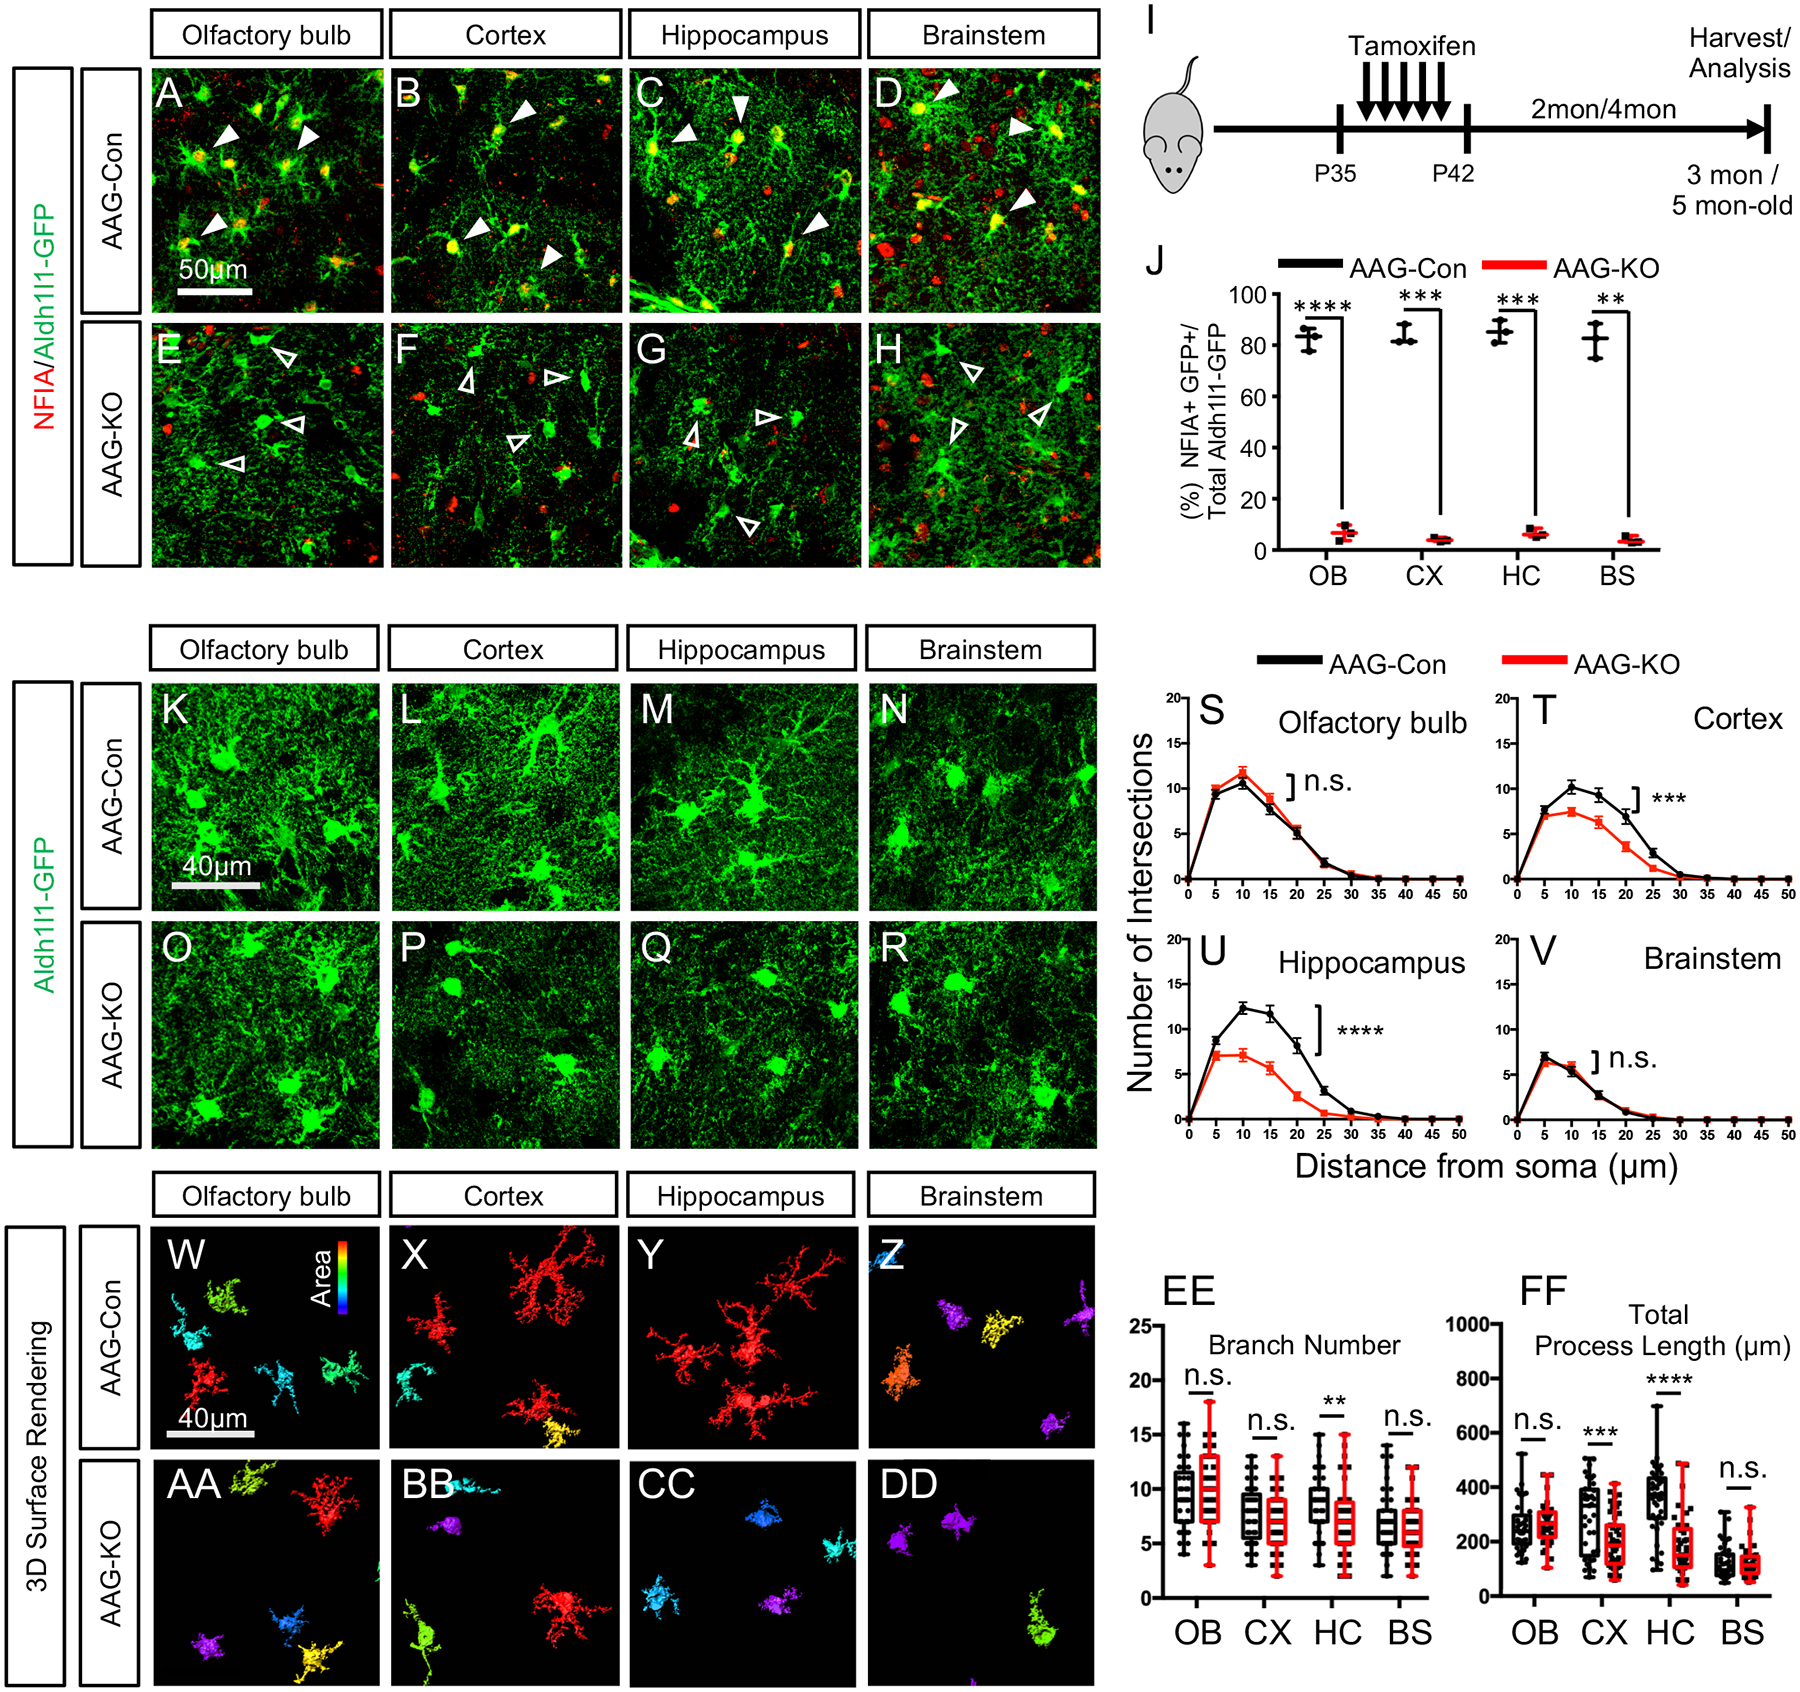
(A–H) Co-expression of NFIA and Aldh111 -GFP from AAG-Con and AAG-KO mice. Filled arrows in A-D show co-expression of Aldh1l1-GFP and NFIA, unfilled arrows in E–H show Aldh1l1-GFP cells that do not express NFIA. (I) Tamoxifen treatment paradigm. (J) Quantification of NFIA/Aldh1l1-GFP co-expression in AAG-Con and AAG-KO mice. Data derived from 3 mice per genotype, 3 slides per region, per mouse. At least 100 cells per region, per mouse. Two-tailed unpaired t-test.(Ruxton, 2006) (K–R) High magnification confocal images of Aldh1l1-GFP from AAG-con or AAG-KO mice. (S–V) Scholl Analysis of astrocyte complexity. Two-way repeated measures ANOVA. (W–DD) 3D-surface rendering of high magnification images from k-r. (EE, FF) Branch number and total process length quantification. Two-tailed unpaired t-test. In S-V and EE-FF data is derived from 3 mice per genotype, 3 slides per region, per mouse, with at least 30 cells per region, per genotype. OB: olfactory bulb; CX: cortex; HC: hippocampus; BS: brainstem. AAG-Con, denotes: NFIAfl/fl; Aldh1l1-GFP. AAG-KO denotes: NFIAfl/fl; Aldh1l1-CreER; Aldh1l1-GFP. *p<0.05, **p< 0.01, ***p<0.001, ****p<0.0001. Also see Figure S1–S3.
We next asked how NFIA contributes to the function of diverse populations of mature astrocytes. Given its essential role in glial and astrocyte development, coupled with the early post-natal lethality of the germline knockout, our studies required the generation of temporal and lineage specific knockout alleles. Therefore, we generated a floxed NFIA allele (NFIAfl/fl) and intercrossed it with a recently developed Aldh1l1-CreER line and the Aldh1l1-GFP reporter, producing the NFIAfl/fl; Aldh1l1-CreER; Aldh1l1-GFP (AAG) mouse line. This allelic combination enabled us to temporally control deletion of NFIA in astrocytes in the adult brain. We began tamoxifen administration at P35, which allowed us to by-pass any developmental role for NFIA (Fig. 1I) (Ge et al., 2012) and found that it was efficiently deleted in Aldh111 -GFP astrocytes in the olfactory bulb, cortex, hippocampus, and brainstem two months after treatment (~P100) (Fig. 1A–J; Supplemental Fig. S1J–Y).
Initially, we stained P100 AAG-KO and AAG-Con mice for the established astrocyte marker, GFAP, which revealed selective reduction in the hippocampus and cortex, but not in the in olfactory bulb or brainstem (Supplemental Fig. S1Z–GG). In the process of our analysis, we noticed that the Aldh1l1-GFP labeled astrocytes from the AAG-KO mice demonstrated reduced morphological complexity (Fig. 1L vs P, M vs Q). Strikingly, this simplified astrocyte morphology was only present in the hippocampus and the cortex, with astrocytes from the olfactory bulb and brainstem of AAG-KO mice exhibiting normal morphologies (Fig. 1K vs O, N vs R).
To further characterize these region-specific changes in astrocyte morphology, we performed high-resolution confocal imaging, and quantified a host of established parameters associated with astrocyte morphology (Fig.1W–DD). Strikingly, we found that Aldh111-GFP astrocytes from the CA1 region of the hippocampus from AAG-KO mice demonstrated drastically reduced complexity, number of major branches, and total process length (Fig. 1U, EE–FF). Further analysis of astrocytes in layer 2/3 of the prefrontal cortex revealed marginal changes in complexity and process length, while analysis of the olfactory bulb and brainstem showed no changes in these features (Fig. 1S–V, EE–FF). To determine whether these phenotypes progressed over time, we harvested AAG-KO and AAG-Con mice at ~P160, finding a similar phenomenon: diminished astrocyte complexity in the hippocampus, marginal changes in the cortex, and no changes in the olfactory bulb or brainstem (Supplemental Fig. S2A–V).
Next, we generated NFIAfl/fl; Aldh1l1-CreER; tdTomato (AAT) mice, which enabled us to directly label astrocytes that underwent Cre-recombination. Analysis of tdTomato-labeled astrocytes in AAT-Con and AAT-KO mice two months after tamoxifen treatment also revealed reduced complexity in hippocampal astrocytes lacking NFIA, while the morphology of brainstem astrocytes was unaffected (Supplemental Fig. S2W–GG). Finally, we quantified the number of astrocytes in the AAG-KO mice and did not observe any changes in the gross number of astrocytes at ~P160 across all sampled brain regions, suggesting loss of NFIA does not lead to cell death (Supplemental Fig. S3). Together, these studies indicate that NFIA expression in adult astrocytes is required to maintain morphological complexity of astrocytes in the hippocampus and cortex.
NFIA-deficient astrocytes exhibit impaired calcium activity in the hippocampus
Because the physiological activities of astrocytes are reliant upon their complex morphology, we next examined whether loss of NFIA influences astrocyte activity across these brain regions. While astrocytes are not electrically active, they exhibit dynamic calcium activities in their soma and processes, which is considered a direct measure of their physiological activities (Guerra-Gomes et al., 2017).
To determine whether NFIA-deficient astrocytes in the olfactory bulb, cortex, hippocampus, and brainstem display alterations in calcium (Ca2+) activity, we generated NFIAfl/fl; Aldh1l1-CreER; GCaMP6s (AA6) mice. These mice contain a genetically encoded calcium indicator (GCaMP6s) downstream of a floxed STOP cassette such that GCaMP6s is exclusively expressed in astrocytes in the AA6 mouse. To determine whether Ca2+ activity is impaired in the absence of NFIA, we generated brain slices from AA6-Con and AA6-KO mice four months after induction (~P160) and performed two-photon imaging to assess Ca2+ dynamics, under basal conditions, from the following regions: i) external plexiform layer of the olfactory bulb (Fig. 2A,B), ii) layer 2/3 of the prefrontal cortex (Fig. 2C,D), iii) medulla oblongata of the brainstem (Fig. 2E,F), and iv) CA1 of the hippocampus (Fig. 2G,H). Using previously established algorithms and approaches to quantify Ca2+ activity in astrocytic soma and microdomains within processes(Srinivasan et al., 2015), we found significantly reduced activity in both the soma and microdomains in hippocampal CA1 astrocytes from AA6-KO mice compared to controls (Fig. 2O–R; Supplemental Fig. S4Q–R). In contrast, parallel analysis of Ca2+ activity in soma and microdomains in astrocytes from the olfactory bulb, cortex, and brainstem did not reveal any changes between the AA6-KO and controls (Fig. 2A–F, I–N, Q–R; Supplemental Fig. S4Q–R).
Figure 2. Loss of NFIA impairs calcium activity in hippocampal astrocytes.
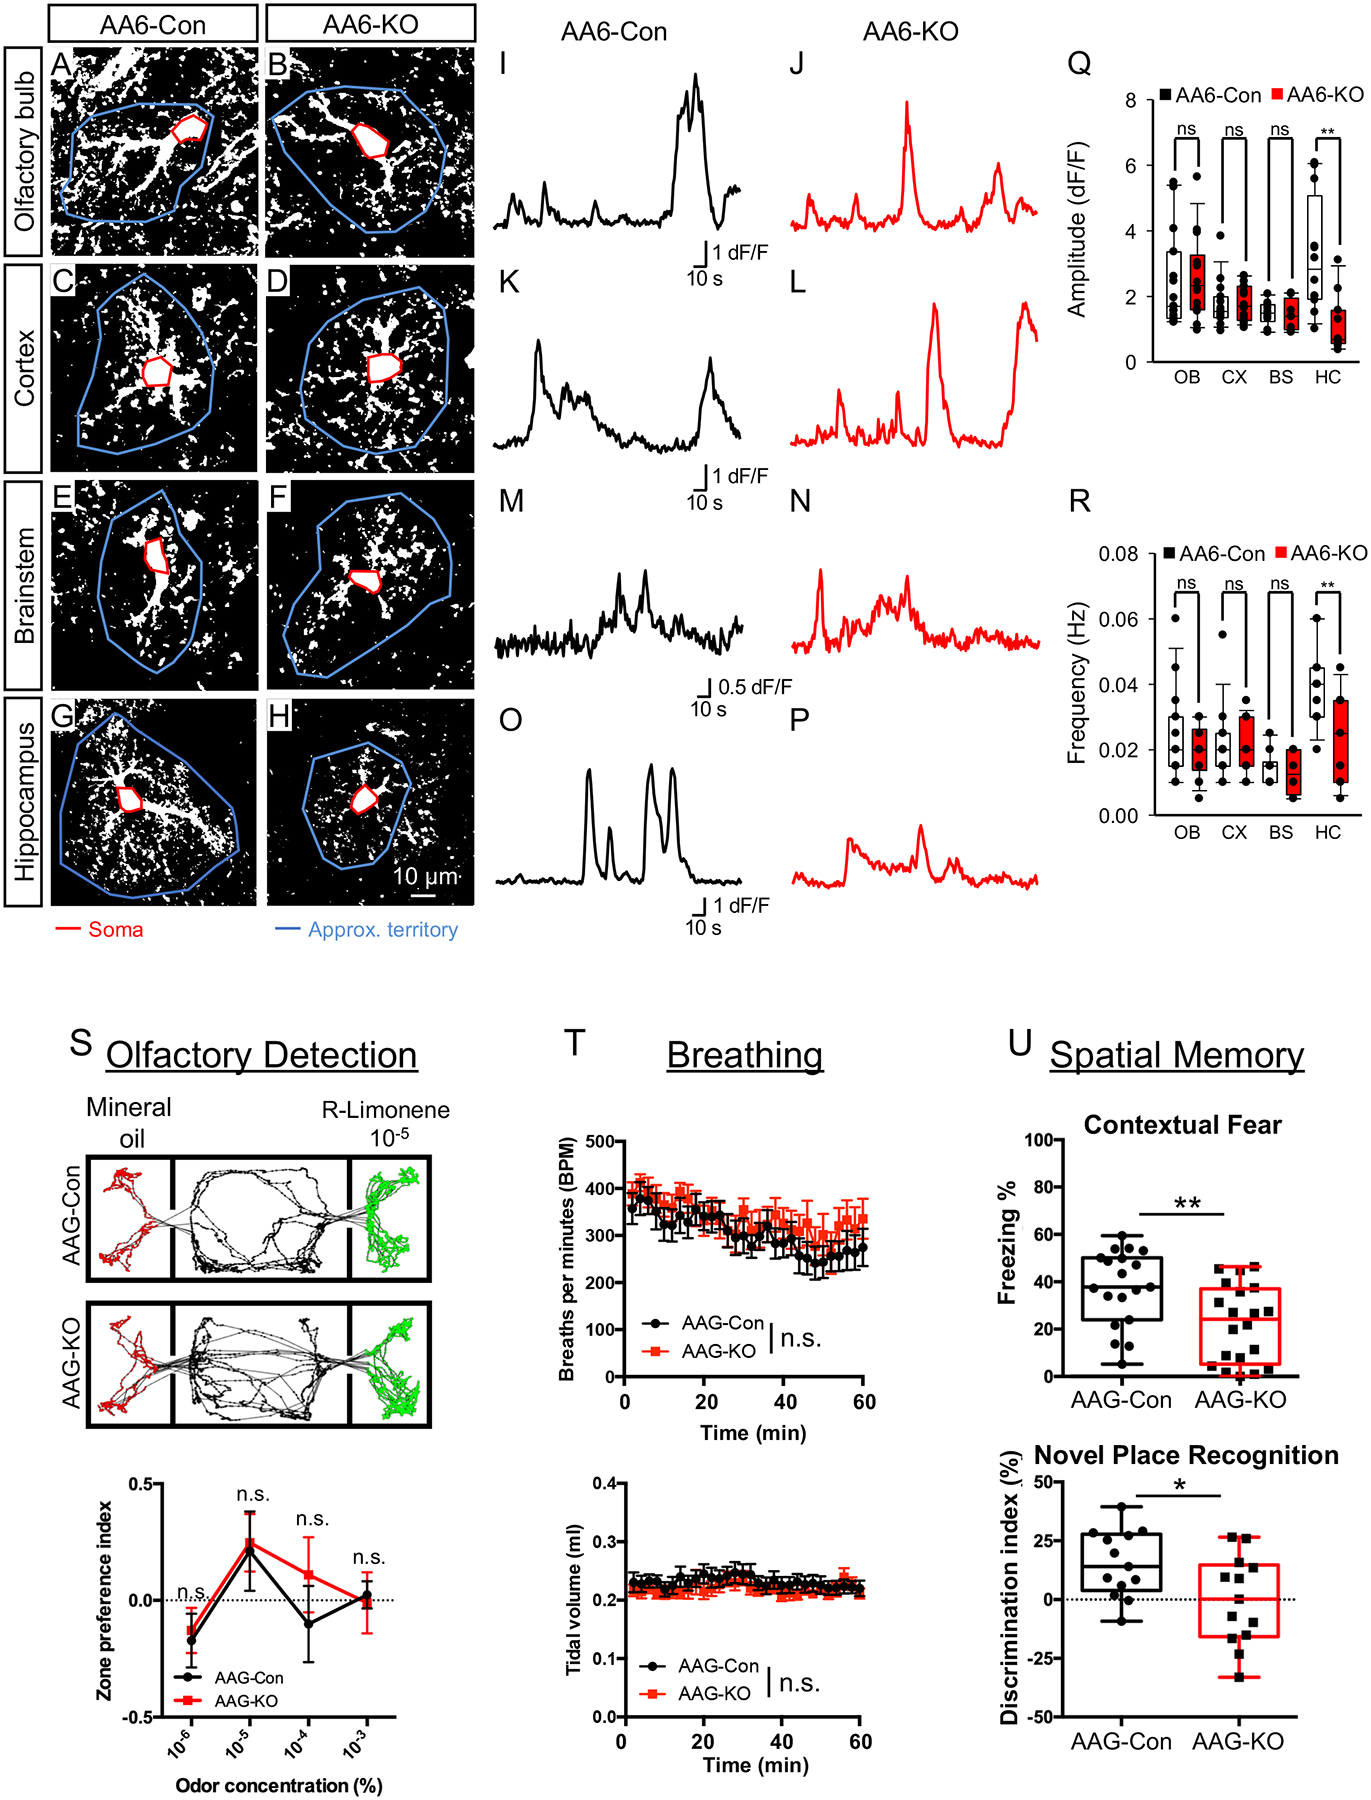
(A–P) Representative images and traces from AA6-Con and AA6-KO mice showing spontaneous GCaMP6s activity in astrocytes from olfactory bulb, cortex, brainstem, and hippocampus. Red line denotes soma and blue line depicts approximate territory; traces are from soma (Q,R) Quantification of somatic DF/F GCaMP6s signal amplitude (Q) and frequency (R) derived from 3 mice from each genotype, total cells per region: OB = 15, CX = 15, BS = 10, HP = 12. (S) representative tracks of body positions (upper panels) and zone preference index (lower panel) showing odor detection threshold; data were derived from 12 AAG-Con and 11 AAG-KO mice. Two-tailed unpaired t-test under each (R)-Limonene concentration. (T) 2-min average breathing rate (upper panel) and tidal volume (lower panel) over 60 min testing period; data were derived from 12 AAG-Con and 12 AAG-KO. Two-way repeated measures ANOVA. (U) Quantification of freezing in contextual fear conditioning (upper panel) and novel place recognition (lower panel). In upper panel, 19 AAG-Con and 20 AAG-KO mice were used; in lower panel, 13 AAG-Con and 13 AAG-KO mice were used. Two-tailed unpaired t-test. OB: olfactory bulb; CX: cortex; HC: hippocampus; BS: brainstem. AA6-Con denotes: NFIA+/+; Aldh1l1-CreER; Rosa-CAG-LSL-GCaMP6s. AA6-KO denotes: NFIAfl/fl; Aldh1l1-CreER; Rosa-CAG-LSL-GCaMP6s. AAG-Con denotes: NFIAfl/fl; Aldh1l1-GFP. AAG-KO denotes: NFIAfl/fl; Aldh1l1-CreER; Aldh1l1-GFP. *p< 0.05, **p<0.01. Also see Figure S4–S5.
To further evaluate the physiological properties of NFIA-deficient astrocytes, we performed whole-cell patch clamp recordings on AAG-KO and control astrocytes from the olfactory bulb, cortex, hippocampus, and brainstem. Stepped voltage injections revealed no differences in the current-voltage (IV) relationship between AAG-KO and AAG-Con astrocytes from each of these regions, displaying characteristic linear IV curve with similar slopes (Supplemental Fig. S5A–C), indicating that loss of NFIA in astrocytes does not affect their general membrane properties. Critically, we also identified a reduction in membrane capacitance in AAG-KO astrocytes specifically from the hippocampus (Supplemental Fig. S5D), which is consistent with the simplified morphology exhibited by these populations (Fig. 1Q,U). Together, these studies indicate that while the general membrane properties of astrocytes lacking NFIA remain intact, Ca2+ activity is selectivity impaired in NFIA-deficient astrocytes in the hippocampus. These observations, in conjunction with our morphological analysis, suggest that hippocampal astrocytes are selectively dependent upon NFIA expression to maintain morphological integrity and physiological activity.
Hippocampal-associated behaviors are impaired in NFIA-deficient mice
Numerous studies have shown that modulating astrocyte Ca2+ activity can influence behavioral outputs associated with many brain regions (Adamsky et al., 2018; Oliveira et al., 2015a; Yu et al., 2018). Having identified region-specific alterations in Ca2+ activity in astrocytes-lacking NFIA, we next evaluated whether behaviors associated with each brain region were impacted in mice lacking astrocytic-NFIA(Abraham et al., 2010) (Phillips and LeDoux, 1992; Smith et al., 2013). We first evaluated performance in tasks measuring a series of basic activities including general locomotor activity, anxiety, and stereotypic behavior by open field test and found no change in any of these basic parameters in AAG-KO animals compared to controls (Supplemental Fig. S5S–V). Moreover, there were no gross changes in animal body weight or general health that would impact behavioral performance (Supplemental Fig. S5CC).
The cortex is associated with a multitude of behavioral outputs, therefore, we focused our behavioral analysis on the olfactory bulb, brainstem, and hippocampus because these regions have more clearly defined associated behaviors. To assess behavioral outputs associated with the olfactory bulb and brainstem, we performed odor detection and unrestrained whole body plethysmography (uWBP) assays, respectively. As shown in Fig.2S, there was no difference in odor detection concentration threshold, as indicated by the rise of zone preference index at 10−5 (R)-Limonene, and no difference in the breathing rate (upper panel) or tidal volume (lower panel) between AAG-Con and AAG-KO (Fig. 2T) (see methods). These data indicate that behaviors associated with the olfactory bulb and brainstem are unaffected in mice lacking astrocytic-NFIA.
To determine whether behaviors associated with the hippocampus are affected, we performed a series of spatial learning and memory assays. First, we evaluated associative learning by performing fear conditioning tests finding that AAG-KO mice demonstrated ~40% decrease in contextual fear (Fig. 2U, upper panel); these deficiencies are not due to differences in conditioning during the training phase (Supplemental Fig.5W–X). Examination of spatial memory by novel place recognition revealed that AAG-KO mice displayed no preference for objects in the novel location (Fig. 2U, lower panel). Finally, to assess working memory we performed the y maze test (Supplemental Fig. 5AA–BB), finding that AAG-KO mice showed decreased rate of choosing alternate arms. In both of these cases, the identified deficiencies are not due to alterations in activity during the behavior (Supplemental Fig.5X–Z). These results indicate that the AAG-KO mice have deficits in learning and memory that are consistent with defects in hippocampal function. Moreover, our observations that odor detection, breathing, and motor behaviors are unaffected further suggest that the effects of NFIA-loss are selective for hippocampal astrocytes.
NFIA regulates region-specific gene expression programs in astrocytes
The forgoing studies indicate that astrocytes in the hippocampus have the most pronounced dependency on NFIA across the evaluated morphological, physiological, and behavioral criteria. These data, coupled with recent studies demonstrating regional diversity of astrocytes (Chai et al., 2017; Morel et al., 2017), led us to hypothesize that NFIA regulates region-specific transcriptional programs. Towards this, we performed whole transcriptome RNA-Sequencing on FACS-isolated astrocytes from the hippocampus, cortex, olfactory bulb, and brainstem of AAG-Con and AAG-KO mice (Supplemental Fig. S6A–D) four months after tamoxifen injection (~P160). Analysis entailed intra-regional comparisons between AAG-KO and AAG-Con to identify differentially expressed genes using p<0.01, 1.5 fold change cutoffs (Fig. 3A–D). This analysis revealed a substantial number of differentially expressed genes in the hippocampus, whereas the cortex, olfactory bulb, and brainstem showed significantly fewer changes in gene expression (Fig. 3E,F; Supplemental Fig. S7A–C; Supplemental Table 1). Gene Ontology (GO) analysis of the identified differentially expressed genes in the hippocampus revealed enrichment in genes with functions associated with actin organization, collagen binding, cell-cell junctions, and integrins (Fig. 3G,H). These GO terms are processes linked to cellular architecture and are congruent with our observed changes in the morphology of hippocampal astrocytes. Furthermore, GO terms linked to calcium ion binding were also reduced in hippocampal astrocytes from AAG-KO mice (Fig. 3G,H), which is consistent with the observed reduction in Ca2+ activity (Fig. 2O–R). Next, we used qRT-PCR to validate the expression of a cohort of genes with functions associated with cell architecture and calcium handling, confirming the down regulation of these genes in astrocytes from AAG-KO mice (Fig. 3I). Further, we extended these validation studies to include immunofluorescence staining of Trpv4 (calcium channel)(Ciura et al., 2018) and Plek2 (actin cytoskeletal regulation)(Hamaguchi et al., 2007), finding decreased expression of both proteins in AAG-KO astrocytes (Fig. 3H–Q). Together, these data indicate that loss of NFIA significantly alters the molecular properties of hippocampal astrocytes and these alterations are more pronounced than those found in astrocytes from other brain regions.
Figure 3. Region-specific gene regulation and DNA-binding properties of NFIA.
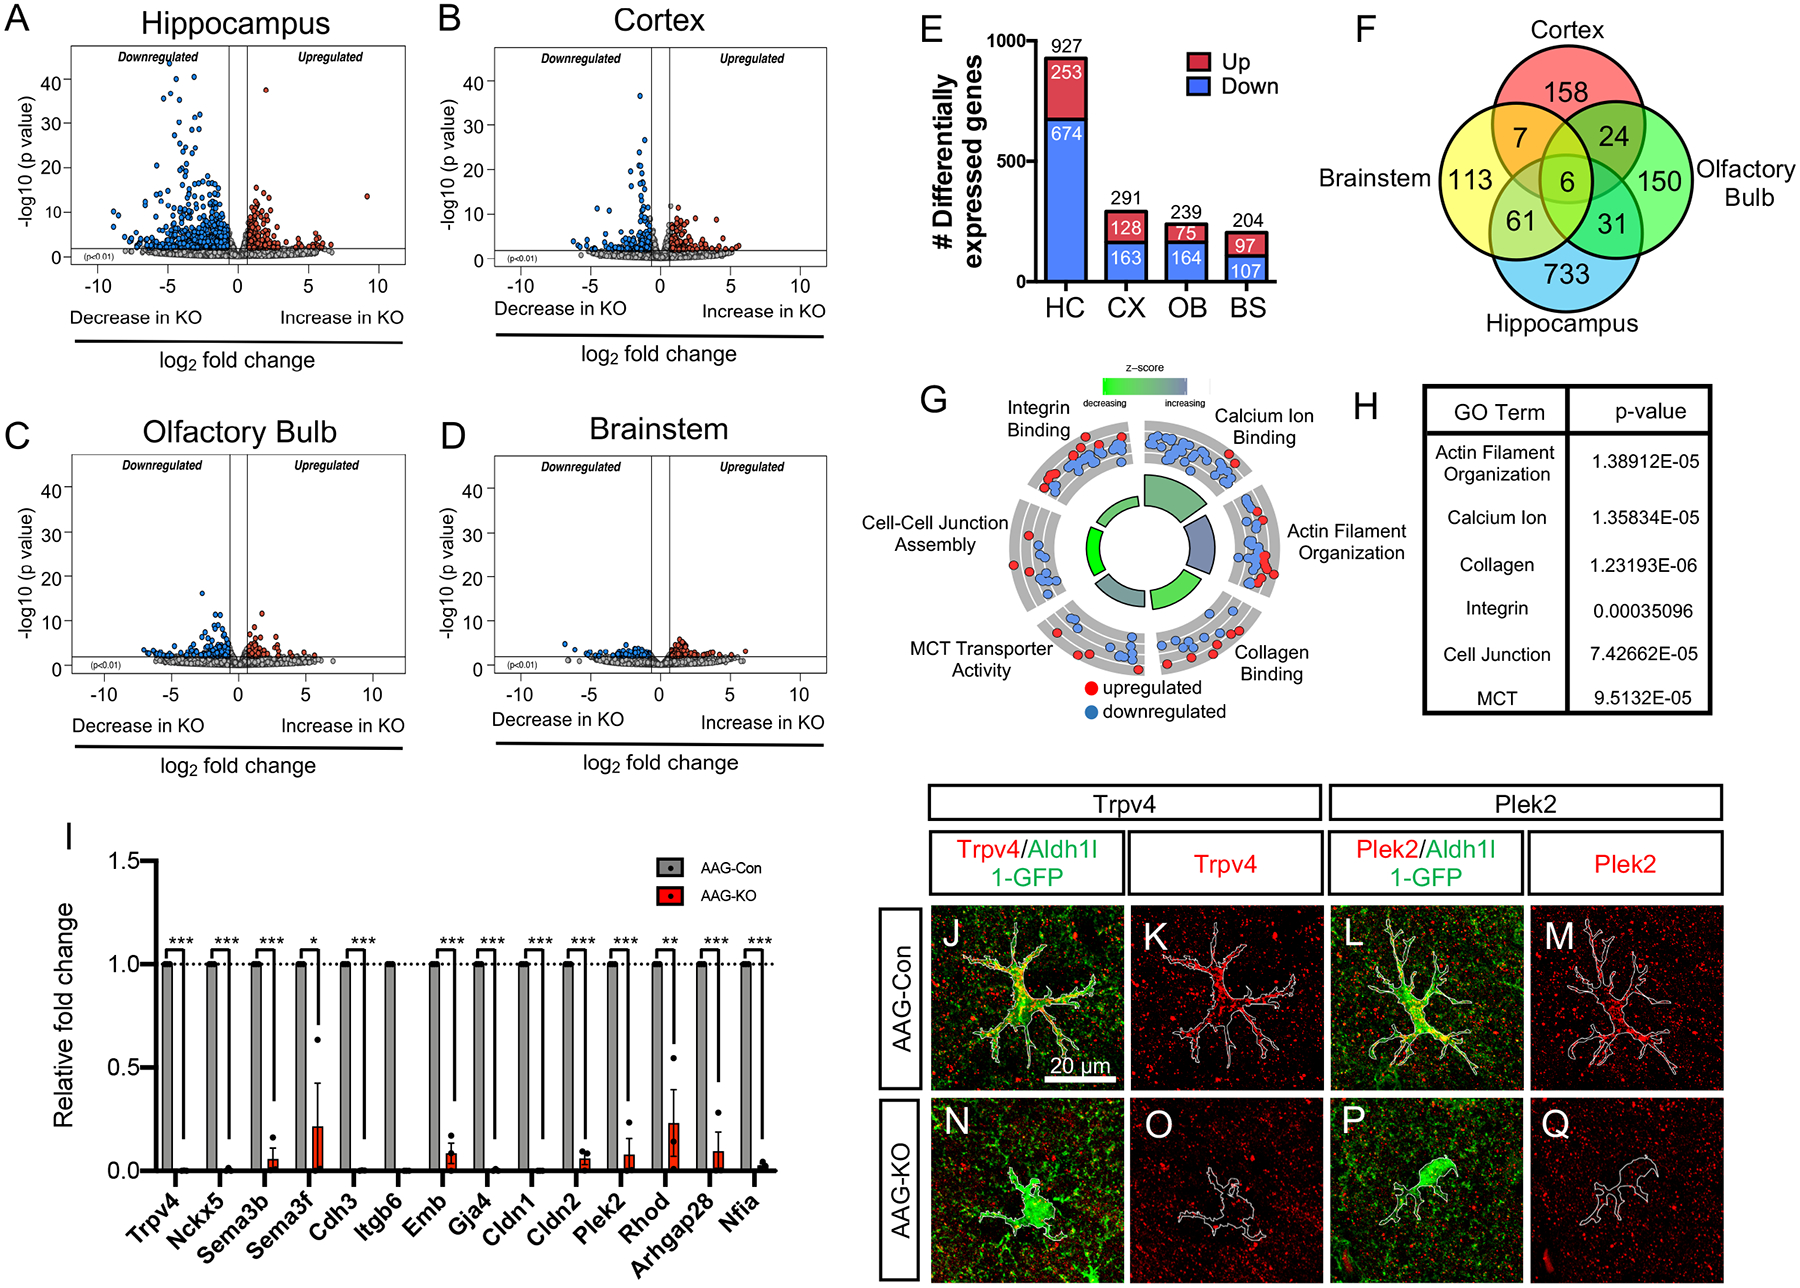
(A–D) Volcano plots depicting RNA-Seq data comparing AAG-Con and AAG-KO transcriptome data across diverse brain regions. RNA-Seq experiments from each genotype, from each region was performed in triplicate; p=0.01, fold change = 1.5 fold (E) Bar graph showing the total number of differentially expressed genes from each region. (F) Venn Diagram depicting the overlapping and unique differentially expressed genes across the four brain regions. (G,H) Gene Ontology Circle plot and table, showing the top GO terms found in the differentially expressed genes from the hippocampus. (I) qRT-PCR validation of key genes differentially expressed in the hippocampus of AAG-KO mice. (J–Q) Immunostaining of AAG-Con and AAG-KO hippocampus with antibodies to Trpv4 and Plek2. *p<0.05 and ***p<0.001. Also see Figure S6–S7.
To further examine how NFIA regulates gene expression programs in astrocytes, we performed ChIP-Seq to delineate NFIA binding patterns in the hippocampus and olfactory bulb, which were used as prototypes for regions affected and unaffected by loss of NFIA, respectively. Evaluating core promoter regions bound by NFIA revealed a striking difference in promoter binding between these regions, with NFIA binding 1,730 core promoter regions in the hippocampus and only 75 in the olfactory bulb (Fig. 3I,J). Critically, this difference in NFIA’s capacity to bind DNA is not the result of differential expression between these regions as NFIA was equally expressed and immunoprecipitated in the olfactory bulb and hippocampus (Supplemental Fig. S1A–I, S7D–E). These data, in conjunction with the transcriptomic data, indicate that NFIA plays a more critical role in gene regulation in the hippocampus than other regions in part due to its differential capacity to bind DNA in different brain regions.
NFIB inhibits NFIA DNA binding in the olfactory bulb
The region-specific DNA binding properties of NFIA in the olfactory bulb and hippocampus raise the question of how this phenomenon is regulated. One possibility is that NFIA has different binding partners across these regions that modulate its capacity to bind DNA. Therefore we next performed immunoprecipitation (IP) with NFIA from the olfactory bulb and hippocampus, followed by mass-spectrometry (Fig. 4D). Strikingly, amongst the proteins that specifically interact with NFIA in the olfactory bulb (and not the hippocampus), we identified NFIB as the top candidate (Fig. 4E; Supplemental Figure 7I; Supplemental Table 2). Next, we performed IP with NFIB in the olfactory bulb and hippocampus, followed by NFIA immunoblot, confirming that NFIA and NFIB strongly associate in the olfactory bulb and exhibit much less association in the hippocampus (Fig. 4F).
Figure 4. NFIB inhibits DNA binding of NFIA in the olfactory bulb.
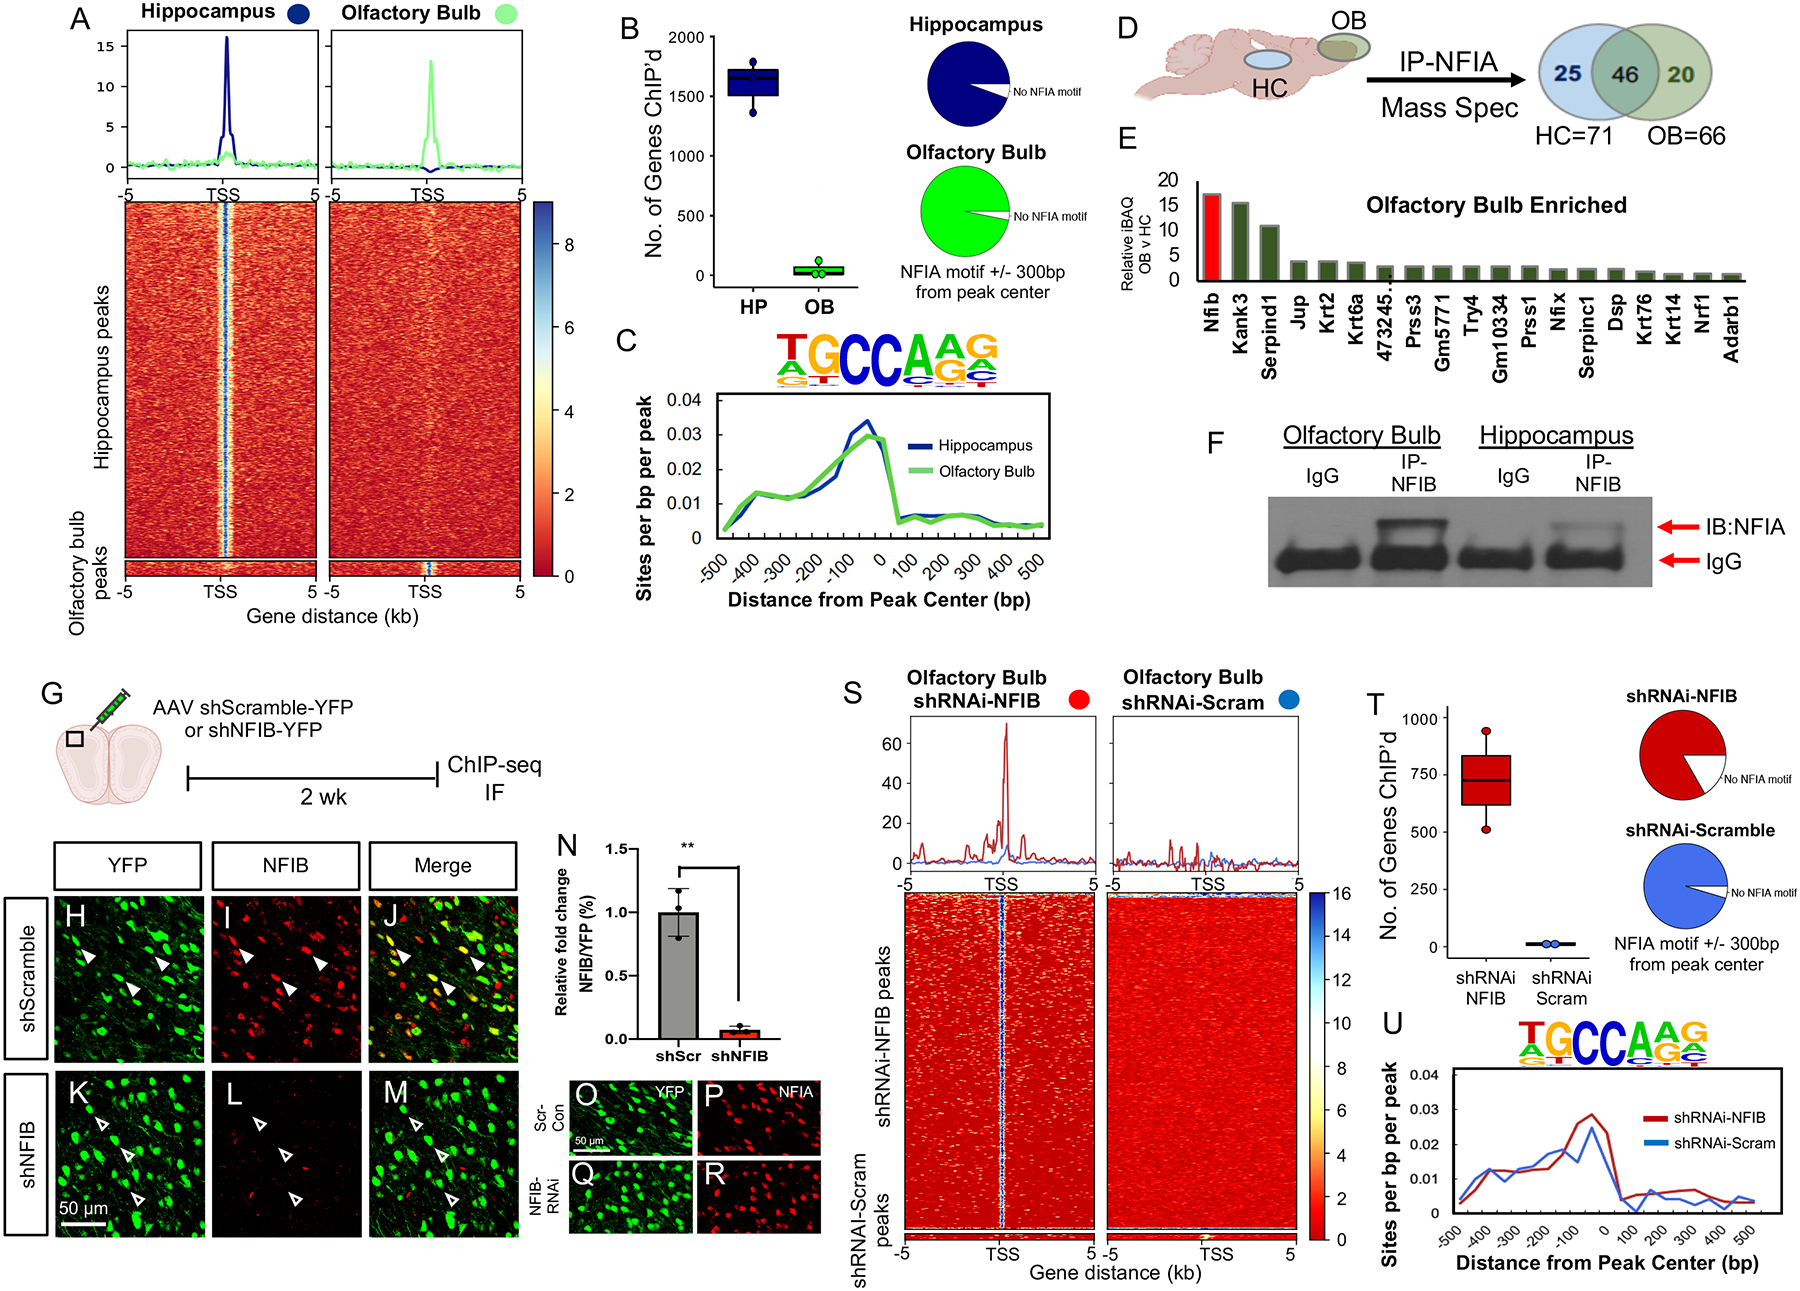
(A) Heatmap of the ChIP-Seq analysis depicting NFIA binding of core transcriptional start sites in the hippocampus and olfactory bulb. ChIP-Seq experiments from both regions was performed in triplicate. (B) The number of gene that exhibit NFIA-binding in the core promoter and the number of those genes containing a NFIA-binding site. (C) Motif density plot showing NFIA motif is most frequently found in 1 kb range. (D–E) Schematic of mass spectrometry experiment and graph depicting proteins specifically associated with NFIA in the olfactory bulb based on filtered iBAQ values relative to hippocampus. (F) NFIB-IP, coupled with NFIA immunoblot (IB) in the hippocampus and olfactory bulb). (G–R) Schematic of shRNAi-NFIB knockdown in the olfactory bulb and immunofluorescence staining of NFIB (I,L) and NFIA (P,Q) validating protein expression. (S) Heatmap of the ChIP-Seq analysis depicting NFIA binding of core transcriptional start sites in olfactory bulb treated with shRNAi-NFIB or control. ChIP-Seq experiments under both conditions was performed in triplicate. (T–U) The number of gene that exhibit NFIA-binding in the core promoter and the number of those genes containing a NFIA-binding site and motif density plot. OB: olfactory bulb; CX: cortex; HC: hippocampus; BS: brainstem. Also see Figure S7.
The expression of NFIB in olfactory bulb astrocytes (Lozzi et al., 2020), coupled with its strong association with NFIA in this region led us to examine whether NFIB association with NFIA in the OB inhibits the capacity of NFIA to bind DNA. To test this, we performed AAV-shRNAi knockdown of NFIB in the olfactory bulb, followed by NFIA ChIP-Seq (Fig. 4G). As shown in Figure 4H–N, efficient knockdown of NFIB in the olfactory bulb was achieved and NFIA expression was unaffected. Subsequent NFIA ChIP-Seq revealed a dramatic increase in NFIA binding of DNA in the olfactory bulb when NFIB expression was reduced; in the NFIB knockdown conditions NFIA bound 750 core promoters compared to 22 core promoters in the control (Fig. 4S–U). Together, these data indicate that enhanced association of NFIA with NFIB in the olfactory bulb prevents NFIA from binding DNA.
Astrocyte-neuron proximity is decreased in the hippocampus of NFIA-deficient mice
Our observations that NFIA-deficient astrocytes in the hippocampus exhibit reduced morphological complexity (Fig. 1M, Q, U), diminished Ca2+ activities (Fig. 2O–R), and marked changes at the molecular level (Fig. 3A, E), that are coupled with impaired learning and memory in AAG-KO mice (Fig. 2U), raised the question of how these alterations affect astrocyte-neuron communication and ultimately the local circuits that reside in the hippocampus. A central feature of astrocyte-neuron crosstalk is the juxtaposition of astrocytic processes with neuronal synapses. Given that we observed reduced morphological complexity in hippocampal astrocytes in AAG-KO mice (Fig. 1M, Q, U), we next sought to determine whether loss of NFIA affected the proximity of astrocytes to neurons in the hippocampus.
Towards this we used a recently developed imaging-based assay termed Neuronal-Astrocyte-Proximity-Assay (NAPA), which utilizes Förster resonance energy transfer (FRET)(Octeau et al., 2018). Expression of the FRET donor GFP (NAPA-a) on astrocytic membranes and FRET acceptor mCherry (NAPA-n) on presynaptic membranes allows detection of FRET signal at synaptic scale distances (Fig. 5A). To test neuron-astrocyte proximity in the hippocampus, we used NFIAfl/fl; Aldh1l1-CreER (AA-Con or AA-KO) mouse lines and we injected AAV containing NAPA-n into CA3 and NAPA-a into CA1 of AA-Con or AA-KO mice (Fig. 5B,C). Two weeks after injection, we harvested brains and used confocal imaging to detect FRET signal in CA1 astrocytes (Fig. 5D–K), finding that AA-KO mice had significantly reduced FRET signal per defined astrocyte territory in CA1 (Fig. 5L–M). Importantly, this reduction in FRET signal is not due to the differential expression of AAV-GFAP-NAPA-a across AA-con and AA-KO mice (Supplemental Fig. S6G–I). These observations indicate that astrocyte proximity to presynaptic terminals is altered in the hippocampus of AA-KO mice.
Figure 5. NFIA-deficient astrocytes have defective communication with neurons.
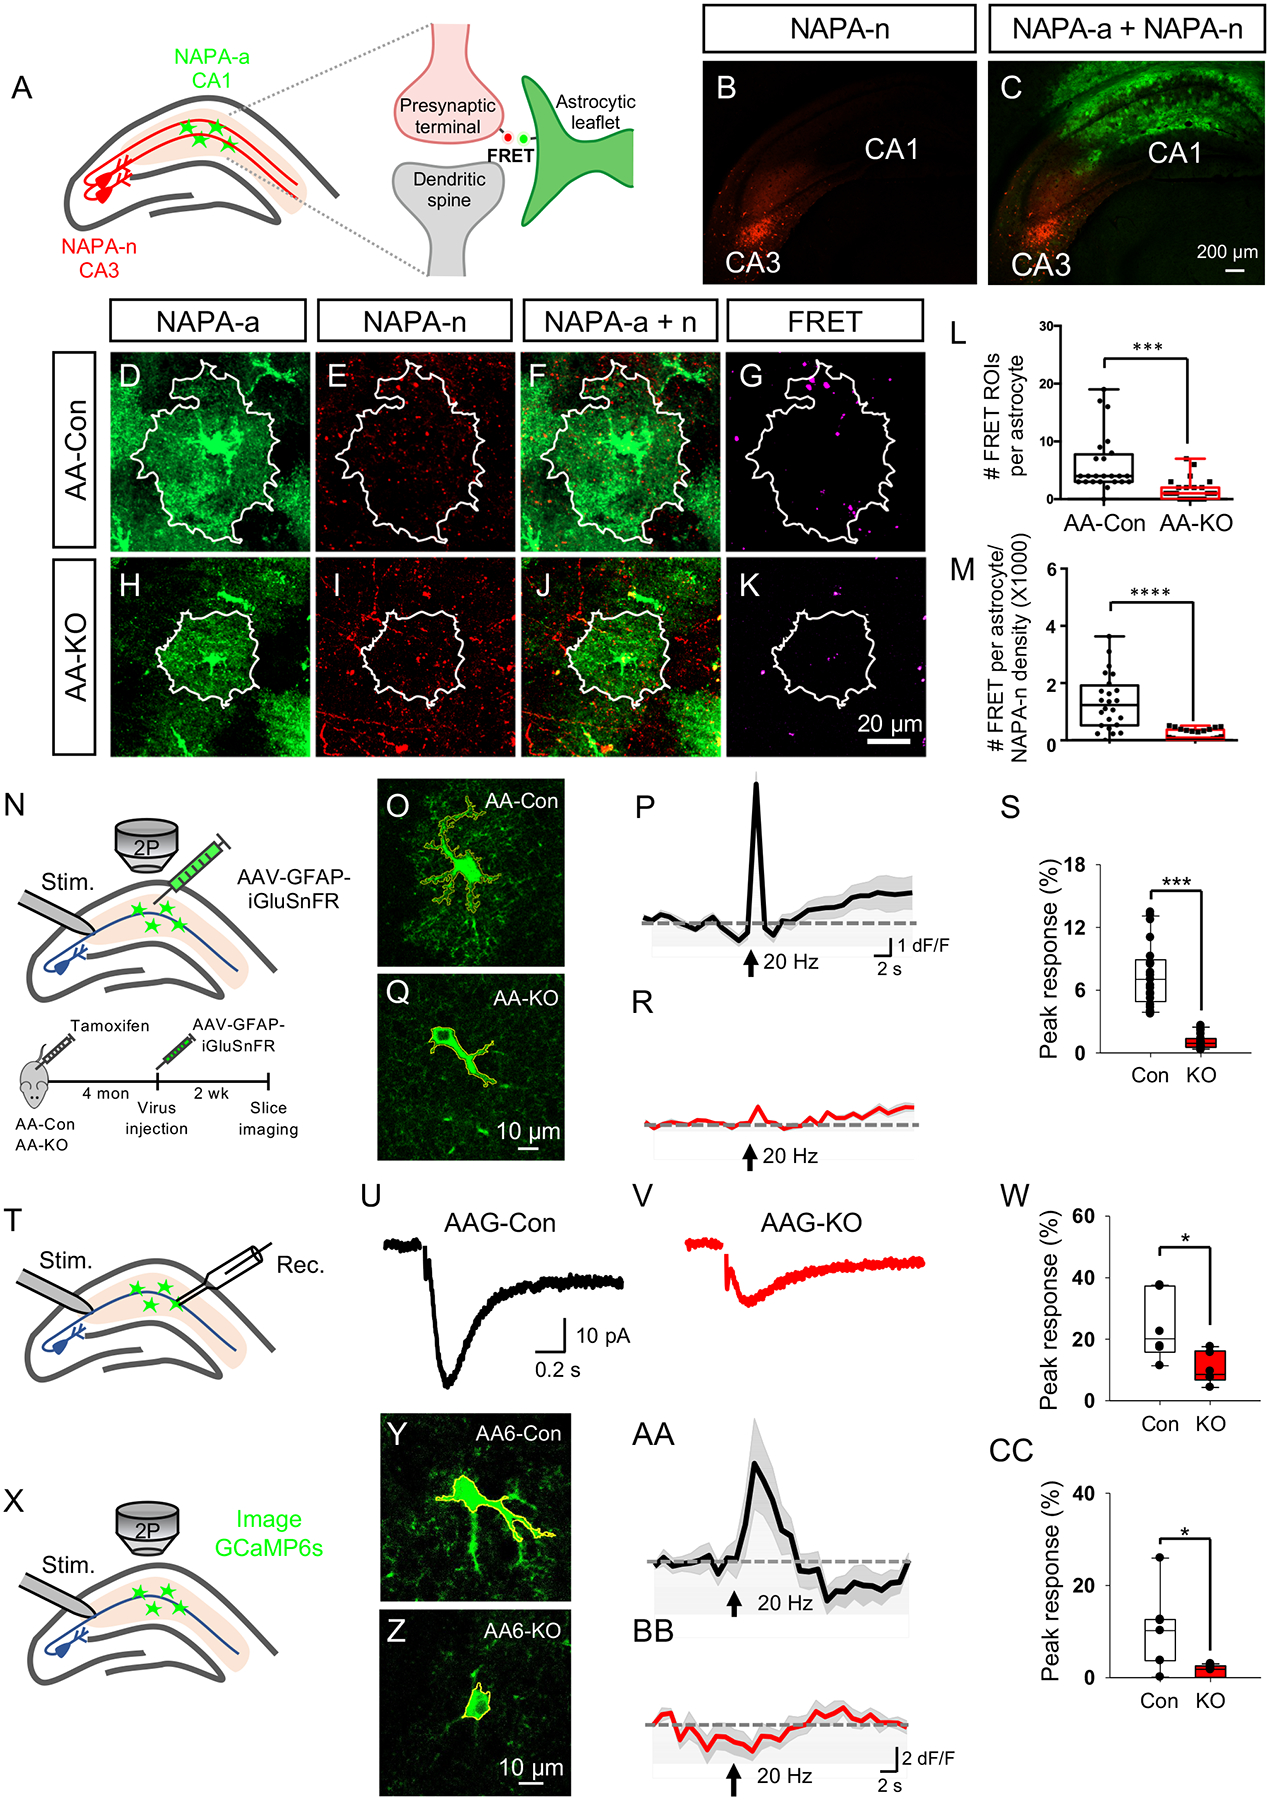
(A) Schematics of the NAPA-system and CA3-CA1 viral injection strategy to detect astrocyte-neuron proximity in hippocampus. (B,C) Representative expression of NAPA-AAV viruses CA3 and CA1. (D–K) Representative images of CA1 astrocytes from AA-Con and AA-KO mice expressing NAPA-a in proximity to projections from CA3 neurons expressing NAPA-n. White outline denotes astrocyte territory. (L–M) Quantification of FRET signals in CA1 astrocytes; data is derived from 4 mice per genotype, 3 slides per mouse, 24 cells from AA-Con group and 24 cells from AA-KO group. Two-tailed unpaired t-test. (N) Schematic of experimental workflow. (O–R) Representative images and traces from AA-con and AA-KO mice showing stimulation induced iGluSnFR activity in hippocampal CA1 astrocytes. (S) Quantification of peak response ΔF/F is derived from 3 mice from each genotype, 21–23 cells total. (T) Schematic of synaptically-induced glutamate transporter current (STC) in hippocampal CA1 astrocytes. (U,V) Representative traces of STC in astrocytes. (W) Quantification of peak response in STC from 3 mice from each genotype, 6 cells total. (X) Schematic for evoked Ca2+ response from hippocampal CA1 astrocytes expressing GCaMP6s. (Y–BB) Representative images and traces from AA6-Con and AA6-KO mice showing synaptically induced GCaMP6s activity in CA1 hippocampal astrocytes. (CC) Quantification of ΔF/F derived from 3 mice from each genotype, 11–12 cells per sample. Student’s two-tailed unpaired t-test. AA-Con denotes: NFIAfl/fl. AA-KO denotes: NFIAfl/fl; Aldh1l1-CreER. AA6-Con denotes: NFIA+/+; Aldh1l1-CreER; Rosa-CAG-LSL-GCaMP6s. AA6-KO denotes: NFIAfl/fl; Aldh1l1-CreER; Rosa-CAG-LSL-GCaMP6s. *p<0.05, **p< 0.01, ***p<0.001, ****p<0.0001. Also see Figure S6 and S8.
Loss of NFIA disrupts astrocyte cross-communication with neurons.
These observed changes in astrocyte proximity to neurons raise the question of whether their cross-communication is also disrupted. Therefore, we next examined whether NFIA-deficient astrocytes exhibited impaired handling of neurotransmitters. To test this, we evaluated detection of extracellular glutamate and GABA in CA1 hippocampal astrocytes using intensity-based glutamate-sensing fluorescent reporter (iGluSnFR) or GABA-sensing fluorescent reporter (iGABASnFR)(Jiang et al., 2016). We generated AAV-containing iGluSnFR under control of the GFAP promoter, injected CA1 region of the hippocampus from AA-KO or AA-Con mice after TM induction (Fig. 5N). Exploiting the well-defined local circuits in the hippocampus, we stimulated the Schaffer collateral pathway in CA3 and imaged sensor activity in CA1 using two photon imaging (Fig. 5N). These studies revealed reduced detection of extracellular glutamate in astrocytes in the AA-KO mice (Fig. 5O–S). The same experimental paradigm with the AAV-GFAP-iGABASnFR revealed a similar reduction in the detection of extracellular GABA in AA-KO mice (Supplemental Fig. S8A–F). Together with the iGluSnFR data, these results suggest that NFIA-deficient astrocytes exhibit impaired detection of extracellular neurotransmitters.
To directly test whether neurotransmitter uptake was impaired in NFIA-deficient astrocytes, we measured synaptically-induced glutamate transporter currents (STCs), an inward current sensitive to glutamate transporter antagonist (TBOA, see method), in hippocampal CA1 astrocytes (Fig. 5T)(Afzalov et al., 2013; Bergles and Jahr, 1997). We found drastic reduction of STCs in NFIA-deficient astrocytes (Fig. 5U–W), consistent with a reduction of extracellular glutamate sensing (Fig. 5P–S). Critically, analysis of input-output curves in evoked EPSC/IPSC from CA1 pyramidal neurons did not reveal any changes between AAG-Con and AAG-KO (Fig. 6K–M). These data indicate that diminished neurotransmitter detection and uptake in AAG-KO astrocytes was not due to alterations in neurotransmitter release from neurons, further reinforcing the results of the iGluSnFR and STC studies.
Figure 6. Loss of NFIA does not affect basal synaptic properties in the hippocampus.
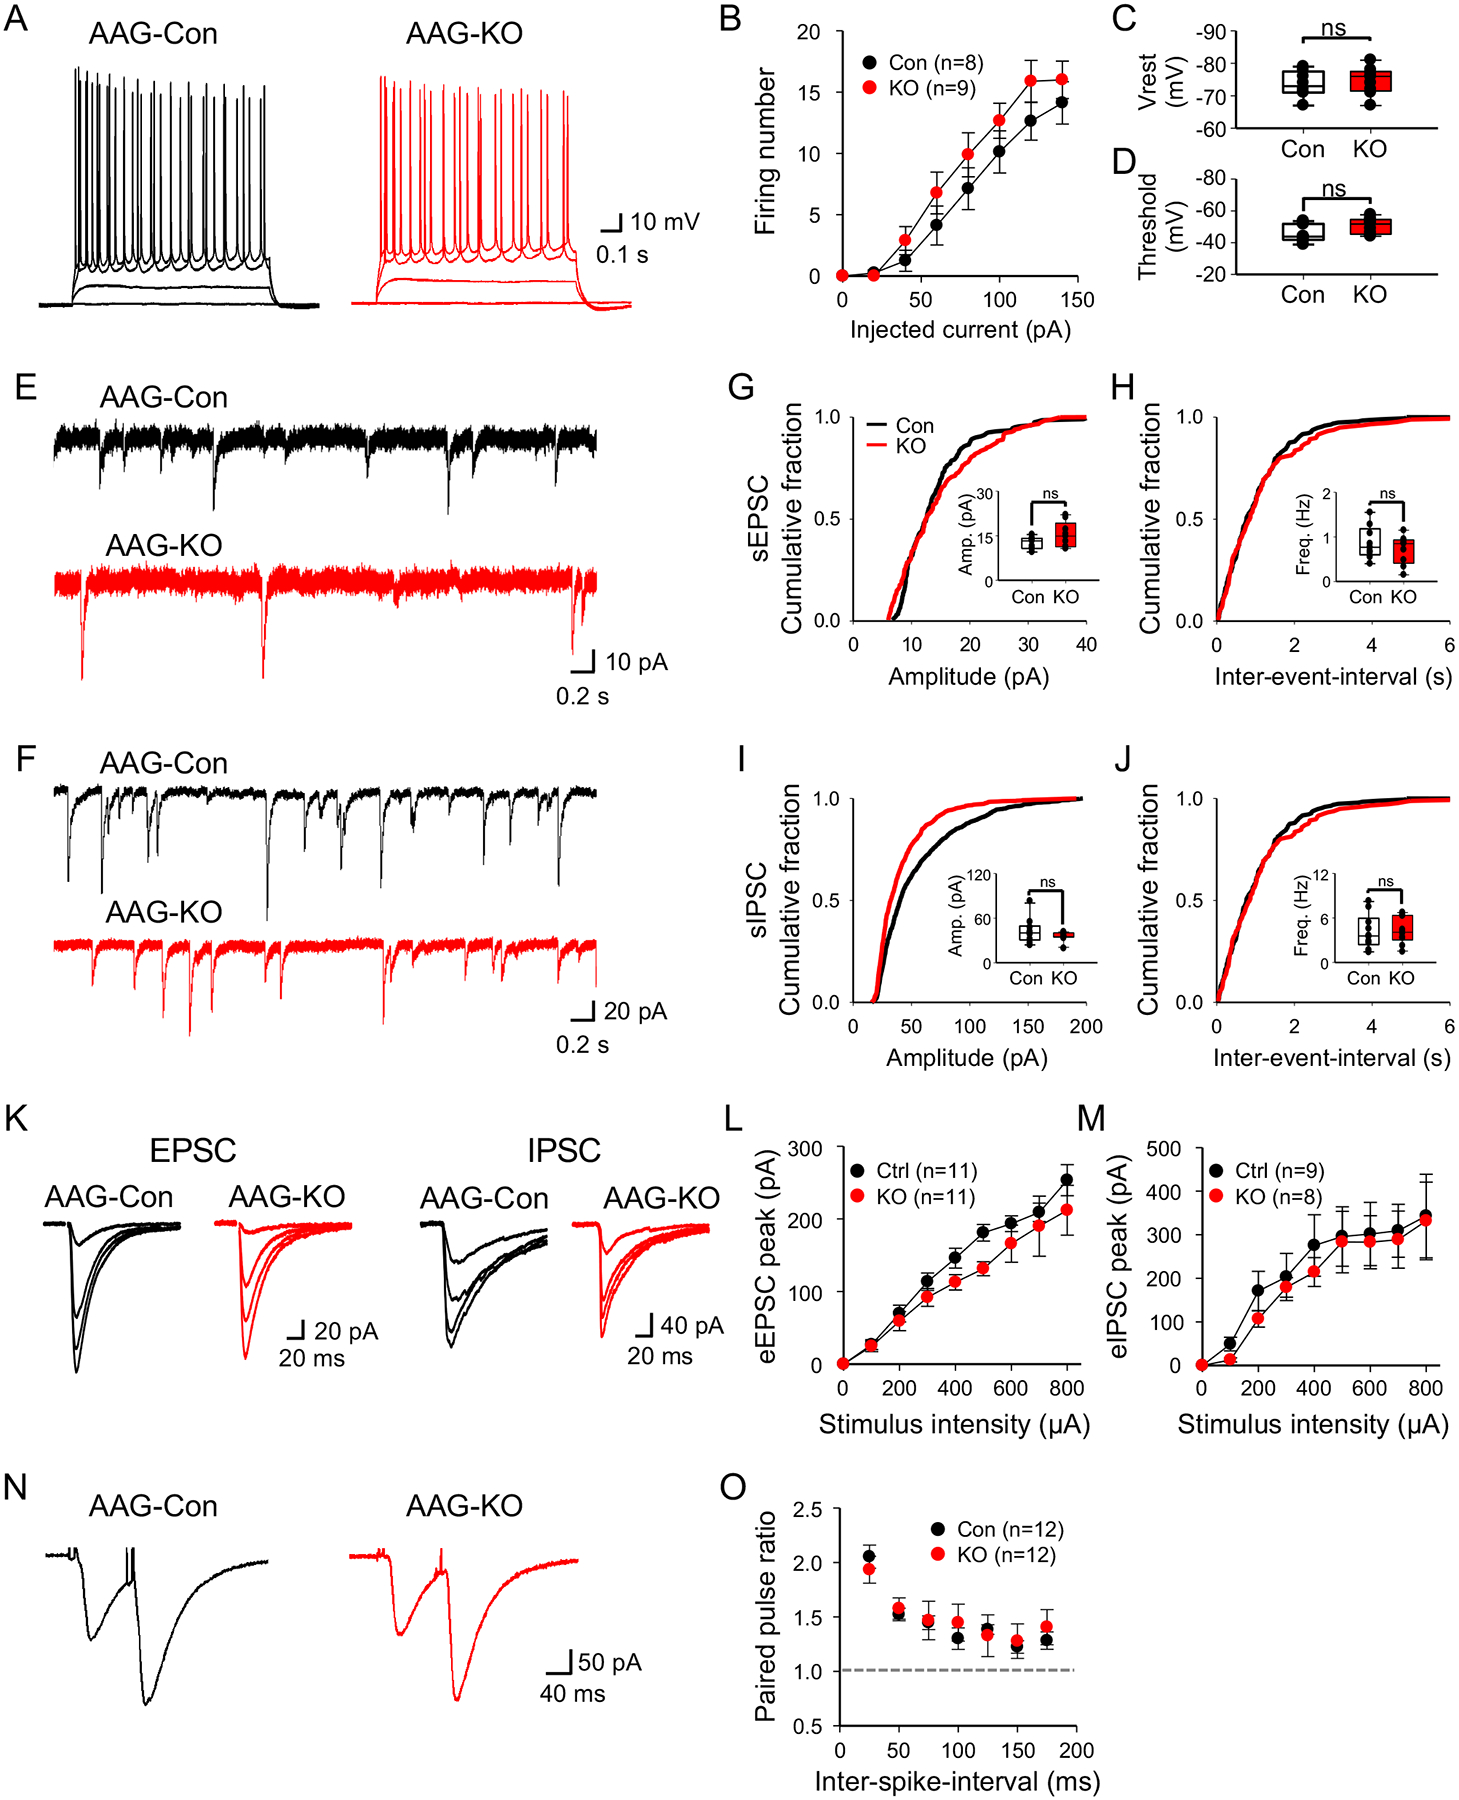
(A) Representative traces of action potential in CA1 pyramidal neurons upon varying the injected current from AAG-Con and AAG-KO. (B) Summary data of action potential firing. (c,d) Summary data of resting membrane potential (C) and threshold (D). (E,F) Representative traces of spontaneous EPSCs (E) and IPSCs (F) from AAG-Con and AAG-KO. (G–J) Summary data of amplitude and frequency in sEPSC (G,H) and sIPSC (I,J) derived from 3 mice from each genotype, 9–10 cells. (K) Representative traces of input-output curve in evoked EPSC (Left) and IPSC (Right) from AAG-Con and AAG-KO. (L,M) Summary data of evoked EPSC (L) and IPSC (M). (N) Representative traces of paired pulse ratio (PPR) upon varying the inter-spike-interval (ISI) from AAG-Con and AAG-KO. (O) Summary data of PPR. Student’s two-tailed unpaired t-test (C,G–J) and two-way ANOVA with Sidak test (B,L,M,O). AAG-Con denotes: NFIAfl/fl; Aldh1l1-GFP. AAG-KO denotes: NFIAfl/fl; Aldh1l1-CreER; Aldh1l1-GFP.
Sensing of glutamate by astrocytes can induce increases in Ca2+ activity(Parpura et al., 1994; Wang et al., 2006), raising the question of whether synaptically induced Ca2+ responses are also diminished in AAG-KO astrocytes. Towards this, we assessed whether astrocytes from AA6-KO mice had altered Ca2+ responses in response to neuronal stimulation. Using stimulation of the Schaffer collateral pathway in CA3, we measured Ca2+ responses in CA1 astrocytes, finding that astrocytes from AA6-KO mice did not elicit synaptically induced Ca2+ responses, while controls elicited a robust response (Fig. 5X–CC). Collectively, the observed reductions in: i) neuron-astrocyte proximity, ii) detection of extracellular neurotransmitters, iii) glutamate transporter current, and iv) synaptically-induced Ca2+ activity, indicate that astrocyte-neuron communication is compromised in NFIA-deficient astrocytes in the hippocampus.
Synaptic plasticity is inhibited in the presence of NFIA-deficient astrocytes
Astrocytes lacking NFIA in the hippocampus exhibit several phenotypes that suggest the associated neuronal circuits are also dysregulated. To determine whether astrocytic-loss of NFIA influences neuronal function, we first evaluated the basal activities of CA1 pyramidal neurons in the hippocampus, finding that neuronal excitability was unaffected (Fig. 5A–D). Furthermore, we examined synaptic transmission by measuring the spontaneous EPSC/IPSC (Fig. 6E–J), input-out curves in evoked EPSC/IPSC (Fig. 6K–M) and release probability by measuring the paired pulse ratio (Fig. 6N,O). We did not identify any gross differences between AAG-Con and AAG-KO conditions in these basal synaptic properties. Overall, we found the basal properties of CA1 hippocampal neurons to have remained largely intact, suggesting they are generally unaffected by the changes in astrocytes elicited by loss of NFIA.
A defining feature of the CA3-CA1 hippocampal circuit is the induction of synaptic plasticity via LTP, a physiological phenomenon that is regulated, in part, by astrocytes(Henneberger et al., 2010; Shigetomi et al., 2013). This form of synaptic plasticity is the physiological correlate of learning and memory(Bliss and Collingridge, 1993; Lynch, 2004) and several studies have shown that alterations in astrocytic Ca2+ can influence these behaviors(Adamsky et al., 2018; Oliveira et al., 2015b). Given the changes associated with loss of NFIA in hippocampal astrocytes, we next examined LTP in this context. We induced LTP via theta burst stimulation (TBS) in the Schaffer collaterals pathway, measuring eEPSCs in CA1 pyramidal neurons by whole-cell patch clamping, and found a dramatic inhibition of LTP in AAG-KO mice compared to AAG-Con (Fig. 7A,C,I). Together, these studies indicate that NFIA function in astrocytes plays an essential role in synaptic plasticity and identify transcriptional mechanisms in astrocytes that oversee circuit function in the hippocampus.
Figure 7. Inhibition of LTP in mice lacking astrocytic NFIA is dependent upon Ca2+ activity.
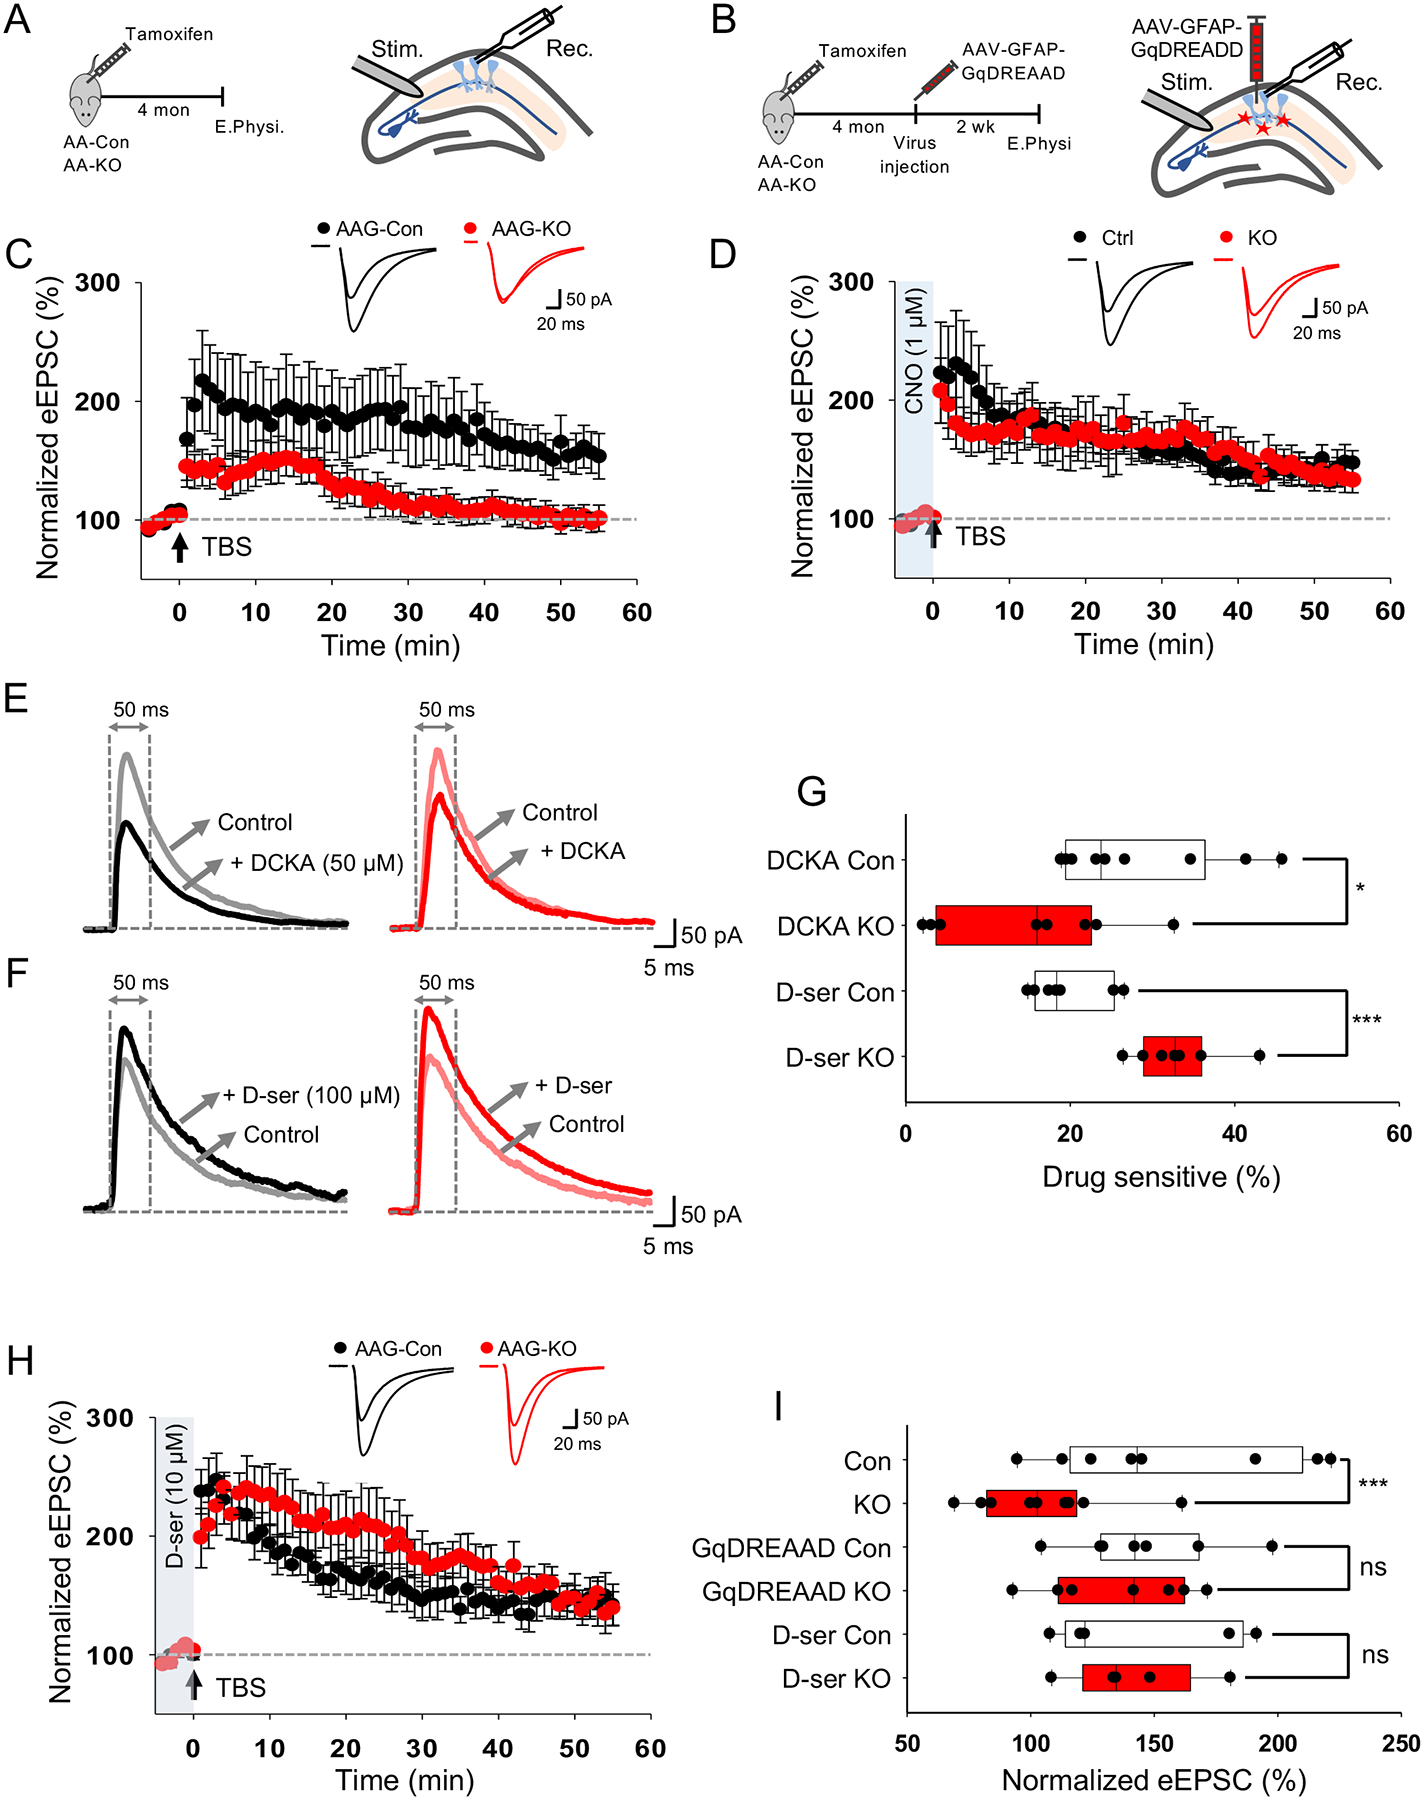
(A) Schematic of LTP recording experiment. (B) Schematic of AAV-GFAP-GqDREADD rescue experiment. (C) LTP traces from AAG-Con and AAG-KO hippocampal slices. (D) LTP traces from AAG-Con and AAG-KO hippocampal slices infected with AAV-GFAP-GqDREADD. (E,F) Representative traces of evoked NMDAR current before and after treatment of DCKA (e) and D-serine (F) from AAG-Con and AAG-KO hippocampal slices. (G) Quantification of DCKA or D-serine sensitive evoked NMDAR current measured at 50 ms after stimulation. (H) LTP traces from AAG-Con and AAG-KO hippocampal slices supplemented with D-serine. (J) Quantification of LTP. All electrophysiological experiments is derived 3 mice from each genotype, ranging from 7–13 cells total for each experiment. * p< 0.05, ***p<0.001, Student’s two-tailed paired (G) and unpaired (J) t-test. AAG-Con denotes: NFIAfl/fl; Aldh1l1-GFP. AAG-KO denotes: NFIAfl/fl; Aldh1l1-CreER; Aldh1l1-GFP. Also see Figure S8.
Increasing Ca2+ activity in NFIA-deficient astrocytes rescues synaptic plasticity
Several lines of evidence from prior studies indicate that astrocytic Ca2+ activity plays a key role in LTP(Henneberger et al., 2010). Interestingly, hippocampal astrocytes lacking NFIA exhibit stark decreases in spontaneous and synaptically-induced Ca2+ activity (Fig. 2O–R; Fig. 5AA–CC), that are coupled with diminished LTP (Fig. 7C). Moreover, transcriptome analysis indicated that genes associated with calcium ion binding and handling were downregulated in NFIA-deficient astrocytes in the hippocampus (Fig. 3G). Put together, these observations raise the possibility that reduced Ca2+ activity contributes to the deficits in LTP in NFIA-deficient astrocytes.
To determine whether reduced Ca2+ activity in NFIA-deficient astrocytes decreases LTP, we employed an approach using adeno associated viral (AAV) hM3Dq designer receptors exclusively activated by designer drugs (DREADD) to restore Ca2+ activity in hippocampal CA1 astrocytes of AAG-KO mice (Fig. 7B). We injected AAV-GFAP-hM3Dq into hippocampal CA1 region and confirmed that clozapine-N-oxide (CNO, 1 μM) restored Ca2+ activity in AA6-KO (Supplementary Fig. S8G–M). Finally, we measured LTP from hM3Dq-injected AAG-KO in the presence of CNO and found that hM3D-mediated restoration of Ca2+ activity in NFIA-deficient astrocytes rescued LTP (Fig. 7D,I), indicating that NFIA regulation of Ca2+ activity in astrocytes plays a key role in maintaining synaptic plasticity in the hippocampus.
Astrocytic control of LTP is mediated, in part, by Ca2+-dependent release of D-serine(Henneberger et al., 2010; Shigetomi et al., 2013), raising the question of whether the diminution of LTP in NFIA-deficient astrocytes is due to defects in astrocytic D-serine. To address this, we determined whether D-serine tone is reduced in the CA1 region of the hippocampus in AAG-KO mice by measuring evoked NMDAR current in CA1 pyramidal neurons using GluN1 glycine binding site antagonist, DCKA(Leeson et al., 1991) and exogenous D-serine. We found a significant decrease in DCKA-sensitive current and an increase of D-serine induced current in astrocytes following loss of NFIA (Fig. 7E–G), suggesting reduced D-serine tone in AAG-KO. We next determined whether exogenous D-serine was sufficient to restore LTP in AAG-KO by treating AAG-KO and control hippocampal slices with D-serine and recording LTP. We found that addition of D-serine rescued LTP in the AAG-KO mice (Fig. 7H–I). This result, coupled with LTP rescue by GqDREADD in AAG-KO mice, indicates that NFIA regulates Ca2+- dependent D-serine release in hippocampal astrocytes during synaptic plasticity.
Discussion
Region-specific transcriptional control of astrocyte function
Transcription factors control every facet of cell physiology, yet their contributions to astrocyte function in the adult brain remain poorly defined. Our studies employed newly developed and highly specific approaches for temporal-conditional deletion of the transcription factor NFIA in astrocytes in the adult brain (Srinivasan et al., 2016). Analysis of astrocyte morphology, Ca2+ activity, region-associated behaviors, and gene expression 2–4 months after deletion revealed region-specific dependencies on NFIA: these criteria remain largely intact in cortex, brainstem, and olfactory bulb, while astrocytes in the hippocampus displayed reduced morphological complexity, diminished Ca2+ activity, impaired learning and memory, and significant alterations in gene expression. Furthermore, our data suggests that these region-specific effects on astrocytes did not progress, as the brainstem and olfactory bulb did not demonstrate altered morphologies four months after NFIA deletion (Supplemental Fig. S3). Recent studies on aging astrocytes revealed altered morphologies and drastic changes in their gene expression profiles(Boisvert et al., 2018; Jyothi et al., 2015). It will be important to decipher whether loss of NFIA accelerates these aging-induced changes in select regions and whether olfactory bulb and brainstem display latent dependencies. In addition, it’s important to note that even though astrocytes from the olfactory bulb and brainstem appear normal, loss of NFIA resulted in the dysregulation of ~200 genes in each region (Fig. 3E). Given these significant molecular changes, it is possible that these astrocytes exhibit functional alterations that we cannot detect given current technologies or that they require pathological states to manifest.
Transcriptional regulation in the CNS has long been viewed through the lens of development, with transcriptional control of mature neuronal or glial function in the adult brain remaining poorly defined. To our knowledge, these findings with NFIA are the first example of a region-specific transcriptional dependency operant in the adult brain for astrocytes. Several recent studies interrogated the molecular diversity of astrocytes from different brain regions and the identification of region-specific transcription factor expression profiles was limited(Chai et al., 2017; Lozzi et al., 2020; Morel et al., 2017). Despite being expressed in a vast majority of astrocytes, NFIA exhibits region-specific functions, with enhanced association with NFIB in the olfactory bulb suppressing the ability of NFIA to bind DNA (Fig. 4). Given that NFIA and NFIB cooperatively regulate astrocyte development, it is surprising that they have an antagonistic relationship in mature astrocytes from the olfactory bulb. These findings raise several questions about the interrelationships between NFIA and other NFI-family members (NFIX and NFIC) and whether inhibitory (or cooperative) relationships exist in astrocytes from other brain regions. Taken further, given that NFIB and NFIX are also expressed in mature astrocytes in the adult brain (Lozzi et al., 2020), it will be important to decipher whether these other NFI-family members contribute to mature astrocyte function, in a region specific manner in the adult brain. In light of the region-specific dependencies for NFIA expression, one intriguing possibility is that astrocytes from different brain regions are dependent upon different members of the NFI-family, raising the possibility that a region-specific NFI-family transcription factor code regulates astrocyte function across the adult brain.
Insights into astrocyte control of neuronal circuits
Astrocyte morphology is intimately linked to their function and our observations that hippocampal astrocytes lacking NFIA display alterations in morphology led us to examine a host of core astrocyte functions. These studies revealed impaired Ca2+ activity and detection of neurotransmitters that are coupled with decreased proximity to neurons. Examination of the transcriptomic data from NFIA-deficient astrocytes revealed the dysregulation of many genes linked to cell structure, morphogenesis, and Ca2+ handling (Fig. 3G), suggesting that NFIA regulates the maintenance of both morphology and function. In support of this, our finding that LTP is rescued by GqDREADD-driven restoration of astrocytic Ca2+ in AAG-KO mice indicates that NFIA target genes likely function in part through Ca2+-dependent mechanisms during synaptic plasticity. Widespread roles in regulating cellular homeostasis are not surprising given that transcription factors regulate a spectrum of genes that can influence several aspects of cell physiology. Future studies on NFIA in hippocampal astrocytes will be aimed at dissecting these gene networks and essential downstream effectors mediating these roles. More broadly, these findings further suggest that other transcriptional dependencies exist for astrocytes from other brain regions.
Because our manipulations occurred after circuits in the hippocampus were established in the adult brain, our studies provide insight into the roles of astrocytes in maintaining established circuit function. We found that the changes in astrocytes driven by loss of NFIA, did not influence basal neuronal properties in CA1 of the hippocampus (Fig. 6). It is possible that with more time, under these specific astrocytic conditions, we would observe changes in basal neuronal physiology, though we analyzed groups four months after deletion. Strikingly, we observed an effect specifically during synaptic plasticity, where astrocytic-loss of NFIA resulted in a nearly complete inhibition of LTP-induced synaptic plasticity. These changes in LTP were coupled with impaired learning and memory behaviors, indicating that astrocytes “are needed when called upon” in established hippocampal circuits. Under basal conditions, in the context of NFIA-deficient astrocytes, close astrocyte-neuron proximity is dispensable, whereas under stimulated conditions close astrocyte proximity is required to facilitate plasticity-dependent circuit function.
Our findings are seemingly at odds with several studies showing roles for astrocytes in basal neuronal function in the hippocampus(Fiacco and McCarthy, 2004; Panatier et al., 2011; Pascual et al., 2005; Santello et al., 2011). However, when reconciling these disparities we must consider fundamental differences in the methodological approaches employed towards the study of astrocyte. First, a majority of studies on astrocytes in this context employ acute pharmacological manipulations in slices, while our studies rely on in vivo, genetic deletion in mature astrocytes. Second, we assess circuit function 2–4 months after the genetic deletion of NFIA, while most pharmacological studies assess function immediately after or during drug treatment. Third, our studies genetically delete a transcription factor, while these pharmacological and other genetic approaches mainly rely on manipulating channel and receptor activities. Given these fundamental differences, it is difficult to directly correlate these studies. Nevertheless, the collective observations that acute pharmacological manipulations and chronic genetic manipulations yield contrasting results likely tells us something about adaptation of basal circuit function in the hippocampus. In our case (chronic, genetic), the circuit has had time to adapt to loss of astrocyte proximity and has compensated accordingly. In the case of the acute, pharmacological manipulations(Fiacco and McCarthy, 2004; Panatier et al., 2011), the system has not had time to compensate. Critically, these compensatory concepts only apply to basal circuit function, as the circuit has not properly adapted to evoked LTP conditions (i.e. synaptic plasticity) under chronic, genetic conditions.
Our methodologies allowed us to explore different facets of neuron-astrocyte interactions in established hippocampal circuits, enabling us to reinforce and expand several aspects of astrocyte contributions to synaptic plasticity. The role of astrocytic calcium in LTP has been somewhat controversial(Bazargani and Attwell, 2016; Savtchouk and Volterra, 2018), with recent evidence supporting a direct role in LTP induction(Henneberger et al., 2010; Shigetomi et al., 2013), conflicting with other observations suggesting that it does not contribute to LTP(Agulhon et al., 2010). Our data show that loss of astrocytic NFIA dramatically reduces Ca2+ (Fig. 2O–R) and this reduction is correlated with impaired LTP (Fig. 7C). Moreover, we show that GqDREADD-driven restoration of astrocytic Ca2+ in AAG-KO mice restores LTP (Fig. 7D), further reinforcing a role for astrocytic Ca2+ activity in LTP. It’s important to note that the acute CNO administration (i.e. 5min prior to recording) is unlikely to be sufficient to restore morphology and that restoration of LTP under these conditions is likely due to an increase in the release of Ca2+-dependent release of gliotransmitters.
Among gliotransmitters released from astrocytes, D-serine plays a critical role in astrocyte regulation of LTP(Henneberger et al., 2010; Shigetomi et al., 2013). We found that supplementing D-serine is able to rescue LTP in the AAG-KO mice and that general D-serine tone is reduced as well. These effects are unlikely to be the result of defects in D-serine synthesis in astrocytes, as serine racemase expression was unaffected in the AGG-KO mice but instead suggests that either release by astrocytes or uptake at the synapse is abnormal. In light of our data, both scenarios are possible. Release of D-serine is calcium-dependent and NFIA-deficient astrocytes exhibit defective Ca2+ activity. While neurons in the AAG-KO mouse appear normal, it is possible that lower amounts of astrocytic D-serine reach the post-synaptic terminal owing to the decreased astrocyte complexity, which manifests as decreased astrocyte-neuron proximity.
STAR Methods
RESOURCE AVAILABILITY
Lead Contact
Further information and requests for resources and reagents should be directed to and will be fulfilled by the Lead Contact, Benjamin Deneen (deneen@bcm.edu).
Materials Availability
All published reagents will be shared on an unrestricted basis after completion of a material transfer agreement; reagent requests should be directed to the lead contact.
Data and Code Availability
The RNA-seq and ChIP-seq dataset generated during this study are available at the NCBI GEO website. RNA-seq, accession GEO: GSE146000. ChIP-seq, accession GEO: GSE146064.
EXPERIMENTAL MODEL AND SUBJECT DETAILS
Animals
All experimental animals were treated in compliance with the US Department of Health and Human Services, the NIH guidelines, and Baylor College of Medicine IACUC guidelines. All mice were housed with food and water available ad libitum in a 12-hour light/dark environment. Both female and male mice were used for all experiments, and littermates of the same sex were randomly allocated to experimental groups. For ex vivo and in vivo experiments, adult mice aged 3-month or 5-month were used unless otherwise described. All mice used in this study were maintained on the C57BL/6J background. NFIA conditional knockout mice were generated by crossing NFIA fl/fl conditional mutant mice (Scavuzzo, et al. 2018). with Aldh1l1-CreER (The Jackson Laboratory; RRID:IMSR_JAX:029655), resulting in NFIAfl/fl; Aldh1l1-CreER (AA-KO) and NFIAfl/fl (AA-Con) littermate controls. For histological analysis, the Aldh111 -GFP mouse was crossed with AA-KO, resulting in NFIAfl/fl; Aldh1l1-CreER; Aldh1l1-GFP (AAG-KO) and NFIAfl/fl; Aldh1l1-GFP (AAG-Con) mice. To analyze calcium activity, the Ai96 (RCL-GCaMP6s) mouse (The Jackson Laboratory; RRID:IMSR_JAX:024106) was crossed with AA-KO, resulting in NFIAfl/fl; Aldh1l1-CreER; Rosa-LSL-GCaMP6s (AA6-KO) and NFIAfl/+; Aldh1l1-CreER; Rosa-LSL-GCaMP6s (AA6-Con) mice. For morphological analysis using tdTomato labeling, the Ai9(RCL-tdT) mice (The Jackson Laboratory, RRID:IMSR_JAX:007909) was crossed with AA-KO, resulting in NFIAfl/fl; Aldh1l1-CreER; Rosa-LSL-tdTomato (AAT-KO) and NFIAfl/+; Aldh1l1-CreER; Rosa-LSL-tdTomato (AAT-Con) mice. To induce deletion of NFIA in mature astrocytes in the adult brain, five-week-old mice were injected intraperitoneally with 100 mg/kg body weight of Tamoxifen (Sigma-Aldrich, cat no. T5648) dissolved in a 9:1 corn oil/ethanol mixture for 5 days, 1 injection per day. Above experiments were approved by Baylor College of Medicine IACUC.
METHOD DETAILS
Immunofluorescence on frozen brain tissues
Mice were anesthetized under isoflurane inhalation and perfused transcardially with 1XPBS pH 7.4 followed by 4% paraformaldehyde (PFA). Brains were removed, fixed in 4% PFA overnight, and placed in 20% sucrose for 24 hours before embedded in OCT. Sections of 20 μm (morphological analysis using GFP labeling) or 40 μm (morphological analysis using tdTomato labeling, NAPA) were made on a cryostat, washed with 1XPBS 5 min X3, blocked with 10% goat or donkey serum in PBS with 0.3% Triton x-100, and incubated with primary antibodies in blocking solution overnight. On the next day, sections were incubated with secondary antibodies for 1 h RT, followed by incubation with DAPI for 10min, and mounted with VECTASHIELD Antifade Mounting Media (Vector Laboratories, H-1000). The following primary antibodies were used: Chicken anti-GFP (1:1000; abcam, ab13970), rabbit anti-NFIA (1:500; Sigma, HPA006111), chicken anti-GFAP (1:1000; abcam, ab4674), mouse anti-GFAP (1:1000, EMD millipore, MAB360), goat anti-Sox9 (1:750; RD system, AF3075), mouse anti-NeuN (1:250, millipore, MAB377), and rabbit anti-NFIB (1:500; Sigma, HPA003956). The following secondary antibodies were used (1:500): Alexa Fluor 488 goat anti-chicken (Thermo Fisher Scientific, A11039), Alexa Fluor 568 goat anti-rabbit (Thermo Fisher Scientific, A11036), Alexa Fluor 568 donkey anti-goat (Thermo Fisher Scientific, A11057), and Alexa Fluor 488 Donkey anti-chicken (Jackson ImmunoResearch Labs, 703-545-155).
Confocal imaging and image analysis
To measure astrocyte morphology, fluorescent images were acquired using a Zeiss LSM 880 laser scanning confocal microscope with 63X oil immersion objective with frame size at 1024 × 1024 and bit depth at 12. Serial images at z axis were taken at an optical step of 1 μm, with overall z-axis range encompassing the whole section. Images were imported to Imaris Bitplane software, and only astrocytes with their soma between the z-axis range were chosen for further analysis (Lanjakornsiripan et al., 2018) (Lanjakornsiripan et al., 2018) (Lanjakornsiripan et al., 2018) (Lanjakornsiripan et al., 2018) (Lanjakornsiripan et al., 2018) (Lanjakornsiripan et al., 2018) (Lanjakornsiripan et al., 2018) (Lanjakornsiripan et al., 2018) (Lanjakornsiripan et al., 2018) (Lanjakornsiripan et al., 2018) (Lanjakornsiripan et al., 2018). We performed 3D surface rendering (Figure 1 and Supplemental Figure 2) using the Imaris Surface module, and color-coded the reconstructed surface images based on the surface area of each astrocyte. Morphological analysis was performed using the Imaris Filament module. Astrocyte branches and processes were outlined by Autopath with starting point set at 8 μm and seed point set at 0.7 μm, and statistical outputs including “filament number Sholl intersections” were extracted and plotted with Prism software. Data were generated from 3 brain sections per region per mouse with 3 mice per genotype. The number of astrocytes analyzed were as follows: 1st time point (Figure 1) — AAG-con olfactory bulb: 37, cortex: 37, hippocampus: 39, brainstem: 41; AAG-KO olfactory bulb: 42, cortex: 47, hippocampus 44, brainstem 38. 2nd time point (Supplemental Figure 2) — AAG-con olfactory bulb: 39, cortex: 34, hippocampus: 40, brainstem: 38; AAG-KO olfactory bulb: 36, cortex: 44, hippocampus: 46, brainstem: 32. To analyze number of astrocytes, fluorescent images were acquired using a Zeiss LSM 880 laser scanning confocal microscope with 20X objective. Cell numbers were quantified by the QuPath software Cell Detection function(Bankhead et al., 2017). The person who analyzed the images was blinded to the experimental groups.
Slice recording
Animals were deeply anesthetized with isoflurane. After decapitation, the brain was quickly excised from the skull and submerged in an ice-cold cutting solution that contained (in mM): 130 NaCl, 24 NaHCO3, 1.25 NaH2PO4, 3.5 KCl, 1.5 CaCl2, 1.5 MgCl2, and 10 D(+)-glucose, pH 7.4. The whole solution was gassed with 95 % O2–5 % CO2. After trimming the hippocampal brain, 300 μm parasagittal slices were cut using a vibratome with a blade and transferred to extracellular ACSF solution (in mM): 130 NaCl, 24 NaHCO3, 1.25 NaH2PO4, 3.5 KCl, 1.5 CaCl2, 1.5 MgCl2, and 10 D(+)-glucose, pH 7.4.
Slices were incubated at room temperature for at least one hour prior to recording before transferred to a recording chamber that was continuously perfused with ASCF solution (flow rate = 2 ml/min). The slice chamber was mounted on the stage of an upright Olympus microscope and viewed with a 60X water immersion objective (NA = 0.90) with infrared differential interference contrast optics. Whole-cell recordings were made from pyramidal neurons and astrocytes in the CA1 hippocampus. The holding potential was −60 mV. Pipette resistance was typically 5–8 MΩ. The pipette was filled with an internal solution (in mM): 140 K-gluconate, 10 HEPES, 7 NaCl, and 2 MgATP adjusted to pH 7.4 with CsOH for action potential and passive conductance measurements; 135 CsMeSO4, 8 NaCl, 10 HEPES, 0.25 EGTA, 1 Mg-ATP, 0.25 Na2-GTP, 30 QX-314, pH adjusted to 7.2 with CsOH (278–285 mOsmol) for EPSC measurement; 135 CsCl, 4 NaCl, 0.5 CaCl2, 10 HEPES, 5 EGTA, 2 Mg-ATP, 0.5 Na2-GTP, 30 QX-314, pH adjusted to 7.2 with CsOH (278–285 mOsmol) for IPSC measurement. Spontaneous EPSCs were measured in the presence of GABAAR antagonist, bicuculline (20 μM, Tocris). IPSCs were measured in the presence of ionotropic glutamate receptor antagonists, APV (50 μM, Tocris), and CNQX (20 μM, Tocris). All holding potential values stated are after correction for the calculated junction potential offset of 14 mV. Evoked responses were obtained by concentric bipolar tungsten stimulating electrodes (FHC, ME. USA) placed in the CA3 region to activate the Schaffer pathway. Evoked NMDAR currents were measured in CA1 pyramidal neurons at +40 mV holding potential. To avoid the contamination with the AMPAR current, we measured the amplitude of responses 50 ms after stimulation.
After recording a stable 5-min baseline, LTP was induced by TBS (10 trains of 4 half-maximal stimuli at 100Hz within 200 ms interval) while clamping the cell at 0 mV. Before patching a whole cell, at giga seal configuration, a test pulse (0.1Hz) was delivered for about 10 min to warm up the fiber in order to avoid run-up effects. At this stage, stimulation intensity was adjusted to 150–200% of threshold (inducing action potential). After making a whole cell configuration, we delivered the LTP protocol within 10 min to avoid any “wash out” effect from the internal solution(Granger et al., 2013). Evoked EPSCs (eEPSCs) were collected every 10 seconds with a holding potential of −60 mV. All collected eEPSCs were normalized to the average of the baseline. In LTP rescue experiments (Fig. 6), drugs such as D-serine (10 μM, Sigma-Aldrich) and CNO (1 μM, Sigma-Aldrich) were administered for 5 min before and after TBS stimulation.
Synaptically-induced glutamate transporter current (STC) was measured in hippocampal astrocytes by whole-cell path clamp with potassium-based internal solution (in mM: 140 K-gluconate, 10 HEPES, 7 NaCl, and 2 MgATP adjusted to pH 7.4 with CsOH) in current clamp mode (holding potential: −70 mV) in the presence of antagonist for ionotropic glutamate receptor (CNQX 20 μM, APV 50 μM) and GABA receptors (bicuculline 20 μM, CGP 35348 5 μM), as previously described (Bergles and Jahr, 1997). STC was isolated by subtracting the response in the presence of glutamate transporter antagonist DL-TBOA (100 μM, Tocris) from the control response (Afzalov et al., 2013).
All recordings were performed at room temperature, using pCLAMP10 (Axon Instruments, Molecular Devices) and a MultiClamp 700B amplifier (Axon instruments, Molecular Devices). Cells with Ra that exceeded 30 MΩ were excluded from analysis. Analysis was performed using ClampFit 10.7 software.
Two-photon imaging
For two-photon imaging, mice were deeply anesthetized with isoflurane and then perfused with cold artificial cerebrospinal fluid (ACSF, in mM:125 NaCl, 25 glucose, 25 NaHCO3, 2.5 KCl, 2 CaCl2, 1.25 NaH2PO4 and 1 MgCl2, pH 7.3, 310–320 mOsm). The brain was dissected, embedded in low melting point agarose and placed in an ice-cold sucrose-based cutting solution (in mM: 87 NaCl, 2.5 KCl, 1.6 NaH2PO4, 25 NaHCO3, 75 sucrose, 10 glucose, 1.3 ascorbic acid, 0.5 CaCl2, 7 MgCl2). 300 μm thick brain slices were sectioned on a vibratome. Slices were then recovered in oxygenated ACSF (37°C) for 15 min and allowed to acclimate to room temperature for at least 15 min before imaging. We recorded calcium traces using a two-photon resonant microscope (LSM 7MP, Zeiss) equipped with a Coherent Chameleon Ultra (II) Ti-sapphire laser tuned to 900 nm and a 20×, 1.0 NA Zeiss objective. Calcium activity was typically sampled at ~1 Hz. Optical signals were recorded for ~5 minutes per trial at 1024 × 1024 pixel resolution. We recorded data from astrocytes at depths of ~30 μm below the surface. All multiphoton imaging experiments were performed within 2–4 hours of slicing.
Image analysis of Ca2+, iGluSnFR, and iGABASnFR
Spontaneous Ca2+ signal was detected in astrocytes expressing GCaMP6s from the olfactory bulb, prefrontal cortex, hippocampus, and brainstem. The detection of region of interest (ROI) for soma and microdomain for Ca2+ imaging was performed in a semi-automated manner using the GECIquant program as described in a previous study (Srinivasan et al., 2015). After thresholding from temporally projected stack images with a maximum intensity projection, a polygon selection was manually drawn around the approximate astrocyte territory of interest, and the selection was added to the ImageJ ROI manager. Note that the assignment of territory was approximate and was not used for analysis. The area criterion was 30 μm2 to infinity for soma and 0.5–4 μm2 for microdomain within the GECIquant ROI detection function. Intensity values for each ROI were extracted in ImageJ and converted to dF/F values. For each ROI, basal F was determined during 10-s periods with no fluctuations. Clampfit 10.7 software was used to detect and measure amplitude and frequency values for the somatic and microdomain transients. We counted the response following with these criteria: amplitude (>0.5 dF/F), pre-trigger time (3 ms), and minimum duration (5 ms). CNO-induced Ca2+ responses were measured in hippocampal astrocytes expressing AAV-GFAP-GqDREADD. The responses were measured in soma using the ROI detection function in the GECIquant program and calculated by integrated area-under-curve (AUC) using SigmaPlot 13 software. The evoked Ca2+, glutamate, and GABA responses were measured in hippocampal astrocytes expressing GCaMP6s, AAV-iGluSnFR (Haustein et al., 2014), and AAV-iGABASnFR, respectively. The responses were measured in soma using somatic the GECIquant ROI detection function after electrical stimulation (20 Hz, 1 sec) of the Schaffer Collateral pathway.
Behavioral tests
We subjected 5-month-old male mice to behavioral tests. All the experimental mice were transferred to the testing room at least 30 min prior to the test. All tests were performed with white noise at ± 60 dB in a designated room. The person performing the tests was blinded to the experimental groups.
Three-chamber odor preference behavior test
AAG-Con and AAG-KO mice were subjected to the habituation/dishabituation olfactory test modified to take place in a three-chambered behavioral box and measure odor detection threshold (Fitzgerald et al., 2014; Zou et al., 2015). On day 1 to 3, we habituated the test mouse to the empty three-chambered box for 4 min per day. On day 4, we first habituate the test mouse to three trials (4 min per trial) of mineral oils in both chambers. After habituation, we introduced the test mouse to four trials of (R)-Limonene placed in one chamber and mineral oil in another chamber. To test the odor detection threshold, we increased the concentration (R)-Limonene in the following series 10−6, 10−5, 10−4, 10−3 and measured the time the mouse spent in the (R)-Limonene chamber versus mineral oil chamber. Increased time spent in the (R)-Limonene chamber was considered detection of odor and we identified the concentration at which this increase occurred as the odor detection threshold. Video was recorded using a logitech C615 camera and Debut Video Capture Software. Analysis of mouse position was performed by OptiMouse MATLAB program (Ben-Shaul, 2017). Preference index was calculated by OptiMouse as (enrichment zone (R)-Limonene – enrichment zone mineral oil)/(enrichment zone (R)-Limonene + enrichment zone mineral oil).
Unrestrained whole body plethysmography (uWBP)
We used Buxco® Small Animal Whole Body Plethysmography (Buxco Respiratory Products, Data Sciences International) to measure breathing parameters on conscious, unrestrained AAG-Con and AAG-KO mice (Bosnjak et al., 2014; Glynn et al., 2015; Haapakoski et al., 2011; Rajavelu et al., 2015). On day 1 and day 2, mice were habituated to plethysmography chambers for 30 min per day. On day 3, mice were weighed and acclimated to the chamber for 30 min, after which their breathing was monitored for one hour. Buxco FinePointe software was used to calculate breaths per minute and compensated tidal volume (mL), which takes into account temperature and humidity. Instantaneous tidal volume and breathing rate were calculated and exported as the average value of every 2 min over the 60 min testing period. The flow transducers, temperature sensors, and humidity sensors were calibrated before every trial. Data were analyzed by two-way repeated measures ANOVA.
Open field test
The open field tests were performed using the Versamax system. The Versamax open field chamber is a square arena (40cmx40cmx30cm, Accuscan Instruments) enclosed by transparent walls. Each mouse was put into the center of the chamber. Locomotor activity was detected automatically by sensor beams at X, Y, and Z directions. Data were recorded in 15 two-minute blocks for 30 min total and were analyzed and exported with Versadat software.
Novel place recognition
Mice were subjected to a 4-day novel place recognition test in a clear square chamber (L 40cm × W 40cm) with a long strip taped at the rear as a visual cue. On day 1 to 3, mice were subjected to habituation trial in an empty chamber for 10 min, followed by sample trial in another chamber with 2 identical objects for 10 min. On day 4, mice were subjected to the same 10 min habituation trial and10 min sample trial sequence in which one object was shifted forward. We defined coming in contact with the object or sniffing it closely (less than 1 cm) as object interaction. Undirected contacts (e.g., mouse sits next to object but faces away) were not scored. Discrimination index (%) was calculated as (Time spent on novel object – Time spent on sample object) X100 / (total time spent on the two objects). Distances traveled and time spent at the quadrants were recorded and exported with ANY-maze software.
Y maze spontaneous alternation test
To test special working memory, we used a spontaneous alternation test in which mice placed in a Y-shaped maze exhibit a strong tendency to choose alternate arms on successive trials. The Y maze used has 3 identical arms of 40 cm length, 8 cm width, and 15 cm height, attached together at 120-degree angles. Mice were put into the center area facing the top arm and allowed to freely explore the maze for 5 min. The sequence of arms chosen and total number of arm entries were recorded manually. Spontaneous alternation (%) was calculated as (number of alternate arm entries)X100 / total number of arm entries.
Contextual conditional fear
The contextual conditional fear test was performed in a chamber with metal grid floor. Three checkerboard pattern visual cues (13 cm × 13 cm) were posted at three sides of the chamber. On day 1, mice were habituated to the chamber and allowed to move freely for 10 min. On day 2, mice were put into the center of the chamber and allowed to move freely for 3 min before being exposed to 3 mild foot shocks (2s, 0.7mA) with 2 min intertrial intervals (ITI) between each shock (Supplemental Fig. 6e–f). On day 3, mice were put back to the same chamber and movements of mice over 5 min were recorded and analyzed by FreezeFrame software (Actimetrics, Coulbourn Instruments) with the bouts and threshold both set at 1.0 s. % freezing time identified based on the above criteria. Data were then plotted as shown in Fig. 2u.
FACS sorting
We harvested different regions from mouse brains and dissociated them using the protocol described previously (John Lin et al., 2017). Dissociated astrocytes from different regions were sorted by BD FACSAira III with 100 μM nozzle. Around 95,000 GFP+ astrocytes were collected per 1.5 ml tube, which contained 500 μl of Buffer RLT (Qiagen Cat. No. 79216) with 1% ß-Mercaptoethanol. Finally, each sample was vortexed and rapidly frozen on dry ice.
RNA extraction, library preparation and sequencing
RNA was extracted from pelleted cells using RNeasy Micro Kit (Cat. No. 74004, QIAGEN). RNA integrity (RIN ≥ 8.0) was confirmed using the High Sensitivity RNA Analysis Kit (DNF-472–0500, Agilent formerly AATI) on a 12-Capillary Fragment Analyzer. cDNA synthesis and Illumina sequencing libraries with 8-bp single indices were constructed from 10 ng total RNA using the Trio RNA-Seq System (0507–96, NuGEN). The resulting libraries were validated using the Standard Sensitivity NGS Fragment Analysis Kit (DNF-473–0500, Agilent formerly AATI) on a 12-Capillary Fragment Analyzer and quantified using Quant-it dsDNA assay kit (Cat. Q33120). Equal concentrations (2 nM) of libraries were pooled and subjected to paired-end (2×75) sequencing of approximately 40 million reads per sample using the High Output v2 kit (FC-404–2002, Illumina) on a NextSeq550 following the manufacturer’s instructions.
RNA-Seq bioinformatics analysis
Sequencing files from each flow cell lane were downloaded and the resulting fastq files were merged. Quality control was performed using fastQC (v0.10.1) and MultiQC (v0.9) (Ewels et al., 2016). Reads were mapped to the mouse genome mm10 assembly using STAR (v2.5.0a) (Dobin et al., 2013). In R(v3.5.2) Bioconductor packages GenomicAlignments (v1.16.0) and GenomicFeatures (v1.32.2) were used to build count matrices (Lawrence et al., 2013). UCSC transcripts were downloaded from Illumina iGenomes in GTF file format. Normalization and differential gene expression analysis were performed using DESeq2 (v1.20.0) (Love et al., 2014). Gene Ontologies were determined using Enrichr and visualized using GOplot (v1.0.2). RNA-Seq and ChIP-Seq data can be found at the NIH GEO database (GSE146000 for the RNA-Seq and GSE146064 for the ChIP-Seq).
Reverse transcription quantitative polymerase chain reaction (RT-qPCR)
RT-qPCR was performed on cDNA libraries from each of the four brain regions analyzed, using Quantabio Perfecta SYBR Green Fast Mix (Cat. 95072–012) on a Roche Light Cycler 480 instrument. Reactions were set up using 2 ng cDNA, 250 nM primers and 1X SYBR mix. qPCR was carried out at 95°C for 30 seconds, 40 cycles of 95°C for 5 seconds and 60°C for 30 seconds, with subsequent melting curve analysis. The primers used for qPCR are listed in Supplemental Table S3. Expression of transcripts of target genes was normalized to Gapdh.
Chromatin immunoprecipitation (ChIP)
Mouse hippocampi and olfactory bulbs were collected for ChIP experiments. Dissociated hippocampi or olfactory bulbs were pooled together from 6–8 animals for each ChIP experiment. Chromatin was crosslinked by using freshly prepared 1.1% formaldehyde solution with rocking at room temperature for 10 min, followed by addition of 0.1 M glycine. Cell pellets were collected by centrifugation at 3500 rpm for 5 min at 4°C, washed with PBS and frozen at −80°C or used immediately for preparing lysates. Pellets were resuspended with PBS/PMSF containing 0.5% Igepal to release nuclei, followed by washing with cold ChIP-Buffer (0.25% TritonX, 10 mM EDTA, 0.5 mM EGTA, 10 mM HEPES pH 6.5) and nuclei were lysed with ChIP lysis buffer (0.5% SDS, mM EDTA, 25 mM Tris-HCl pH 8) for 15–20 min at room temperature. Lysates were sonicated to 250–350 bp using Diagenode Bioruptor. Immunoprecipitation was carried out by rotating sonicated lysates overnight at 4°C with NFIA antibody (5 μg, Sigma Cat. HPA006111) followed by pull-down using Protein A/G magnetic beads (Pierce) for 6 hours. The beads were collected and washed with TSE1 buffer (0.1% SDS, 1% TritonX, 2 mM EDTA, 20 mM Tris-HCl pH 8, 150 mM NaCl), TSE2 buffer (TSE1 buffer with 500 mM NaCl), LiCl buffer (0.25M lithium chloride, 1% NP40, 1% sodium deoxycholate, 1 mM EDTA, 10 mM Tris-HCl pH 8) and TE buffer. Immunoprecipitated chromatin was then eluted by heating the beads in ChIP Elution buffer (1% SDS, 0.1 M NaHCO3) at 65°C for 20 min twice. A small sample of elution was used for Western Blot analysis to confirm immunoprecipitation of NFIA. ChIP-DNA was quantified using Quant-it dsDNA assay kit (Cat. Q33120) and 5–10 ng of ChIP-DNA was used for ChIP-Seq library preparation. Each ChIP experiment was performed independently at least 3 times.
ChIP-Seq library preparation and sequencing
ChIP libraries were prepared using the TruSeq ChIP Library Preparation Kit (Illumina Cat. IP-202–1012), according to manufacturer’s instructions. Libraries ranging from 250–350 bp were extracted from gel incisions using QIAquick Gel Extraction Kit (Qiagen), PCR amplified, and purified using AMPure XP beads. The quality of the resulting libraries was analyzed on the Standard Sensitivity NGS Fragment Analysis Kit (DNF-473–0500, Agilent formerly AATI) on a 12-Capillary Fragment Analyzer. Libraries were quantified using the Quant-it dsDNA assay kit (Cat. Q33120) and equal concentrations (2 nM) of libraries were pooled and subjected to single-end (1×150) sequencing of approximately 25 million reads per sample using the High Output v2 kit (FC-404–2002, Illumina) on a NextSeq550 following the manufacturer’s instructions.
ChIP-Seq data analysis
Sequencing files from each flow cell lane were downloaded and the resulting fastq files were merged. Quality control was performed using fastQC (v0.10.1) and MultiQC (v0.9). Reads were mapped to the mouse genome mm10 assembly using bowtie2 (v 2.2.6) (Langmead and Salzberg, 2012). Using the HOMER (v4.10) software suit (Heinz et al., 2010), tag directories were made and the findPeaks command in factor mode was used to filter ChIP peaks enriched over the input control. Annotation of the enriched peaks was performed using HOMER annotatePeaks with the mm10 assembly. Discovery of specific motif instances and density was achieved using HOMER annotatePeaks with the -m and -hist options, respectively. Integrated Genome Viewer compatible files were constructed using samtools (v1.7) sort and index and deepTools (v3.1.3) bamCompare (Li et al., 2009; Ramírez et al., 2016). ChIP peaks were visualized using deepTools computeMatrix and plotHeatmap.
Immunoprecipitation followed by mass spectrometry
We collected 6–8 olfactory bulbs and hippocampi from wild-type 2–3 month old C57BL/6 mice. Tissue was collected on ice and pellet homogenized followed by extraction of nuclear lysates using NE-PER Nuclear and Cytoplasmic Extraction Reagents (Thermo Scientific Cat No. 78833) according to manufacturer instructions. Lysates were ultracentrifuged at 200,000 g for 20 min at 4°C and the supernatant used for immunoprecipitation with anti-NFIA (Sigma Cat No. HPA006111), which were incubated with lysates for 1 hour at 4°C, followed by incubation with protein A sepharose slurry (GE Healthcare Life Sciences) for another 1 hour at 4°C. The beads were collected by centrifugation at 1000 g for 1 min, washed with NETN buffer (50 mM Tris pH 7.3, 1 mM EDTA, 0.5% NP-40) multiple times, and heated for 10 min at 90°C with 20 μl of 2X SDS loading dye to elute NFIA bound proteins. Negative control samples were prepared using the same methods without addition of anti-NFIA antibody. The immunoprecipitated samples were resolved on NuPAGE 10% Bis-Tris Gel (Life Technologies)and the gel pieces were processed for in-gel digestion using Trypsin enzyme (Gendepot T9600). The tryptic peptides were analyzed on nano-LC 1200 system (Thermo Fisher Scientific, San Jose, CA) coupled to Orbitrap Fusion™ Lumos (Thermo Fisher Scientific, San Jose, CA) mass spectrometer. The MS/MS spectra was searched using Mascot algorithm (Mascot 2.4, Matrix Science) against the mouse NCBI refseq protein database in the Proteome Discoverer (PD1.4, Thermo Fisher) interface. The precursor mass tolerance was confined to 20 ppm, fragment mass tolerance of 0.5dalton, maximum of two missed cleavage was allowed. Dynamic modification of oxidation on methionine, protein N-terminal Acetylation, destreak on cysteine and phosphorylation on serine, threonine and tyrosine was allowed. The assigned peptides were filtered at 5% FDR using the percolator q-value. The protein quantification was performed using the iBAQ approach.
Immunoprecipitation (IP) and Western blot
Lysates were prepared as described above for sample preparation for mass spectrometry. IP was performed by adding anti-NFIA antibody (Sigma, Cat. HPA006111) or rabbit anti-IgG (Santa Cruz, Cat. sc2027) overnight at 4°C. Subsequent pull-down was performed by adding Protein A agarose beads for an additional 5 hours at 4°C. The beads were collected, washed and boiled in 2X SDS gel loading dye to elute immunoprecipitated proteins, which were analyzed by Western blot. Inputs (10% of lysate) and immunoprecipitated proteins from the anti-IgG and anti-NFIA IP’s were run on a 10% sodium-dodecyl sulphate polyacrylamide gel, followed by wet transfer to nitrocellulose membrane at 400 mA for 45 minutes. The membrane was blocked by 5% milk in Tris-buffered saline with Tween20 (TBST), followed by incubation overnight at 4°C in anti-NFIA at 1:250 dilution. The next day, the membranes were washed three times with TBST, incubated at room temperature for 1 hour in horseradish peroxidase conjugated goat anti-rabbit IgG at 1:10000 dilution in 5% milk, washed again three times with TBST, and developed using luminol reagent (Cat. sc-2048, Santa Cruz Biotechnology).
Plasmid and adeno-associated virus (AAV) generation
For the NAPA experiments, we used pZac2.1 GfaABC1D NAPA-A SV40 (Addgene Plasmid #92281) to generate AAV2/9 at a concentration of 1.14×10¹³ genome copies per ml (gc/ml), and pZac2.1 hSynapsin1 NAPA-N SV40 (Addgene Plasmid #92282) to generate AAV2/1 at a concentration of 7.797×10¹² gc/ml. For detection of neurotransmitters, we used pAAV.GfaABC1D.GluSnFr.SV40 (Addgene Plasmid #100889) to generate AAV2/9 at a concentration of 2.072×10¹³ gc/ml, and pAAV.GFAPΔBP.Pf622.3B6.N260A.F145W (iGABASnFR, Looger Lab, Janelia Research Campus) to generate AAV2/9 at a concentration of 2.929×10¹³ gc/ml. For the DREADD-hM3D rescue experiment, we used pAAV.GfaABC1D.flex.hM3D.mCherry (kind gift from Kevin Ung and Benjamin R. Arenkiel) to generate AAV2/9. For NFIB shRNAi knockdown experiment, AAV shRNA delivery backbone was acquired from Addgene (Addgene #85741) (Yu et al., 2015) and served as the scramble control construct (sh-scramble) due to the presence of scramble sequence (5’- GTTCAGATGTGCGGCGAGT-3’) under the U6 promoter. For NFIB RNAi, DNA oligomers containing target sequence against mouse NFIB (TRCN0000012090; 5’- CCTTCCAGCTACTTCTCTCAT-3’) were synthesized, annealed, and cloned into BamHI and XbaI sites of parental backbone (Sh-scramble), resulting in sh-NFIB construct. Sh-scramble and sh-NFIB constructs were used to generate AAV2/9 viruses at concentration of 1.68×10¹² gc/ml and 1.48×10¹² gc/ml, respectively. All AAV viruses were generated by the Optogenetics and Viral Vectors Core at Jan and Dan Duncan Neurological Research Institute (NRI).
Stereotactic injection of AAV viruses
Five-month-old AA-KO and AA-Con mice were injected intraperitoneally with Buprenex 0.3mg/ml, anesthetized with isoflurane, and placed into stereotaxic frames. AAV was loaded into a micro dispenser (Drummond Scientific, Cat no.13-681-460) and injected at rate of 7nL/sec. For neurotransmitter detections or Ca2+ rescue experiments, we injected AAV containing iGluSnFR, iGABASnFR, or GqDREADD bilaterally (1μl/side) into the hippocampal CA1 region. For NAPA, we injected 0.5 to 1 ul of NAPA-a to CA1 and NAPA-n to CA3 to ensure that the two viruses are at equal amounts. For NFIB shRNAi knockdown experiment, we diluted viruses to 0.4 folds and injected 600 to 700 nl of sh-scramble to one olfactory bulb and sh-NFIB to another olfactory bulb of the same mouse to ensure that each bulb received equal amount of viruses. The stereotaxic coordinates of the hippocampal CA1 were 1.7 mm posterior to bregma, 1.7 mm lateral to midline, with a depth of 1.85 mm beneath the surface of the skull; the coordinates of hippocampal CA3 were 1.7 mm posterior to bregma, 2.5 mm lateral to midline, and 2.6 mm beneath the surface of the skull; the coordinates of the olfactory bulb were 4.7 mm anterior to bregma, 0.6 mm lateral to midline, with a depth of 1.5 mm beneath the surface of the skull. All animal procedures were done in accordance with approved BCM IACUC protocols.
Neuron-Astrocyte Proximity Assay (NAPA) and FRET analysis
Images were acquired using a Nikon A1 confocal microscope with a 63×, 1.4 numerical aperture oil immersion objective. The images were collected using two lines of excitation (488 and 561 nm, solid state lasers) and two different channels of emission. The intensity of GFP fluorescence after GFP excitation at 488 nm (donor signal, Idd) was obtained using a 521/42-nm bandpass emission filter. The intensity of fluorescence of m-Cherry fluorescent protein (acceptor signal, Iaa) after excitation of mCherry at 561 nm and the fluorescence intensity of FRET signal (raw FRET signal, Ida) after excitation at 488 nm were measured using a 600/45-nm emission filter. All images were collected using 2-frame Kallman-averaging with a pixel size of 200nm × 200 nm (scan zoom of 1, a frame size of 512 × 512 pixels and at 1 frame per second). Detector gains, amplifier offsets and laser power were adjusted to maximize the range of signal for each channel and were kept constant for all samples, including bleed through controls (GFP napa-a and mCherry napa-n only). Samples were imaged and analyzed in 3D to account for spatial distribution of FRET signal in CA1 region. For each 3D image, 30 μm z-range was taken with 0.7 μm step size, and each plane was processed as stated in the below (Image processing) section.
Image processing
Images were processed using NIS-Elements software. Initially, background was subtracted from all images based on the signal of non-cellular regions. To obtain a corrected FRET image (Fc), we processed the raw FRET image (IDA) to compensate for nonspecific signals in the FRET channel, such as channel cross-talk due to the spectral overlap between GFP and mCherry, as defined by the equation Fc = IDA-aIAA-dIDD (Gordon et al., 1998; Paulucci-Holthauzen et al., 2009; Tron et al., 1984) where a and d represent cross-talk correction coefficients. The corrected FRET images (Fc) were then processed with a low-pass filter 2×2 kernel to improve the signal-to-noise ratio(van Rheenen et al., 2004). The cross-talk coefficients (a and d) were calculated using images collected from cells expressing either GFP (donor) or m-Cherry (acceptor) alone. Coefficient a was obtained from the ratio of IDA over IAA for acceptor-only samples, whereas the coefficient d was obtained from the ratio of IDA over IDD for donor-only samples. Images were then imported to Imaris for further quantification. Semi-volumes of astrocytes with their soma located in the 30 μm z-range were calculated using Surface function of Imaris. To determine whether simplified astrocyte morphology impact distances between astrocyte processes to synapses, number of NAPA-n and FRET ROIs within an astrocyte was calculated using Spot function identifying FRET ROI, and Mask under Surface function extracting FRET ROI only in the volume of the astrocyte of interest. Density of NAPA-n was calculated as number of NAPA-n ROIs divided by astrocyte volume. Number of FRET ROIs per astrocyte was normalized to the density of NAPA-n of the same astrocyte to correct for variations between NAPA-n injections.
QUANTIFICATION AND STATISTICAL ANALYSIS
Sample sizes and statistical tests can be found in accompanying Figure legends. Offline analysis was carried out using Clampfit 10.7, Minianalysis, SigmaPlot 13, Prism 8, and Excel software. We assessed the significance of data for comparison by Student’s two-tailed unpaired/paired t-test or two-tailed unpaired t-test. For multiple comparisons, we used the one-way ANOVA with Tukey’s test and two-way ANOVA with Sidak’s test. In general, we assumed data were normally distributed but this was not formally tested. Data are presented as mean ± SEM (standard error of the mean). Levels of statistical significance are indicated as follows: * (p < 0.05), ** (p < 0.01), *** (p < 0.001), **** (p<0.0001).
Supplementary Material
Supplemental Table 1 List of differentially expressed genes from AAG-KO and AAG-Con astrocytes from olfactory bulb, cortex, brainstem, and hippocampus.
Related to Figure 3.
Supplemental Table 2 List of proteins that differentially interact with NFIA between the olfactory bulb and hippocampus
Related to Figure 4.
KEY RESOURCES TABLE
| REAGENT or RESOURCE | SOURCE | IDENTIFIER |
|---|---|---|
| Antibodies | ||
| Chicken polyclonal anti-GFP | Abcam | Cat#13970; RRID:AB_300798 |
| Rabbit polyclonal anti-NFIA | Sigma-Aldrich | Cat#HPA006111; RRID:AB_1854422 |
| Rabbit polyclonal anti-NFIB | Sigma-Aldrich | Cat#HPA003956; RRID:AB_1854424 |
| Chicken polyclonal anti-GFAP | Abcam | Cat#ab4674; RRID:AB_304558 |
| Mouse monoclonal anti-GFAP (clone GA5) | Millipore | Cat#MAB360; RRID:AB_11212597 |
| Goat polyclonal anti-Sox9 | R and D Systems | Cat#AF3075; RRID:AB_2194160) |
| Mouse monoclonal anti-NeuN (clone A60) | Millipore | MAB377; RRID:AB_2298772 |
| Alexa Fluor 488 goat anti-chicken | ThermoFisher | Cat#A-11039; RRID:AB_2534096 |
| Alexa Fluor 568 goat anti-rabbit | ThermoFisher | Cat#A-11036; RRID:AB_10563566 |
| Alexa Fluor 568 donkey anti-goat | ThermoFisher | Cat#A-11057; RRID:AB_2534104 |
| Alexa Fluor 488 Donkey anti-chicken | Jackson ImmunoResearch Labs | Cat#703-545-155, RRID:AB_2340375 |
| Bacterial and Virus Strains | ||
| AAV2/9 GfaABC1D NAPA-A SV40 | Optogenetics and Viral Vectors Core at Jan and Dan Duncan Neurological Research Institute (NRI) | N/A |
| AAV2/1 hSynapsin1 NAPA-N SV40 | Optogenetics and Viral Vectors Core at NRI | N/A |
| AAV2/9 GfaABC1D.GluSnFr.SV40 | Optogenetics and Viral Vectors Core at NRI | N/A |
| AAV2/9 GFAPΔBP.Pf622.3B6.N260A.F145W | Optogenetics and Viral Vectors Core at NRI | N/A |
| AAV2/9 GfaABC1D.flex.hM3D.mCherry | Optogenetics and Viral Vectors Core at NRI | N/A |
| AAV2/9 sh-scramble | Optogenetics and Viral Vectors Core at NRI | N/A |
| AAV2/9 sh-NFIB | Optogenetics and Viral Vectors Core at NRI | N/A |
| Chemicals, Peptides, and Recombinant Proteins | ||
| Bicuculline | Tocris | Cat#0109 |
| D-(−)-2-Amino-5-phosphonopentanoic acid (APV) | Tocris | Cat#0106 |
| 6-Cyano-7-nitroquinoxaline-2,3-dione (CNQX) | Tocris | Cat#0190 |
| D-serine | Sigma-Aldrich | Cat#S4250 |
| Clozapine N-oxide (CNO) | Tocris | Cat#4936 |
| DL-threo-β-Hydroxyaspartic acid(DL-TBOA) | Sigma-Aldrich | Cat#H2775 |
| (R)-(+)-Limonene | Millipore | Cat#62118 |
| Critical Commercial Assays | ||
| RNeasy Micro Kit | QIAGEN | Cat#74004 |
| Trio RNA-Seq System | NuGEN | Cat#0507-96 |
| High Sensitivity RNA Analysis Kit | Agilent | Part#DNF-472-0500 |
| Standard Sensitivity NGS Fragment Analysis Kit | Agilent | Part#DNF-473-0500 |
| Quant-it dsDNA assay kit | ThermoFisher | Cat#Q33120 |
| High Output v2 kit | Illumina | Cat#FC-404-2002 |
| TruSeq ChIP Library Preparation Kit | Illumina | Cat#IP-202-1012 |
| Deposited Data | ||
| RNA-Seq data | This paper | GEO: GSE146000 |
| ChIP-seq data | This paper | GEO: GSE146064 |
| Experimental Models: Organisms/Strains | ||
| Mouse: AA-Con: NFIAfl/fl | This paper | N/A |
| Mouse: AA-KO: NFIAfl/fl; Aldh1l1-CreER | This paper | N/A |
| Mouse: AAG-Con: NFIAfl/fl; Aldh1l1-GFP | This paper | N/A |
| Mouse: AAG-KO: NFIAfl/fl; Aldh1l1-CreER; Aldh1l1-GFP | This paper | N/A |
| Mouse: AA6-Con: NFIAfl/+; Aldh1l1-CreER; Rosa-LSL-GCaMP6s | This paper | N/A |
| Mouse: AA6-KO: NFIAfl/fl; Aldh1l1-CreER; Rosa-LSL-GCaMP6s | This paper | N/A |
| Mouse: AAT-Con: NFIAfl/+; Aldh1l1-CreER; Rosa-LSL-tdTomato | This paper | N/A |
| Mouse: AAT-KO: NFIAfl/fl; Aldh1l1-CreER; Rosa-LSL-tdTomato | This paper | N/A |
| Oligonucleotides | ||
| Primers for RT-qPCR, see Supplemental Table S3 | This paper; PrimerBank | N/A |
| shRNA target sequence: sh-scramble: 5’-GTTCAGATGTGCGGCGAGT-3’ | Yu, et al. 2015 | N/A |
| shRNA target sequence: sh-NFIB: 5’-CCTTCCAGCTACTTCTCTCAT-3’ | This paper; The RNAi Consortium (TRC) Library | N/A |
| Recombinant DNA | ||
| pZac2.1 GfaABC1D NAPA-A SV40 | Octeau, et al. 2018 | Addgene Plasmid #92281 |
| pZac2.1 hSynapsin1 NAPA-N SV40 | Octeau, et al. 2018 | Addgene Plasmid #92282 |
| pAAV.GfaABC1D.GluSnFr.SV40 | Haustein, et al. 2014 | Addgene Plasmid #100889 |
| pAAV.GFAPΔBP.Pf622.3B6.N260A.F145W (GFAP.iGABASnFR) | Laboratory of Loren Looger, Janelia Research Campus | N/A |
| pAAV.GfaABC1D.flex.hM3D.mCherry | Laboratory of Benjamin Arenkiel, Baylor College of Medicine | N/A |
| AAV-sh-scramble | Yu et al 2015 | Addgene Plasmid #85741 |
| AAV-sh-NFIB | This paper | N/A |
| Software and Algorithms | ||
| Imaris software v9.1 | Bitplane | https://imaris.oxinst.com/ |
| NIS-Elements software | Nikon | https://www.microscope.healthcare.nikon.com/products/software/nis-elements |
| Debut Video Capture Software | NCH Software | https://www.nchsoftware.com/capture/index.html |
| Qupath | Bankhead, et al 2017 | https://qupath.github.io/ |
| pCLAMP10 | Molecular Devices | https://www.moleculardevices.com/ |
| Clampfit 10.7 software | Molecular Devices | https://www.moleculardevices.com/ |
| GECIquant | Srinivasan, et al. 2015 | https://www.physiology.ucla.edu/Labs/khakh/astrocytetools.htm |
| ImageJ | NIH | https://imagej.nih.gov/ij/ |
| OptiMouse MATLAB program | Ben-Shaul 2017 | https://bmcbiol.biomedcentral.com/articles/10.1186/s12915-017-0377-3 |
| Buxco FinePointe | DSI | https://www.datasci.com/products/buxco-respiratory-products/finepointe-whole-body-plethysmography |
| Versadat software | Omnitech Electronics, Inc. | http://www.omnitech-electronics.com/product/VersaMax-Legacy-Open-Field---Locomotor-Activity/1930 |
| ANY-maze software | ANY-maze | https://www.anymaze.co.uk/ |
| FreezeFrame software | Coulbourn Instruments | https://www.coulbourn.com/product_p/act-100a.htm |
| fastQC (v0.10.1) | N/A | https://www.bioinformatics.babraham.ac.uk/projects/fastqc/ |
| MultiQC (v0.9) | Ewels, et al. 2016 | https://multiqc.info |
| STAR (v2.5.0a) | Dobin, et al. 2013 | https://github.com/alexdobin/STAR |
| GenomicAlignments (v1.16.0) | Lawerence, et al. 2013 | https://bioconductor.org/packages/release/bioc/html/GenomicAlignments.html |
| GenomicFeatures (v1.32.2) | Lawerence, et al. 2013 | https://bioconductor.org/packages/release/bioc/html/GenomicFeatures.html |
| DESeq2 (v1.20.0) | Love, et al. 2014 | https://bioconductor.org/packages/release/bioc/html/DESeq2.html |
| bowtie2 (v 2.2.6) | Langmead, et al. 2012 | http://bowtie-bio.sourceforge.net/bowtie2/index.shtml |
| HOMER (v4.10) | Heinz, et al. 2010 | http://homer.ucsd.edu/homer/ |
| samtools (v1.7) | Li, et al. 2009 | http://www.htslib.org |
| deepTools (v3.1.3) bamCompare | Ramirez, et al. 2016 | https://deeptools.readthedocs.io/en/develop/ |
| Mascot algorithm (Mascot 2.4, Matrix Science) | Matrix Science | http://www.matrixscience.com/search_form_select.html |
| Minianalysis | Synaptosoft | http://www.synaptosoft.com/MiniAnalysis/ |
| SigmaPlot 13 | SYSTAT Software | https://systatsoftware.com/products/sigmaplot/ |
| Prism 8 | GraphPad | https://www.graphpad.com/scientific-software/prism/ |
Highlights.
NFIA is required to maintain astrocyte function in a brain region-specific manner
Brain region-specific DNA binding by NFIA is inhibited by its association with NFIB
Astrocyte-neuron communication in the hippocampus is disrupted
Synaptic plasticity and memory are impaired in mice lacking astrocytic NFIA
Acknowledgments
This work was supported by grants from the National Institutes of Health (NINDS NS071153 and NS096096 to BD) and National Multiple Sclerosis Society (RG-1501-02756 to B.D.). This project was also supported in part by IDDRC grant number 1U54 HD083092 from the Eunice Kennedy Shriver National Institute of Child Health & Human Development; the Cytometry and Cell Sorting Core at Baylor College of Medicine with funding from the NIH (P30 AI036211, P30 CA125123, and S10 RR024574) and the expert assistance of J. Sederstrom. We would like to acknowledge Rodney Samaco and Surabi Veeraragaven for their assistance with the behavior assays and the Optogenetics and Viral Vectors Core at the Jan and Dan Duncan Neurological Research Institute.
We would like to acknowledge Christopher Ward of the Mouse Metabolism and Phenotyping Core at Baylor College of Medicine for his assistance on plethysmography measurement and data analysis (Supported by NIH UM1HG006348, NIH R01DK114356). We would like to acknowledge Dinghui Yu of the Microscopy Core at Jan and Dan Duncan Neurological Research Institute for his assistance on confocal imaging. Other acknowledgments include CPRIT Proteomics and Metabolomics Core Facility Award RP120092 and BSRB Microscopy Facility at the department of Genetics at UT-MD Anderson Cancer Center.
Footnotes
Publisher's Disclaimer: This is a PDF file of an unedited manuscript that has been accepted for publication. As a service to our customers we are providing this early version of the manuscript. The manuscript will undergo copyediting, typesetting, and review of the resulting proof before it is published in its final form. Please note that during the production process errors may be discovered which could affect the content, and all legal disclaimers that apply to the journal pertain.
Declaration of Interests
The authors declare no competing interests.
References
- Abraham NM, Egger V, Shimshek DR, Renden R, Fukunaga I, Sprengel R, Seeburg PH, Klugmann M, Margrie TW, Schaefer AT, et al. (2010). Synaptic inhibition in the olfactory bulb accelerates odor discrimination in mice. Neuron 65, 399–411. [DOI] [PMC free article] [PubMed] [Google Scholar]
- Adamsky A, Kol A, Kreisel T, Doron A, Ozeri-Engelhard N, Melcer T, Refaeli R, Horn H, Regev L, Groysman M, et al. (2018). Astrocytic Activation Generates De Novo Neuronal Potentiation and Memory Enhancement. Cell 174, 59–71 e14. [DOI] [PubMed] [Google Scholar]
- Afzalov R, Pryazhnikov E, Shih PY, Kondratskaya E, Zobova S, Leino S, Salminen O, Khiroug L, and Semyanov A (2013). Low micromolar Ba(2+) potentiates glutamate transporter current in hippocampal astrocytes. Front Cell Neurosci 7, 135. [DOI] [PMC free article] [PubMed] [Google Scholar]
- Agulhon C, Fiacco TA, and McCarthy KD (2010). Hippocampal short- and long-term plasticity are not modulated by astrocyte Ca2+ signaling. Science 327, 1250–1254. [DOI] [PubMed] [Google Scholar]
- Allen NJ (2014). Astrocyte regulation of synaptic behavior. Annu Rev Cell Dev Biol 30, 439–463. [DOI] [PubMed] [Google Scholar]
- Anderson CM, and Swanson RA (2000). Astrocyte glutamate transport: review of properties, regulation, and physiological functions. Glia 32, 1–14. [PubMed] [Google Scholar]
- Bankhead P, Loughrey MB, Fernandez JA, Dombrowski Y, McArt DG, Dunne PD, McQuaid S, Gray RT, Murray LJ, Coleman HG, et al. (2017). QuPath: Open source software for digital pathology image analysis. Sci Rep 7, 16878. [DOI] [PMC free article] [PubMed] [Google Scholar]
- Bazargani N, and Attwell D (2016). Astrocyte calcium signaling: the third wave. Nat Neurosci 19, 182–189. [DOI] [PubMed] [Google Scholar]
- Ben-Shaul Y (2017). OptiMouse: a comprehensive open source program for reliable detection and analysis of mouse body and nose positions. BMC Biol 15, 41. [DOI] [PMC free article] [PubMed] [Google Scholar]
- Bergles DE, and Jahr CE (1997). Synaptic activation of glutamate transporters in hippocampal astrocytes. Neuron 19, 1297–1308. [DOI] [PubMed] [Google Scholar]
- Bliss TV, and Collingridge GL (1993). A synaptic model of memory: long-term potentiation in the hippocampus. Nature 361, 31–39. [DOI] [PubMed] [Google Scholar]
- Boddum K, Jensen TP, Magloire V, Kristiansen U, Rusakov DA, Pavlov I, and Walker MC (2016). Astrocytic GABA transporter activity modulates excitatory neurotransmission. Nat Commun 7, 13572. [DOI] [PMC free article] [PubMed] [Google Scholar]
- Boisvert MM, Erikson GA, Shokhirev MN, and Allen NJ (2018). The Aging Astrocyte Transcriptome from Multiple Regions of the Mouse Brain. Cell Rep 22, 269–285. [DOI] [PMC free article] [PubMed] [Google Scholar]
- Bosnjak B, Tilp C, Tomsic C, Dekan G, Pieper MP, Erb KJ, and Epstein MM (2014). Tiotropium bromide inhibits relapsing allergic asthma in BALB/c mice. Pulm Pharmacol Ther 27, 44–51. [DOI] [PubMed] [Google Scholar]
- Bushong EA, Martone ME, Jones YZ, and Ellisman MH (2002). Protoplasmic astrocytes in CA1 stratum radiatum occupy separate anatomical domains. J Neurosci 22, 183–192. [DOI] [PMC free article] [PubMed] [Google Scholar]
- Cai J, Chen Y, Cai W-H, Hurlock EC, Wu H, Kernie SG, Parada LF, and Lu QR (2007). A crucial role for Olig2 in white matter astrocyte development. Development 134, 1887–1899. [DOI] [PubMed] [Google Scholar]
- Chai H, Diaz-Castro B, Shigetomi E, Monte E, Octeau JC, Yu X, Cohn W, Rajendran PS, Vondriska TM, Whitelegge JP, et al. (2017). Neural Circuit-Specialized Astrocytes: Transcriptomic, Proteomic, Morphological, and Functional Evidence. Neuron 95, 531–549.e539. [DOI] [PMC free article] [PubMed] [Google Scholar]
- Ciura S, Prager-Khoutorsky M, Thirouin ZS, Wyrosdic JC, Olson JE, Liedtke W, and Bourque CW (2018). Trpv4 Mediates Hypotonic Inhibition of Central Osmosensory Neurons via Taurine Gliotransmission. Cell Reports 23, 2245–2253. [DOI] [PubMed] [Google Scholar]
- das Neves L, Duchala CS, Tolentino-Silva F, Haxhiu MA, Colmenares C, Macklin WB, Campbell CE, Butz KG, and Gronostajski RM (1999). Disruption of the murine nuclear factor I-A gene (Nfia) results in perinatal lethality, hydrocephalus, and agenesis of the corpus callosum. Proc Natl Acad Sci U S A 96, 11946–11951. [DOI] [PMC free article] [PubMed] [Google Scholar]
- Deneen B, Ho R, Lukaszewicz A, Hochstim CJ, Gronostajski RM, and Anderson DJ (2006). The transcription factor NFIA controls the onset of gliogenesis in the developing spinal cord. Neuron 52, 953–968. [DOI] [PubMed] [Google Scholar]
- Dobin A, Davis CA, Schlesinger F, Drenkow J, Zaleski C, Jha S, Batut P, Chaisson M, and Gingeras TR (2013). STAR: ultrafast universal RNA-seq aligner. Bioinformatics 29, 15–21. [DOI] [PMC free article] [PubMed] [Google Scholar]
- Ewels P, Magnusson M, Lundin S, and Käller M (2016). MultiQC: summarize analysis results for multiple tools and samples in a single report. Bioinformatics 32, 3047–3048. [DOI] [PMC free article] [PubMed] [Google Scholar]
- Farmer WT, Abrahamsson T, Chierzi S, Lui C, Zaelzer C, Jones EV, Bally BP, Chen GG, Théroux JF, Peng J, et al. (2016). Neurons diversify astrocytes in the adult brain through sonic hedgehog signaling. Science 351, 849–854. [DOI] [PubMed] [Google Scholar]
- Fiacco TA, and McCarthy KD (2004). Intracellular astrocyte calcium waves in situ increase the frequency of spontaneous AMPA receptor currents in CA1 pyramidal neurons. J Neurosci 24, 722–732. [DOI] [PMC free article] [PubMed] [Google Scholar]
- Fitzgerald BJ, Richardson K, and Wesson DW (2014). Olfactory tubercle stimulation alters odor preference behavior and recruits forebrain reward and motivational centers. Front Behav Neurosci 8, 81. [DOI] [PMC free article] [PubMed] [Google Scholar]
- Ge W-P, Miyawaki A, Gage FH, Jan YN, and Jan LY (2012). Local generation of glia is a major astrocyte source in postnatal cortex. Nature 484, 376. [DOI] [PMC free article] [PubMed] [Google Scholar]
- Glynn AR, Alves DA, Frick O, Erwin-Cohen R, Porter A, Norris S, Waag D, and Nalca A (2015). Comparison of experimental respiratory tularemia in three nonhuman primate species. Comp Immunol Microbiol Infect Dis 39, 13–24. [DOI] [PMC free article] [PubMed] [Google Scholar]
- Gordon GW, Berry G, Liang XH, Levine B, and Herman B (1998). Quantitative fluorescence resonance energy transfer measurements using fluorescence microscopy. Biophys J 74, 2702–2713. [DOI] [PMC free article] [PubMed] [Google Scholar]
- Granger AJ, Shi Y, Lu W, Cerpas M, and Nicoll RA (2013). LTP requires a reserve pool of glutamate receptors independent of subunit type. Nature 493, 495–500. [DOI] [PMC free article] [PubMed] [Google Scholar]
- Guerra-Gomes S, Sousa N, Pinto L, and Oliveira JF (2017). Functional Roles of Astrocyte Calcium Elevations: From Synapses to Behavior. Front Cell Neurosci 11, 427. [DOI] [PMC free article] [PubMed] [Google Scholar]
- Haapakoski R, Karisola P, Fyhrquist N, Savinko T, Wolff H, Turjanmaa K, Palosuo T, Reunala T, Lauerma A, and Alenius H (2011). Intradermal cytosine-phosphate-guanosine treatment reduces lung inflammation but induces IFN-gamma-mediated airway hyperreactivity in a murine model of natural rubber latex allergy. Am J Respir Cell Mol Biol 44, 639–647. [DOI] [PubMed] [Google Scholar]
- Haim LB, and Rowitch DH (2017). Functional diversity of astrocytes in neural circuit regulation. Nat Rev Neurosci 18, 31–41. [DOI] [PubMed] [Google Scholar]
- Halassa MM, Fellin T, Takano H, Dong JH, and Haydon PG (2007). Synaptic islands defined by the territory of a single astrocyte. J Neurosci 27, 6473–6477. [DOI] [PMC free article] [PubMed] [Google Scholar]
- Hamaguchi N, Ihara S, Ohdaira T, Nagano H, Iwamatsu A, Tachikawa H, and Fukui Y (2007). Pleckstrin-2 selectively interacts with phosphatidylinositol 3-kinase lipid products and regulates actin organization and cell spreading. Biochemical and Biophysical Research Communications 361, 270–275. [DOI] [PubMed] [Google Scholar]
- Haustein MD, Kracun S, Lu X-H, Shih T, Jackson-Weaver O, Tong X, Xu J, Yang XW, O’Dell TJ, Marvin JS, et al. (2014). Conditions and constraints for astrocyte calcium signaling in the hippocampal mossy fiber pathway. Neuron 82, 413–429. [DOI] [PMC free article] [PubMed] [Google Scholar]
- Heinz S, Benner C, Spann N, Bertolino E, Lin YC, Laslo P, Cheng JX, Murre C, Singh H, and Glass CK (2010). Simple combinations of lineage-determining transcription factors prime cis-regulatory elements required for macrophage and B cell identities. Mol Cell 38, 576–589. [DOI] [PMC free article] [PubMed] [Google Scholar]
- Henneberger C, Papouin T, Oliet SH, and Rusakov DA (2010). Long-term potentiation depends on release of D-serine from astrocytes. Nature 463, 232–236. [DOI] [PMC free article] [PubMed] [Google Scholar]
- Hochstim C, Deneen B, Lukaszewicz A, Zhou Q, and Anderson DJ (2008). Identification of positionally distinct astrocyte subtypes whose identities are specified by a homeodomain code. Cell Calcium 133, 510–522. [DOI] [PMC free article] [PubMed] [Google Scholar]
- Jiang R, Diaz-Castro B, Looger LL, and Khakh BS (2016). Dysfunctional Calcium and Glutamate Signaling in Striatal Astrocytes from Huntington’s Disease Model Mice. J Neurosci 36, 3453–3470. [DOI] [PMC free article] [PubMed] [Google Scholar]
- John Lin CC, Yu K, Hatcher A, Huang TW, Lee HK, Carlson J, Weston MC, Chen F, Zhang Y, Zhu W, et al. (2017). Identification of diverse astrocyte populations and their malignant analogs. Nat Neurosci 20, 396–405. [DOI] [PMC free article] [PubMed] [Google Scholar]
- Jyothi HJ, Vidyadhara DJ, Mahadevan A, Philip M, Parmar SK, Manohari SG, Shankar SK, Raju TR, and Alladi PA (2015). Aging causes morphological alterations in astrocytes and microglia in human substantia nigra pars compacta. Neurobiol Aging 36, 3321–3333. [DOI] [PubMed] [Google Scholar]
- Kang P, Lee HK, Glasgow SM, Finley M, Donti T, Gaber ZB, Graham BH, Foster AE, Novitch BG, Gronostajski RM, et al. (2012). Sox9 and NFIA coordinate a transcriptional regulatory cascade during the initiation of gliogenesis. Neuron 74, 79–94. [DOI] [PMC free article] [PubMed] [Google Scholar]
- Khakh BS (2019). Astrocyte-Neuron Interactions in the Striatum: Insights on Identity, Form, and Function. Trends Neurosci 42, 617–630. [DOI] [PMC free article] [PubMed] [Google Scholar]
- Khakh BS, and Sofroniew MV (2015). Diversity of astrocyte functions and phenotypes in neural circuits. Nat Neurosci 18, 942–952. [DOI] [PMC free article] [PubMed] [Google Scholar]
- Langmead B, and Salzberg SL (2012). Fast gapped-read alignment with Bowtie 2. Nature methods 9, 357–359. [DOI] [PMC free article] [PubMed] [Google Scholar]
- Lanjakornsiripan D, Pior BJ, Kawaguchi D, Furutachi S, Tahara T, Katsuyama Y, Suzuki Y, Fukazawa Y, and Gotoh Y (2018). Layer-specific morphological and molecular differences in neocortical astrocytes and their dependence on neuronal layers. Nat Commun 9, 1623. [DOI] [PMC free article] [PubMed] [Google Scholar]
- Lawrence M, Huber W, Pagès H, Aboyoun P, Carlson M, Gentleman R, Morgan MT, and Carey VJ (2013). Software for computing and annotating genomic ranges. PLoS Comput Biol 9, e1003118–e1003118. [DOI] [PMC free article] [PubMed] [Google Scholar]
- Leeson PD, Baker R, Carling RW, Curtis NR, Moore KW, Williams BJ, Foster AC, Donald AE, Kemp JA, and Marshall GR (1991). Kynurenic acid derivatives. Structure-activity relationships for excitatory amino acid antagonism and identification of potent and selective antagonists at the glycine site on the N-methyl-D-aspartate receptor. J Med Chem 34, 1243–1252. [DOI] [PubMed] [Google Scholar]
- Li H, Handsaker B, Wysoker A, Fennell T, Ruan J, Homer N, Marth G, Abecasis G, Durbin R, and Genome Project Data Processing, S. (2009). The Sequence Alignment/Map format and SAMtools. Bioinformatics 25, 2078–2079. [DOI] [PMC free article] [PubMed] [Google Scholar]
- Love MI, Huber W, and Anders S (2014). Moderated estimation of fold change and dispersion for RNA-seq data with DESeq2. Genome biology 15, 550–550. [DOI] [PMC free article] [PubMed] [Google Scholar]
- Lozzi B, Huang T-W, Sardar D, Huang AY-S, and Deneen B (2020). Regionally Distinct Astrocytes Display Unique Transcription Factor Profiles in the Adult Brain. Frontiers in Neuroscience 14. [DOI] [PMC free article] [PubMed] [Google Scholar]
- Lynch MA (2004). Long-term potentiation and memory. Physiol Rev 84, 87–136. [DOI] [PubMed] [Google Scholar]
- Molofsky AV, and Deneen B (2015). Astrocyte development: A Guide for the Perplexed. Glia 63, 1320–1329. [DOI] [PubMed] [Google Scholar]
- Morel L, Chiang MSR, Higashimori H, Shoneye T, Iyer LK, Yelick J, Tai A, and Yang Y (2017). Molecular and Functional Properties of Regional Astrocytes in the Adult Brain. J Neurosci 37, 8706–8717. [DOI] [PMC free article] [PubMed] [Google Scholar]
- Octeau JC, Chai H, Jiang R, Bonanno SL, Martin KC, and Khakh BS (2018). An Optical Neuron-Astrocyte Proximity Assay at Synaptic Distance Scales. Neuron 98, 49–66 e49. [DOI] [PMC free article] [PubMed] [Google Scholar]
- Oliveira JF, Sardinha VM, Guerra-Gomes S, Araque A, and Sousa N (2015a). Do stars govern our actions? Astrocyte involvement in rodent behavior. Trends in Neurosciences 38, 535–549. [DOI] [PubMed] [Google Scholar]
- Oliveira JF, Sardinha VM, Guerra-Gomes S, Araque A, and Sousa N (2015b). Do stars govern our actions? Astrocyte involvement in rodent behavior. Trends Neurosci 38, 535–549. [DOI] [PubMed] [Google Scholar]
- Panatier A, Vallee J, Haber M, Murai KK, Lacaille JC, and Robitaille R (2011). Astrocytes are endogenous regulators of basal transmission at central synapses. Cell 146, 785–798. [DOI] [PubMed] [Google Scholar]
- Papouin T, Dunphy J, Tolman M, Foley JC, and Haydon PG (2017). Astrocytic control of synaptic function. Philos Trans R Soc Lond B Biol Sci 372. [DOI] [PMC free article] [PubMed] [Google Scholar]
- Parpura V, Basarsky TA, Liu F, Jeftinija K, Jeftinija S, and Haydon PG (1994). Glutamate-mediated astrocyte-neuron signalling. Nature 369, 744–747. [DOI] [PubMed] [Google Scholar]
- Pascual O, Casper KB, Kubera C, Zhang J, Revilla-Sanchez R, Sul JY, Takano H, Moss SJ, McCarthy K, and Haydon PG (2005). Astrocytic purinergic signaling coordinates synaptic networks. Science 310, 113–116. [DOI] [PubMed] [Google Scholar]
- Paulucci-Holthauzen AA, Vergara LA, Bellot LJ, Canton D, Scott JD, and O’Connor KL (2009). Spatial distribution of protein kinase A activity during cell migration is mediated by A- kinase anchoring protein AKAP Lbc. J Biol Chem 284, 5956–5967. [DOI] [PMC free article] [PubMed] [Google Scholar]
- Perea G, Sur M, and Araque A (2014). Neuron-glia networks: integral gear of brain function. Front Cell Neurosci 8, 378. [DOI] [PMC free article] [PubMed] [Google Scholar]
- Phillips RG, and LeDoux JE (1992). Differential contribution of amygdala and hippocampus to cued and contextual fear conditioning. Behav Neurosci 106, 274–285. [DOI] [PubMed] [Google Scholar]
- Rajavelu P, Chen G, Xu Y, Kitzmiller JA, Korfhagen TR, and Whitsett JA (2015). Airway epithelial SPDEF integrates goblet cell differentiation and pulmonary Th2 inflammation. J Clin Invest 125, 2021–2031. [DOI] [PMC free article] [PubMed] [Google Scholar]
- Ramírez F, Ryan DP, Grüning B, Bhardwaj V, Kilpert F, Richter AS, Heyne S, Dündar F, and Manke T (2016). deepTools2: a next generation web server for deep-sequencing data analysis. Nucleic Acids Res 44, W160–W165. [DOI] [PMC free article] [PubMed] [Google Scholar]
- Ruxton GD (2006). The unequal variance t-test is an underused alternative to Student’s t-test and the Mann–Whitney U test. Behavioral Ecology 17, 688–690. [Google Scholar]
- Santello M, Bezzi P, and Volterra A (2011). TNFalpha controls glutamatergic gliotransmission in the hippocampal dentate gyrus. Neuron 69, 988–1001. [DOI] [PubMed] [Google Scholar]
- Savtchouk I, and Volterra A (2018). Gliotransmission: Beyond Black-and-White. J Neurosci 38, 14–25. [DOI] [PMC free article] [PubMed] [Google Scholar]
- Shigetomi E, Jackson-Weaver O, Huckstepp RT, O’Dell TJ, and Khakh BS (2013). TRPA1 channels are regulators of astrocyte basal calcium levels and long-term potentiation via constitutive D-serine release. J Neurosci 33, 10143–10153. [DOI] [PMC free article] [PubMed] [Google Scholar]
- Smith JC, Abdala AP, Borgmann A, Rybak IA, and Paton JF (2013). Brainstem respiratory networks: building blocks and microcircuits. Trends Neurosci 36, 152–162. [DOI] [PMC free article] [PubMed] [Google Scholar]
- Srinivasan R, Huang BS, Venugopal S, Johnston AD, Chai H, Zeng H, Golshani P, and Khakh BS (2015). Ca(2+) signaling in astrocytes from Ip3r2(−/−) mice in brain slices and during startle responses in vivo. Nat Neurosci 18, 708–717. [DOI] [PMC free article] [PubMed] [Google Scholar]
- Srinivasan R, Lu T-Y, Chai H, Xu J, Huang BS, Golshani P, Coppola G, and Khakh BS (2016). New Transgenic Mouse Lines for Selectively Targeting Astrocytes and Studying Calcium Signals in Astrocyte Processes In Situ and In Vivo. Neuron 92, 1181–1195. [DOI] [PMC free article] [PubMed] [Google Scholar]
- Stolt CC, Rehberg S, Ader M, Lommes P, Riethmacher D, Schachner M, Bartsch U, and Wegner M (2002). Terminal differentiation of myelin-forming oligodendrocytes depends on the transcription factor Sox10. Genes & Development 16, 165–170. [DOI] [PMC free article] [PubMed] [Google Scholar]
- Tron L, Szollosi J, Damjanovich S, Helliwell SH, Arndt-Jovin DJ, and Jovin TM (1984). Flow cytometric measurement of fluorescence resonance energy transfer on cell surfaces. Quantitative evaluation of the transfer efficiency on a cell-by-cell basis. Biophys J 45, 939–946. [DOI] [PMC free article] [PubMed] [Google Scholar]
- Tsai H-H, Li H, Fuentealba LC, Molofsky AV, Taveira-Marques R, Zhuang H, Tenney A, Murnen AT, Fancy SPJ, Merkle F, et al. (2012). Regional Astrocyte Allocation Regulates CNS Synaptogenesis and Repair. Science 337, 358–362. [DOI] [PMC free article] [PubMed] [Google Scholar]
- van Rheenen J, Langeslag M, and Jalink K (2004). Correcting confocal acquisition to optimize imaging of fluorescence resonance energy transfer by sensitized emission. Biophys J 86, 2517–2529. [DOI] [PMC free article] [PubMed] [Google Scholar]
- Wang X, Lou N, Xu Q, Tian GF, Peng WG, Han X, Kang J, Takano T, and Nedergaard M (2006). Astrocytic Ca2+ signaling evoked by sensory stimulation in vivo. Nat Neurosci 9, 816–823. [DOI] [PubMed] [Google Scholar]
- Woo DH, Han KS, Shim JW, Yoon BE, Kim E, Bae JY, Oh SJ, Hwang EM, Marmorstein AD, Bae YC, et al. (2012). TREK-1 and Best1 channels mediate fast and slow glutamate release in astrocytes upon GPCR activation. Cell 151, 25–40. [DOI] [PubMed] [Google Scholar]
- Yu H, Su Y, Shin J, Zhong C, Guo JU, Weng Y-L, Gao F, Geschwind DH, Coppola G, Ming G. l., et al. (2015). Tet3 regulates synaptic transmission and homeostatic plasticity via DNA oxidation and repair. Nature neuroscience 18, 836–843. [DOI] [PMC free article] [PubMed] [Google Scholar]
- Yu X, Taylor AMW, Nagai J, Golshani P, Evans CJ, Coppola G, and Khakh BS (2018). Reducing Astrocyte Calcium Signaling In Vivo Alters Striatal Microcircuits and Causes Repetitive Behavior. Neuron 99, 1170–1187 e1179. [DOI] [PMC free article] [PubMed] [Google Scholar]
- Zou J, Wang W, Pan YW, Lu S, and Xia Z (2015). Methods to measure olfactory behavior in mice. Curr Protoc Toxicol 63, 11 18 11–21. [DOI] [PMC free article] [PubMed] [Google Scholar]
Associated Data
This section collects any data citations, data availability statements, or supplementary materials included in this article.
Supplementary Materials
Supplemental Table 1 List of differentially expressed genes from AAG-KO and AAG-Con astrocytes from olfactory bulb, cortex, brainstem, and hippocampus.
Related to Figure 3.
Supplemental Table 2 List of proteins that differentially interact with NFIA between the olfactory bulb and hippocampus
Related to Figure 4.
Data Availability Statement
The RNA-seq and ChIP-seq dataset generated during this study are available at the NCBI GEO website. RNA-seq, accession GEO: GSE146000. ChIP-seq, accession GEO: GSE146064.