

Abstract
Targeting therapeutic agents to specific organs in the body remains a challenge despite advances in the science of systemic drug delivery. We have engineered a programmable-bioinspired nanoparticle (P-BiNP) delivery system to simultaneously target the bone and increase uptake in homotypic tumor cells by coating polymeric nanoparticles with programmed cancer cell membranes. This approach is unique in that we have incorporated relevant clinical bioinformatics data to guide the design and enhancement of biological processes that these nanoparticles are engineered to mimic. To achieve this, an analysis of RNA expression from metastatic prostate cancer patients identified ITGB3 (a subunit of integrin αVβ3) as overexpressed in patients with bone metastasis. Cancer cells were stimulated to increase this integrin expression on the cell surface, and these membranes were subsequently used to coat cargo carrying polymeric nanoparticles. Physicochemical optimization and characterization of the P-BiNPs showed desirable qualities regarding size, ζ potential, and stability. In vitro testing confirmed enhanced homotypic binding and uptake in cancer cells. P-BiNPs also demonstrated improved bone localization in vivo with a murine model. This novel approach of identifying clinically relevant targets for dual homotypic and bone targeting has potential as a strategy for treatment and imaging modalities in diseases that affect the bone as well as broader implications for delivering nanoparticles to other organs of interest.
Keywords: nanoparticle, targeted nanoparticle delivery, bone, bioinspired, biomimetic, prostate, αVβ3
INTRODUCTION
Nanoparticles have the potential to improve drug delivery through targeting either by passive (nanoparticle size) or active (ligand targeting) means.1,2 The active targeting approach for nanoparticles has been generally less successful due to a variety of factors. First, many ligand coating strategies for targeted nanoparticles involve difficult and complicated chemical conjugation strategies, which can alter the ligand’s affinity for its target.3 Second, often the choice of target in the preclinical setting is made without the input of clinically relevant targets and actual patient data. Third, the impact of ligand surface density on binding as well as uptake into cells is often neglected.4 Finally, the heterogeneity of surface markers on cancer cells often diminishes the ability to efficiently target the tumor.5
Considering these factors, we have designed and engineered a biologically inspired strategy to simultaneously enhance nanoparticle delivery to the bone with increased targeted tumor cell uptake. The primary goal of this approach was inspired by prostate cancer cells’ ability to home to the bone during the metastatic process. The progression of bone metastasis is quite complex and involves multiple coordinated events including escape from the primary tumor, survival in systemic circulation, and the ability to home to the bone microenvironment.3,6 This nanoparticle delivery system seeks to mimic the latter two processes so that nanoparticle cargo can be transported and retained in the bone. Coating nanoparticles with biological membranes has been shown to increase the circulation time of the nanoparticles due to the improved biocompatibility in systemic circulation.7 In addition, specific proteins involved in the homing process that are present on the cell membranes can be enhanced through ex vivo biological methods, thus eliminating the need for chemical conjugation schemes. This strategy allows fusing the cell membranes to core nanoparticles as a simple method to create a complex biocompatible system.
Several essential factors that allow prostate cancer cells to localize to the bone have been described in the in vitro and in vivo experimental settings.8 However, less data exists demonstrating validation of these alterations in human samples. Thus, a combination of in vivo data and patient RNAseq data was evaluated in selecting factors that could be enhanced. A bioinformatics analysis of an RNAseq database from prostate cancer patients with metastasis to various sites was used to establish differentially expressed factors in patients with bone metastasis. Increased mRNA expression was used as an indicator of factors involved in the bone metastatic process. ITGB3 was identified as having increased expression in the tumors of patients with bone metastatic prostate cancer. ITGB3 encodes an important subunit of the integrin αVβ3, which is a critical factor contributing to the ability of prostate cancer cells to specifically home and bind to endothelial cells in the bone.9 Increased membrane expression of this integrin occurs when prostate cancer cells are stimulated by the chemokine factor C-X-C motif chemokine ligand 12 (CXCL12).9
Our primary objective was to use this signaling pathway to stimulate or program bioinspired nanoparticles (BiNPs) to have enhanced bone homing, thus creating programmable bioinspired nanoparticles or P-BiNPs. Our secondary objective for the P-BiNPs was to achieve selective uptake in specific cells so that once the nanoparticles have homed to the organ of interest, there will be preferential uptake into the identified cells. We were successful in achieving both enhanced accumulation of the P-BiNP in the bone and increased uptake in prostate cancer cells. This strategy has the potential to improve delivery of therapeutic agents, enhance imaging agents, and decrease off-target side effects. The overall concept of personalized cancer therapy using programmable bioinspired nanoparticles is shown in Scheme 1. As a proof of concept, we expanded the cancer cells in vitro and programmed them by stimulation with CXCL12 to enhance homotypic binding and bone adhesion ability. This culture condition mimics growth in the human body while providing a platform to program specific stimulation to achieve directed targeting of bone metastatic cancer cells using molecule–molecule homing properties. In this work, we are using the cancer cells’ own homing mechanism to guide nanoparticles (NPs) to preferentially adhere to the bone microenvironment, which to our knowledge has not been reported previously.
Scheme 1. Proposed Clinical Scenario of Programmable Bioinspired Nanoparticlesa.
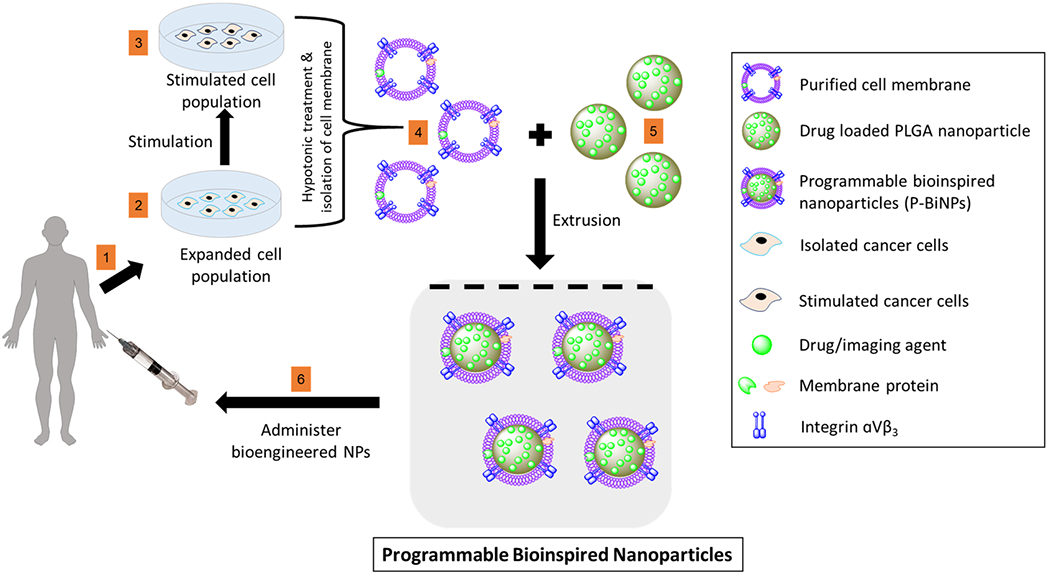
a(1) Cells are isolated from patient’s biopsy. (2) Cells are grown in a petri dish and programmed by (3) stimulation with CXCL12 to enhance homotypic binding and bone adhesion ability. (4) Membrane, which contains the complete signature of all the protein and lipid components of the cell membrane, is isolated from programmed cancer cells and used to coat (5) nanoparticles with drug or imaging agent cargo. (6) Programmable bioinspired nanoparticles (P-BiNPs) are injected back into patient with enhanced bone homing and homotypic binding.
EXPERIMENTAL METHODS
Bioinformatics Data.
Gene ontology consortium (http://www.geneontology.org) query identified 50 potential targets involved in homotypic cell–cell adhesion. These targets were cross-referenced with RNAseq expression levels from 118 patients with metastatic prostate cancer to various organ locations. Multiple hits were identified for upregulated mRNA expression in bone metastatic samples compared to metastatic lesions of other sites. Literature analysis of the top differentially expressed genes revealed the functional importance of ITGB3 in its role as the critical subunit of integrin αVβ3 in both prostate cancer cell homing to bone and homotypic binding between cells. ITGB3 mRNA expression level was compared in the top three metastatic sites and bone had the most significantly increased expression level compared to lymph node and liver. cBioPortal was used to access the Metastatic Prostate Cancer Patient database; SU2C/PCF Dream Team Cancer study was used as the primary database. The genomic profiles that were selected were mRNA expression data/capture z-Scores (RNASeq capture).
Cell Culture.
Human prostate cancer cell line C4-2B cells were purchased from MD Anderson Characterized Cell Line Core Facility (Houston, TX), and LNCaP cells were purchased from ATCC (Manassas, VA). Both cells lines were maintained in standard cell culture conditions (5% CO2, 37 °C) and cultured in RPMI-1640 medium, 10% fetal bovine serum, and 1% antibiotic–antimycotic (Gibco).
αVβ3 Protein Stimulation and Verification.
C4-2B cells were grown in triplicate on glass coverslips in a six-well dish and then stimulated to express αVβ3 by treatment with 200 ng/mL of recombinant human CXCL12 (R&D Systems, Minneapolis, MN) for 1, 6, or 12 h at 37 °C. After cells were stimulated, they were rinsed with PBS, fixed with 4% formaldehyde (Affymetrix) for 10 min at room temperature, washed twice with PBS, and blocked for 1 h with 1% BSA in PBS. Next cells were incubated for 4 h with a 1:100 dilution of anti-integrin αVβ3 antibody, clone LM609 (Millipore). Incubation was followed by three washes with PBS and then incubation for 45 min with a 1:200 dilution of the goat anti-mouse IgG (H+L) secondary antibody, Alexa Fluor 488 conjugate (Life Technologies). Cells were washed twice more and mounted on slides with Prolong Gold antifade reagent with DAPI (Invitrogen). Fluorescent images were taken with Olympus BX53 fluorescence microscope with a DP80 CCD camera (Olympus). It is equipped with a 100 W halogen lamp and a condenser (NA = 0.9). The exposure time of 0.25 s and illumination intensity lamp voltage of 9 V were used for imaging. The images were analyzed by ImageJ (NIH) software.
Cancer Cell Membrane Coated Nanoparticle Preparation.
C4-2B cells were grown to 90% confluency in a T-175 flask, and then if P-BiNPs were to be made, the cells were stimulated with 200 ng/mL recombinant human CXCL12 for 1 h at 37 °C. After the stimulation step for P-BiNP or no stimulation for BiNP, cells were prepared similarly to the method described by Fang et al. with modifications.10 Cells were washed with PBS and lifted from the flask using 2 mM ethylenediaminetetraacetic acid (EDTA) in PBS. Cells were washed three more times with PBS by centrifugation at 500 g. On final wash, cells were resuspended in hypotonic buffer solution consisting of 10 mM KCl, 2 mM MgCl2, and 20 mM Tris-HCl adjusted to pH 7.5. Immediately before hypotonic buffer use, 1 Pierce EDTA-free protease inhibitor tablet (Thermo Scientific) and phosphate inhibitor cocktail (EMD Millipore, USA) were added to 50 mL of the hypotonic buffer. Next, cancer cells in the hypotonic buffer were placed in a Dounce homogenizer and mashed 25 times. Homogenized cells were centrifuged at 3200g for 5 min at 4 °C in a desktop centrifuge, and supernatant was removed and saved on ice. Pellet was resuspended in hypotonic buffer, and again the Dounce homogenizer was used for 25 mashes. The second homogenate was placed in the centrifuge at 3200g for 5 min at 4 °C, and the supernatant was removed and placed on ice. Pooled supernatant was spun at 20000g for 20 min. The supernatant was removed and transferred to clean ultracentrifuge tubes and spun at 100000g for 16 h. The supernatant was removed and discarded. Pellet consisting of purified cell membrane fraction was washed in Tris Buffer (10 mM Tris-HCl with 1 mM EDTA adjusted to pH 7.5). The total protein in the membrane fraction was quantified using a Pierce BCA Protein Assay kit (Life Technologies) per manufacturer’s instructions. This membrane was then used in further experiments.
Poly(lactic-co-glycolic acid) (PLGA) nanoparticles were made using a nanoprecipitation method. Briefly, a 26 G flat tipped needle attached to a 1 mL syringe was used to inject 7.5 mg/mL PLGA 5050 dissolved in acetone (Lakeshore Biopharmaceutics) into sterile water. The acetone was evaporated under nitrogen gas flow for 20 min. If cabazitaxel (5% initial w/w drug to polymer) (MedChem Express), Nile red fluorescent dye (Invitrogen), or IR-780 dye (Sigma-Aldrich) was to be used in the experiment, then it was dissolved in the initial PLGA/acetone mixture prior to nanoprecipitation. These nanoparticles were then used as the stock for the core of the cancer cell membrane coated nanoparticles to ensure equivalent dye or drug concentration for an experiment.
Nanoparticle coating was performed by an extrusion process. The membrane fraction was extruded through a Nuclepore Track-Etch Membrane (Whatman) with 400 nm pore size 11 times using an Avanti Lipids extruder. Nanoparticles were added so that the ratio of membrane protein to nanoparticles was 0.5:1 (w/w). This mixture was extruded again 11 more times. Cell membrane coated nanoparticles were collected and were used immediately for experiments.
Cancer Cell Membrane Fraction Verification.
Western Blot was used to verify membrane fraction preparation by comparing protein expression in the pure membrane fraction versus whole cell lysate in two different cell lines. For the whole cell lysate, total protein was extracted from cancer cells and quantified. The membrane fraction used was from the protocol described above. Protein was separated on 4–12% Bis-Tris Nu-PAGE gel (Invitrogen, CA) with MES running buffer. The primary antibodies were against Na+/K+ ATPase as membrane marker (mouse monoclonal antibody from Developmental Studies Hybridoma Bank, IA), lamin was used as a nuclear marker (Santa Cruz Biotechnology, CA), and cytochrome c was used as a mitochondria marker (Santa Cruz Biotechnology, CA). Appropriate secondary antibodies, diluted to 1:200 and conjugated with horseradish peroxidase (Promega, WI), were incubated with membranes for 2 h at room temperature. Membranes were developed using ECL plus (Amersham Pharmacia Biotech, IL), and images were taken with α-imager Fluortech HD2 (San Jose, CA).
Coomassie stain was used to verify that the membrane fraction still maintained a broad profile of protein expressed on the surface of the cells. All initial steps are the same as described in the Western Blot procedure above however after the protein was separated on 4–12% Bis-Tris NuPAGE gel, it was stained with Coomassie Brilliant Blue (BioRad, CA) for 30 min. The gel was then destained for 2 days by washing with destain solution (20% methanol and 10% glacial acetic acid in ddH2O). The gel was then imaged with the α-imager Fluortech HD2.
Membrane Coating Stability.
Various ratios of membrane to nanoparticles were used to determine the optimal ratio needed for complete coating of cancer cell membrane coated nanoparticles. Nanoparticles were then incubated in PBS solution at 1 mg/mL. The size was checked after 12 h by DLS utilizing the Zetasizer Nano ZS instrument (Malvern Ltd.). In addition, we assessed whether there was a difference in stability between the P-BiNPs and BiNPs over the course of 7 days in 1× PBS, when nanoparticles were stored at 4 °C. Nanoparticles were kept at room temperature at least 30 min before each series of measurements followed by gentle agitation at room temperature. The hydrodynamic diameter of the particles and polydispersity index (PDI) were determined using DLS daily.
Hydrodynamic Size, PDI and Zeta Potential.
Particle size, PDI and zeta (ζ) potential of cell membrane coated and noncoated nanoparticles were measured by dynamic light scattering (DLS) utilizing the Zetasizer Nano ZS instrument (Malvern Ltd.). Nanoparticles were loaded into a folded capillary cell (Malvern Ltd.), and zeta potential was determined based on the electrophoretic mobility of the nanoparticles.
Transmission Electron Microscopy.
Nanoparticles were prepared for transmission electron microscopy (TEM) by placing a Formvar carbon coated grid in a Pelco easiGlow discharge machine. One drop of the nanoparticle solution was placed on the grid and left for 1 min. Liquid was wicked off the grid with filter paper. For negative staining, one drop of 1% uranyl acetate was added to the grid and left for 1 min, and then the liquid was wicked off with filter paper. Sample was imaged with the FEI Tecnai G2 Spirit Biotwin Transmission Electron Microscope.
Nanoparticle Uptake in C4-2B Cells.
Flow cytometry was used to determine the uptake of P-BiNPs. PLGA nanoparticles were tagged with Nile red fluorescent dye and coated with membranes as described above. C4-2B cells or human fibroblast cells (HFF1 purchased from ATCC) were plated on six-well dishes at a density of 0.5 × 10⁶ cells per well in triplicate and allowed to attach for 24 h prior to being treated with either bare NPs, BiNPs, or P-BiNPs for 1 h. After incubation, cells were rewashed with PBS and then detached with trypsin. Cells were washed by centrifuging at 200g for 10 min with 1% FBS diluted in PBS. Cells were fixed with 2% PFA for 15 min at 4 °C. Then 1% FBS in PBS was added to cells followed by centrifugation at 200g for 10 min. Cells were resuspended in 1% FBS in PBS. Beckman Coulter Cytomics FC500 flow cytometry analyzer was gated on red fluorescence (laser wavelength 631 nm) channel to determine nanoparticle uptake. The voltage of detection was FSLin 99 V and SSLin 21 V. The software used for this analysis was CXP analysis.
For spheroids generation, C4-2B and HFF-1 cell lines were combined at a 3:1 ratio and plated at 3 × 10⁶ cell/mL in Aggrewell 800 plates (Stem Cell Technologies) following manufacturer’s instructions. Aggregates were allowed to form over 24 h in Aggrewells followed by 24 h in ultralow attachment six-well plates on an orbital shaker. Resulting spheroids were incubated with bare NPs or P-BiNPs loaded with Nile red dye for 3 h in a 1.5 mL microcentrifuge tube at 37 °C and 5% CO2 with gentle shaking. Nanoparticles were removed from solution by washing spheroids and fixed in 4% paraformaldehyde for 30 min. Samples were washed in PBS and then in 100 μL of 100% methanol with incubation for 15 min. Samples were further processed by adding 20% DMSO in 100% methanol for 2 min twice, then 80% methanol in PBS for 2 min, 50% methanol in PBS for 2 min, PBS alone for 2 min twice, and finally twice in 1% TritonX-100 in PBS for 2 min. Samples were then placed in penetration buffer consisting of 0.2% Triton/0.3 M glycine/20% DMSO in PBS for 15 min and blocked with 0.2% TritonX/6% donkey serum/10% DMSO in PBS at 37 °C with gentle shaking for 15 min. Spheroids were finally stained with DAPI and imaged on Keyence BZ-X700.
Cell Viability Assay.
C4-2B cells were plated on 96-well flat bottom plates (Corning Incorporated Durham, NC) at a density of 2000 cells per well. Cells were allowed to attach for 24 h then treated with increasing concentrations (0–20 μg/mL cabazitaxel loaded) of BiNPs or P-BiNPs for 72 h in standard cell culture conditions. At respective time points, 20 μL of thiazolyl blue tetrazolium bromide (MTT) (Sigma, St. Louis, MO) suspended in PBS at a concentration of 5 mg/mL was added to each well of the 96-well plate. After three hours of incubation, media was removed, and 100 μL of DMSO was added to each well and mixed by pipetting. Absorbance was read on BioTek Synergy 2 multimode plate reader (Winooski, VT) at 570 nm. Percentage cell viability was calculated by dividing absorbance of sample by the average of untreated cells in quadruplicate and then multiplying by 100.
In Vivo Bone Homing.
After institutional IACUC approval, in vivo bone homing experiment was performed. Male athymic nude-foxn1nu mice were purchased from Envigo. Mice were allowed to acclimate 1 week before experiments. Treatment group mice were injected intravenously with 100 μL of freshly prepared saline, dye, BiNPs, or P-BiNPs via lateral tail vein injection. Treatment groups were prepared as described above with incorporation of IR-780 dye (Sigma-Aldrich, USA) into the core of the nanoparticle prior to coating or the equivalent concentration of dye used in dye only group to ensure consistency among groups. Two hours after injection, mice were sacrificed, organs were excised, and NIR emission was imaged and quantified with Odyssey CLx (LI-COR, USA). The following settings for Odyssey CLx for imaging were used: resolution, 169 nm; focus offset, 2 mm; channel, 800 nm; intensity, L2; exposure time, 7 min. The software used for this analysis was Image Studio 1.0.20.
RESULTS AND DISCUSSION
Target Identification and Validation.
Several studies have demonstrated the principle of homotypic targeting, through which nanoparticles can be coated with various cancer cell lines, resulting in higher uptake into homologous tumors.10–13 However, the factors responsible for homotypic binding have largely been unexplored, especially in the clinical context. Further, it has not been established whether stimulating a factor that is important in homotypic binding can simultaneously be exploited for enhancing delivery of nanoparticles to an organ of interest. Thus, we tested the proof of concept that personalized nanoparticles could be engineered with enhanced ability for synchronized selective organ localization and homotypic binding. Prostate cancer was chosen as the prototype for this proof of concept due to its high prevalence and bone homing ability in the metastatic setting.
A gene set enrichment analysis (GSEA) search identified 50 genes that were enhanced in the process of homotypic cell–cell adhesion. Subsequent bioinformatics analysis of an RNAseq database from metastatic prostate cancer patient samples (n = 118) identified ITGB3 as being significantly increased in bone metastatic lesions compared to metastases from other sites such as liver, lymph nodes, or other organs (P < 0.0001) (Figure 1). ITGB3 is a subunit of integrin αVβ3 and was selected as a clinically relevant target protein for which enhancement could impact nanoparticle delivery to bone and homotypic binding in the final P-BiNP. A full list of homotypic cell–cell adhesion genes is provided in chart form in Figure S1.
Figure 1.
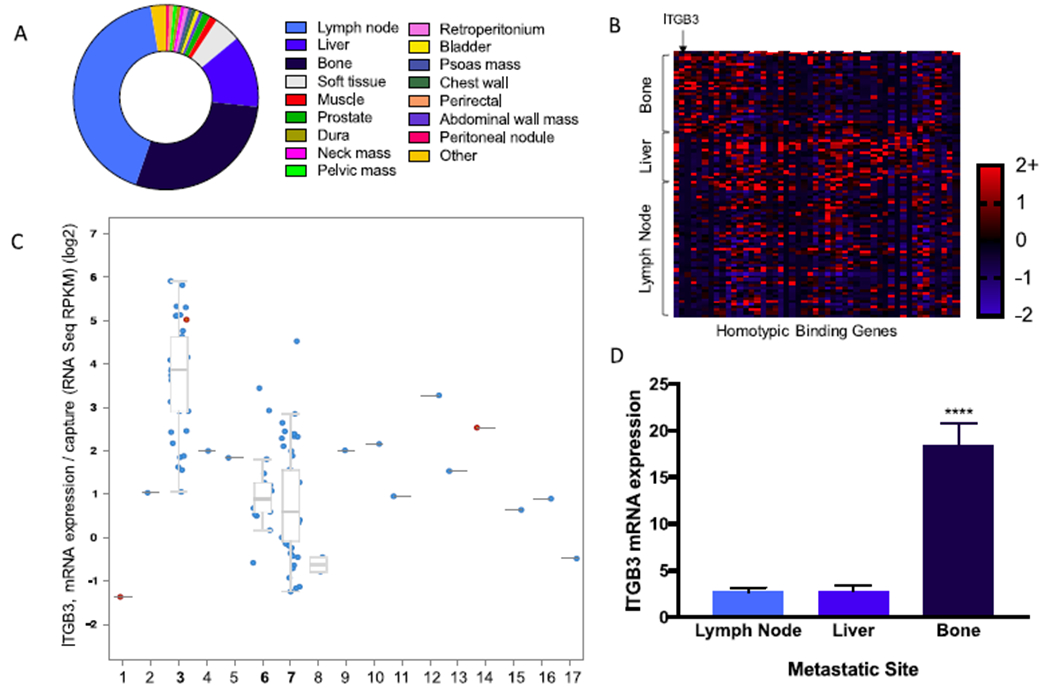
αVβ3 identified as target for enhanced homotypic binding and bone adhesion. (A) Percentage distribution of prostate cancer metastatic locations; the top three metastatic sites were bone, liver, and lymph node. (B) Heat map of mRNA z-score organized by metastatic location vs genes identified by gene set enrichment analysis that are involved in homotypic cell–cell adhesion. (C) Increased expression of the β3 (ITGB3) subunit of αVβ3 integrin in bone metastatic prostate cancer compared to other metastatic sites. (D) Quantification of ITGB3 expression levels (RNASeq RPKM) of the three most common metastatic locations. Bone has a significantly higher level of expression of ITGB3 compared to liver and lymph nodes. Mean ± SEM ****P < 0.0001 P-values generated using ordinary one-way ANOVA with multiple comparisons and secondary Tukey’s comparison test. Total patients involved in study (n = 150). Tumor samples with mRNA analyzed (n = 118). 1, abdominal wall mass; 2, bladder; 3, bone; 4, chest wall; 5, dura; 6, liver; 7, lymph node; 8, muscle; 9, pelvic mass; 10, penile; 11, perirectal; 12, peritoneal nodule; 13, prostate; 14, prostate TURP; 15, soft tissue; 16, thoracic epidural; 17, glans penis.
CXCL12 was identified through a literature search as a ligand that can increase surface expression of integrin αVβ3 through binding to CXCR4 on cancer cells in culture.9 Further, the increased αVβ3 expression has been shown to increase binding of prostate cancer cells specifically to bone marrow-derived endothelial cells in experimental models.9 The C4-2B prostate cancer cell line has been used for this proof of concept because this prostate cancer cell line has known ability to create bone lesions in a mouse model.14,15
C4-2B prostate cancer cells were first stimulated with CXCL12 for different time periods, and the expression level of αVβ3 was determined at specified time points through immunocytochemistry. Results showed that there was an approximately 2-fold increase in expression level of αVβ3 after the first hour of stimulation and this remained constant for the duration of the experiment (Figure 2). Thus, 1 h was chosen as the length of time needed to program the cells for increased surface expression of αVβ3 in subsequent experiments. We have also conducted the Western blot analysis for αVβ3 quantification at 1, 6, and 12 h. However, expression of integrin αVβ3 detected using Western blotting is not completely aligned when compared to flow cytometry data. This can be attributed to the fact that phosphor-β3 integrin observations using Western blotting included only one site, Tyr773, and not all phosphorylation sites. The details of these experiments, and the results are included in Figure S2.
Figure 2.

Programming cancer cells to have higher surface expression of αVβ3. (A) Representative immunocytochemistry images of C4-2B cells at various time points after stimulation: (top) αVβ3 expression; (middle) DAPI; (bottom) overlay. The scale bar size is for 40 μm. (B) Quantification of average fluorescent intensity per cell with increased αVβ3 surface expression after stimulation (n = 3). *P < 0.05. P-values generated using ordinary one-way ANOVA with multiple comparisons and secondary Tukey’s comparison test. Mean ± SEM.
Preparation and Characterization of Nanoparticles.
After cancer cells were programmed to have increased expression of αVβ3, the next step was to isolate those cancer cell membranes and optimize the coating and physical properties of the nanoparticles. We first isolated the membranes by a differential centrifugation technique to harvest the lipid and embedded protein components. Western blot was used to verify the purity of the membrane fraction and confirmed the presence of Na/K ATPase, a membrane marker, in both the whole cell lysate and purified membrane samples. As expected, a nuclear marker (lamin) and a mitochondrial marker (cytochrome c) were absent in the purified membrane lysates but present in the whole cell lysates (Figure S3A). Additionally, Coomassie blue stain displayed a profile of proteins that were present after the membrane purification process in both C4-2B and LNCaP prostate cancer cell lines (Figure S3B). These membrane proteins may have an impact on the homotypic binding and bone adhesion of the nanoparticles beyond the known functional influence of αVβ3 integrin.
Next, the ideal amount of cell membrane to coat the nanoparticle was explored using a nanoparticle stability assay. Various ratios of nanoparticle to cell membrane were coated and then introduced into an ionic solution of PBS to induce aggregation of noncoated or partially coated nanoparticles as measured by an increase in hydrodynamic diameter.10,16 Nanoparticles coated with ratios of 0.25:1 and 0.5:1 (weight of cell membrane protein to weight of polymer) were most stable after being introduced into PBS, whereas noncoated PLGA nanoparticles and nanoparticles coated with membrane to polymer ratio of 0.1:1 tended to aggregate (Figure S3C). This is due to surface charge attraction resulting in low stability. The cell membrane coating renders the nanoparticles hydrophilic, which allows for steric stabilization thereby preventing aggregation. Thus, the ratio 0.5:1 was selected for further experiments. For the nanoparticle core, we have utilized poly(dl-lactide-co-gylcolide) (PLGA) polymeric nanoparticles due to their negative ζ potential, biocompatibility, and high encapsulation efficiency of hydrophobic molecules that can be loaded for therapeutic or imaging purposes.17
Nanoparticle size, as measured by dynamic light scattering (DLS), showed an expected increase after particles were coated with the cancer cell membrane. The initial size of noncoated nanoparticles was 97.2 nm and increased to 117–138 nm when coated (P < 0.0001) (Figure 3A). Zeta potential also significantly changed as the nanoparticles were coated with the cancer cell membrane from −44 mV when uncoated, to −28 mV through −33 mV in the coated nanoparticles (Figure 3B). Other cell types were tested and found to have similar trends in both increased size and ζ potential measurements when nanoparticles were coated. Transmission electron microscopy (TEM) was used to visualize and verify the membrane coating on the NP (Figure 3C). The nanoparticles were first stained with uranyl acetate and then visualized using TEM. The resulting scans depict a core–shell structure corresponding to the lipid bilayer coated polymeric particles as described by other reports.16,25 The results suggest a successful verification of membrane coating onto polymeric nanoparticles. A low density TEM scan of the nanoparticles has been included in Figure S4 to confirm no irregularities arising due to sample charging and its effect on focal plane while scanning.
Figure 3.

Nanoparticle characterization. (A) Size and PDI of nanoparticles as measured by dynamic light scattering. There was a clear increase in size when comparing bare nanoparticles to nanoparticles coated with membranes. P-values generated using ordinary one-way ANOVA with multiple comparisons and secondary Tukey’s comparison test. (B) Zeta potential measurements resulted in a less negative ζ potential when comparing bare nanoparticles to membrane coated nanoparticles. P-values generated using two-way ANOVA. (C) Transmission electron micrograph (TEM) of BiNP nanoparticles showing coating with cancer cell membrane. (D) Stability study performed for 7 days demonstrates the nanoparticles are not aggregating in solution. Samples run in triplicate. Mean ± SEM **P < 0.01, ***P < 0.0005, ****P < 0.0001.
Also, stability measurements of both the BiNPs and the P-BiNPs show similar constancy in both size and PDI over the time course of 1 week when stored at 4 °C (Figure 3D).
In Vitro Uptake and Cytotoxicity of P-BiNPs.
Some cancer cells and nanoparticles coated with cancer cells have been reported to exhibit homotypic binding properties in which they recognize tumor cells of the same type.11,12,18 To determine whether this recognition could be enhanced through programming cells to increase expression of αVβ3 by a natural stimulation process, we treated both C4-2B and fibroblasts with either bare NPs, BiNPs, or P-BiNPs that were derived from C4-2B membranes and fluorescently labeled. Flow cytometry was used to measure the uptake in the cells. Cell uptake was measured at 1 h as it has been reported that cancer cells have a higher cell membrane permeability compared to normal cells and thus there is a rapid initial influx of nanoparticles. Higher time points were not considered to eliminate nanoparticle efflux as cell efflux transporters are upregulated in the cell membrane.26 Based on our previous experience and optimization of different time points, we observed 1 h as an optimal time for efficient comparisons. The authors believe that uptake may change slightly with time but not significantly enough to affect the results. P-BiNPs had a much higher uptake in the C4-2B cell line as measured through flow cytometry. Representative images of flow uptake studies are shown in Figure S5). The approximately 4-fold increased uptake with the P-BiNP group compared to the BiNP group suggests that the stimulation process is an important factor for enhancing the nanoparticle cellular uptake (Figure 4A). In addition to cellular uptake, tumor penetration was modeled using 3D prostate cancer spheroids. The results showed that P-BiNP had no issue thoroughly penetrating the spheroid after incubation (Figure S6).
Figure 4.
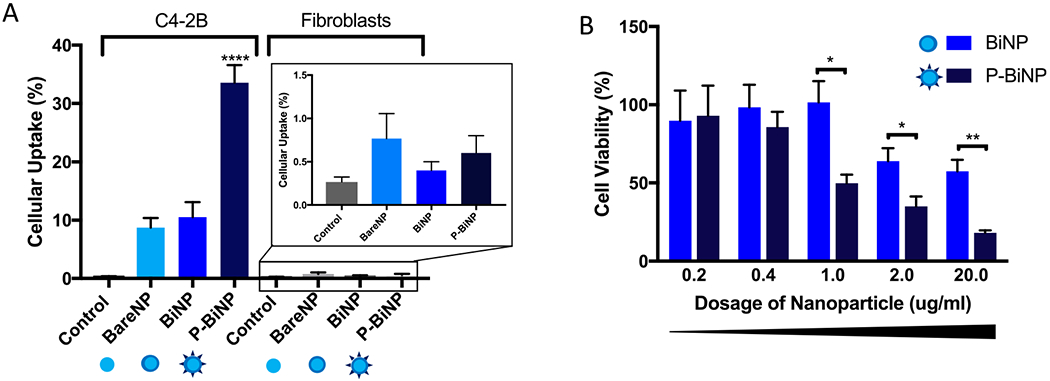
Programmed bioinspired nanoparticles have increased uptake into cancer cells. Nanoparticles were tagged with Nile red dye and incubated with C4-2B prostate cancer cells or human fibroblast cells for 1 h, and uptake was assessed through flow cytometry gated to detect Nile red fluorescence. (A) Quantification of triplicate experiments showing highest uptake in C4-2B cells when incubated with P-BiNPs. (inset) Nanoparticle uptake in fibroblast cells. (B) MTT cell viability assay after treatment with increasing concentrations (0.2–20.0 μg/mL) of BiNP or P-BiNP resulting in decreased cell viability of P-BiNPs at equivalent treatment dosage as BiNPs after 72 h. Mean ± SEM (n = 4); *P < 0.05, **P < 0.01, ****P < 0.0001. P-values generated using ordinary one-way ANOVA with multiple comparisons and secondary Tukey’s comparison test.
Increased cell uptake into cancer cells and tumors should result in improved cytotoxicity of chemotherapy delivered to the cells as the molecules are transported inside the cells more efficiently. We tested whether programming cabazitaxel loaded nanoparticles to have increased αVβ3 on their surface would translate to having increased cytotoxic effects compared to BiNPs with no stimulation using MTT cell viability assay. Cabazitaxel was chosen as a model drug because in addition to being FDA approved for metastatic prostate cancer, it has lower substrate affinity for the ATP-dependent drug efflux pump glycoprotein (P-gp) that is commonly up-regulated in metastatic and chemotherapy-resistant cancers.19 Thus, cabazitaxel is less likely to be pumped out of the advanced tumor cells after gaining entrance into the cell. P-BiNPs showed decreased cell viability compared to BiNP (Figure 4B) demonstrating that the natural stimulation process can enhance therapeutic efficacy via improvement of chemotherapy delivery inside the cell. The cytotoxicity of P-BiNPs in prostate primary endothelial cells was also carried out, and the results show no significant toxicity in primary prostate endothelial cells (Figure S7), which confirms that the P-BiNPs have no inherent toxicity.
In Vivo Bone Homing of P-BiNPs.
Bolstering homotypic targeting was one of the design goals of this nanoparticle. The second objective was enhancing the ability of the P-BiNPs to bind to the bone through a bioinspired and clinically relevant approach. This was achieved by identification of αVβ3 integrin playing an important role in bone homing of prostate cancer. This integrin has been studied in the context of tumor cell adhesion to bone components such as vitronectin, bone sialoprotein, osteopontin, and other bone extracellular matrix factors.20–23 It is possible that the low blood flow environment of the bone coupled with the binding affinity of αVβ3 generates a suitable situation for prostate cancer cells to bind to the bone during the metastatic process.
A tail vein injection was utilized to deliver nanoparticles for determination of in vivo biodistribution of P-BiNPs after 2 h. Biodistribution was measured at an optimal time point of 2 h because a shorter time period would limit ample circulation time for the nanoparticles to bind to their targeted sites, while longer time periods would risk cargo release from the nanoparticles. This route of administration allows testing whether the P-BiNPs can mimic the bone homing ability observed in prostate cancer. We first wanted to determine the differential organ localization between the P-BiNPs and the BiNPs after injection. The sample size in this experiment is modest, and results have been reported accordingly. We have used the USCF Online Clinical and Translational Power/Sample Size calculator. Based on our previous data showing a 2-fold increase in expression of αVβ3 in cell line data (Figure 3), we postulated that the increase in protein seen at the cell level would cause an increase in nanoparticle accumulation at the in vivo level. We used the following variables to calculate power: α = 0.05, β = 0.2, q1 = 0.5, q0 = 0.05, E = 2, S = 1. We found the number needed in each group to be 4 when considering P-BiNP vs BiNP, where E is effect size (if μ1 = mean in group 1 and μ0 = mean in group 0, then E = μ1 − μ0). S is standard deviation of the outcome in the population, q1 is the proportion of subjects that are in group 1 (exposed), q0 is the proportion of subjects that are in group 0 (unexposed), 1 − q1. It was found that the P-BiNP had an increased concentration in both the heart and bone relative to the BiNPs (Figure 5A). The increased P-BiNP localization to both the bone and heart may be attributed to the multiple functional roles CXCL12 signaling plays in various contexts. In addition to the enhanced bone homing ability of cancer cells after CXCL12 stimulation as discussed above, it has been demonstrated that stem cells can home to the heart in response to a chemotactic gradient of CXCL12 originating from damaged cardiac tissue.24 We suspect that the CXCL12 stimulation of the P-BiNPs may be responsible for the increased concentration in both the bone and heart. The other organs investigated were the liver, lung, spleen, and kidney. They all showed decreased P-BiNP signal relative to the BiNP group (Figure 5A). Next, we compared the absolute NIR signal in the bone versus the heart from the animals treated with P-BiNPs. We found that the bone had a significantly higher absolute NIR signal than the heart, thus indicating that the total amount of P-BiNP that reached the bone was higher than the amount that reached the heart (Figure 5B,C). It must be noted that blood is a strong absorber of fluorescence due to its hemoglobin content, with the heart having a higher blood volume compared to the bone. However, the difference in fluorescence seen here is not due to this phenomenon; as the emission energy of hemoglobin is 438 nm and the dye we used is a NIR dye, there is no interference. A dye in the NIR region was chosen for our experiments to eliminate such background interference. Finally, high resolution NIR scans were performed on the mouse hind limbs (Figure 5D). In these scans, the fluorescence intensity normalized to planar surface area has been presented for better comparison between groups (Figure 5E). It was observed that the NIR signal in the P-BiNP group was distributed throughout the hind limb with the strongest signal detected at the distal femur. As it is envisioned that this delivery system might be a way to preferentially localize chemotherapy to the bone where bone metastases are present, care should be taken not to load these nanoparticles with cardiotoxic drugs as there is some homing ability to the heart as well, which could exacerbate the cardiotoxic effects.
Figure 5.

Enhancement of bone homing via programmable bioinspired nanoparticles. (A) Relative percentage difference of organ localization between P-BiNP and BiNP after tail vein injection showing highest P-BiNP localization in heart and bone. (B) Representative image overlay showing difference in nanoparticle organ localization. A relative reduction in P-BiNP NIR signal in the organ is indicated in red color, and increase in P-BiNP in the organ is represented by green color compared to BiNP. (C) Absolute fluorescent values for the two organs (heart and bone) with increased P-BiNP signal after injection demonstrating higher levels of P-BiNP in the bone compared to heart. P-values generated using two-way ANOVA. (D) High resolution scan of hind limbs for sensitive detection and localization of either dye, BiNP, or P-BiNP. Green = 800 nm wavelength emission of NIR dye. (E) Quantification of high resolution scans showing highest signal in P-BiNP group normalized with respect to area of the bone (n = 4). Mean ± SEM; *P < 0.05, **P < 0.001. P-values generated using ordinary one-way ANOVA with multiple comparisons and secondary Tukey’s comparison test.
CONCLUSION
We have successfully utilized a bioinformatics identification process to engineer programmable bioinspired nanoparticles and demonstrated their utility of increased recognition of cancer cells as well as their ability to localize to the bone after systemic injection. This bioinspired platform is promising as we have incorporated relevant clinical gene expression data to guide the design and enhancement of biological processes that these nanoparticles mimic. Since these bioinspired nanoparticles can maintain the complex components of a natural cell membrane for biological function including tumor homing, this proposed delivery method offers several advantages: these nanoparticles can be disguised as autogenous cells, allowing them to escape immune system detection and sequestration in liver and spleen, prolonging circulation time and enhancing permeability and retention effect for improved tumor targeting.
It is envisioned that this platform could be used in future applications as a personalized approach for simultaneously delivering therapeutic and imaging agents to the bone or other organs for targeted uptake in designated cell types.
Supplementary Material
ACKNOWLEDGMENTS
Author Vishwanatha received support from Cancer Prevention and Research Institute of Texas (Grant RP170301) and National Cancer Institute (Grant 5R21CA194295-02). Author Ranjan received support through a UNTHSC Seed Grant and GSBS New and Early Stage Faculty Investigator Research Program Seed Grant. Author Gdowski received support from the Urology Care Foundation Fellowship.
Footnotes
Supporting Information
The Supporting Information is available free of charge on the ACS Publications website at DOI: 10.1021/acsanm.9b01226.
Table of homotypic cell–cell adhesion gene expression in prostate cancer patients’ tumors, SDF-1 stimulation of human bone metastatic prostate cancer cells and avb3 integrin, membrane fraction purification, nanoparticle characterization, representative images of flow uptake experiment, coculture spheroid penetration assay, and cytotoxic effect of P-BiNPs with the highest dose on normal prostate epithelial cells PWR1E (PDF)
The authors declare no competing financial interest.
REFERENCES
- (1).Danhier F; Feron O; Preat V To Exploit the Tumor Microenvironment: Passive and Active Tumor Targeting of Nanocarriers for Anti-cancer Drug Delivery. J. Controlled Release 2010, 148 (2), 135–46. [DOI] [PubMed] [Google Scholar]
- (2).Bertrand N; Wu J; Xu X; Kamaly N; Farokhzad OC Cancer Nanotechnology: The Impact of Passive and Active Targeting in The Era of Modern Cancer Biology. Adv. Drug Delivery Rev 2014, 66, 2–25. [DOI] [PMC free article] [PubMed] [Google Scholar]
- (3).Peer D; Karp JM; Hong S; Farokhzad OC; Margalit R; Langer R Nanocarriers as an Emerging Platform for Cancer Therapy. Nat. Nanotechnol 2007, 2 (12), 751–60. [DOI] [PubMed] [Google Scholar]
- (4).Elias DR; Poloukhtine A; Popik V; Tsourkas A Effect of Ligand Density, Receptor Density, and Nanoparticle Size on Cell Targeting. Nanomedicine 2013, 9 (2), 194–201. [DOI] [PMC free article] [PubMed] [Google Scholar]
- (5).Marusyk A; Almendro V; Polyak K Intra-Tumour Heterogeneity: A Looking Glass for Cancer? Nat. Rev. Cancer 2012, 12 (5), 323–34. [DOI] [PubMed] [Google Scholar]
- (6).Gdowski AS; Ranjan A; Vishwanatha JK Current Concepts in Bone Metastasis, Contemporary Therapeutic Strategies and Ongoing Clinical Trials. J. Exp. Clin. Cancer Res 2017, 36 (1), 108. [DOI] [PMC free article] [PubMed] [Google Scholar]
- (7).Hu CM; Zhang L; Aryal S; Cheung C; Fang RH; Zhang L Erythrocyte Membrane-Camouflaged Polymeric Nanoparticles as a Biomimetic Delivery Platform. Proc. Natl. Acad. Sci. U. S. A 2011, 108 (27), 10980–5. [DOI] [PMC free article] [PubMed] [Google Scholar]
- (8).Jin JK; Dayyani F; Gallick GE Steps in Prostate Cancer Progression that Lead to Bone Metastasis. Int. J. Cancer 2011, 128 (11), 2545–61. [DOI] [PMC free article] [PubMed] [Google Scholar]
- (9).Sun YX; Fang M; Wang J; Cooper CR; Pienta KJ; Taichman RS Expression and Activation of Alpha v Beta 3 Integrins by SDF-1/CXC12 Increases the Aggressiveness of Prostate Cancer Cells. Prostate 2007, 67 (1), 61–73. [DOI] [PubMed] [Google Scholar]
- (10).Fang RH; Hu CM; Luk BT; Gao W; Copp JA; Tai Y; O’Connor DE; Zhang L Cancer Cell Membrane-Coated Nanoparticles for Anticancer Vaccination and Drug Delivery. Nano Lett. 2014, 14 (4), 2181–8. [DOI] [PMC free article] [PubMed] [Google Scholar]
- (11).Glinsky VV; Glinsky GV; Glinskii OV; Huxley VH; Turk JR; Mossine VV; Deutscher SL; Pienta KJ; Quinn TP Intravascular Metastatic Cancer Cell Homotypic Aggregation at the Sites of Primary Attachment to the Endothelium. Cancer research 2003, 63 (13), 3805–11. [PubMed] [Google Scholar]
- (12).Khaldoyanidi SK; Glinsky VV; Sikora L; Glinskii AB; Mossine VV; Quinn TP; Glinsky GV; Sriramarao P MDA-MB-435 Human Breast Carcinoma Cell Homo- and Heterotypic Adhesion Under Flow Conditions is Mediated in Part by Thomsen-Friedenreich Antigen-Galectin-3 Interactions. J. Biol. Chem 2003, 278 (6), 4127–34. [DOI] [PubMed] [Google Scholar]
- (13).Li SY; Cheng H; Xie BR; Qiu WX; Zeng JY; Li CX; Wan SS; Zhang L; Liu WL; Zhang XZ Cancer Cell Membrane Camouflaged Cascade Bioreactor for Cancer Targeted Starvation and Photodynamic Therapy. ACS Nano 2017, 11 (7), 7006–7018. [DOI] [PubMed] [Google Scholar]
- (14).Sarveswaran S; Ghosh R; Morisetty S; Ghosh J MK591, a Second Generation Leukotriene Biosynthesis Inhibitor, Prevents Invasion and Induces Apoptosis in the Bone-Invading C4–2B Human Prostate Cancer Cells: Implications for the Treatment Of Castration-Resistant, Bone-Metastatic Prostate Cancer. PLoS One 2015, 10 (4), e0122805. [DOI] [PMC free article] [PubMed] [Google Scholar]
- (15).Thalmann GN; Anezinis PE; Chang SM; Zhau HE; Kim EE; Hopwood VL; Pathak S; von Eschenbach AC; Chung LW Androgen-Independent Cancer Progression and Bone Metastasis in the LNCaP Model of Human Prostate Cancer. Cancer research 1994, 54 (10), 2577–81. [PubMed] [Google Scholar]
- (16).Luk BT; Hu CM; Fang RH; Dehaini D; Carpenter C; Gao W; Zhang L Interfacial Interactions Between Natural RBC Membranes and Synthetic Polymeric Nanoparticles. Nanoscale 2014, 6 (5), 2730–7. [DOI] [PMC free article] [PubMed] [Google Scholar]
- (17).Hines DJ; Kaplan DL Poly(Lactic-Co-Glycolic) Acid-Controlled-Release Systems: Experimental and Modeling Insights. Crit. Rev. Ther. Drug Carrier Syst 2013, 30 (3), 257–76. [DOI] [PMC free article] [PubMed] [Google Scholar]
- (18).Zhu JY; Zheng DW; Zhang MK; Yu WY; Qiu WX; Hu JJ; Feng J; Zhang XZ Preferential Cancer Cell Self-Recognition and Tumor Self-Targeting by Coating Nanoparticles with Homotypic Cancer Cell Membranes. Nano Lett. 2016, 16 (9), 5895–901. [DOI] [PubMed] [Google Scholar]
- (19).de Leeuw R; Berman-Booty LD; Schiewer MJ; Ciment SJ; Den RB; Dicker AP; Kelly WK; Trabulsi EJ; Lallas CD; Gomella LG; Knudsen KE Novel Actions of Next-Generation Taxanes Benefit Advanced Stages of Prostate Cancer. Clin. Cancer Res 2015, 21 (4), 795–807. [DOI] [PMC free article] [PubMed] [Google Scholar]
- (20).Wong NC; Mueller BM; Barbas CF; Ruminski P; Quaranta V; Lin EC; Smith JW Alphav Integrins Mediate Adhesion and Migration of Breast Carcinoma Cell Lines. Clin. Exp. Metastasis 1997, 16 (1), 50–61. [DOI] [PubMed] [Google Scholar]
- (21).van der Plujim G; Vloedgraven H; Papapoulos S; Lowick C; Grzesik W; Kerr J; Robey PG Attachment Characteristics and Involvement of Integrins in Adhesion of Breast Cancer Cell Lines to Extracellular Bone Matrix Components. Laboratory investigation 1997, 77 (6), 665–75. [PubMed] [Google Scholar]
- (22).Sung V; Stubbs JT 3rd; Fisher L; Aaron AD; Thompson EW Bone Sialoprotein Supports Breast Cancer Cell Adhesion Proliferation and Migration Through Differential Usage of the Alpha(V)Beta3 and Alpha(V)Beta5 Integrins. J. Cell. Physiol 1998, 176 (3), 482–94. [DOI] [PubMed] [Google Scholar]
- (23).Noti JD Adherence to Osteopontin Via Alphavbeta3 Suppresses Phorbol Ester-Mediated Apoptosis in MCF-7 Breast Cancer Cells that Overexpress Protein Kinase C-Alpha. Int. J. Oncol 2000, 17 (6), 1237–43. [DOI] [PubMed] [Google Scholar]
- (24).Ghadge SK; Muhlstedt S; Ozcelik C; Bader M SDF-1alpha as a Therapeutic Stem Cell Homing Factor in Myocardial Infarction. Pharmacol. Ther 2011, 129 (1), 97–108. [DOI] [PubMed] [Google Scholar]
- (25).Luk BT; Zhang L Cell membrane-camouflaged nanoparticles for drug delivery. J. Controlled Release 2015, 220 (Pt B), 600–7. [DOI] [PMC free article] [PubMed] [Google Scholar]
- (26).Behzadi S; Serpooshan V; Tao W; Hamaly MA; Alkawareek MY; Dreaden EC; Brown D; Alkilany AM; Farokhzad OC; Mahmoudi M Cellular uptake of nanoparticles: journey inside the cell. Chem. Soc. Rev 2017, 46 (14), 4218–4244. [DOI] [PMC free article] [PubMed] [Google Scholar]
Associated Data
This section collects any data citations, data availability statements, or supplementary materials included in this article.