

Abstract
Many factors affect road safety, but research constantly shows that drivers are the major cause of critical situations that could potentially lead to a traffic accident in road traffic. Visual information is a crucial part of input information into the driving process; therefore, distractions of overt visual attention can potentially have a large impact on driving safety. Modern eye tracking technology enables researchers to gain precise insight into the direction and movement of a driver’s gaze during various distractions. As this is an evolving and currently very relevant field of road safety research, the present paper sets out to analyse the current state of the research field and the most relevant publications that use eye tracking for research of distractions to a driver’s visual attention. With the use of scientometrics and a qualitative review of the 139 identified publications that fit the inclusion criteria, the results revealed a currently expanding research field. The narrow research field is interdisciplinary in its core, as evidenced by the dispersion of publication sources and research variables. The main research gaps identified were performing research in real conditions, including a wider array of distractions, a larger number of participants, and increasing interdisciplinarity of the field with more author cooperation outside of their primary co-authorship networks.
Keywords: eye tracking, driver behaviour, driver distraction, literature review, scientometrics
Introduction
Road accidents continue to be one of the major causes of deaths worldwide. In 2016, road injuries were the eighth top cause of deaths, killing 1.35 million people worldwide [1]. Many factors affect road safety, but research constantly shows that drivers are the major cause of critical situations that could potentially lead to a traffic accident in road traffic. For example, Singh [2] found that the driver is the cause of critical situations in 94 % of cases, 2 % can be attributed to vehicles, 2 % to the environment, while the remaining 2 % of critical situations are unexplained. These critical situations often lead to traffic accidents, where Dingus et al. [3] examined daily driving and traffic accidents that occurred during tracking of participants’ driving habits and found that almost 90 % of the causes of accidents can be attributed to driver-related factors. Given the prevalence of driver caused critical situations and road accidents, research into the process of driving and potential distractions to the process are imperative for enabling better driving safety.
Rupp [4] notes that driving is a complex activity consisting of many tasks of physical movements, psychomotor tasks, and sensory tasks that require the processing of appropriate visual and auditory information and cognitive and physical processes. As Lee, Young and Regan [5] note, driver distraction can be seen as any diversion of attention towards a non-driving related activity that diverts the driver away from the activities that are crucial for safe driving. Due to driving being an activity that demands attention and a series of reactions which are interconnected, every distraction that influences the driver can cause a disturbance in the whole driving process [6], which in turn can lead to critical situations or even traffic accidents. Singh [2] finds that 41 % of critical situations, caused by humans, can be traced back to errors of perception (inattention, distractions inside or outside of the vehicle, insufficient monitoring of the traffic environment and events). The attention of the driver, directed towards the traffic environment, traffic events, and the vehicle itself, is, therefore, one of the crucial aspects of traffic safety, since only sufficient driver attention ensures that the driver is getting all relevant information they need for making driving-related decisions. In a research of traffic accidents which occurred during everyday driving, Dingus et al. [3] found that the drivers were directing their attention towards distractions inside or outside of their vehicle in the six seconds leading up to an accident in as much as 68.3 % of recorded accidents, with the largest distraction being distractions that warrant the driver to redirect their visual attention away from the traffic environment and events, such as mobile phone use or searching for an object inside the vehicle.
Visual attention is therefore of key importance for successful and safe driving. As early as the 70s of the 20th century, researchers estimated that as many as 90% of the information needed for driving is obtained through the visual channel [7]. Precise quantification of the amount of information that drivers acquire with vision in relation to other senses is practically impossible, since in the process of driving, in addition to visual information, drivers also obtain and process audio and kinaesthetic information, while at the same time interactions between all information and their processing are carried out at the cognitive level of the driver [8]. Additionally, drivers obtain visual information not only from their direct location of gaze (overt visual attention), but also covertly using their peripheral vision [9]. Research by Fort et al [10].that studied brain activity while driving has undoubtedly shown that when changes in the traffic environment and traffic events occur, the parts of the brain responsible for visual perception and processing are activated first, and that, based on these processes, other centres in the brain are activated, for example those for motor skills, coordination, and attention [11].
Research on distractions affecting the driver while driving is likely as old as the act of driving itself. The first researches of advertising boards, one of the most researched influences on visual attention drivers even today, appeared in the 1950s. Their findings were different and often contradictory, for example, Staffeld [12] and Rusch [13] found that there were significantly more traffic accidents on road sections and intersections with many billboards than in areas without them, while McMonagle [14] and Lauer and McMonagle [15] found that roadside advertising has no significant impact on the number of traffic accidents or on the act of driving. Several years later, research into drivers’ visual distractions began to appear. King and Sutro [16] were among the first and they concluded that the cause of one out of eight traffic accidents lies in a direct hindrance to the driver’s visual field, and cases where the driver turns his attention away from the traffic environment and events due to various distractions should also be added to this statistic. The first studies using eye tracking technology to explore the overt visual attention of drivers appeared in the middle of the 20th century, when gaze tracking was based on simpler cameras installed on the dashboard. The first studies go back as far as the 1970’s, when Mourant and Rockwell [17, 18] explored search and scan patterns of drivers with a head-mounted system with an eye-marker camera and a stabilization unit [19]. Graf and Krebs [20] used a different apparatus, consisting of an oculometer that superimposed the fixation locations on a video of the driving scene to research driver responded to headlamps. A while later, research using eye tracking technology in the field of traffic safety and specifically in the field of visual attention of drivers began to focus on the distractions that drivers encounter inside and outside of the vehicle. Crundall and Underwood [21] studied the differences in gaze direction, fixation duration, and horizontal and vertical spread of search, among experienced and beginner drivers under conditions of different cognitive loads as caused by variable road conditions. In one of the first large-scale driver distraction studies, Sodhi et al. [22] and Sodhi, Reimer, and Llamazares [23] studied the influence of frequent distractions on gaze direction and patterns of gaze movements with basic eye tracking equipment, composed of three cameras in the vehicle, one of which was mounted on the driver’s head. The main disadvantage of most of the early studies is the fact that due to the limitations of the equipment used, the analysis covered only data on gaze shifts inside a coordinate system without considering what the driver actually sees by applying the gaze data onto a video of the driver’s visual field. Modern eye tracking technology has largely surpassed these limitations and can consequently give researches important and accurate insights into the visual attention of drivers.
In recent years, the use of eye tracking technology in the study of driver behaviour has been growing and expanding, as the ease of using this technology, its accuracy, and the quality and usability of the acquired data have vastly improved. It seems that the opportunities for eye tracking use in researching driver distractions are endless. For this reason, the purpose of this paper is to collect and analyse the studies carried out so far, which specifically examined distractions of drivers’ visual attention using eye tracking equipment. The literature review will focus on the methodological aspects of included scientific contributions to determine the ways in which eye tracking had been used in relevant research up to now. Moreover, we will analyse this narrow field of scientific research using basic scientometric procedures to determine the authors and topics that are prevalent in the field. Based on this, a summary of the main findings about the state of the research field will be given with suggestions for future use of eye tracking in the research of drivers’ visual attention and distractions will be presented.
Methods
When looking for previous scientific publications using eye tracking to analyse distractions that affect the driver while driving, Scopus and Web of Science databases were used. The search was performed in July 2019. These two databases were selected because they are the most commonly used, but at the same time differ in their coverage [24]. Therefore, using both instead of just one will broaden the scope of our preliminary search and represent a set of scientific publications covering the most commonly used criteria for demonstrating the scientific impact of publications. In both databases, we searched for publications with the search string (("eye track*" OR "eye movement*") AND driv* AND distract*) with no other restrictions. Since the main goal of this paper is to analyse scientific studies of driver distractions that used eye tracking as their main research tool, some exclusion criteria were set to ensure the inclusion of only relevant studies. Excluded were publications that:
present only literature reviews;
focus on theoretical aspects of using eye tracking, and conceptual papers;
focus on the technical aspects of eye tracking technology or present patents;
suggest the use of eye tracking technology, but do not demonstrate direct use of the technology in research;
study modalities other than car road transport, and papers devoted to autonomous vehicle use;
use eye tracking technology for research into drivers’ visual behaviour during driving without specifically studying distracting factors, e.g. development of a model for predicting distracted driving or driver drowsiness or researching gaze patterns of drivers in general;
do not deal directly with examining driver distraction, but rather use eye tracking to examine design features of various elements in the traffic environment or vehicle, e. g. the design of traffic signs, changes in road geometry, user interface design of in-vehicle systems…
In Web of Science, a search was performed using the search string in the Topic field, which includes the title, keywords, and abstract. The search returned 372 results. In Scopus, the search, which included paper titles, keywords, and abstracts, returned 429 results. After deleting duplicates, 572 publications remained. The publications were reviewed, researchers read the abstracts and, where necessary, the methodological part. All publications were independently reviewed by two researchers and the publications that both excluded were taken out of the literature pool immediately, while the publications that the researchers didn’t agree on were reread and debated upon. The literature pool included 103 publications after this step. In order to ensure inclusion of all relevant scientific publications, reference lists of the 30 top cited publications from the current literature pool were also reviewed to find more relevant scientific publications that were not identified based on Scopus and WOS search. Through this step, additional 36 publications were added into the literature pool. Taking into account the exclusion criteria, 139 scientific publications that present research of driver distraction with the use of eye tracking technology were selected to be included in the analysis.
The process of selecting the included studies is shown in Figure 1.
Figure 1.

Publication selection process.
The literature analysis was performed in two steps. First, we focused on bibliometric analysis showing basic parameters such as publication year and source journals, and science mapping, which utilized the VOSviewer tool [25] Science mapping is a procedure used to analyse and visualize a specific field of scientific research [26] Due to software limitations, input data for science mapping was exported from Scopus only, which resulted in an omission of three publications that are not indexed in Scopus, and consequently, all analysis in VOSviewer was performed on a literature pool of 136 publications Several analyses were performed using VOSviewer: citation analysis, co-citation analysis, bibliographic coupling analysis, co-authorship analysis, and co-occurrence analysis of keywords.
Furthermore, the analysis focused on how the research presented in the papers used eye tracking technology to research driver distraction and what variables were most often used. Therefore, we gathered information about the observed distractions, independent and dependent research variables, type of eye tracking used, and whether the research was performed in a driving simulator or on real roads. Based on this, an analysis of the key elements of the included publications was performed and presented. Additionally, Appendix A shows the whole literature pool and the observed factors of eye tracking use.
Results
Bibliographic analysis and science mapping
Even though eye tracking tools have existed for quite some time, their extensive use in researching driver distractions began rising after the year 2002 when yearly output on the topic of driver distraction research using ET began rising. Before that, only 9 publications were published. From 2011 on, a significant increase in output on the field can be seen with publishing activity reaching its peak in 2013. The overall trend of a growing number of publications is seen, as shown in Figure 2. The data for 2019 is not yet complete, since the data for the present paper was collected in the middle of the year.
Figure 2.

Number of publications per year.
Out of the 139 included publications, 33 were published in conference proceedings and 106 in 10 different scientific journals. The total number of unique sources of publications is 50. A detailed publication number for the most productive sources that published 3 or more publications from the literature pool is shown in Table 1.
Table 1.
Sources.
| Source title | Number of papers |
| Transportation Research Part F: Traffic Psychology and Behaviour | 23 |
| Accident Analysis and Prevention | 21 |
| Applied Ergonomics | 14 |
| Proceedings of the Human Factors and Ergonomics Society | 8 |
| Transportation Research Record | 8 |
| Human Factors | 7 |
| AutomotiveUI: International Conference on Automotive User Interfaces and Interactive Vehicular Applications | 4 |
| Journal of Experimental Psychology: Applied | 4 |
| Ergonomics | 3 |
To identify papers with the largest impact in the field, citations in the Scopus database were also examined. 14 publications have more than 100 citations with Strayer, Drews, & Johnston [27] being the most cited with 608 citations. The top ten cited publications are shown in Table 2.
Table 2.
Most cited papers.
| Authors and publication year | Number of citations |
| Strayer, Drews, & Johnston, 2003 [27] | 608 |
| Engström, Johansson, & Östlund, 2005 [28] | 392 |
| Brookhuis, de Vries, & de Waard, 1991 [29] | 363 |
| Recarte & Nunes, 2003 [30] | 357 |
| Recarte & Nunes, 2000 [31] | 282 |
| Victor, Harbluk, & Engström, 2005 [32] | 275 |
| Lamble, Kauranen, Laakso, & Summala, 1999 [33] | 265 |
| Harbluk, Noy, Trbovich, & Eizenman, 2007 [34] | 244 |
| Horrey, Wickens, & Consalus, 2006 [35] | 201 |
| Wikman, Nieminen, & Summala, 1998 [36] | 145 |
Citation mapping was performed using the VOSviewer tool and is based on citations of 136 papers in the literature pool in the Scopus database. Each of the 136 publications is represented with a node (circle) and named with the first author’s surname and publication year on Figure 3 The size of the node and its colour show the number of citations of each paper, and the lines between nodes show a citing connection between two papers The largest cluster of citations that emerged in the literature pool contains 115 items, as seen in Figure 3
Figure 3.

Citation mapping.
According to van Raan [37], citation analysis can be performed on the level of the secondary network as well, where we can identify co-citations (where two publications are cited together by another publication) and bibliographic coupling (where two publications have references in common). These two secondary network analyses were performed in VOSviewer and the results are shown in Figure 4 and Figure 5.
Figure 4.

Co-citation analysis.
Figure 5.

Bibliographic coupling.
Co-citation analysis analyses how often two publications are cited together in another publication. 4057 publications that were cited by publications in the literature pool of the present research were first identified (for example, Engström, Johansson, and Östlund [28] and Strayer, Drews, and Johnston [27] are both cited by Edquist, Horberry, Hosking, and Johnston [38]). Only publications that were cited at least three times were included in the co-citation analysis, meaning 58 items. The co-citation network is shown in Figure 4. Similar colours of the nodes represent papers that are connected, meaning they are cited together in other publications more often and therefore likely similar in topic and relevant for the research field, and the link weight presents the co-citation strength. The network is formed out of six clusters of papers, often co-cited.
Bibliographic coupling analysis was performed on the literature pool by including only publications that have at least 10 citations in the Scopus database. The largest set of interconnected publications includes 65 items, as shown in Figure 5
Each node represents an included paper and each line represents a bibliographic coupling occurrence, meaning that the connected papers share a common reference (for example, both Dukic, Ahlstrom, Patten, Kettwich, & Kircher [39] and Edquist, Horberry, Hosking, and Johnston [38] reference Crundall, Van Loon, and Underwood [40]). The size of each node presents its relative number of citations, and the weight of a link (line) presents the relative amount of references the two connected papers share. From the analysis in VOSviewer, it is evident that six clusters of publications emerged, presenting papers that are connected and have more references in common, which points to their relative similarity in topics. These are represented in the graphic with the same colour. A graphical representation of the bibliographic coupling relations in the literature pool is shown in Figure 5.
Altogether, 360 authors were identified as contributing to the pool of research papers after manual consolidation of results due to different issues with author names (e.g. engström j. and engström j.a. were consolidated into engström j.a.. The most productive authors up to now are Reimer B. with 11 publications, Kaber D. D., Mehler B., and Fisher D. L. with eight publications each, Liang Y. with seven publications and Horrey W. J. and Wang Y. with six publications each. If all contributing authors are included in the analysis, the largest cluster of co-authorship with 104 authors that emerges is shown in Figure 6. VOSviewer produced a co-authorship scheme as shown in Figure 6. Each node represents an author, and the larger the size, the larger the number of contributions into the literature pool. The line weight presents the amount of publications the authors have co-authored.
Figure 6.
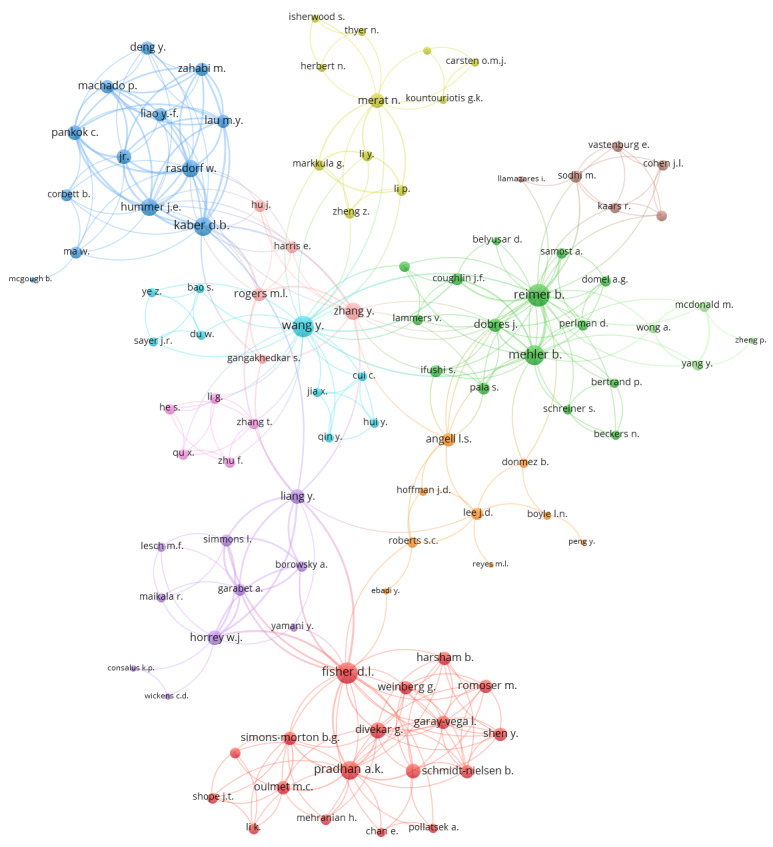
Largest cluster of co-authorship.
VOSviewer identified 1077 keywords, which included the author and index keywords. Keywords were looked through and synonyms were joined before the visualization process was run (e.g. car drivers and automobile drivers were joined into car drivers, eye tracking and eye-tracking were joined into eye tracking), as well as keywords with a common meaning (e.g. driving simulation, driving simulator, driving simulators, and driving simulator study were joined into driving simulation). This reduced the number of keywords to 951.
The keywords with most occurrences were “eye movements” with 78 occurrences, “car drivers” with 68, and “human” with 62. All keywords that were used at least ten times (52 keywords) are shown in Figure 7, where each circle presents a detected keyword, the size of the node points to the number of occurrences of the keyword, and the links show which keywords appear together in publications. We can identify four clusters of keywords, meaning that these keywords have common themes.
Figure 7.

Co-occurrence of index and author keywords.
Author keywords are a subsection of all keywords that VOSviewer identified, these are the keywords identified by the authors as representative of the papers’ contents. VOSviewer identified 288 unique keywords in the literature pool. Once again, synonyms and keywords with a common meaning were identified and merged, which left 253 keywords for analysis input. If we set the minimum number of a keyword occurrence to three, 33 author keywords are included in the analysis, which is shown in Figure 8. The three most used author keywords are “driver distractions”, “eye movements” and “driving simulation”. Once again, the circles show keywords and the size of a frame points to its relative number of occurrences. The colour of a circle shows how many times papers with that keyword have been cited up to now, with yellow being the most cited keywords and blue the least cited. Even though “driver workload” and “visual attention” are among the least used keywords, they are associated with the most cited papers, and on the other hand, “driver distractions” and “eye tracking” are associated with the most papers but are not among the most used in association with citations of papers.
Figure 8.

Co-occurrence and citation count of author keywords.
Use of eye tracking in driver distraction research
A table that shows Authors, publication year, source, observed distractions, observed independent and dependent variables, number of participants, setting, and type of eye tracking used, can be found in Appendix A. For shortening purposes, all elements of the table in the appendix are presented with codes which will be give alongside the results in this chapter.
In the analysed publications, some used driving simulators, some on-road setting, some both, and some utilized a simpler approach by showing pre-recorded video clips of driving situations to participants. Out of the analysed publications, research was performed in a real road setting in 44 publications, 81 publications utilized a driving simulator of various sophistication, four publications used both simulators and on-road settings, and nine publications used only video recordings. Out of the 134 papers that had information about the number of participants’ data included in the eye tracking analysis available, the range of participants is from one to 123. The mean number of participants is 28.96 with a standard deviation of 21.58. If we only look at research that was done in a driving simulator, the mean number of participants is 27.84 with a standard deviation of 17.02 (min 5, max 120), and research performed on real roads had a mean of 26.05 participants (sd 23.63, min 1, max 123). Based on these statistics and taking into account the large standard deviations, we can conclude that the number of participants varies largely and that the research setting does not seem to have a direct influence on the number of included participants.
As for the eye tracking technology used, we grouped the used technology into two broad categories: head-mounted, wearable eye tracking systems, usually in the form of glasses or sometimes implemented with a use of a helmet, and remote eye tracking systems of various configurations, ranging in sophistication from a basic camera that records eye movements and where eye tracking data has to be coded manually, to multi-camera dashboard set ups that automatically code eye movements onto a recording of the driver’s visual field. Out of the 139 included publications, 53 publications report results, obtained with wearable eye tracking systems (coded as HMGL in the Appendix), 80 with remote or dashboard mounted systems (RDSB), 1 used both systems, and information is not available for 5 publications.
Since driver distraction research is at the core of the present research, the next step focused on examining, what types of driver distraction publications in the literature pool focused on. The analysis is based on grouping distractions with common elements or influences on the driver. The most common distractions, such as cell phone use for texting, were categorized separately, and other, less often used distractions or generic tasks such as the n-back task, were grouped together. Table 3 presents the results of driver distraction analysis along with the number of publications which focus on a distraction or group. Cognitive distractions are by far the most researched, where researchers use generic cognitive tasks to induce a high cognitive load. As for specific elements, various roadside advertisements and information signs are the most commonly observed distraction outside of the vehicle, and cell phone use inside the vehicle.
Table 3.
Frequency of observed driver distractions.
| Code in Appendix A | Observed driver distractions | Frequency |
| OTCOG | other cognitive tasks (minimal manual or visual effort), e.g. n-back task, sound counting | 44 |
| ADSG | roadside advertising signs, billboards, information or logo signs, regardless of type (static, electronic, video...) | 23 |
| OTVIS | other visual tasks (minimal cognitive or manual effort), e.g. target search | 18 |
| PHCNV_h | hand-held cell phone conversation | 17 |
| PHDIA_h | hand-held cell phone dialling task | 15 |
| IVIS | in-vehicle information system or driver support systems, e.g. driving support and information, various control features | 15 |
| NAV_iv | in-vehicle navigation system | 14 |
| RADMS | radio or in-vehicle built in music system use, e.g. radio tuning, CD change, music search | 14 |
| OTTE | other elements of the traffic environment, e.g. pedestrians | 14 |
| PHCNV_hf | cell phone conversation using a hands-free system | 9 |
| NAV_ptb | portable navigation system | 8 |
| PHOTH | other cell phone/smartphone tasks, e.g. browsing social networks, app use | 7 |
| IVPAR | adjusting or reading various in-vehicle parameters, such as climate control, lights, speed control | 6 |
| PMP | portable music player | 5 |
| PHTXT | sending and receiving SMS messages via cell phone (texting) | 5 |
| OTMAN | other manual tasks, e.g. in-vehicle search tasks | 5 |
| PHDIA_hf | cell phone dialling task using a hands-free system | 4 |
| OTIV | other elements inside the vehicle | 4 |
| PASS | passenger | 3 |
The observed distractions were studied with various research procedures and analysis models. By analysing the variables that were the research focus, we can gain a better understanding of the procedures used in the field of driver distraction research using eye tracking. First, Table 4 presents the frequency of various independent variables that were used for analysis of driver eye movements. All publications compare the baseline driving condition (without distractions) to the experiment condition as a basic research procedure, that is why the baseline vs. experimental condition variable is not shown in the table below. Besides that, the type of task, target, or distraction, is the most commonly used independent variable, which gives researchers an opportunity to compare various influences to driver visual attention based on the content or configuration of the distraction.
Table 4.
Frequency of used independent variables.
| Code in Appendix A | Independent variable | Frequency |
| TYPT | type of task/target/distraction (e.g. type of sign, contents of advertisements, specific instructions for the task, type of feedback). | 95 |
| ROAD | type of road or road geometry | 30 |
| TSKD | task difficulty (various difficulties of the same task) | 28 |
| MODT | modality of technology (e.g. type of navigation system, handheld or hands-free operation, touch or speech control) | 26 |
| HZRD | type of hazard / critical event (e.g. pedestrian on road, lead vehicle braking) | 24 |
| TRCON | traffic conditions, e.g. density, configuration, weather | 16 |
| AGE | age of participant | 15 |
| LOCOV | location of target outside vehicle | 14 |
| OTHR | other | 12 |
| DREXP | driving experience of participant | 11 |
| OTPAR | other participant variables (e.g. familiarity with the distraction, attitude towards risk) | 11 |
| GEND | gender | 9 |
| LOCIV | location of target inside vehicle | 7 |
| TIME | time of day | 7 |
Table 5 presents the core of research in the field, observed variables that describe and analyse driver eye movements. The analysis of these variables showed that the basic unit of analysis varies among publications, since some use glances and some fixations as their primary focus. According to the ISO 15007-1:2014 standard, fixations and glances are not the same [41]. This standard (and the ISO/DIS 15007 that is planned to replace the 2014 standard) defines a fixation as a short static alignment of the eyes to a particular point, and a glance as a time section where the gaze is maintained inside a selected area of interest (meaning that a glance can consist of more fixations and saccades). Glances, their frequency, duration, and pattern, are used most often. It is worth noting however that there is a possibility that not all included publications used the same differentiation between glances and fixations.
Table 5.
Frequency of used observed eye movement related variables.
| Code in Appendix A | Eye movement related observed variables | Frequency |
| GL_num | number (frequency) of glances to a specific target or area of interest in a set time period | 49 |
| GL_adur | average duration of glances to a specific target or area of interest in a set time period | 44 |
| GL_patt | glance or fixation patterns or heat map | 31 |
| FIX_num | number (frequency) of fixations on a specific target or area of interest in a set time period | 27 |
| VAR_hor | variance of horizontal range of fixations | 26 |
| GL_% | percentage of glances to a specific target or area of interest in a set time period | 25 |
| FIX_adur | average duration of fixations on a specific target or area of interest in a set time period | 24 |
| GL_tot | total time spent glancing on a target in a set time period | 23 |
| GL_%t | percentage of time glancing to a specific target or area of interest in a set time period | 21 |
| GL_over | number or percentage of glances over a set threshold (most often 2 seconds) | 19 |
| VAR_vert | variance of vertical range of fixations | 19 |
| GL_max | longest duration of a glance to a specific target or area of interest in a set time period | 18 |
| OTHR | other measures | 17 |
| SACC | saccade measures - duration, speed, amplitude... | 17 |
| FIX_tot | total time spent fixating on a target in a set time period | 14 |
| GZ_andev | deviation of gaze angle from a set point (most often the center of the road) | 13 |
| PUP_size | average pupil size (diameter) in a set time period | 13 |
| FIX_% | percentage of fixations on a specific target or area of interest in a set time period | 12 |
| FIX_%t | percentage of time fixating to a specific target or area of interest in a set time period | 10 |
| BL_rate | blink rate in a set time period | 10 |
| TTFF | time to first fixation to the target or area of interest | 7 |
| BL_dur | blink duration | 5 |
| FIX_max | longest duration of a fixation to a specific target or area of interest in a set time period | 4 |
| FIX_over | number or percentage of fixations over a set threshold (most often 2 seconds) | 1 |
Other observed variables not directly connected to eye movements, and their frequencies, are shown in Table 6. Measures of the vehicle’s lateral lane position and speed that point to the drivers’ driving performance, and measures of drivers’ performance on the secondary task (distraction) are commonly used in combination with eye tracking measures in order to further research the influence of distraction on driver performance
Table 6.
Frequency of used other observed variables.
| Code in Appendix A | Other dependent variables | Frequency |
| LATP | lateral position measures (e.g. lane exceedances, variability of lateral lane position, time out of lane) | 60 |
| TSK_perf | secondary task performance (e.g. completion rate, number or correct responses) | 58 |
| SPE_stat | vehicle speed measures of a stationery kind (e.g. average speed, deviations of average speed) | 51 |
| WRKL_s | subjective workload ratings | 31 |
| RET | reaction time to presented task/hazard appearance | 31 |
| STWH | steering measures (e.g. steering wheel reversal rate, steering entropy) | 30 |
| TSK_t | task completion time | 28 |
| OTHR | other | 24 |
| HWTC | headway distance or time to collision | 20 |
| SPE_ch | vehicle speed measures that point to speed changing (e.g. acceleration events, braking force) | 18 |
| INC | incident measures (e.g. critical errors, traffic rules violations) | 14 |
| HRT | heart rate measures | 8 |
| PERF_s | subjective performance rating | 6 |
| SKC | skin conductance measures | 6 |
Discussion
Distracted driving is undoubtedly a rising issue that needs to be tackled by scientists and practitioners worldwide. A deeper understanding of the effect of distractions on the drivers’ visual attention is made possible by using eye tracking technology, which has become portable and highly accurate in the last decade and therefore enables research that was almost impossible not so long ago.
To present the current state of the field of eye tracking use in researching distractions to drivers’ visual attention, this paper focused on science mapping and bibliometrics to describe the field and find its main characteristics. Its main conclusions can be summed up as follows:
Generally speaking, eye tracking is currently being used as a supportive technology in driver distraction research. Given its potential for an accurate insight into the overt visual attention of drivers, it can be expected that this field of research is expanding and will likely continue to grow in the next years. Currently, 139 papers that focus on examining the influence of distractions on drivers’ visual attention can be found in WOS and Scopus, and the overall publication trend is on the rise.
The field is interdisciplinary in its core, which is also reflected in the source publications where papers are being published. Journals and conferences that publish papers from the field are predominantly focused on psychology and human factors, transportation, safety, and ergonomics.
Citation analysis shows that by far the most referenced paper is on the topic of cell phone distractions, which are also the focus of three other publications among the top ten cited. An analysis of citing among papers in the literature pool shows that the field is relatively interconnected since 115 out of the 136 included publications share at least one citation link. This is not surprising given the narrow focus of the present analysis. Secondary citation network analysis (co-citation and bibliographic coupling) further proves the above finding and additionally forms six clusters of connected publications which are most often cited together or share common references.
The amount of cooperation among authors in the field, especially outside of their primary co-authorship network, is relatively low as shown by the co-authorship analysis. The co-authorship scheme shows that some co-authorship clusters have formed but are interconnected only with occasional collaborations.
Four keyword clusters can be identified. One presents research, focused on utilizing driving simulators; the second seems to be focused on evaluating visual attention while taking into account participant factors such as age, gender, and psychological factors; the third, smallest cluster, focuses on accident prevention; and the fourth, largest, focuses on safety and specific distractions and tasks. As expected, “eye movements”, “driver distractions”, “car drivers” and alike are the most commonly used keywords, and these are also keywords used in the most cited papers from the field as shown by the analysis of author keywords.
A little under a third of the included papers present research, performed in real road conditions, other papers utilize driving simulators of various sophistication levels, prerecorded video recordings of driving situations, and four publications utilize both simulators and on-road research. On average, research includes roughly 29 participants, with the average number of participants being slightly higher for research in driving simulators (27.84 versus 26.05 for research in real conditions), but given the large standard deviations, it does not seem that research settings influence the number of included participants.
An overall analysis of the research variables points to the fact that cognitive distractions are most researched, followed by visual ones. Cell phones and various IVIS systems are at the centre of in-vehicle distraction research while advertisements and information signs dominate research outside the vehicle. Most papers only include one distraction or task type. In addition to eye tracking parameters, the effects of driver distraction are often analysed by using complementary variables, such as parameters of driving performance and task performance. Another point worth mentioning is the use of glances or fixations as the basic eye movement parameter. There seems to be a lack of consensus on the field on which unit of measurement to use. We did notice however that a lot of research lately uses the definition of glances and fixations as was put forward in the ISO standard on measuring driver visual behaviour ( 41 ), where fixations are seen as a static point of gaze focus and glances as a set of fixations and saccades inside a predefined area of interest.
Overall, this paper has shown that the field of eye tracking use in driver distraction research is an emerging field with space for improvement and collaboration. The included publications present the main publications in the field and the authors took every possible step to include as much relevant sources as possible, but a possibility exists that some relevant sources have nevertheless been omitted. We estimate however that the coverage of the resent literature review is sufficient to give meaningful insight into the state of the art on the topic of driver distraction research using eye tracking.
Future research recommendations that would fill the gaps as identified in the paper include performing research in real conditions, including a wider array of distractions and comparing them to one another, a larger number of participants, and increasing interdisciplinarity of the field with more author cooperation outside of their primary co-authorship networks. As new potential distractors emerge every day, we conclude that eye tracking is a good tool to evaluate the effects these distractors have on a driver and especially on his overt visual distraction.
Ethics and Conflict of Interest
The authors declare that the contents of the article are in agreement with the ethics described in http://biblio.unibe.ch/portale/elibrary/BOP/jemr/ethics.html and that there is no conflict of interest regarding the publication of this paper.
APPENDIX A: In-depth analysis of papers in the literature pool
| Authors, publication year | Observed driver distractions | Setting | Independent variables | Eye movement related observed variables | Other dependent variables | Number of participants, included in the eye movement analysis | ET type |
| Ahlstrom & Kircher, 2017 [42] | IVIS | on-road | TYPT | TTFF; GL_adur; GL_max; GL_%t; OTHR; GL_over | none | 10 | RDSB |
| Antin, Dingus, Hulse & Wierwille, 1990 [43] | NAV | on-road | MODT; GEND; DREXP; TRCON | GL_adur; GL_patt | TSK_t; TSK_perf; STWH; SPE_ch; LATP | 32 | RDSB |
| Aust, Dombrovskis, Kovaceva, Svanberg, & Ivarsson, 2013 [44] | PHDIA_h; NAV_iv; RADMS | on-road | LOCIV | GL_tot; GL_adur; GL_max | none | 35 | RDSB |
| Beckers, Schreiner, Bertrand, Mehler, & Reimer, 2017 [45] | NAV_iv; NAV_ptb | driving simulator | MODT; TYPT | GL_adur; GL_over; GL_tot | WRKL_s; TSK_t; LATP; SPE_stat; RET; TSK_perf; HRT; SKC | 24 | RDSB |
| Beijer, Smiley, & Eizenman, 2004 [46] | ADSG | on-road | TYPT; GEND; LOCOV; OTPAR | GL_adur; GL_max; GL_num; GZ_andev | none | 25 | HMGL |
| Belyusar, Reimer, Mehler, & Coughlin, 2016 [47] | ADSG | on-road | AGE; GEND; TYPT | GL_num; GL_over; GL_adur | SPE_ch; STWH; LATP | 123 | RDSB |
| Benedetto, Pedrotti, Minin, Baccino, Re, & Montanari, 2011 [48] | IVIS; OTVIS | driving simulator | TSKD; TYPT | BL_rate; BL_dur; PUP_size | WRKL_s; RET; TSK_perf | 15 | HMGL |
| Birrell & Fowkes, 2014 [49] | PHOTH | on-road | TYPT | GL_num; GL_%; GL_adur; GL_max; GL_%t; GL_over; GL_patt | none | 15 | RDSB |
| Blanco, Hankey, & Chestnut, 2005 [50] | RADMS; IVPAR; PHDIA_h; NAV_iv | both | TYPT | GL_num | LATP; SPE_ch; TSK_perf; TSK_t | 89 | RDSB |
| Borowsky, Horrey, Liang, Simmons, Garabet, & Fisher, 2014 [51] | OTVIS | driving simulator | TSKT; HZRD | GL_num | SPE_stat; WRKL_s; TSK_perf | 56 | HMGL |
| Borowsky, Horrey, Liang, Garabet, Simmons, & Fisher, 2015 [52] | OTCOG | driving simulator | TSKT; ; HZRD | GL_num | WRKL_s; PERF_s | 12 | HMGL |
| Borowsky, Horrey, Liang, Garabet, Simmons, & Fisher, 2016 [53] | OTCOG; OTVIS | driving simulator | TSKT; HZRD | GL_num; GL_adur | SPE_stat; WRKL_s; PERF_s | 56 (14 per condition) | HMGL |
| Briggs, Hole, & Land, 2016 [54] | OTCOG | video clips | LOCOV | VAR_hor; VAR_vert; FIX_num | TSK_perf; RET; OTHR | 46 | HMGL |
| Brookhuis, de Vries, & de Waard, 1991 [29] | PHCNV_h; PHCNV_hf; OTCOG | on-road | ROAD; TRCON; MODT; AGE | GL_num | LATP; SPE_stat; STWH; HRT; WRKL_s; TSK_perf | 12 | RDSB |
| Chan, Pradhan, Pollatsek, Knodler, Fisher, 2010 [55] | OTTE; OTMAN; PHDIA_h | driving simulator | DREXP; TYPT | GL_adur; GL_max; GL_over; GL_tot | TSK_t; SPE_stat | 24 | HMGL |
| Chiang, Brooks, & Weir, 2004 [56] | NAV_iv | on-road | TSKD; ROAD | FIX_adur; FIX_%t; FIX_tot; FIX_num | TSK_t; TSK_perf; LATP; SPE_stat; WRKL_s | 10 | RDSB |
| Chisholm, Caird, & Lockhart, 2008 [57] | PMP | driving simulator | TSKD; TYPT; HZRD | GL_num; GL_adur | STWH; LATP; TSK_perf; RET; INC | 19 | HMGL |
| Chisholm, Caird, Lockhart, Teteris, & Smiley, 2006 [58] | RADMS; PHDIA_h; PHCNV_h; OTMAN | driving simulator | DREXP; HZRD | FIX_num; GL_tot; FIX_%t | RET; INC | 40 | HMGL |
| Colon, Rupp, & Mouloua, 2013 [59] | OTTE | driving simulator | TYPT; LOCOV | FIX_tot | STWH | 54 | RDSB |
| Costa, Bonetti, Vignali, Bichicchi, Lantieri, & Simone, 2019 [60] | ADSG | on-road | TYPT; ROAD; LOCOV | FIX_num; FIX_adur; OTHR | SPE_stat | 15 | HMGL |
| Crundall, Van Loon, & Underwood, 2006 [40] | ADSG | video clips | LOCOV; TYPT; HZRD | FIX_num; TTFF; FIX_tot; FIX_adur | OTHR; TSK_perf | 32 | HMGL |
| Crundall, Shenton, & Underwood, 2004 [61] | OTTE | driving simulator | TYPT; TIME; TRCON | FIX_adur; VAR_hor; VAR_vert; FIX_%t | SPE_stat; INC | 15 | HMGL |
| Desmet & Diependaele, 2019 [62] | PHCNV_hf | on-road | ROAD | FIX_num; FIX_adur; SACC; VAR_hor; VAR_vert | SPE_stat; LATP; HWTC | 26 | HMGL |
| Dingus, Hulse, Antin, & Wierwille, 1989 [63] | NAV_iv; IVPAR; RADMS; OTTE | on-road | TYPT; ROAD; TRCON; DREXP; AGE; GEND | GL_num; GL_adur; GL_tot | LATP; STWH; SPE_ch; TSK_t; TSK_perf | 32 | RDSB |
| Dingus, Hulse, Mollenhauer, Fleischman, Mcgehee, & Manakkal, 1997 [64] | NAV_iv | on-road | MODT; AGE; ROAD; TRCON; DREXP | GL_%t; GL_adur; GL_over | LATP; SPE_ch; TSK_perf; TSK_t; LATP; INC; STWH; WRKL_s | 30 | RDSB |
| Divekar, Pradhan, Pollatsek, & Fisher, 2012 [65] | ADSG | driving simulator | DREXP; HZRD; TYPT | GL_adur; GL_over; GL_num | LATP; SPE_ch | 48 | HMGL |
| Dong, Ma, Zhang, Zhang, & Wang, 2019 [66] | NAV_ptb; PHOTH | on-road | MODT; LOCIV | FIX_num; FIX_adur; GL_patt; BL_rate; BL_dur | SPE_ch; HWTC; LATP | 20 | HMGL |
| Donmez, Boyle, & Lee, 2007 [67] | IVIS | driving simulator | AGE; HZRD; TYPT | GL_num; GL_adur; GL_max | RET; HWTC; SPE_ch; STWH; SPE_stat; WRKL_s; PERF_s | 29 | RDSB |
| Dukic, Hanson, Holmqvist, & Wartenberg, 2005 [68] | OTIV | TYPT; LOCIV | GL_tot; GL_num | STWH; OTHR | 8 | HMGL | |
| Dukic, Ahlstrom, Patten, Kettwich, & Kircher, 2013 [39] | ADSG | on-road | TIME; TYPT; LOCOV; OTHR | OTHR; FIX_num; FIX_max; FIX_adur | SPE_stat; LATP; HWTC | 41 | HMGL |
| Ebadi, Fisher, & Roberts, 2019 [69] | PHCNV_hf | driving simulator | HZRD; ROAD; TYPT | GL_num; OTHR | none | 24 | HMGL |
| Edquist, Horberry, Hosking, & Johnston, 2011 [38] | ADSG | driving simulator | TYPT; AGE; DREXP | FIX_%t | TSK_t; TSK_perf; WRKL | 48 | RDSB |
| Engström, Johansson, & Östlund, 2005 [28] | IVIS; OTCOG; OTVIS | both | TYPT; TSKD; ROAD | GZ_andev | TSK_perf; SPE_stat; LATP; STWH; SKC; HRT; PERF_s | 48 in simulator, 24 on road | RDSB |
| Gable, Walker, Moses, & Chitloor, 2013 [70] | PMP | driving simulator | TYPT; OTPAR; DREXP | FIX_tot; GL_patt | LATP; TSK_t; TSK_perf; WRKL_s; PERF_s; OTHR | 26 | HMGL |
| Garay-Vega, Pradhan, Weinberg, Schmidt-Nielsen, Harsham, Shen, Divekar, Romoser, Knodler, & Fisher, 2010 [71] | RADMS | driving simulator | MODT; TYPT | GL_tot; GL_num; GL_over; OTHR | TSK_t; TSK_perf; LATP; WRKL_s | 17 | RDSB |
| Garrison & Williams, 2013 [72] | PHCNV_hf | driving simulator | TYPT | GZ_num; GZ_adur | SPE_stat; SPE_ch; LATP; STWH; TSK_perf | 20 | RDSB |
| Harbluk, Noy, Trbovich, & Eizenman, 2007 [34] | OTCOG | on-road | TSKD | GL_num; GL_%t | WRKL; SPE_ch; OTHR | 21 | HMGL |
| Hallihan, Mayer, Caird, & Milloy, 2011 [73] | IVIS | driving simulator | OTHR; MODT | GL_num; GL_adur; GL_%t; GL_over | SPE_ch; OTHR | 14 | HMGL |
| Hashash, Abou Zeid, & Moacdieh, 2019 [74] | PHOTH; TXT | driving simulator | HZRD; TYPT | FIX_num; FIX_adur; FIX%t; GL_patt | SPE_stat; LATP; RET; WRKL_s; PERF_s | 26 | RDSB |
| He, Becic, Lee, & McCarley, 2011 [75] | OTCOG | driving simulator | OTPAR; TRCON | VAR_hor; VAR_vert | OTHR; LATP; SPE_stat; HWTC | 18 | RDSB |
| Herbert, Thyer, Isherwood, & Merat, 2016 [76] | OTCOG | driving simulator | TYPT; TSKD | GZ_andev; FIX_% | SPE_stat; HWTC; LATP; STWH; TSK_perf | 36 | RDSB |
| Horrey, Lesch, Garabet, Simmons, & Maikala, 2017 [77] | OTCOG | driving simulator | TYPT; HZRD | PUP_size | HWTC; LATP; SPE_stat; RET; TSK_perf; HRT; OTHR | 31 | HMGL |
| Horrey, Wickens, & Consalus, 2006 [35] | PHCNV_hf; PHDIA_hf | driving simulator | TSKD; TRCON | FIX_%t | LATP; RET | 8 | RDSB |
| Hudák & Madleňák, 2017 [78] | ADSG | on-road | LOCOV; TYPT | GL_adur; GL_%t; OTHR | OTHR | 3 | HMGL |
| Jeong., Kim, Yu, Suh, Kim, & Suh, 2013 [79] | NAV_ptb | driving simulator | MODT; LOCIV | GL_patt | SKC; OTHR | 15 | RDSB |
| Jeong & Liu, 2019 [80] | OTCOG; OTVIS | driving simulator | ROAD; TYPT; TSKD | GL_num; GL_%t; VAR_hor; VAR_vert; GL_patt | LATP; STWH; WRKL_s; TSK_perf | 24 | RDSB |
| Jin, Xian, Jiang, Niu, Xu, & Yang, 2014 [81] | RADMS; PHCNV_hf; OTIV | driving simulator | TYPT | FIX_%t; FIX_num; FIX_max; PUP_size; GZ_andev; SACC; BL_rate; BL_dur | none | 18 | RDSB |
| Jin, Xian, Niu, & Bie, 2015 [82] | RADMS; PHCNV_hf; PHOTH; OTIV | driving simulator | TYPT | FIX_%t; FIX_num; FIX_max; PUP_size; GZ_andev; SACC; BL_rate; BL_dur | none | 40 | RDSB |
| Jones, Chapman, & Bailey, 2014 [83] | OTCOG | video clips | TYPT; HZRD | FIX_adur; VAR_hor; VAR_vert | OTHR; TSK_perf; SKC; HRT | 36 | RDSB |
| Kaber, Pankok, Corbett, Ma, Hummer, & Rasdorf, 2015 [84] | NAV_iv; ADSG | driving simulator | TYPT; ROAD; OTHR | GL_max; FIX_num | TSK_perf; LATP; SPE_stat | 20 | RDSB |
| Kaber, Liang, Zhang, Rogers, & Gangakhedkar, 2012 [85] | OTCOG | driving simulator | TYPT; TSKD | GL_num; GL_adur | STWH; HWTC; RET; TSK_t; WRKL_s | 20 | HMGL |
| Kettwich, Klinger, & Lemmer, 2008 [86] | ADSG | on-road | OTHR; TYPT | FIX_adur; FIX_tot; FIX_num; OTHR | none | 16 | RDSB |
| Kim & Yang, 2018 [87] | OTVIS; OTCOG; NAV_ptb; NAV_iv; PHCNV_hf | driving simulator | TYPT; MODT | GL_%t; GL_patt; SACC | STWH; HRT; LATP | 11 | RDSB |
| Knapper, Hagenzieker, & Brookhuis, 2015 [88] | PHTXT; PHCNV_h; NAV | driving simulator | TYPT | GL_%t; GL_num; GL_adur; GL_max | SPE_stat; LATP; WRKL_s; TSK_perf | 20 | RDSB |
| Kosaka, Koyama, & Nishitani, 2005 [89] | OTCOG | driving simulator | ROAD; TYPT | GL_num | INC; HRT | 19 | HMGL |
| Kountouriotis, Spyridakos, Carsten, & Merat, 2016 [90] | OTVIS; OTCOG | driving simulator | ROAD; TYPT | VAR_hor | TSK_perf; SPE_stat; STWH; LATP | 12 | RDSB |
| Krause, Angerer, & Bengler, 2015 [91] | RADMS; PMP; PHOTH | driving simulator | TYPT; MODT | GL_tot; GL_adur; GL_num | LATP; HWTC; TSK_t | 24 | HMGL |
| Kujala, Silvennoinen, & Lasch, 2013 [92] | NAV_iv | driving simulator | TSKD; MODT | GL_max; GL_over; GL_tot; GL_num; GL_adur | SPE_stat; SPE_ch; INC; LATP; STWH; WRKL_s | 16 | HMGL |
| Kun, Palinko, Medenica, & Heeman, 2013 [93] | OTCOG | driving simulator | TSKD; MODT; ROAD | PUP_size | none | 8 | RDSB |
| Lamble, Kauranen, Laakso, & Summala, 1999 [33] | PHDIA_h; OTCOG | on-road | OTPAR; TYPT | GL_adur | HWTC; RET; LATP; TSK_perf | 19 | RDSB |
| Lee, Roberts, Hoffman, & Angell, 2012 [94] | PMP | driving simulator | MODT; TSKD; ROAD | GL_num; GL_adur | LATP; SPE_stat; TSK_perf; TSK_t | 50 | RDSB |
| Lee, Yoon, & Shin, 2015 [95] | IVIS | driving simulator | MODT | FIX_tot; FIX_adur; FIX_num | SPE_ch; TSK_t; LATP | 15 | no information |
| Lee, Black, Lacherez, & Wood, 2016 [96] | OTCOG; OTVIS | video clips | AGE; TYPT | FIX_num; FIX_adur; SACC; VAR_hor; VAR_vert; TTFF; FIX_tot | RET; TSK_perf | 40 | RDSB |
| Lehtonen, Lappi, & Summala, 2012 [97] | OTCOG | on-road | ROAD; TYPT | VAR_hor; GL_patt | SPE_stat; TSK_perf | 10 | RDSB |
| Lehtonen, Lappi, Koskiahde, Mansikka, Hietamäki, & Summala, 2018 [98] | OTVIS; OTIV; OTTE | on-road | LOCOV; LOCIV; TYPT | FIX_num; FIX_adur | STWH; SPE_stat | 14 | RDSB |
| Lemercier, Pêcher, Berthié, Valéry, Vidal, Paubel, Cour, Fort, Galéra, Gabaude, Lagarde, & Maury, 2014 [99] | OTCOG | driving simulator | TYPT; OTHR | PUP_size; VAR_hor | SPE_stat; LATP; WRKL_s; TSK_perf | 20 | RDSB |
| Li, Zhu, Zhang, Wang, He, & Qu, 2018 [100] | NAV_ptb; PHOTH | driving simulator | MODT | GL_patt; VAR_hor; VAR_vert; GL_num; GL_adur | STWH; SPE_ch | 14 | RDSB |
| Li, Markkula, Li, & Merat, 2018 [101] | OTCOG | driving simulator | TSKD; ROAD | VAR_hor | LATP; STWH; SKC | 27 | HMGL |
| Li, Vaezipour, Rakotonirainy, & Demmel, 2019 [102] | IVIS | driving simulator | TRCON; ROAD; MODT | SACC; GL_tot; GL_adur; GL_num | none | 36 | RDSB |
| Li, Merat, Zheng, Markkula, Li, & Wang, 2018 [103] | OTCOG | driving simulator | TSKD | VAR_hor | LATP; STWH; TSK_perf | 32 | HMGL |
| Liang & Lee, 2010 [104] | OTCOG; OTVIS | driving simulator | TYPT | GL_adur; GL_num; BL_rate; VAR_hor; VAR_vert; SACC | STWH; LATP; RET; HWTC | 16 | RDSB |
| Libby, Chaparro, & He, 2013 [105] | PHCNV_h; PHTXT | driving simulator | TYPT | FIX_num; TTFF; OTHR | SPE_stat | 20 | no information |
| Ma, Xu, & Du, 2016 [106] | IVIS | driving simulator | MODT | FIX_tot; FIX_num; GL_patt | TSK_perf; INC; RET; TSK_t | 15 | HMGL |
| Mackun & Zukowska, 2018 [107] | ADSG | on-road | ROAD; AGE; TIME | FIX_tot; GL_patt | none | 58 | HMGL |
| Madleňák & Hudák, 2016 [108] | ADSG | on-road | LOCOV; TYPT | GL_num; FIX_adur; FIX_tot; FIX_over | none | 3 | HMGL |
| McGough & Ma, 2015 [109] | NAV_ptb; PHCNV_h | driving simulator | LOCIV; TYPT | FIX_%t; PUP_size | LATP; SPE_ch | 20 | HMGL |
| Metz, Schömig, & Krüger, 2011 [110] | NAV_iv; OTCOG | driving simulator | HZRD; TYPT | GZ_andev; FIX_adur; GL_%t | TSK_perf; INC | 40 | RDSB |
| Nabatilan, Aghazadeh, Nimbarte, Harvey, & Chowdhury, 2012 [111] | PHCNV_h; PHDIA_h | driving simulator | TRCON; DREXP; TYPT | FIX_% | INC; WRKL_s | 38 | HMGL |
| Najar & Sanjram, 2018 [112] | OTCOG | on-road | LOCOV; TSKD | FIX_adur; FIX_num; GL_num | LATP; SPE_stat; INC | 30 | HMGL |
| Niezgoda, Tarnowski, Kruszewski, & Kamiński, 2015 [113] | OTCOG | driving simulator | TYPT | BL_rate; PUP_size; FIX_adur; VAR_hor; VAR_vert | WRKL_s; TSK_perf; SPE_stat; STWH | 46 | HMGL |
| Oh, Ko, & Ji, 2016 [114] | NAV_iv; IVPAR | driving simulator | AGE; TSKD; MODT | GL_adur | RET; TSK_perf | 25 | HMGL |
| Ouimet, Pradhan, Simons-Morton, Divekar, Mehranian, & Fisher, 2013 [115] | PASS | driving simulator | OTPAR; OTHR; TYPT | VAR_hor; GL_num | INC; HWTC; OTHR | 36 | HMGL |
| Peng & Boyle, 2015 [116] | IVIS | driving simulator | TRCON; OTPAR; TSKD; TYPT | GL_max; GL_%t; GL_over | none | 28 | RDSB |
| Perez, 2012 [117] | IVIS; RADMS | on-road | TYPT | GL_num; GL_adur; GL_tot; GL_patt; GL_%; GL_%t | RET; TSK_perf | 17 | RDSB |
| Perlman, Samost, Domel, Mehler, Dobres, & Reimer, 2019 [118] | OTCOG; PHDIA_h | driving simulator | MODT | GL_num; GL_adur; GL_over; GL_tot; GL_%t; GL_max | TSK_perf; TSK_t; HRT; SKC; WRKL_s; RET; LATP; SPE_stat; STWH | 36 | RDSB |
| Pradhan, Li, Bingham, Simons-Morton, Ouimet, & Shope, 2014 [119] | PASS | driving simulator | OTHR; OTPAR | GL_tot; VAR_hor; VAR_vert | none | 58 | RDSB |
| Qin, Cui, Wang, Jia, & Hui, 2018 [120] | ADSG | driving simulator | TYPT | GL_tot; FIX_num; FIX_adur | RET; LATP | only the abstract was found | no information |
| Rahimi, Briggs, & Thom, 1990 [121] | ADSG; OTTE | on-road | TYPT; TRCON | GL_num | OTHR | 1 | HMGL |
| Recarte & Nunes, 2003 [30] | OTCOG | on-road | TYPT; MODT | PUP_size; VAR_hor; VAR_vert; GL_%; GZ_andev | WRKL_s; TSK_perf; RET | 12 | HMGL |
| Recarte & Nunes, 2000 [31] | OTCOG; OTVIS | on-road | ROAD; TYPT; TRCON | PUP_size; FIX_adur; GL_patt; VAR_hor; SACC; GL_num | SPE_stat | 12 | RDSB |
| Reimer, Mehler, & Donmez, 2014 [122] | PHDIA_h | driving simulator | MODT; GEND; OTPAR | GL_tot; GL_%t; GL_over | TSK_t; LATP; TSK_perf; SPE_stat; WRKL_s | 36 | RDSB |
| Reimer, Mehler, Wang, & Coughlin, 2012 [123] | OTCOG | on-road | AGE; TYPT | GL_patt; VAR_hor; VAR_vert | TSK_perf; RET; SPE_stat; STWH; SPE_ch | 108 | RDSB |
| Reimer, 2009 [124] | OTCOG | on-road | TSKD | GL_patt; VAR_hor; VAR_vert | LATP; SPE_stat; TSK_perf | 21 | RDSB |
| Reyes & Lee, 2008 [125] | IVIS; OTCOG | driving simulator | TSKD; HZRD | FIX_adur; GL_patt; SACC; GZ_andev | RET; TSK_perf; OTHR | 12 | RDSB |
| Sall, Wright, & Boot, 2014 [126] | OTTE | video clips | HZRD; TYPT | TTFF; SACC; OTHR | none | 15 | RDSB |
| Savage, Potter, & Tatler, 2013 [127] | OTCOG | video clips | TYPT | FIX_adur; SACC; VAR_hor; VAR_vert; BL_rate; BL_dur | RET; OTHR | 17 | RDSB |
| Schömig & Metz, 2013 [128] | OTCOG; OTVIS | driving simulator | HZRD; ROAD; OTPAR | GL_adur; GL_patt; GL_%; GL_tot | TSK_perf; TSK_t; OTHR | 15 | RDSB |
| Schömig, Metz, & Krüger, 2011 [129] | OTVIS | driving simulator | TYPT; HZRD | FIX_%t; VAR_hor; VAR_vert | TSK_perf; TSK_t; SPE_stat; LATP; OTHR; INC | 24 | RDSB |
| Smiley, Persaud, Bahar, Mollett, Lyon, Smahel, & Kelman, 2005 [130] | ADSG | on-road | LOCOV; TYPT | OTHR; GL_adur; GL_patt | HWTC | 16 | HMGL |
| Smiley, Smahel, & Eizenman, 2004 [131] | ADSG | on-road | ROAD; TYPT; HZRD | GL_num; GL_patt; GL_adur; GZ_andev; OTHR | HWTC | 16 | HMGL |
| Sodhi, Reimer, Cohen, Vastenburg, Kaars & Kirschenbaum, 2002 [22] | RADMS; OTTE; IVPAR; PHDIA_h; PHDIA_hf | on-road | TYPT | VAR_hor; VAR_vert; GL_adur | none | 24 | HMGL |
| Sodhi, Reimer & Llamazares, 2002 [23] | RADMS; OTTE; IVPAR; PHDIA_h; PHDIA_hf | on-road | TYPT | GL_patt; GL_tot; GL_max; GL_num; GL_adur; SACC | TSK_t | 5 | HMGL |
| Strayer, Drews & Johnston, 2003 [27] | PHCNV_h | driving simulator | LOCOV; TYPT | FIX_tot; OTHR | TSK_perf; OTHR | 20 | RDSB |
| Strayer, Cooper & Drews, 2004 [132] | PHCNV_hf; PHDIA_hf | driving simulator | LOCOV; HZRD; TYPT | OTHR; FIX_tot; GL_patt | TSK_perf; OTHR | 32 | RDSB |
| Tangmanee & Teeravarunyou, 2012 [133] | NAV_iv | driving simulator | MODT; GEND; DREXP | FIX_adur; FIX_tot; FIX_num | RET | 5 | HMGL |
| Tijerina, Parmer & Goodman, 1999 [134] | RADMS; NAV_ptb; NAV_iv; PHDIA_h | on-road | MODT; TYPT | GL_adur; GL_num | TSK_t; LATP | 16 | RDSB |
| Tivesten, & Dozza, 2014 [135] | PHDIA_h; PHTXT | on-road | TRCON; TYPT; ROAD | GL_%t; GL_max; GL_over; GL_num; GL_tot | SPE_stat | 198 overall | RDSB |
| Topolšek, Areh, & Cvahte, 2016 [136] | ADSG; OTTE | on-road | AGE; LOCOV | GL_patt | OTHR | 17 | HMGL |
| Victor, Harbluk, & Engström, 2005 [32] | OTVIS; OTCOG | both on-road and driving simulator | TSKD; ROAD | GL_adur; OTHR; GL_over; GL_num; GL_tot; GL_patt; VAR_hor; VAR_vert | none | 24 on-road, 95 simulator | RDSB |
| Wang, Bao, Du, Ye, & Sayer, 2017 [137] | PHCNV_h; PHTXT | on-road | TIME; TYPT | SACC; GL_num; GL_adur | none | 19 | RDSB; HMGL |
| Wang, Mehler, Reimer, Lammers, D’Ambrosio, & Coughlin, 2010 [138] | IVIS; NAV_iv | both on-road and driving simulator | ROAD; MODT | GL_%t; GL_num; GL_tot; GL_over | LATP; RET; TSK_t; SPE_stat | 58 | RDSB |
| White & Caird, 2010 [139] | PASS | driving simulator | GEND; HZRD; TYPT | FIX_num | TSK_perf; INC; SPE_stat; OTHR | 40 | HMGL |
| Wikman, Nieminen, & Summala, 1998 [36] | RADMS; OTMAN; PHDIA_h | on-road | DREXP; GEND; TYPT; ROAD | GL_patt; GL_adur; GL_over; GL_num | LATP; TSK_t | 47 | RDSB |
| Wong & Huang, 2013 [140] | OTTE | on-road | ROAD; TRCON; TYPT | GL_patt; GL_adur; GL_tot; OTHR | none | no data, used the 100-car naturalistic glance data | no information |
| Wood, Hartley, Furley, & Wilson, 2016 [141] | OTCOG | video clips | OTPAR; TYPT | TTFF; FIX_adur; PUP_size | OTHR; TSK_perf | 24 | HMGL |
| Wright, Vitale, Boot & Charness, 2015 [142] | OTTE | video clips | TIME; TSKD; AGE | SACC; TTFF; OTHR | none | 34 | RDSB |
| Wu, Zhu, Lu, & Zhu, 2016 [143] | OTCOG; PHCNV_h | driving simulator | TYPT | GL_patt; VAR_hor; VAR_vert; FIX_tot | WRKL_s; RET | 25 | HMGL |
| Xian & Jin, 2015 [144] | IVIS | driving simulator | TRCON; TSKD | FIX_%t; FIX_num; FIX_max; FIX_adur; GZ_andev; PUP_size; SACC | STWH; SPE_stat; LATP; TSK_t | 18 | RDSB |
| Yamani, Horrey, Liang, & Fisher, 2015 [145] | IVPAR; OTMAN; RADMS | driving simulator | OTPAR; TYPT; TSKD | GL_adur; GL_patt | none | 40 | HMGL |
| Yang, McDonald, & Zheng, 2012 [146] | OTVIS | on-road | TSKD | GL_%t; BL_rate; SACC | RET; TSK_perf; SPE_stat; LATP; STWH; WRKL_s | 34 | RDSB |
| Yang, Reimer, Mehler, Wong, & McDonald, 2012 [147] | OTVIS; OTCOG | on-road | TYPT; TSKD | GZ_andev | WRKL_s; SPE_stat; LATP; HWTC | 34 | RDSB |
| Yang, Wong, & McDonald, 2015 [148] | OTCOG | on-road | TSKD; GEND | GZ_andev; BL_rate; GL_%t | SPE_stat; HWTC; LATP; TSK_perf | 34 | RDSB |
| Yoshizawa, & Iwasaki, 2017 [149] | OTTE | video clips | HZRD; TYPT | SACC | RET | 4 | RDSB |
| Young, Lenné, Salmon, & Stanton, 2018 [150] | PHTXT | driving simulator | HZRD; TYPT | GL_%t; GL_adur; GL_num | RET; LATP; SPE_stat; TSK_perf | 28 | RDSB |
| Young, Mahfoud, Stanton, Salmon, Jenkins, & Walker, 2009 [151] | ADSG | driving simulator | ROAD; TYPT | FIX_num; GL_adur | LATP; HWTC; WRKL_s; TSK_perf | 48 | HMGL |
| Young, Mitsopoulos-Rubens, Rudin-Brown, & Lenné, 2012 [152] | PMP | driving simulator | TSKD; HZRD | GL_%t; GL_num; GL_adur; GL_over | SPE_stat; LATP; HWTC; TSK_t; OTHR | 20 | RDSB |
| Zahabi, & Kaber, 2018 [153] | IVIS | driving simulator | TYPT; MODT; HZRD | GL_num; GL_max | LATP; SPE_stat; RET; TSK_perf; WRKL_s; OTHR | 20 | RDSB |
| Zahabi, Machado, Lau, Deng, Pankok, Hummer, Rasdorf, & Kaber, 2017 [154] | ADSG | driving simulator | AGE; TYPT; OTHR | FIX_num; GL_max | TSK_perf; SPE_stat; LATP; SPE_ch | 60 | RDSB |
| Zahabi, Pankok, Kaber, Machado, Lau, Hummer, & Rasdorf, 2017 [155] | ADSG | driving simulator | AGE; ROAD; TYPT; OTHR | GL_max | TSK_perf | 120 | RDSB |
| Zahabi, Machado, Pankok, Lau, Liao, Hummer, Rasdorf, & Kaber, 2017 [156] | ADSG | driving simulator | TYPT; AGE; OTHR | FIX_num; GL_max | TSK_perf; SPE_stat; LATP | 60 | RDSB |
| Zhang, Reimer, Mehler, Dobres, Pala, Angell, & Ifushi, 2013 [157] | NAV_ptb; PHOTH | driving simulator | TYPT | GL_tot; GL_num; GL_over | SPE_stat; TSK_t; WRKL_s | 24 | RDSB |
| Zhang, & Kontou, 2014 [158] | OTTE | on-road | TIME; ROAD; TRCON; TYPT | GL_patt | SPE_stat | 35 | RDSB |
| Zhang, Harris, Rogers, Kaber, Hummer, Rasdorf, & Hu, 2013 [159] | ADSG | driving simulator | TYPT; OTHR | GL_max; GL_% | TSK_perf; TSK_t; SPE_stat; LATP; INC; RET | 24 | HMGL |
| Zhang, Kaber, Rogers, Liang, & Gangakhedkar, 2014 [160] | OTVIS; OTCOG; OTMAN | driving simulator | TYPT; OTHR | GL_adur; GL_% | TSK_perf; STWH; SPE_stat; TSK_t | 20 | HMGL |
| Zhang, Smith, & Witt, 2006 [161] | OTVIS; OTCOG | driving simulator | ROAD; TSKD; LOCIV; TYPT | GL_num; GL_adur; GL_tot; GL_%t; GZ_andev; OTHR | RET; WRKL_s; TSK_perf; LATP; STWH | 14 | RDSB |
| Zhang, Zhang, Liu, & Guo, 2017 [162] | ADSG | on-road | TIME; TYPT | GL_patt; PUP_size; BL_rate | LATP | no information | no information |
| Zhou & Itoh, 2015 [163] | OTCOG; IVIS | driving simulator | MODT; TYPT | GL_num | HWTC | 18 | RDSB |
| Zhou, Itoh, & Inagaki, 2008 [164] | OTCOG | driving simulator | TYPT | GL_num; GL_patt | STWH; SPE_stat; SPE_ch; WRKL_s | 8 | RDSB |
| Zhou, Itoh, & Inagaki, 2009 [165] | OTCOG | driving simulator | TYPT | FIX_num | HWTC; WRKL_s; LATP | 17 | RDSB |
References
- Global Status Report on Road Safety 2018. Geneva: World Health Organization; 2018. [Google Scholar]
- Singh S. Critical Reasons for Crashes Investigated in the National Motor Vehicle Crash Causation Survey. Traffic Safety Facts Crash. Stats. 2015. [Google Scholar]
- Dingus T. A., Guo F., Lee S., Antin J. F., Perez M., Buchanan-King M., Hankey J.. Driver crash risk factors and prevalence evaluation using naturalistic driving data. Proceedings of the National Academy of Sciences of the United States of America. 2016; 113(10): 2636-2641. 10.1073/pnas.1513271113. [DOI] [PMC free article] [PubMed] [Google Scholar]
- Rupp M. A. Looking Back: Examining the Trends of Driver Distraction from 2007-2011. Proceedings of the Human Factors and Ergonomics Society Annual Meeting. 2012; 56(1):2181-2185. 10.1177/1071181312561460. [DOI] [Google Scholar]
- Lee J. D., Young K. L., Regan M. A.. Defining Driver Distraction. In Regan M. A., Lee J. D. & Young K. (eds.). Driver Distraction: Theory, Effects, and Mitigation, 31-40. Boca Raton: CRC Press; 2008. [Google Scholar]
- Green P. Where Do Drivers Look While Driving (and for How Long)? In Olson P. L., & Dewar R. E. (Eds.). Human Factors in Traffic Safety (pp. 77-110). Tucson, USA: Lawyers & Judges Publishing Company; 2002. [Google Scholar]
- Rockwell T. H. Eye Movement Analysis of Visual Information Acquisition in Driving: An Overview. In 6th Australian Road Research Board (ARRB) Conference. 6, 316-331. Canberra: Australian Road Research Board (ARRB); 1972. [Google Scholar]
- Sivak M. The information that drivers use: is it indeed 90% visual? Perception. 1996; 25:1081-1089. 10.1068/p251081 [DOI] [PubMed] [Google Scholar]
- Crundall D., Underwood G.. Visual attention while driving: measures of eye movements used in driving research. In Handbook of traffic psychology (pp. 137-148). Academic Press; 2011. 10.1016/B978-0-12-381984-0.10011-6 [DOI] [Google Scholar]
- Fort A., Martin R., Jacquet-Andrieu A., Combe-Pangaud C., Foliot G., Daligault S., Delpuech C.. Attentional demand and processing of relevant visual information during simulated driving: A MEG study. Brain research. 2010; 1363:117-127. 10.1016/j.brainres.2010.09.094 [DOI] [PubMed] [Google Scholar]
- Graydon F. X., Young R., Benton M. D., Genik R. J., Posse S., Hsieh L., Green C.. Visual event detection during simulated driving: Identifying the neural correlates with functional neuroimaging. Transportation Research Part F: Traffic Psychology and Behaviour, 2004; 7:271-286. 10.1016/j.trf.2004.09.006 [DOI] [Google Scholar]
- Staffeld P. R. Accidents Related to Access Points and Advertising Signs in Study. Traffic Quarterly. 1953; 7:59-74. [Google Scholar]
- Rusch W. A. Highway accidents in relation to roadside business and advertising. Highway Research Board Bulletin. 1951; 30:46-50. [Google Scholar]
- McMonagle C. J. The Effect of Roadside Features on Traffic Accidents. Traffic Quarterly. 1952; 6:237. [Google Scholar]
- Lauer A. R., McMonagle C. J.. Do Road Signs Affect Accidents. Traffic Quarterly. 1955; 6:322 - 324. [Google Scholar]
- King B. G., Sutro P. J.. Dynamic Visual Fields. Highway Research Board Bulletin. 1957; 152:3-14. [Google Scholar]
- Mourant R. R., Rockwell T. H.. Mapping Eye-Movement Patterns to the Visual Scene in Driving: An Exploratory Study. Human Factors: The Journal of the Human Factors and Ergonomics Society. 1970; 12(1):81-87. 10.1177/001872087001200112 [DOI] [PubMed] [Google Scholar]
- Mourant R. R., Rockwell T. H.. Strategies of Visual Search by Novice and Experienced Drivers. Human Factors: The Journal of the Human Factors and Ergonomics Society. 1972; 14(4):325-335. 10.1177/001872087201400405. [DOI] [PubMed] [Google Scholar]
- Rockwell T. H., Overby C., Mourant R. R.. Drivers’ eye movements: an apparatus and calibration. Highway Research Record. 1968; 247:29–41. [Google Scholar]
- Graf C., Krebs M.. Headlight factors and nighttime vision (Final Report No. 76SRC13). Minneapolis, MN: Honeywell Inc., Systems and Research Center; 1976. [Google Scholar]
- Crundall D. E., Underwood G.. Effects of experience and processing demands on visual information acquisition in drivers. Ergonomics. 1998; 41(4):448-458. 10.1080/001401398186937 [DOI] [Google Scholar]
- Sodhi M., Reimer B., Cohen J. L., Vastenburg E., Kaars R., Kirschenbaum S.. On-road driver eye movement tracking using head-mounted devices. In Eye Tracking Research and Applications Symposium (ETRA). New Orleans, Louisiana. 2002; 61-68. 10.1145/507072.507086 [DOI] [Google Scholar]
- Sodhi M., Reimer B., Llamazares I.. Glance analysis of driver eye movements to evaluate distraction. Behavior Research Methods, Instruments, & Computers. 2002; 34(4): 529-538. 10.3758/bf03195482 [DOI] [PubMed] [Google Scholar]
- Mongeon P., Paul-Hus A.. The journal coverage of Web of Science and Scopus: a comparative analysis. Scientometrics. 2016; 106(1):213-228. 10.1007/s11192-015-1765-5 [DOI] [Google Scholar]
- van Eck N. J., Waltman L.. Visualizing Bibliometric Networks. In Ding Y., Rousseau R., & Wolfram D.(Eds.). Measuring Scholarly Impact (pp. 285-320). Cham: Springer; 2014. 10.1007/978-3-319-10377-8_13 [DOI] [Google Scholar]
- Cobo J. M., Lopez-Herrera G. A., Herrera-Viedma E., Herrera F.. Science mapping software tools: Review, analysis, and cooperative study among tools. Journal of the American Society for Information Science and Technology. 2011; 62(7): 1382-1402. 10.1002/asi.21525 [DOI] [Google Scholar]
- Strayer D. L., Drews F. A., Johnston W. A.. Cell phone-induced failures of visual attention during simulated driving. Journal of Experimental Psychology: Applied. 2003; 9(1): 23-32. 10.1037/1076-898x.9.1.23 [DOI] [PubMed] [Google Scholar]
- Engström J., Johansson E., Östlund J.. Effects of visual and cognitive load in real and simulated motorway driving. Transportation Research Part F: Traffic Psychology and Behaviour. 2005; 8(2): 97-120. 10.1016/j.trf.2005.04.012 [DOI] [Google Scholar]
- Brookhuis K. A., de Vries G., de Waard D.. The effects of mobile telephoning on driving performance. Accident Analysis & Prevention. 1991; 23(4):309-316. 10.1016/0001-4575(91)90008-s [DOI] [PubMed] [Google Scholar]
- Recarte M. A., Nunes L. M.. Mental workload while driving: Effects on visual search, discrimination, and decision making. Journal of Experimental Psychology: Applied. 2003; 9(2):119-137. 10.1037/1076-898x.9.2.119 [DOI] [PubMed] [Google Scholar]
- Recarte M. A., Nunes L. M.. Effects of verbal and spatial-imagery tasks on eye fixations while driving. Journal of Experimental Psychology: Applied. 2000; 6(1):31-43. 10.1037/1076-898x.6.1.31 [DOI] [PubMed] [Google Scholar]
- Victor T. W., Harbluk J. L., Engström J. A.. Sensitivity of eye-movement measures to in-vehicle task difficulty. Transportation Research Part F: Traffic Psychology and Behaviour. 2005; 8(2):167–190. 10.1016/j.trf.2005.04.014 [DOI] [Google Scholar]
- Lamble D., Kauranen T., Laakso M., Summala H.. Cognitive load and detection thresholds in car following situations: Safety implications for using mobile (cellular) telephones while driving. Accident Analysis and Prevention. 1999; 31(6):617–623. 10.1016/S0001-4575(99)00018-4 [DOI] [PubMed] [Google Scholar]
- Harbluk J. L., Noy Y. I., Trbovich P. L., Eizenman M.. An on-road assessment of cognitive distraction: Impacts on drivers’ visual behavior and braking performance. Accident Analysis and Prevention. 2007; 39(2):372–379. 10.1016/j.aap.2006.08.013 [DOI] [PubMed] [Google Scholar]
- Horrey W. J., Wickens C. D., Consalus K. P.. Modeling drivers’ visual attention allocation while interacting with in-vehicle technologies. Journal of Experimental Psychology: Applied. 2006; 12(2):67–78. 10.1037/1076-898X.12.2.67 [DOI] [PubMed] [Google Scholar]
- Wikman A. S., Nieminen T., Summala H.. Driving experience and time-sharing during in-car tasks on roads of different width. Ergonomics. 1998; 41(3):358–372. 10.1080/001401398187080 [DOI] [Google Scholar]
- van Raan A. F. Advances in bibliometric analysis: research performance assessment and science mapping. In Blockmans L., Engwall L., & Weaire D. (Eds.). Bibliometrics: Use and Abuse in the Review of Research Performance (pp. 17-28). London: Portland Press; 2014. [Google Scholar]
- Edquist J., Horberry T., Hosking S., Johnston I.. Effects of advertising billboards during simulated driving. Applied Ergonomics. 2011; 42(4):619–626. 10.1016/j.apergo.2010.08.013 [DOI] [PubMed] [Google Scholar]
- Dukic T., Ahlstrom C., Patten C., Kettwich C., Kircher K.. Effects of Electronic Billboards on Driver Distraction. Traffic Injury Prevention. 2013; 14(5):469–476. 10.1080/15389588.2012.731546 [DOI] [PubMed] [Google Scholar]
- Crundall D., Van Loon E., Underwood G.. Attraction and distraction of attention with roadside advertisements. Accident Analysis and Prevention. 2006; 38(4):671–677. 10.1016/j.aap.2005.12.012 [DOI] [PubMed] [Google Scholar]
- International Organization for Standardization. ISO 15007-1:2014(en) Road vehicles — Measurement of driver visual behaviour with respect to transport information and control systems — Part 1: Definitions and parameters. Geneva: International Organization for Standardization; 2014. [Google Scholar]
- Ahlstrom C., Kircher K.. Changes in glance behaviour when using a visual eco-driving system - A field study. Applied Ergonomics. 2017; 58:414–423. 10.1016/j.apergo.2016.08.001 [DOI] [PubMed] [Google Scholar]
- Antin J. F., Dingus T. A., Hulse M. C., Wierwille W. W.. An evaluation of the effectiveness and efficiency of an automobile moving-map navigational display. International Journal of Man-Machine Studies. 1990; 33(5):581–594. 10.1016/S0020-7373(05)80054-9 [DOI] [Google Scholar]
- Aust M. L., Dombrovskis S., Kovaceva J., Svanberg B., Ivarsson J.. An Empirically Based Suggestion for Reformulating the Glance Duration Criteria in NHTSA’s Visual-Manual Interaction Guidelines. SAE International Journal of Passenger Cars - Electronic and Electrical Systems. 2013; 6(2):444–453. 10.4271/2013-01-0444 [DOI] [Google Scholar]
- Beckers N., Schreiner S., Bertrand P., Mehler B., Reimer B.. Comparing the demands of destination entry using Google Glass and the Samsung Galaxy S4 during simulated driving. Applied Ergonomics. 2017; 58:25–34. 10.1016/j.apergo.2016.05.005 [DOI] [PubMed] [Google Scholar]
- Beijer D., Smiley A., Eizenman M.. Observed driver glance behavior at roadside advertising signs. Transportation Research Record. 2004; 1899(1):96–103. 10.3141/1899-13 [DOI] [Google Scholar]
- Belyusar D., Reimer B., Mehler B., Coughlin J. F.. A field study on the effects of digital billboards on glance behavior during highway driving. Accident Analysis and Prevention. 2016; 88:88–96. 10.1016/j.aap.2015.12.014 [DOI] [PubMed] [Google Scholar]
- Benedetto S., Pedrotti M., Minin L., Baccino T., Re A., Montanari R.. Driver workload and eye blink duration. Transportation Research Part F: Traffic Psychology and Behaviour. 2011; 14(3):199–208. 10.1016/j.trf.2010.12.001 [DOI] [Google Scholar]
- Birrell S. A., Fowkes M.. Glance behaviours when using an in-vehicle smart driving aid: A real-world, on-road driving study. Transportation Research Part F: Traffic Psychology and Behaviour. 2014; 22(1):113–125. 10.1016/j.trf.2013.11.003 [DOI] [Google Scholar]
- Blanco M., Hankey J. M., Chestnut J. A.. A taxonomy for secondary in-vehicle tasks based on eye glance and task completion time. Proceedings of the Human Factors and Ergonomics Society Annual Meeting. 2005; 49(22):1975–1979. 10.1177/154193120504902219 [DOI] [Google Scholar]
- Borowsky A., Horrey W. J., Liang Y., Simmons L., Garabet A., Fisher D. L.. Memory for a hazard is interrupted by performance of a secondary in-vehicle task. Proceedings of the Human Factors and Ergonomics Society Annual Meeting. 2014; 58(1):2219–2223. 10.1177/1541931214581466 [DOI] [Google Scholar]
- Borowsky A., Horrey W. J., Liang Y., Garabet A., Simmons L., Fisher D. L.. The Effects of Momentary Visual Disruption on Hazard Anticipation and Awareness in Driving. Traffic Injury Prevention. 2015; 16(2):133–139. 10.1080/15389588.2014.909593 [DOI] [PubMed] [Google Scholar]
- Borowsky A., Horrey W. J., Liang Y., Garabet A., Simmons L., Fisher D. L.. The effects of brief visual interruption tasks on drivers’ ability to resume their visual search for a pre-cued hazard. Accident Analysis and Prevention. 2016; 93:207–216. 10.1016/j.aap.2016.04.028 [DOI] [PubMed] [Google Scholar]
- Briggs G. F., Hole G. J., Land M. F.. Imagery-inducing distraction leads to cognitive tunnelling and deteriorated driving performance. Transportation Research Part F: Traffic Psychology and Behaviour. 2016; 38:106–117. 10.1016/j.trf.2016.01.007 [DOI] [Google Scholar]
- Chan E., Pradhan A. K., Pollatsek A., Knodler M. A., Fisher D. L.. Are driving simulators effective tools for evaluating novice drivers’ hazard anticipation, speed management, and attention maintenance skills?. Transportation Research Part F: Traffic Psychology and Behaviour. 2010; 13(5):343–353. 10.1016/j.trf.2010.04.001 [DOI] [PMC free article] [PubMed] [Google Scholar]
- Chiang D. P., Brooks A. M., Weir D. H.. On the highway measures of driver glance behavior with an example automobile navigation system. Applied Ergonomics. 2004; 35(3):215–223. 10.1016/j.apergo.2004.01.005 [DOI] [PubMed] [Google Scholar]
- Chisholm S. L., Caird J. K., Lockhart J.. The effects of practice with MP3 players on driving performance. Accident Analysis and Prevention. 2008; 40(2):704–713. 10.1016/j.aap.2007.09.014 [DOI] [PubMed] [Google Scholar]
- Chisholm S. L., Caird J. K., Lockhart J. A., Teteris L. E., Smiley A.. Novice and experienced driving performance with cell phones. Proceedings of the Human Factors and Ergonomics Society. 2006; 50(22):2354–2358. 10.1177/154193120605002201 [DOI] [Google Scholar]
- Colon N. P., Rupp M. A., Mouloua M.. Temporary barriers to reduce the effects of rubbernecking. Proceedings of the Human Factors and Ergonomics Society. 2013; 57(1):1810–1814. 10.1177/1541931213571405 [DOI] [Google Scholar]
- Costa M., Bonetti L., Vignali V., Bichicchi A., Lantieri C., Simone A.. Driver’s visual attention to different categories of roadside advertising signs. Applied Ergonomics. 2019; 78:127–136. 10.1016/j.apergo.2019.03.001 [DOI] [PubMed] [Google Scholar]
- Crundall D., Shenton C., Underwood G.. Eye movements during intentional car following. Perception. 2004; 33(8):975–986. 10.1068/p5105 [DOI] [PubMed] [Google Scholar]
- Desmet C., Diependaele K.. An eye-tracking study on the road examining the effects of handsfree phoning on visual attention. Transportation Research Part F: Traffic Psychology and Behaviour. 2019; 60:549–559. 10.1016/j.trf.2018.11.013 [DOI] [Google Scholar]
- Dingus T. A., Hulse M. C., Antin J. F., Wierwille W. W.. Attentional demand requirements of an automobile moving-map navigation system. Transportation Research Part A: General. 1989; 23(4):301–315. 10.1016/0191-2607(89)90013-7 [DOI] [Google Scholar]
- Dingus T. A., Hulse M. C., Mollenhauer M. A., Fleischman R. N., Mcgehee D. V., Manakkal N.. Effects of age, system experience, and navigation technique on driving with an advanced traveler information system. Human Factors. 1997; 39(2):177–199. 10.1518/001872097778543804 [DOI] [PubMed] [Google Scholar]
- Divekar G., Pradhan A. K., Pollatsek A., Fisher D. L.. Effect of External Distractions. Behavior and Vehicle Control of Novice and Experienced Drivers Evaluated. Transportation Research Record. 2012; 2321(1):15-22. 10.3141/2321-03 [DOI] [Google Scholar]
- Dong C. H., Ma R. G., Zhang D., Zhang W. T., Wang F. F.. Research on the Influence of Smartphone Navigation on Driving Behavior Based on Real Vehicle Driving. Mobile Information Systems. 2019; 10.1155/2019/9527890 [DOI] [Google Scholar]
- Donmez B., Boyle L. N., Lee J. D.. Safety implications of providing real-time feedback to distracted drivers. Accident Analysis and Prevention. 2007; 39(3):581–590. 10.1016/j.aap.2006.10.003 [DOI] [PubMed] [Google Scholar]
- Dukic T., Hanson L., Holmqvist K., Wartenberg C.. Effect of button location on driver’s visual behaviour and safety perception. Ergonomics. 2005; 48(4):399–410. 10.1080/00140130400029092 [DOI] [PubMed] [Google Scholar]
- Ebadi Y., Fisher D. L., Roberts S. C.. Impact of Cognitive Distractions on Drivers’ Hazard Anticipation Behavior in Complex Scenarios. Transportation Research Record. 2019; in press. 10.1177/0361198119846463 [DOI] [Google Scholar]
- Gable T. M., Walker B. N., Moses H. R., Chitloor R. D.. Advanced auditory cues on mobile phones help keep drivers’ eyes on the road. In Proceedings of the 5th International Conference on Automotive User Interfaces and Interactive Vehicular Applications, AutomotiveUI. 2013; 66-73. 10.1145/2516540.2516541 [DOI] [Google Scholar]
- Garay-Vega L., Pradhan A. K., Weinberg G., Schmidt-Nielsen B., Harsham B., Shen Y., Divekar G., Romoser M., Knodler M., Fisher D. L.. Evaluation of different speech and touch interfaces to in-vehicle music retrieval systems. Accident Analysis and Prevention. 2010; 42(3):913–920. 10.1016/j.aap.2009.12.022 [DOI] [PMC free article] [PubMed] [Google Scholar]
- Garrison T. M., Williams C. C.. Impact of Relevance and Distraction on Driving Performance and Visual Attention in a Simulated Driving Environment. Applied Cognitive Psychology. 2013; 27(3):396–405. 10.1002/acp.2917 [DOI] [Google Scholar]
- Hallihan G. M., Mayer A. K., Caird J. K., Milloy S. L.. Effects of hybrid interface on ecodriving and driver distraction. Transportation Research Record. 2011; 2248:74–80. 10.3141/2248-10 [DOI] [Google Scholar]
- Hashash M., Abou Zeid M., Moacdieh N. M.. Social media browsing while driving: Effects on driver performance and attention allocation. Transportation Research Part F: Traffic Psychology and Behaviour. 2019; 63:67–82. 10.1016/j.trf.2019.03.021 [DOI] [Google Scholar]
- He J., Becic E., Lee Y. C., McCarley J. S.. Mind wandering behind the wheel: Performance and oculomotor correlates. Human Factors. 2011; 53(1):13–21. 10.1177/0018720810391530 [DOI] [PubMed] [Google Scholar]
- Herbert N., Thyer N., Isherwood S., Merat N.. The effect of a simulated hearing loss on performance of an auditory memory task in driving. Transportation Research Part F: Traffic Psychology and Behaviour. 2016; 43:122–130. 10.1016/j.trf.2016.10.011 [DOI] [Google Scholar]
- Horrey W. J., Lesch M. F., Garabet A., Simmons L., Maikala R.. Distraction and task engagement: How interesting and boring information impact driving performance and subjective and physiological responses. Applied Ergonomics. 2017; 58:342–348. 10.1016/j.apergo.2016.07.011 [DOI] [PubMed] [Google Scholar]
- Hudák M., Madleňák R.. The Research of Driver Distraction by Visual Smog on Selected Road Stretch in Slovakia. Procedia Engineering. 2017; 178:472–479. 10.1016/j.proeng.2017.01.090 [DOI] [Google Scholar]
- Jeong C., Kim B., Yu S., Suh D., Kim M., Suh M.. In-vehicle display HMI safety evaluation using a driving simulator. International Journal of Automotive Technology. 2013; 14(6):987–992. 10.1007/s12239-013-0108-x [DOI] [Google Scholar]
- Jeong H., Liu Y.. Effects of non-driving-related-task modality and road geometry on eye movements, lane-keeping performance, and workload while driving. Transportation Research Part F: Traffic Psychology and Behaviour. 2019; 60:157–171. 10.1016/j.trf.2018.10.015 [DOI] [Google Scholar]
- Jin L., Xian H., Jiang Y., Niu Q., Xu M., Yang D.. Research on evaluation model for secondary task driving safety based on driver eye movements. Advances in Mechanical Engineering. 2014; 6. 10.1155/2014/624561 [DOI] [Google Scholar]
- Jin L., Xian H., Niu Q., Bie J.. Research on safety evaluation model for in-vehicle secondary task driving. Accident Analysis and Prevention. 2015; 81:243–250. 10.1016/j.aap.2014.08.013 [DOI] [PubMed] [Google Scholar]
- Jones M. P., Chapman P., Bailey K.. The influence of image valence on visual attention and perception of risk in drivers. Accident Analysis and Prevention. 2014; 73:296–304. 10.1016/j.aap.2014.09.019 [DOI] [PubMed] [Google Scholar]
- Kaber D., Pankok C., Corbett B., Ma W., Hummer J., Rasdorf W.. Driver behavior in use of guide and logo signs under distraction and complex roadway conditions. Applied Ergonomics. 2015; 47:99–106. 10.1016/j.apergo.2014.09.005 [DOI] [PubMed] [Google Scholar]
- Kaber D. B., Liang Y., Zhang Y., Rogers M. L., Gangakhedkar S.. Driver performance effects of simultaneous visual and cognitive distraction and adaptation behaviour. Transportation Research Part F: Traffic Psychology and Behaviour. 2012; 15(5):491–501. 10.1016/j.trf.2012.05.004 [DOI] [Google Scholar]
- Kettwich C., Klinger K., Lemmer U.. Do advertisements at the roadside distract the driver?. Proceedings of SPIE - The International Society for Optical Engineering. 2008; 7003. 10.1117/12.780078 [DOI] [Google Scholar]
- Kim S. L., Yang J. H.. Evaluation of the Effects of Driver Distraction Part 1: Based on Simulator Experiments. In Proceedings - 2018 IEEE International Conference on Systems, Man, and Cybernetics, SMC 2018. 2019; 1081-1086. 10.1109/SMC.2018.00191 [DOI] [Google Scholar]
- Knapper A. S., Hagenzieker M. P., Brookhuis K. A.. Do in-car devices affect experienced users’ driving performance?. IATSS Research. 2015; 39(1):72–78. 10.1016/j.iatssr.2014.10.002 [DOI] [Google Scholar]
- Kosaka H., Koyama H., Nishitani H.. Analysis of driver’s behavior from heart rate and eye movement when he/she causes an accident between cars at an intersection. SAE Technical Papers. 2005. 10.4271/2005-01-0432 [DOI] [Google Scholar]
- Kountouriotis G. K., Spyridakos P., Carsten O. M. J., Merat N.. Identifying cognitive distraction using steering wheel reversal rates. Accident Analysis and Prevention. 2016; 96:39–45. 10.1016/j.aap.2016.07.032 [DOI] [PubMed] [Google Scholar]
- Krause M., Angerer C., Bengler K.. Evaluation of a Radio Tuning Task on Android while Driving. Procedia Manufacturing. 2015; 3:2642–2649. 10.1016/j.promfg.2015.07.334 [DOI] [Google Scholar]
- Kujala T., Silvennoinen J., Lasch A.. Visual-manual in-car tasks decomposed - Text entry and kinetic scrolling as the main sources of visual distraction. In Proceedings of the 5th International Conference on Automotive User Interfaces and Interactive Vehicular Applications, AutomotiveUI. 2013; 82-89. 10.1145/2516540.2516562 [DOI] [Google Scholar]
- Kun A. L., Palinko O., Medenica Z., Heeman P. A.. On the feasibility of using pupil diameter to estimate cognitive load changes for in-vehicle spoken dialogues. In Proceedings of the Annual Conference of the International Speech Communication Association, INTERSPEECH. 2013; 3766-3770. [Google Scholar]
- Lee J. D., Roberts S. C., Hoffman J. D., Angell L. S.. Scrolling and driving: How an MP3 player and its aftermarket controller affect driving performance and visual behaviour. Human Factors. 2012; 54(2):250–263. 10.1177/0018720811429562 [DOI] [PubMed] [Google Scholar]
- Lee S. H., Yoon S. O., Shin J. H.. On-wheel finger gesture control for invehicle systems on central consoles. Adjunct Proceedings of the 7th International Conference on Automotive User Interfaces and Interactive Vehicular Applications, AutomotiveUI. 2015; 94-99. 10.1145/2809730.2809739 [DOI] [Google Scholar]
- Lee S. S. Y., Black A. A., Lacherez P., Wood J. M.. Eye movements and road hazard detection: Effects of blur and distractors. Optometry and Vision Science. 2016; 93(9):1137–1146. 10.1097/OPX.0000000000000903 [DOI] [PubMed] [Google Scholar]
- Lehtonen E., Lappi O., Summala H.. Anticipatory eye movements when approaching a curve on a rural road depend on working memory load. Transportation Research Part F: Traffic Psychology and Behaviour. 2012; 15(3):369–377. 10.1016/j.trf.2011.08.007 [DOI] [Google Scholar]
- Lehtonen E., Lappi O., Koskiahde N., Mansikka T., Hietamäki J., Summala H.. Gaze doesn’t always lead steering. Accident Analysis and Prevention. 2018; 121:268–278. 10.1016/j.aap.2018.09.026 [DOI] [PubMed] [Google Scholar]
- Lemercier C., Pêcher C., Berthié G., Valéry B., Vidal V., Paubel P. V., Cour M., Fort A., Galéra C., Gabaude C., Lagarde E., Maury B.. Inattention behind the wheel: How factual internal thoughts impact attentional control while driving. Safety Science. 2014; 62(1):279–285. 10.1016/j.ssci.2013.08.011 [DOI] [Google Scholar]
- Li G., Zhu F., Zhang T., Wang Y., He S., Qu X.. Evaluation of Three In-Vehicle Interactions from Drivers’ Driving Performance and Eye Movement behaviour. In IEEE Conference on Intelligent Transportation Systems, Proceedings, ITSC. 2018. November; 2086-2091. 10.1109/ITSC.2018.8569917 [DOI] [Google Scholar]
- Li P., Markkula G., Li Y., Merat N.. Is improved lane keeping during cognitive load caused by increased physical arousal or gaze concentration toward the road center? Accident Analysis and Prevention. 2018; 117:65-74. 10.1016/j.aap.2018.03.034 [DOI] [PubMed] [Google Scholar]
- Li X., Vaezipour A., Rakotonirainy A., Demmel S.. Effects of an in-vehicle eco-safe driving system on drivers’ glance behaviour. Accident Analysis and Prevention. 2019; 122:143–152. 10.1016/j.aap.2018.10.007 [DOI] [PubMed] [Google Scholar]
- Li P., Merat N., Zheng Z., Markkula G., Li Y., Wang Y.. Does cognitive distraction improve or degrade lane keeping performance? Analysis of time-to-line crossing safety margins. Transportation Research Part F: Traffic Psychology and Behaviour. 2018; 57, 48–58. 10.1016/j.trf.2017.10.002 [DOI] [Google Scholar]
- Liang Y., Lee J. D.. Combining cognitive and visual distraction: Less than the sum of its parts. Accident Analysis and Prevention. 2010; 42(3):881–890. 10.1016/j.aap.2009.05.001 [DOI] [PubMed] [Google Scholar]
- Libby D., Chaparro A., He J.. Distracted while driving: A comparison of the effects of texting and talking on a cell phone. Proceedings of the Human Factors and Ergonomics Society. 2013; 57(1):1874–1878. 10.1177/1541931213571418 [DOI] [Google Scholar]
- Ma J., Xu M., Du Y.. A Usability Study on In-Vehicle Gesture Control. SAE Technical Papers. 2016. 10.4271/2016-01-1870 [DOI] [Google Scholar]
- Mackun T., Zukowska J.. Analysis of the relationship between the length of eye fixation and the parameters of advertisements visible from the road. MATEC Web of Conferences. 2018; 231. 10.1051/matecconf/201823104007 [DOI] [Google Scholar]
- Madleňák R., Hudák M.. Analysis of Roadside advertisements on selected Road stretch in Zilina. Transport Means - Proceedings of the International Conference. 2016. October; 618-621. [Google Scholar]
- McGough B., Ma W.. Assessment of in-vehicle cellphone locations in influencing driving performance and distraction. Proceedings of the Human Factors and Ergonomics Society. 2015; January 59:1588–1592. 10.1177/1541931215591343 [DOI] [Google Scholar]
- Metz B., Schömig N., Krüger H. P.. Attention during visual secondary tasks in driving: Adaptation to the demands of the driving task. Transportation Research Part F: Traffic Psychology and Behaviour. 2011; 14(5):369–380. 10.1016/j.trf.2011.04.004 [DOI] [Google Scholar]
- Nabatilan L. B., Aghazadeh F., Nimbarte A. D., Harvey C. C., Chowdhury S. K.. Effect of driving experience on visual behavior and driving performance under different driving conditions. Cognition, Technology and Work. 2012; 14(4):355–363. 10.1007/s10111-011-0184-5 [DOI] [Google Scholar]
- Najar S. A., Sanjram P. K.. Gaze behavior and human error in distracted driving: Unlocking the complexity of articulatory rehearsal mechanism. Transportation Research Part F: Traffic Psychology and Behaviour. 2018; 59:12–23. 10.1016/j.trf.2018.08.005 [DOI] [Google Scholar]
- Niezgoda M., Tarnowski A., Kruszewski M., Kamiński T. Towards testing auditory–vocal interfaces and detecting distraction while driving: A comparison of eye-movement measures in the assessment of cognitive workload. Transportation Research Part F: Traffic Psychology and Behaviour. 2015; 32:23-34. 10.1016/j.trf.2015.04.012 [DOI] [Google Scholar]
- Oh H. J., Ko S. M., Ji Y. G.. Effects of Superimposition of a Head-Up Display on Driving Performance and Glance Behavior in the Elderly. International Journal of Human-Computer Interaction. 2015; 32(2):143-154. 10.1080/10447318.2015.1104155 [DOI] [Google Scholar]
- Ouimet M. C., Pradhan A. K., Simons-Morton B. G., Divekar G., Mehranian H., Fisher D. L.. The effect of male teenage passengers on male teenage drivers: Findings from a driving simulator study. Accident Analysis and Prevention. 2013; 58:132–139. 10.1016/j.aap.2013.04.024 [DOI] [PMC free article] [PubMed] [Google Scholar]
- Peng Y., Boyle L. N.. Driver’s adaptive glance behavior to in-vehicle information systems. Accident Analysis and Prevention. 2015; 85:93–101. 10.1016/j.aap.2015.08.002 [DOI] [PubMed] [Google Scholar]
- Perez M. A. Safety implications of infotainment system use in naturalistic driving. Work. 2012; 41(SUPPL.1):4200–4204. 10.3233/WOR-2012-0122-4200 [DOI] [PubMed] [Google Scholar]
- Perlman D., Samost A., Domel A. G., Mehler B., Dobres J., Reimer B.. The relative impact of smartwatch and smartphone use while driving on workload, attention, and driving performance. Applied Ergonomics. 2019; 75:8–16. 10.1016/j.apergo.2018.09.001 [DOI] [PubMed] [Google Scholar]
- Pradhan A. K., Li K., Bingham C. R., Simons-Morton B. G., Ouimet M. C., Shope J. T.. Peer passenger influences on male adolescent drivers’ visual scanning behavior during simulated driving. Journal of Adolescent Health. 2014; 54(5):42–49. 10.1016/j.jadohealth.2014.01.004 [DOI] [PMC free article] [PubMed] [Google Scholar]
- Qin Y., Cui C., Wang Y., Jia X., Hui Y.. The influence of road advertisement on driving behavior characteristics under the condition of risk driving. Wuhan Ligong Daxue Xuebao (Jiaotong Kexue Yu Gongcheng Ban)/Journal of Wuhan University of Technology (Transportation Science and Engineering). 2018; 42(6):925–929 and 936. 10.3963/j.issn.2095-3844.2018.06.006 [DOI] [Google Scholar]
- Rahimi M., Briggs R. P., Thom D. R.. A field evaluation of driver eye and head movement strategies toward environmental targets and distractors. Applied Ergonomics. 1990; 21(4):267–274. 10.1016/0003-6870(90)90196-5 [DOI] [PubMed] [Google Scholar]
- Reimer B., Mehler B., Donmez B.. A study of young adults examining phone dialing while driving using a touchscreen vs. a button style flip-phone. Transportation Research Part F: Traffic Psychology and Behaviour. 2014; 23:57–68. 10.1016/j.trf.2013.12.017 [DOI] [Google Scholar]
- Reimer B., Mehler B., Wang Y., Coughlin J. F.. A field study on the impact of variations in short-term memory demands on drivers’ visual attention and driving performance across three age groups. Human Factors. 2012; 54(3):454–468. 10.1177/0018720812437274 [DOI] [PubMed] [Google Scholar]
- Reimer B. Impact of cognitive task complexity on drivers’ visual tunnelling. Transportation Research Record. 2009; 2138:13–19. 10.3141/2138-03 [DOI] [Google Scholar]
- Reyes M. L., Lee J. D.. (). Effects of cognitive load presence and duration on driver eye movements and event detection performance. Transportation Research Part F: Traffic Psychology and Behaviour. 2008; 11(6):391–402. 10.1016/j.trf.2008.03.004 [DOI] [Google Scholar]
- Sall R. J., Wright T. J., Boot W. R.. Driven to distraction? The effect of simulated red light running camera flashes on attention and oculomotor control. Visual Cognition. 2014; 22(1):57–73. 10.1080/13506285.2013.873509 [DOI] [Google Scholar]
- Savage S. W., Potter D. D., Tatler B. W.. Does preoccupation impair hazard perception? A simultaneous EEG and Eye Tracking study. Transportation Research Part F: Traffic Psychology and Behaviour. 2013; 17:52–62. 10.1016/j.trf.2012.10.002 [DOI] [Google Scholar]
- Schömig N., Metz B.. Three levels of situation awareness in driving with secondary tasks. Safety Science. 2013; 56:44–51. 10.1016/j.ssci.2012.05.029 [DOI] [Google Scholar]
- Schömig N., Metz B., Krüger H. P.. Anticipatory and control processes in the interaction with secondary tasks while driving. Transportation Research Part F: Traffic Psychology and Behaviour. 2011; 14(6):525–538. 10.1016/j.trf.2011.06.006 [DOI] [Google Scholar]
- Smiley A., Persaud B., Bahar G., Mollett C., Lyon C., Smahel T., Kelman L. W.. Traffic safety evaluation of video advertising signs. Transportation Research Record. 2005; 1937(1):105–112. 10.3141/1937-15 [DOI] [Google Scholar]
- Smiley A., Smahel T., Eizenman M.. Impact of video advertising on driver fixation patterns. Transportation Research Record. 2004; 1899(1):76–83. 10.3141/1899-10 [DOI] [Google Scholar]
- Strayer D. L., Cooper J. M., Drews F. A.. What do Drivers Fail to See When Conversing on a Cell Phone?. Proceedings of the Human Factors and Ergonomics Society Annual Meeting. 2004; 48(19):2213–2217. 10.1177/154193120404801902 [DOI] [Google Scholar]
- Tangmanee K., Teeravarunyou S.. Effects of guided arrows on head-up display towards the vehicle windshield. In 2012 Southeast Asian Network of Ergonomics Societies Conference: Ergonomics Innovations Leveraging User Experience and Sustainability, SEANES. 2012. 10.1109/SEANES.2012.6299572 [DOI] [Google Scholar]
- Tijerina L., Parmer E. B., Goodman M. J.. Individual Differences and in-Vehicle Distraction While Driving: A Test Track Study and Psychometric Evaluation. Proceedings of the Human Factors and Ergonomics Society Annual Meeting. 1999; 43(18):982–986. 10.1177/154193129904301808 [DOI] [Google Scholar]
- Tivesten E., Dozza M.. Driving context and visual-manual phone tasks influence glance behavior in naturalistic driving. Transportation Research Part F: Traffic Psychology and Behaviour. 2014; 26(A):258–272. 10.1016/j.trf.2014.08.004 [DOI] [Google Scholar]
- Topolšek, D, Areh I., Cvahte T.. Examination of driver detection of roadside traffic signs and advertisements using eye tracking. Transportation Research Part F: Traffic Psychology and Behaviour. 2016; 43:212–224. 10.1016/j.trf.2016.10.002 [DOI] [Google Scholar]
- Wang Y., Bao S., Du W., Ye Z., Sayer J. R.. Examining drivers’ eye glance patterns during distracted driving: Insights from scanning randomness and glance transition matrix. Journal of Safety Research. 2017; 63:149–155. 10.1016/j.jsr.2017.10.006 [DOI] [PubMed] [Google Scholar]
- Wang Y., Mehler B., Reimer B., Lammers V., D’Ambrosio L. A., Coughlin J. F.. The validity of driving simulation for assessing differences between in-vehicle informational interfaces: A comparison with field testing. Ergonomics. 2010; 53(3):404–420. 10.1080/00140130903464358 [DOI] [PubMed] [Google Scholar]
- White C. B., Caird J. K.. The blind date: The effects of change blindness, passenger conversation and gender on looked-but-failed-to-see (LBFTS) errors. Accident Analysis and Prevention. 2010; 42(6):1822–1830. 10.1016/j.aap.2010.05.003 [DOI] [PubMed] [Google Scholar]
- Wong J. T., Huang S. H.. Attention allocation patterns in naturalistic driving. Accident Analysis and Prevention. 2013; 58:140–147. 10.1016/j.aap.2013.04.033 [DOI] [PubMed] [Google Scholar]
- Wood G., Hartley G., Furley P. A., Wilson M. R.. Working Memory Capacity, Visual Attention and Hazard Perception in Driving. Journal of Applied Research in Memory and Cognition. 2016; 5(4):454–462. 10.1016/j.jarmac.2016.04.009 [DOI] [Google Scholar]
- Wright T. J., Vitale T., Boot W. R., Charness N.. The impact of red light running camera flashes on younger and older drivers’ attention and oculomotor control. Psychology and Aging. 2015; 30(4):755–767. 10.1037/pag0000052 [DOI] [PMC free article] [PubMed] [Google Scholar]
- Wu L., Zhu S., Lu Q., Zhu T.. Investigating the Impacts Caused by Manual Secondary Tasks on Drivers’ Visual Behavior. In Proceedings of the 16th COTA International Conference of Transportation Professionals. 2016; 152-161. 10.1061/9780784479896.015 [DOI] [Google Scholar]
- Xian H., Jin L.. The effects of using in-vehicle computer on driver eye movements and driving performance. Advances in Mechanical Engineering. 2015; 7(2). 10.1155/2014/981908 [DOI] [Google Scholar]
- Yamani Y., Horrey W. J., Liang Y., Fisher D. L.. Sequential in-vehicle glance distributions: An alternative approach for analyzing glance data. Human Factors. 2015; 57(4):567–572. 10.1177/0018720814560225 [DOI] [PubMed] [Google Scholar]
- Yang Y., McDonald M., Zheng P.. Can drivers’ eye movements be used to monitor their performance? A case study. IET Intelligent Transport Systems. 2012; 6(4):444–452. 10.1049/iet-its.2012.0008 [DOI] [Google Scholar]
- Yang Y., Reimer B., Mehler B., Wong A., McDonald M.. Exploring differences in the impact of auditory and visual demands on driver behavior. In Proceedings of the 4th International Conference on Automotive User Interfaces and Interactive Vehicular Applications (pp. 173-177). ACM; 2012. 10.1145/2390256.2390285 [DOI] [Google Scholar]
- Yang Y., Wong A., McDonald M.. Does gender make a difference to performing in-vehicle tasks?. IET Intelligent Transport Systems. 2015; 9(4):359-365. 10.1049/iet-its.2013.0117 [DOI] [Google Scholar]
- Yoshizawa A., Iwasaki H.. Analysis of driver’s visual attention using near-miss incidents. In 2017 IEEE 16th International Conference on Cognitive Informatics & Cognitive Computing (ICCI* CC) (pp. 353-360). IEEE; 2017. 10.1109/icci-cc.2017.8109773 [DOI] [Google Scholar]
- Young K. L., Lenné M. G., Salmon P. M., Stanton N. A.. The impact of texting on driver behaviour at rail level crossings. Accident Analysis & Prevention. 2018; 118:269-276. 10.1016/j.aap.2018.05.002 [DOI] [PubMed] [Google Scholar]
- Young M. S., Mahfoud J. M., Stanton N. A., Salmon P. M., Jenkins D. P., Walker G. H.. Conflicts of interest: The implications of roadside advertising for driver attention. Transportation Research Part F: Traffic Psychology and Behaviour. 2009; 12(5):381-388. 10.1016/j.trf.2009.05.004 [DOI] [Google Scholar]
- Young K. L., Mitsopoulos-Rubens E., Rudin-Brown C. M., Lenné M. G.. The effects of using a portable music player on simulated driving performance and task-sharing strategies. Applied Ergonomics. 2012; 43(4):738-746. 10.1016/j.apergo.2011.11.007 [DOI] [PubMed] [Google Scholar]
- Zahabi M., Kaber D.. Effect of police mobile computer terminal interface design on officer driving distraction. Applied Ergonomics. 2018; 67:26-38. 10.1016/j.apergo.2017.09.006 [DOI] [PubMed] [Google Scholar]
- Zahabi M., Machado P., Lau M. Y., Deng Y., Pankok C., Hummer J., Rasdorf W., Kaber D. B.. Driver performance and attention allocation in use of logo signs on freeway exit ramps. Applied Ergonomics. 2017; 65:70-80. 10.1016/j.apergo.2017.06.001 [DOI] [PubMed] [Google Scholar]
- Zahabi M., Pankok C., Kaber D. B., Machado P., Lau M. Y., Hummer J. E., Rasdorf W.. On-Road Visual Sign Salience, Driver Attention Allocation, and Target Detection Accuracy. Transportation Research Record: Journal of the Transportation Research Board. 2017; 2663:40-47. 10.3141/2663-06 [DOI] [Google Scholar]
- Zahabi M., Machado P., Pankok C., Lau M. Y., Liao Y. F., Hummer J., Rasdorf W., Kaber D. B.. The role of driver age in performance and attention allocation effects of roadway sign count, format and familiarity. Applied Ergonomics. 2017; 63:17-30. 10.1016/j.apergo.2017.04.001 [DOI] [PubMed] [Google Scholar]
- Zhang Y., Reimer B., Mehler B., Dobres J., Pala S., Angell L., Ifushi S.. An evaluation of the visual demands of portable telematics in young adult drivers. In Proceedings of the 20th ITS World Congress. 2013. [Google Scholar]
- Zhang W., Kontou E.. Isolating stationary and temporal sources of driver distraction through eye tracking study. Advances in Transportation Studies. 2014; 1:87-100. 10.4399/97888548735449 [DOI] [Google Scholar]
- Zhang Y., Harris E., Rogers M., Kaber D., Hummer J., Rasdorf W., Hu J.. Driver distraction and performance effects of highway logo sign design. Applied Ergonomics. 2013; 44(3):472-479. 10.1016/j.apergo.2012.10.009 [DOI] [PubMed] [Google Scholar]
- Zhang Y., Kaber D. B., Rogers M., Liang Y., Gangakhedkar S.. The Effects of Visual and Cognitive Distractions on Operational and Tactical Driving Behaviors. Human Factors: The Journal of the Human Factors and Ergonomics Society. 2014; 56(3):592-604. 10.1177/0018720813495279 [DOI] [PubMed] [Google Scholar]
- Zhang H., Smith M. R. H., Witt G. J.. Identification of Real-Time Diagnostic Measures of Visual Distraction With an Automatic Eye-Tracking System. Human Factors: The Journal of the Human Factors and Ergonomics Society. 2006; 48(4):805-821. 10.1518/001872006779166307 [DOI] [PubMed] [Google Scholar]
- Zhang L., Zhang J., Liu Y., Guo J.. The impact of over-bright highway billboards on driving behaviour. In VEHITS 2017 - Proceedings of the 3rd International Conference on Vehicle Technology and Intelligent Transport Systems. 2017; 276-284. [Google Scholar]
- Zhou H., Itoh M.. Effect of Adaptive Caution on Driver’s Lane-Change Behavior under Cognitively Distracted Condition. In International Conference on Human Interface and the Management of Information (pp. 262-271). Springer, Cham; 2015. 10.1007/978-3-319-20618-9_26 [DOI] [Google Scholar]
- Zhou H., Itoh M., Inagaki T.. Influence of cognitively distracting activity on driver’s eye movement during preparation of changing lanes. In 2008 SICE Annual Conference (pp. 866-871). IEEE; 2008. 10.1109/SICE.2008.4654776 [DOI] [Google Scholar]
- Zhou H., Itoh M., Inagaki T.. How Do Cognitive Distraction Affect Driver Intent of Changing Lanes?. In: Xie M., Xiong Y., Xiong C., Liu H., Hu Z. (eds). Intelligent Robotics and Applications. ICIRA 2009. Lecture Notes in Computer Science 2009; Springer Berlin Heidelberg, Berlin, Heidelberg; vol 5928. 10.1007/978-3-642-10817-4_23 [DOI] [Google Scholar]