

Abstract
Background:
Modifiable vascular risk factors (VRF) have been implicated in cognitive impairment.
Objective:
We compared the prediction of cognitive performance between the CAIDE dementia risk score, a validated tool to estimate dementia risk using VRF, and the Northern Manhattan Study (NOMAS) global vascular risk score (GVRS), created to predict vascular events.
Methods:
The CAIDE and GVRS scores were calculated based on baseline VRF among 1,290 stroke-free participants in the prospective population-based NOMAS MRI cohort (mean age 64±8 years, 60% women; 66% Hispanic, 17% Black, 15% White; 46% completed high school). Domain-specific Z-scores were derived for episodic and semantic memory, executive function, and processing speed, and averaged to calculate global cognition.
Results:
The CAIDE score was associated with worse global cognition at initial assessment (Beta per SD=−0.347, p<0.0001), and with greater decline over time (Beta per SD=−0.033, p=0.02). These associations were largely due to age and education, and the association with cognitive decline was not significant after adjusting for age, sex, and education. The GVRS was inversely associated with global cognition at initial testing (Beta per SD=−0.247, p<0.0001) and greater decline over time (Beta per SD=−0.127, p<0.0001), which persisted after adjusting for sociodemographics. The associations for both scores with initial cognitive performance were driven by executive function and processing speed, and the GVRS was associated with decline in episodic memory and processing speed.
Conclusions:
The GVRS was a stronger predictor of cognitive decline than the CAIDE in a multi-ethnic urban cohort. The inclusion of glucose and smoking in the GVRS, which are absent in CAIDE, likely explains the better performance of the GVRS.
Keywords: cognition, risk score, vascular risk factors, dementia, epidemiology
Introduction
Modifiable vascular risk factors (VRF) have been implicated in cognitive impairment and include obesity, hypertension, smoking, depression, sleep disturbances, hyperlipidemia, and diabetes. There is also evidence to support education, physical activity, and moderate alcohol use as protective factors [1]. The relation between a range of vascular comorbidities including stroke, myocardial infarction (MI) and congestive heart failure and cognitive decline has been well established [2–10] and shown to vary across race/ethnic groups. This underscores the importance of studying diverse populations to better inform strategies to prevent vascular cognitive decline and dementia [11].
The overall burden of VRF as quantified by composite measures may be more relevant for predicting cognitive decline than individual risk factors, as these factors can have synergistic effects. Risk scores that combine individual factors may be more valuable tools for targeting preventive measures to those at risk. Although vascular disease and vascular risk factors have been implicated in the risk of cognitive decline and dementia, only a few risk scores have been developed specifically for predicting cognitive decline and dementia based on common, modifiable, and easily measurable risk factors. The Cardiovascular Risk Factors, Aging, and Incidence of Dementia (CAIDE) risk score is a validated tool to estimate the risk of dementia using midlife risk factors and is the most well-known for dementia prediction [12]. The CAIDE score was developed in the Cardiovascular Risk Factors, Aging and Dementia study, which is one of the first observational studies that investigated the role of midlife risk factors for the subsequent development of dementia and Alzheimer’s Disease [12]. In addition, several risk models have been created to predict cardiovascular health using a combination of vascular risk factors, and recently some of these have been studied in relation to cognitive health. For example, the Framingham Risk Score (FRS) is a well-established assessment tool for cardiovascular disease and has been associated with executive function in the Framingham Offspring study [13], and with incident cognitive impairment in the Reasons for Geographic and Racial Differences in Stroke (REGARDS) Study [14]. In fact, data from the British Whitehall II Cohort study suggested that the Framingham general cardiovascular disease risk score and the Framingham stroke risk score were more strongly predictive of 10-year cognitive decline than the CAIDE dementia risk score [15].
In the prospective population-based Northern Manhattan Study (NOMAS), we sought to improve the predictive ability of the FRS in our multi-ethnic, largely Caribbean Hispanic population. To improve performance among white and non-white populations, we included both behavioral and anthropometric factors in addition to traditional vascular risk factors and constructed the global vascular risk score (GVRS). We also used continuous variables for physiological parameters. Previously, the GVRS was predictive of stroke, myocardial infarction, and vascular death, with superior performance compared to the FRS [16]. Further, each 1-point decrease on the GVRS was associated with 38% greater odds of successful aging without cognitive decline [17]. The goal of the current study is to examine the comparative performance of the CAIDE score and the GVRS in predicting cognitive performance and cognitive decline in the NOMAS population to better understand the relation between overall burden of vascular risk factors and cognitive function.
Methods
Study Population
The NOMAS population includes adults, age 40 and older (range 40–94), who had resided in northern Manhattan for more than three months at the time of recruitment and had never been diagnosed with a stroke [18]. These individuals were recruited between 1993–2001 using random-digit dialing to participate in a baseline interview and assessment (enrollment response rate was 75%), with ongoing annual follow-up (loss to follow up <5%). The goal of the NOMAS cohort is to examine risk factors for incident stroke and cognitive decline in a multi-ethnic, predominantly Caribbean Hispanic, community-based cohort. The full NOMAS cohort includes 3,497 participants, though the current study is restricted to the MRI sub-cohort because they were the portion of the full cohort with cognitive evaluations. The MRI sub-cohort was recruited during annual follow-up starting in 2003 and restricted to participants who were clinically stroke-free, age >55 years, with no contraindications to MRI (final n=1,290). The study was approved by the IRBs of Columbia University and the University of Miami and all subjects provided written informed consent.
Baseline Evaluation
At the time of enrollment, NOMAS participants had a thorough evaluation of vascular risk factors and medical history, including a physical/neurological examination. Race/ethnicity was defined by self-identification using a series of questions modeled after the US census and conforming to standard definitions outlined by Directive 15 [19]. Educational achievement was self-reported as number of years in school and degree achieved. The evaluation included standardized questions adapted from the Behavioral Risk Factor Surveillance System by the CDC regarding the history of hypertension, diabetes mellitus, smoking, and cardiovascular conditions, including congestive heart failure, angina, coronary artery disease, atrial fibrillation, valvular heart disease, and peripheral vascular disease [20,21]. Data on all medication use was collected. Smoking was categorized as current (within the past year), former, or never smoker of cigarettes, cigars, or pipes. Leisure-time physical activity was assessed by self-report using a simple questionnaire adapted from the National Health Interview Survey, which captured the duration and frequency of leisure time physical activity for exercise over the two weeks before interview. Physical inactivity was defined as reporting no engagement in the leisure-time physical activities (<10 minutes), and moderate to heavy physical activity was defined as participation in at least one of several rigorous physical activities in a typical 14-day period, described previously [22]. Moderate alcohol use was categorized as current drinking of >1 drink/month and ≤2 drinks/day. Fasting blood specimens were analyzed at the Core Laboratory of the Irving Center for Clinical Research to determine blood glucose and lipid levels, including total cholesterol and HDL. Anthropometric variables that were measured included height and weight used to determine BMI (as kg/m2) as well as waist and hip circumference. Systolic and diastolic blood pressures were calculated by averaging two measurements (before and after the physical examination) from the right brachial artery after a 10-minute rest in a seated position (Dinamap Pro100, Critikon Inc).
We also evaluated the effect modification of APOEε4 status. DNA samples were extracted from peripheral white blood cells by HhaI digestion and amplified by polymerase chain reaction (PCR). APOE ε4 carrier status included participants with a genotype of ApoE4/2, ApoE4/3, and ApoE4/4.
CAIDE score.
Table 1 shows the scoring algorithm of the CAIDE dementia risk score. The CAIDE score [12] was quantified by weighting the following risk factors to predict dementia: age (> or = 47 years), low education (< 10 years), sex, systolic blood pressure, obesity (BMI≥30), any physical activity, and total cholesterol, with greater points allotted for factors associated with higher dementia risk. As shown, there were two CAIDE scores, with and without APOE4 status, and the weighting of risk factors varied in these two scores.
Table 1.
CAIDE Dementia Risk Score factors and number of points.
| CAIDE | CAIDE including APOE | |
|---|---|---|
| Age | ||
| <47 years | 0 | 0 |
| 47–53 years | 3 | 3 |
| >53 years | 4 | 5 |
| Education | ||
| ≥10 years | 0 | 0 |
| 7–9 years | 2 | 3 |
| 0–6 years | 3 | 4 |
| Sex | ||
| Women | 0 | 0 |
| Men | 1 | 1 |
| Systolic blood pressure | ||
| ≤140 mmHg | 0 | 0 |
| >140 mmHg | 2 | 2 |
| Body-mass index | ||
| ≤ 30 kg/m2 | 0 | 0 |
| >30 kg/m2 | 2 | 2 |
| Total cholesterol | ||
| ≤6.5 mmol/l | 0 | 0 |
| >6.5 mmol/l | 2 | 1 |
| Physical activity | ||
| Active | 0 | 0 |
| Inactive | 1 | 1 |
| APOE e4 status | ||
| Non-carrier | - | 0 |
| Carrier | - | 2 |
| Total number of points | Max. 15 points | Max. 18 points |
NOMAS Global Vascular Risk Score.
GVRS is a weighted score developed in NOMAS to predict clinical vascular events [16]. It was quantified as follows: Age*0.08338, Male Gender*0.37949, African American*0.02770, Hispanic Ethnicity*−0.22214, Waist(inches)*0.02156, Moderate alcohol consumption*−0.18039, Former smoking*0.16383, Current smoking*0.69142, Moderate-to-heavy physical activity*−0.16333, Moderate-to-heavy physical activity*male gender*−1.01324, Systolic blood pressure(mm Hg)*0.00158, Diastolic blood pressure(mm Hg)*0.01195, Diastolic blood pressure*anti-hypertensive medication*0.00247, Peripheral vascular disease*0.26737, Fasting blood sugar*0.00432, and Total Cholesterol:HDL (mg/dL)*0.05678.
Neuropsychological Assessment
The neuropsychological (NP) battery was administered in English or Spanish by trained research assistants in a quiet room close to the time of MRI sub-cohort recruitment (within weeks). As described previously [23], domain-specific Z scores were calculated for four cognitive domains (executive function, processing speed, episodic memory and semantic memory). The distribution of tests across the four domains was based on their inter-relationships observed in an exploratory factor analysis as well as the conclusions of previous studies. Orthogonal rotation was used in the exploratory factor analysis. We defined the tests for each domain based on the largest loading to the factor (domain) and calculated the domain-specific Z scores by averaging Z-transformed NP test scores defined for each domain. Episodic memory was assessed with three sub-scores on a 12-word five trial list-learning task: list learning total score, delayed recall score, and delayed recognition score. Executive function was assessed with two sub-scores: the difference in time to complete the Color Trails test Form 1 and Form 2, and the sum of the Odd-Man-Out subtests 2 and 4. Processing speed was assessed with the Grooved Pegboard task with the non-dominant hand, the Color Trails test Form 1, and the Visual-Motor Integration test. Semantic memory was assessed with three tests: picture naming (modified Boston Naming) test, category fluency (Animal Naming) test and phonemic fluency (C, F, L in English speakers and F, A, S in Spanish speakers). A global cognition score was calculated as the mean of the four domain-specific z-scores. A second neuropsychological assessment was conducted at a mean of 6±3 years after the initial neuropsychological assessment. To quantify the changes in domain performance over time, the Z-score for performance in a specific domain at the initial assessment was subtracted from that at the second assessment. For global cognition, change in performance over time was calculated as the mean of the difference of the four domain-specific z-scores over time. Around the time of neuropsychological assessment, intracranial volume and cerebral volume were measured by MRI, and cerebral volume as a percentage of intracranial volume was calculated [24].
Statistical Analysis
The primary independent exposures of interest were the CAIDE dementia risk scores and the NOMAS GVRS. The CAIDE score was quantified with and without the APOE component and was assessed both continuously per standard deviation (SD). The CAIDE score with the APOE component was dichotomized as score ≥9 vs. <9, a cutoff used previously [25]. The GVRS was assessed continuously per SD. The dependent exposures of interest were the global and the four-domain specific Z-scores for cognitive performance at the initial assessment, and the change in performance over time, calculated as the difference between the Z-score at follow-up and initial assessment. Linear regression models were used to assess the relationships between the CAIDE scores and GVRS with the cognitive domains. We adjusted for the time from baseline assessment to the first NP assessment in model 1 and additionally for age, sex, and years of education in model 2. In analyses of cognitive change over time we further adjusted for the time lag between the initial NP assessment and the follow-up assessment. Although age, sex, and education were included in the risk scores, we included them as covariates in model 2 as their independent associations have been accounted for in previous work [25]. An exploratory analysis was conducted to examine whether the associations between the CAIDE score and the GVRS with global cognition at initial performance and change over time varied by race/ethnicity. We examined the R2 values across models to determine whether there was a difference between the CAIDE and GVRS in terms of the percentage of variability of the cognitive domain Z-scores explained. As a sensitivity analysis, we examined the relationships between the GVRS and CAIDE score with cognitive performance and change stratified by APOE ε4 carrier status to determine if the scores were similarly predictive of cognition among ε4 carriers and non-carriers. Lastly, as an additional sensitivity analysis, we excluded the incident stroke cases accrued between the first and second cognitive assessment and examined the associations between the GVRS and CAIDE scores (continuous and categorical) with global cognitive change in this restricted cohort in models 1 and 2.
Results
The study sample included 1,290 NOMAS participants (1,161 with available information on APOE4 carrier status; 15% White, 17% Black, 66% Hispanic; 60% women, 46% completed high school, 25% were APOE4 carriers). The mean age at baseline was 64±8 years, and the mean time from baseline to cognitive assessment was 6±3 years. The CAIDE score with APOE component ranged from 0–17, with a median of 9 (IQR=7–11), and 61% had a score of 9 or greater. The CAIDE without APOE ranged from 0–14, with a median of 8 (IQR=6–9). The GVRS ranged from 4.4–10.8, with a median of 8.2 (IQR 7.6–8.9). Table 2 shows the distribution of the vascular risk factors in the study population that were included in the CAIDE score and GVRS.
Table 2.
Description of the NOMAS study sample
| Vascular Risk Factors | N=1290 |
|---|---|
| Age: mean (SD) | 64 (8) |
| Education (years): mean (SD) | 10 (5) |
| Male: N (%) | 510 (40) |
| Race/ethnicity: N (%) | |
| White | 191 (15) |
| Black | 223 (17) |
| Hispanic | 847 (66) |
| Waist (inches): mean (SD) | 37 (5) |
| BMI: mean (SD) | 28 (5) |
| Moderate alcohol consumption: N (%) | 530 (41) |
| Smoking: N (%) | |
| Never | 612 (47) |
| Former | 475 (37) |
| Current | 203 (16) |
| Any physical activity: N (%) | 706 (56) |
| Moderate-heavy physical activity: N (%) | 130 (10) |
| Systolic blood pressure: mean (SD) | 139 (20) |
| Diastolic blood pressure: mean (SD) | 83 (11) |
| Antihypertensive medication use: N (%) | 527 (41) |
| Peripheral vascular disease: N (%) | 156 (12) |
| Fasting blood sugar: mean (SD) | 101 (39) |
| Total cholesterol (mg/dL): mean (SD) | 210 (39) |
| HDL: mean (SD) | 47 (15) |
| APOE4 carrier: N (%) | 301 (25) |
Figure 1 shows the mean z-scores for global cognition and each of the four domains at the initial assessment as well as at the follow-up assessment, stratified by CAIDE score <9 vs ≥9 and by the median GVRS. As shown, the mean Z-scores were above zero for all domains at both time points among those with a CAIDE score <9 and among those with a GVRS below the median, whereas the mean Z-scores were below zero for all domains at both time points among those with a CAIDE score 9+ and among those with a GVRS at or above the median. Univariate t-tests indicated that the mean Z-scores for all domains at both time points were significantly different between those with CAIDE <9 vs ≥9 and between those with GVRS <8.17 (median) vs ≥8.17 (P<0.0001 for all tests). The mean (± standard deviation) cerebral volume as a percentage of intracranial volume was 72.3±4.6 for those with CAIDE <9 vs. 72.5±4.0 for CAIDE ≥9 (t-test after log transformation for normality: P=0.34), and 74.1±3.7 for those with GVRS <8.2 vs. 70.7±4.0 for those with GVRS ≥8.2 (t-test after log transformation for normality: P<0.0001).
Figure 1.
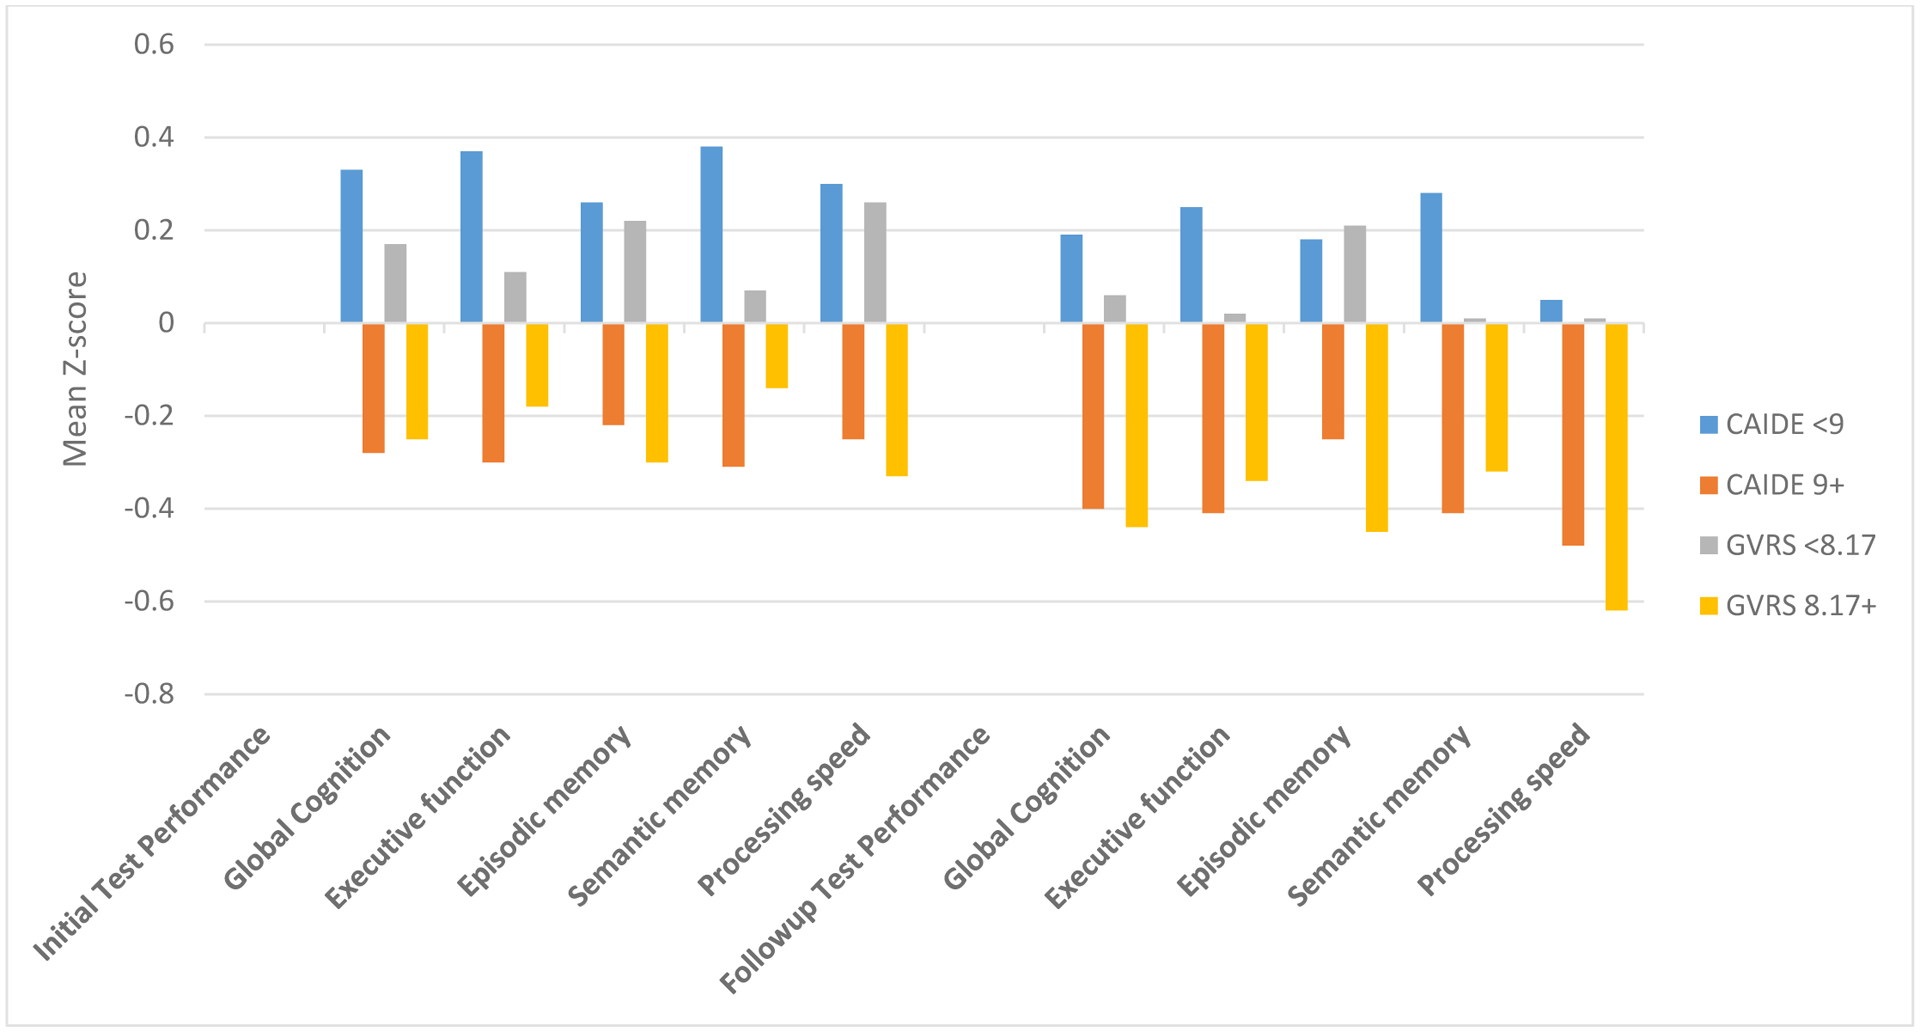
Cognitive performance at initial test and followup stratified by median Global Vascular Risk Score and CAIDE
The GVRS was inversely associated with both global cognition at the initial testing, and with change over time in models with and without adjustment for age, sex, and education. A higher GVRS score was associated with greater decline in cognitive performance over time (Table 3). These associations were most apparent among APOE4 non-carriers in the fully adjusted model 2.
Table 3.
CAIDE and Global Vascular Risk Score in relation to global cognition
| Global Cognition: initial performance Beta, P-value | Global Cognition: change over time* Beta, P-value | |||
|---|---|---|---|---|
| Model 1 | Model 2 | Model 1 | Model 2 | |
| Full CAIDE score Continuous (per SD) | −0.347, <0.0001 | −0.050, 0.01 | −0.033, 0.02 | 0.009, 0.57 |
| Score 9+ (61%) vs. <9 | −0.610, <0.0001 | −0.071, 0.06 | −0.022, 0.43 | 0.036, 0.24 |
| CAIDE score without APOE per SD | −0.309, <0.0001 | −0.024, 0.20 | −0.018, 0.19 | 0.025, 0.09 |
| In APOE4 carriers (N=301) | −0.349, <0.0001 | −0.011, 0.79 | −0.048, 0.09 | 0.031, 0.30 |
| In APOE4 non-carriers (N=914) | −0.304, <0.0001 | −0.039, 0.07 | −0.011, 0.48 | 0.022, 0.20 |
| GVRS (per SD) | −0.247, <0.0001 | −0.113, <0.0001 | −0.127, <0.0001 | −0.053, 0.01 |
| GVRS in APOE4 carriers (N=301) | −0.298, <0.0001 | −0.087, 0.10 | −0.108, <0.0001 | 0.019, 0.63 |
| GVRS in APOE4 non-carriers (N=914) | −0.236, <0.0001 | −0.133, <0.0001 | −0.135, <0.0001 | −0.075, 0.002 |
Model 1: Controlling for time from baseline to cognitive assessment
Model 2: Controlling for age, sex, years of education, time from baseline to cognitive assessment
Additionally controlling for initial performance and time between assessments
The CAIDE score, with and without the APOE component, was inversely associated with global cognition at initial testing in model 1 (Table 3). The association was apparent in APOE carriers and non-carriers. However, these associations were substantially attenuated after adjusting for age, sex, and education in model 2. The association between the full CAIDE score assessed continuously and global cognitive performance at initial assessment remained statistically significant in model 2, but the association for the dichotomized score (<9 vs ≥9) lost significance as did the CAIDE score without the APOE component. In model 1, the full CAIDE score was associated with increased decline in global cognition over time. However, this association was entirely attenuated and not significant after adjusting for age, sex, and education in model 2. In both models 1 and 2, no associations were observed between the dichotomized full CAIDE score nor the CAIDE score without the APOE component with cognitive decline over time. There was no significant interaction between either the GVRS or CAIDE score and race/ethnicity in relation to global cognition performance and change over time.
There were 55 confirmed incident strokes that accrued during the cognitive follow-up, and 62% of these were among those with a CAIDE score ≥9, and 73% were among those with a GVRS at or above the median. When the incident stroke cases accrued during cognitive followup were removed from the population as a sensitivity analysis, the associations in models 1 and 2 between the CAIDE scores (continuous and categorical) and the GVRS with change in global cognitive performance remained consistent (data not shown).
Table 4 shows the associations between the CAIDE and GVRS with the four cognitive domains adjusting for age, sex, and education. As shown, an inverse association between CAIDE and cognitive performance at initial assessment was suggested for the executive function and processing speed domains, but there was no significant association between the CAIDE score and change in any of the cognitive domains. The GVRS was associated with worse executive function, semantic memory, and processing speed at initial assessment, though it was not associated with episodic memory in models adjusted for age, sex, education, and the time from baseline to cognitive assessment (Table 4). The GVRS was also associated with greater decline in episodic memory, semantic memory, and processing speed over time, though not with change in executive function.
Table 4.
CAIDE and Global Vascular Risk Score in relation to individual cognitive domains
| Initial performance* Beta, P-value | Change over time** Beta, P-value | |||||||
|---|---|---|---|---|---|---|---|---|
| Executive function | Episodic memory | Semantic memory | Processing Speed | Executive function | Episodic memory | Semantic memory | Processing Speed | |
| CAIDE score (per SD) | −0.104, 0.004 | −0.011, 0.72 | −0.016, 0.56 | −0.065, 0.03 | −0.008, 0.79 | 0.052, 0.08 | −0.011, 0.62 | −0.019, 0.49 |
| Score 9+ (61%) vs <9 | −0.036, 0.0004 | −0.004, 0.72 | −0.005, 0.56 | −0.023, 0.03 | −0.003, 0.79 | 0.118, 0.08 | −0.004, 0.62 | −0.007, 0.49 |
| GVRS (per SD) | −0.097, 0.01 | −0.054, 0.15 | −0.071, 0.03 | −0.230, <0.0001 | −0.067, 0.08 | −0.100, 0.01 | −0.028, 0.32 | −0.079, 0.03 |
Controlling for age, sex, years of education, time from baseline to neurocognitive assessment
Additionally controlling for initial performance and time between assessments
Table 5 shows the R2 values, representing the percentage of variability in the cognitive outcomes explained by the vascular risk factors in the respective models. The R2 values were similar in fully-adjusted models that included the CAIDE score vs. the GVRS. In fact, the percentage of variability explained by the models including the vascular risk factors was similar to that explained just by socio-demographics (age, sex, years of education) and time span between cognitive assessments. In univariable models, the CAIDE score explained more variability in initial executive function and semantic memory, while the GVRS explained more variability in initial episodic memory and processing speed.
Table 5.
Variability of cognitive variables explained across models.
| Initial performance | Change over time* | |||||||||
|---|---|---|---|---|---|---|---|---|---|---|
| R2 | Global Cognition | Executive function | Episodic memory | Semantic memory | Processing Speed | Global Cognition | Executive function | Episodic memory | Semantic memory | Processing Speed |
| Covariates: Age, sex, education, time span | 0.47 | 0.31 | 0.30 | 0.37 | 0.32 | 0.17 | 0.23 | 0.18 | 0.12 | 0.15 |
| CAIDE without APOE | 0.19 | 0.15 | 0.09 | 0.14 | 0.11 | 0.02 | 0.17 | 0.06 | 0.04 | 0.06 |
| Full CAIDE score | 0.24 | 0.18 | 0.11 | 0.18 | 0.12 | 0.03 | 0.17 | 0.06 | 0.05 | 0.07 |
| Full CAIDE + covariates | 0.47 | 0.32 | 0.30 | 0.37 | 0.32 | 0.16 | 0.22 | 0.19 | 0.11 | 0.15 |
| GVRS | 0.13 | 0.03 | 0.12 | 0.03 | 0.17 | 0.18 | 0.18 | 0.15 | 0.08 | 0.10 |
| GVRS + covariates | 0.48 | 0.32 | 0.30 | 0.37 | 0.34 | 0.18 | 0.24 | 0.20 | 0.13 | 0.15 |
Additionally controlling for initial performance and time between cognitive assessments
Discussion
In the multi-ethnic population-based NOMAS cohort, the CAIDE dementia risk score was not robustly associated with decline over time in cognitive performance, though there was a modest association with worse cognitive performance at initial assessment. In fact, the full CAIDE score was only inversely associated with executive function and processing speed at the initial cognitive assessment. In contrast, the NOMAS global vascular risk score (GVRS), created to test whether the inclusion of behavioral and anthropometric risk factors and continuous measures better predicted risk of clinical vascular events (e.g. stroke and MI) than other risk scores, was a strong predictor of global cognition, particularly of executive function, semantic memory and processing speed at initial assessment as well as decline in global cognition, episodic memory and processing speed. Although the relationship between the GVRS and cognitive health appeared more pronounced in APOE4 non-carriers, the public health message should emphasize the great importance of reducing vascular risk factors and promoting healthy lifestyle to prevent cognitive decline and dementia for all and regardless of APOE4 genotype.
Our findings are consistent with the observations in the British Whitehall II cohort, which found the Framingham general cardiovascular disease risk score and the Framingham stroke risk score to be more related to cognitive decline than the CAIDE score [15]. We focused this study on the CAIDE dementia risk score as it is the most well-established multivariable prediction tool for dementia, and on the NOMAS GVRS rather than the Framingham scores because the GVRS has superior predictive ability for clinical vascular events in diverse study populations with a high proportion of Hispanics and blacks compared to the primarily white Framingham population [16].
The GVRS was inversely associated with initial cognitive performance and with greater cognitive decline among APOE4 non-carriers, though the relationships among APOE4 carriers were no longer significant after adjusting for age and education. Of note, the mean GVRS was the same in APOE4 carriers and non-carriers (data not shown). A possible explanation for this finding is that the APOE4 carrier status may have accounted for most of the variance associated with cognitive aging, overwhelming the variance associated with the GVRS. For example, an earlier onset of age-related cognitive decline and more rapid progression of cognitive decline in “normal aging” was reported among APOE4 carriers than non-carriers [26]. The interactions between vascular risk factors, age, and ApoE4 status on cognitive performance is complex and still remains to be fully characterized. Although clearly there are age and risk factor differences in cognitive decline that are modified by APOE genotype, there is considerable variability in cognitive performance and in the risk of cognitive decline that is not explained by either APOE genotype or vascular risk factors, possibly suggesting that the underlying biological aging process is the main driver.
Possible explanations for the divergent findings between the association of CAIDE and GVRS with cognitive change may lie in the balance between practice effects from repeated testing in longitudinal studies, resulting in improved cognitive performance, and the effect of vascular risk factors on cognition at baseline and longitudinally [27]. For example, the vascular risk measured by the GVRS may be substantially greater than the vascular risk measured by the CAIDE score. In this scenario, the corresponding effects on cognitive performance would be greater with the GVRS than the CAIDE score, potentially overwhelming the practice effects on cognitive performance in the case of GVRS, but not in the case of CAIDE score. Also, in Table 4 the GVRS was negatively associated with executive function, semantic memory and processing speed, but not with episodic memory at baseline. However, the GVRS was negatively associated with episodic memory at follow-up, about six years later. While it is possible this finding of a delayed association between the GVRS score and lower scores with episodic memory only at follow-up, may be at random and inconsequential, it is also possible that the delayed onset of episodic memory impairment in association with GVRS scores may point to the known risk of neurodegeneration associated with the prolonged presence of clinical and subclinical cerebrovascular disease [28].
One reason for the stronger association between the GVRS and cognition compared to the CAIDE score is the fact that the GVRS includes race/ethnicity in its score. Blacks and Hispanics in NOMAS have worse cognitive performance compared to whites in NOMAS. However, there was no evidence of effect modification by race/ethnicity for the associations between the GVRS and CAIDE score with cognition. Since the mean age at NOMAS baseline was over age 60 it may be that the most sensitive period during which vascular risk factors impact future cognitive health was missed for the majority of participants in the current study. The CAIDE score was developed to predict dementia and Alzheimer’s Disease using midlife risk factors [12], and it has been previously validated as a predictive tool for dementia up to 40 years later in a multiethnic cohort that included non-Hispanic whites, blacks, and Asians [29]. Though the CAIDE score may well predict clinical dementia and Alzheimer’s Disease, it may be too simplistic to effectively predict subclinical age-related cognitive dysfunction and decline.
It is interesting to note that in univariate analyses the CAIDE score explained a greater percentage of the variance for semantic memory and executive function than the GVRS, and the GVRS explained a greater percentage of the variance for processing speed and episodic memory. Consistently across NOMAS studies we have observed that processing speed is the domain most sensitive to vascular risk factors [30]. There were multiple vascular risk factors included in the GVRS that were only associated with the processing speed domain, including peripheral vascular disease and hypertension medication use, which may account for the strong relationship between the GVRS and processing speed. However, the fact that the CAIDE score included education attainment while the GVRS did not likely contributed to CAIDE’s superior performance in explaining the variance in executive function and global cognition in unadjusted models.
Although the current study shows that the GVRS has a stronger association with cognitive function over a mean of 6 years of followup compared to the CAIDE score after adjusting for sociodemographics, it is important to note that these two scores were created with different goals. The CAIDE score was designed as a simple and useful tool to predict future dementia risk that includes a small set of dichotomous variables easily identified and collected by physicians in routine standard of care practices, with the exception of APOE4 carrier status. Its utility as a tool that physicians can easily use with patients to help inform dementia risk is noteworthy and important. The results of the current study do not suggest that the CAIDE score should be abandoned as a dementia prediction tool for physician use. In contrast, the GVRS is a more complex algorithm designed to predict clinical vascular events, including vascular death. Therefore, GVRS maybe be used as an add-on tool to aid in prediction of cognitive performance and cognitive decline, especially among individuals with a high burden of vascular risk factors.
The American Heart Association’s “Life’s Simple 7” metric, developed to represent the AHA’s definition of ideal cardiovascular health, is also considered to be a cardiovascular disease risk score, and includes the following modifiable risk factors: smoking, body mass index, physical activity, diet, blood pressure, total cholesterol, and fasting glucose. In our previous study, NOMAS participants who achieved more ideal CVH metrics had better cognitive performance and less decline over time [30]. A greater number of ideal CVH factors was associated with a reduced burden of several biomarkers of brain aging [30]. The association between Life’s Simple 7 and cognition also demonstrated no effect modification by race/ethnicity. The relationship between the Life’s Simple 7 metric and cognitive health was most apparent in relation to processing speed, similar to the GVRS, and appeared to be driven in particular by the smoking and fasting glucose components, which are vascular risk factors included in the GVRS but not in the CAIDE score. Physical activity was also an important variable included in both the GVRS and in the CAIDE score. In a separate in-depth analysis of physical activity in NOMAS, participants who were cognitively healthy at initial assessment and engaged in moderate-heavy physical activity had less decline over time in processing speed and episodic memory than those who reported lower engagement in physical activity [31].
Modifiable vascular risk factors (VRF) cause a derangement in extracranial or intracranial vessel architecture leading to arterial dysfunction, which can be responsible for an early subclinical age-related cerebrovascular brain changes (e.g., white matter disease and silent brain infarcts), and vascular cognitive impairment and dementia [32,33]. The mechanism linking vascular risk factors to vascular changes in cognitive aging are multi-factorial and include complex inflammatory, immune, infectious, and metabolic pathways with genetic and epigenetic contributions. VRF also have been linked with neurodegeneration and the greater Alzheimer’s Disease pathology in cognitively healthy older adults, and with dementia-related brain changes on MRI, including white matter hyperintensities and brain atrophy [30, 34–37]. In the current study we observed differences in cerebral volume as a percentage of head size between those with low and high GVRS such that those with a higher GVRS had lower cerebral volume, while there was no difference in cerebral volume between those with a low and high CAIDE score. These findings suggest that GVRS may be a more sensitive to detect the biological brain aging processes than CAIDE. We also found that less than 50% of the variability in cognitive performance at the first assessment was explained by demographics and vascular risk scores, underscoring the importance of other risk factors not examined in our study. Sociocultural and economic status, diet, psychosocial factors, stress, environmental exposures, and cognitive reserve are likely important factors in predicting cognitive function beyond VRF. Future studies are needed to elucidate the biological mechanisms through which the burden of vascular risk factors impact cognitive performance and trajectories.
It should be noted that the GVRS was created in the full NOMAS cohort, and therefore the study population used in the current analysis was part of that used to create the GVRS originally. Due to the strong association between cognitive health and vascular disease risk, it is possible that the association between GVRS and cognition in the current study in which the GVRS was created may be stronger than that observed in other study populations. Because strokes can impact cognitive performance and decline, and because the GVRS was created to predict stroke and other vascular events, we examined the relationships between both the GVRS and CAIDE with incident strokes that accrued during cognitive followup in this study. As expected, we found that a larger number of participants who were above the median for the GVRS experienced a stroke during cognitive followup, though the absolute numbers remained small. To rule out the possibility that this may have driven the conclusions we ran sensitivity analyses excluding those people who experienced a stroke during cognitive followup (N=55), and we found the unadjusted associations between the GVRS and CAIDE scores with global cognitive change remained consistent.
The inclusion of a diverse population-based cohort, its longitudinal follow up, and the comprehensive neuropsychological assessments are key strengths of the current study. Residual confounding by socioeconomic status and cognitive reserve as well as other unmeasured risk factors for cognitive health are potential sources of bias in this observational study. This study was conducted in the MRI subcohort, which was younger and overall healthier at baseline compared to the full NOMAS cohort. However, in models adjusting for age, sex, and education, there was no significant difference in the GVRS nor the CAIDE score between those in the MRI subcohort and those not, suggesting that selection bias was unlikely. An additional limitation is the current lack of information on confirmed cases of dementia in this cohort. Future studies with additional follow-up will be important to better understand the relationship between vascular health and trajectories of cognitive change and devise valid scoring systems for better prediction of early cognitive dysfunction and vascular cognitive impairment and dementia.
Acknowledgements
Study funding: This study was supported by National Institutes of Health/National Institute of Neurological Disorders and Stroke (R01 NS 29993) and the Evelyn F. McKnight Brain Institute.
Footnotes
Disclosures: none
References
- 1.Baumgart M, Snyder HM, Carrillo MC, Fazio S, Kim H, Johns H (2015) Summary of the evidence on modifiable risk factors for cognitive decline and dementia: A population-based perspective. Alzheimers Dement 11, 718–726. [DOI] [PubMed] [Google Scholar]
- 2.Hui DS, Morley JE, Mikolajczak PC, Lee R (2015) Atrial fibrillation: A major risk factor for cognitive decline. Am Heart J 169, 448–456. [DOI] [PubMed] [Google Scholar]
- 3.Khatri M, Nickolas T, Moon YP, Paik MC, Rundek T, Elkind MS, Sacco RL, Wright CB (2009) CKD associates with cognitive decline. J Am Soc Nephrol 20, 2427–2432. [DOI] [PMC free article] [PubMed] [Google Scholar]
- 4.Gardener H, Caunca MR, Dong C, Cheung YK, Elkind MSV, Sacco RL, Rundek T, Wright CB (2017) Ultrasound Markers of Carotid Atherosclerosis and Cognition: The Northern Manhattan Study. Stroke 48, 1855–1861. [DOI] [PMC free article] [PubMed] [Google Scholar]
- 5.Weimar C, Winkler A, Dlugaj M, Lehmann N, Hennig F, Bauer M, Kröger K, Kälsch H, Mahabadi AA, Dragano N, Moebus S, Hoffmann B, Jöckel KH, Erbel R; Heinz Nixdorf Recall Study Investigative Group (2015) Ankle-Brachial Index but Neither Intima Media Thickness Nor Coronary Artery Calcification is Associated With Mild Cognitive Impairment. J Alzheimers Dis 47, 433–442. [DOI] [PubMed] [Google Scholar]
- 6.Hutter I, Kovacicova L, Jacomella V, Husmann M, Clemens R, Amann-Vesti B (2015) Cognitive function in patients with peripheral artery disease: a prospective single-center cohort study. Int Angiol 34, 459–466. [PubMed] [Google Scholar]
- 7.Wändell P, Carlsson AC, Sundquist J, Sundquist K (2018) The association between relevant comorbidities and dementia in patients with atrial fibrillation. Geroscience. [DOI] [PMC free article] [PubMed] [Google Scholar]
- 8.Wolters FJ, Segufa RA, Darweesh SKL, Bos D, Ikram MA, Sabayan B, Hofman A, Sedaghat S (2018) Coronary heart disease, heart failure, and the risk of dementia: A systematic review and meta-analysis. Alzheimers Dement 14, 1493–1504. [DOI] [PubMed] [Google Scholar]
- 9.Sundbøll J, Horváth-Puhó E, Adelborg K, Schmidt M, Pedersen L, Bøtker HE, Henderson VW, Toft Sørensen H (2018) Higher Risk of Vascular Dementia in Myocardial Infarction Survivors. Circulation 137, 567–577. [DOI] [PubMed] [Google Scholar]
- 10.Schievink SHJ, van Boxtel MPJ, Deckers K, van Oostenbrugge RJ, Verhey FRJ, Köhler S (2017) Cognitive changes in prevalent and incident cardiovascular disease: a 12-year follow-up in the Maastricht Aging Study (MAAS). Eur Heart J. [DOI] [PubMed] [Google Scholar]
- 11.Vieira JR, Elkind MS, Moon YP, Rundek T, Boden-Albala B, Paik MC, Sacco RL, Wright CB (2011) The metabolic syndrome and cognitive performance: the Northern Manhattan Study. Neuroepidemiology 37, 153–159. [DOI] [PMC free article] [PubMed] [Google Scholar]
- 12.Kivipelto M, Ngandu T, Laatikainen T, Winblad B, Soininen H, Tuomilehto J (2006) Risk score for the prediction of dementia risk in 20 years among middle aged people: a longitudinal, population-based study. Lancet Neurol 5, 735–741. [DOI] [PubMed] [Google Scholar]
- 13.Nishtala A, Preis SR, Beiser A, Devine S, Hankee L, Seshadri S, Wolf PA, Au R (2014) Midlife cardiovascular risk impacts executive function: Framingham offspring study. Alzheimer Dis Assoc Disord 28, 16–22 [DOI] [PMC free article] [PubMed] [Google Scholar]
- 14.Unverzagt FW, McClure LA, Wadley VG, Jenny NS, Go RC, Cushman M, Kissela BM, Kelley BJ, Kennedy R, Moy CS, Howard V, Howard G (2011) Vascular risk factors and cognitive impairment in a stroke-free cohort. Neurology 77, 1729–1736 [DOI] [PMC free article] [PubMed] [Google Scholar]
- 15.Kaffashian S, Dugravot A, Elbaz A, Shipley MJ, Sabia S, Kivimäki M, Singh-Manoux A (2013) Predicting cognitive decline: a dementia risk score vs. the Framingham vascular risk scores. Neurology 80, 1300–1306 [DOI] [PMC free article] [PubMed] [Google Scholar]
- 16.Sacco RL, Khatri M, Rundek T, Xu Q, Gardener H, Boden-Albala B, Di Tullio MR, Homma S, Elkind MS, Paik MC (2009) Improving global vascular risk prediction with behavioral and anthropometric factors. The multiethnic NOMAS (Northern Manhattan Cohort Study). J Am Coll Cardiol 54, 2303–2311. [DOI] [PMC free article] [PubMed] [Google Scholar]
- 17.Warsch JR, Rundek T, Paik MC, Elkind MS, Sacco RL, Wright CB (2013) Association between northern Manhattan study global vascular risk score and successful aging. J Am Geriatr Soc 61, 519–524. [DOI] [PMC free article] [PubMed] [Google Scholar]
- 18.Sacco RL, Anand K, Lee HS, Boden-Albala B, Stabler S, Allen R, Paik MC (2004) Homocysteine and the risk of ischemic stroke in a triethnic cohort: the NOrthern MAnhattan Study. Stroke 35, 2263–2269. [DOI] [PubMed] [Google Scholar]
- 19.Wallman KK, Hodgdon J (1977) Race and ethnic standards for Federal statistics and administrative reporting. Stat Report, 450–454. [PubMed] [Google Scholar]
- 20.Sacco RL, Elkind M, Boden-Albala B, Lin IF, Kargman DE, Hauser WA, Shea S, Paik MC (1999) The protective effect of moderate alcohol consumption on ischemic stroke. JAMA 281, 53–60. [DOI] [PubMed] [Google Scholar]
- 21.Kargman DE, Sacco RL, Boden-Albala B, Paik MC, Hauser WA, Shea S (1999) Validity of telephone interview data for vascular disease risk factors in a racially mixed urban community: the Northern Manhattan Stroke Study. Neuroepidemiology 18, 174–184. [DOI] [PubMed] [Google Scholar]
- 22.Willey JZ, Moon YP, Paik MC, Boden-Albala B, Sacco RL, Elkind MS (2009) Physical activity and risk of ischemic stroke in the Northern Manhattan Study. Neurology 73, 1774–1779. [DOI] [PMC free article] [PubMed] [Google Scholar]
- 23.Wright CB, Gardener H, Dong C, Yoshita M, DeCarli C, Sacco RL, Stern Y, Elkind MS (2015) Infectious Burden and Cognitive Decline in the Northern Manhattan Study. J Am Geriatr Soc 63, 1540–1545. [DOI] [PMC free article] [PubMed] [Google Scholar]
- 24.Gardener H, Caunca M, Dong C, Cheung YK, Alperin N, Rundek T, Elkind MSV, Wright CB, Sacco RL (2018) Ideal Cardiovascular Health and Biomarkers of Subclinical Brain Aging: The Northern Manhattan Study. J Am Heart Assoc 7, e009544. [DOI] [PMC free article] [PubMed] [Google Scholar]
- 25.Ecay-Torres M, Estanga A, Tainta M, Izagirre A, Garcia-Sebastian M, Villanua J, Clerigue M, Iriondo A, Urreta I, Arrospide A, Díaz-Mardomingo C, Kivipelto M, Martinez-Lage P (2018) Increased CAIDE dementia risk, cognition, CSF biomarkers, and vascular burden in healthy adults. Neurology 91, e217–e226 [DOI] [PubMed] [Google Scholar]
- 26.Caselli RJ, Dueck AC, Osborne D, Sabbagh MN, Connor DJ, Ahern GL, Baxter LC, Rapcsak SZ, Shi J, Woodruff BK, Locke DE, Snyder CH, Alexander GE, Rademakers R, Reiman EM (2009) Longitudinal modeling of age-related memory decline and the APOE epsilon4 effect. N Engl J Med 361, 255–263. [DOI] [PMC free article] [PubMed] [Google Scholar]
- 27.Bartels C, Wegrzyn M, Wiedl A, Ackermann V, Ehrenreich H (2010) Practice effects in healthy adults: A longitudinal study on frequent repetitive cognitive testing. BMC Neurosci 11, 118. [DOI] [PMC free article] [PubMed] [Google Scholar]
- 28.Gottesman RF, Schneider AL, Zhou Y, Coresh J, Green E, Gupta N, Knopman DS, Mintz A, Rahmim A, Sharrett AR, Wagenknecht LE, Wong DF, Mosley TH (2017) Association Between Midlife Vascular Risk Factors and Estimated Brain Amyloid Deposition. JAMA 317, 1443–1450. [DOI] [PMC free article] [PubMed] [Google Scholar]
- 29.Exalto LG, Quesenberry CP, Barnes D, Kivipelto M, Biessels GJ, Whitmer RA (2014) Midlife risk score for the prediction of dementia four decades later. Alzheimers Dement 10, 562–570. [DOI] [PubMed] [Google Scholar]
- 30.Gardener H, Wright CB, Dong C, Cheung K, DeRosa J, Nannery M, Stern Y, Elkind MS, Sacco RL (2016) Ideal Cardiovascular Health and Cognitive Aging in the Northern Manhattan Study. J Am Heart Assoc 5, e002731. [DOI] [PMC free article] [PubMed] [Google Scholar]
- 31.Willey JZ, Gardener H, Caunca MR, Moon YP, Dong C, Cheung YK, Sacco RL, Elkind MS, Wright CB (2016) Leisure-time physical activity associates with cognitive decline: The Northern Manhattan Study. Neurology 86, 1897–1903. [DOI] [PMC free article] [PubMed] [Google Scholar]
- 32.Pool LR, Weuve J, Wilson RS, Bültmann U, Evans DA, Mendes de Leon CF (2016) Occupational cognitive requirements and late-life cognitive aging. Neurology 86, 1386–1392. [DOI] [PMC free article] [PubMed] [Google Scholar]
- 33.Gutierrez J, Kulick E, Park Moon Y, Dong C, Cheung K, Ahmet B, Stern Y, Alperin N, Rundek T, Sacco RL, Wright CB, Elkind MSV (2018) Brain Arterial Diameters and Cognitive Performance: The Northern Manhattan Study. J Int Neuropsychol Soc 24, 335–346. [DOI] [PMC free article] [PubMed] [Google Scholar]
- 34.Vuorinen M, Spulber G, Damangir S, Niskanen E, Ngandu T, Soininen H, Kivipelto M, Solomon A (2015) Midlife CAIDE dementia risk score and dementia-related brain changes up to 30 years later on magnetic resonance imaging. J Alzheimers Dis 44, 93–101. [DOI] [PubMed] [Google Scholar]
- 35.Stephen R, Liu Y, Ngandu T, Rinne JO, Kemppainen N, Parkkola R, Laatikainen T, Paajanen T, Hänninen T, Strandberg T, Antikainen R, Tuomilehto J, Keinänen Kiukaanniemi S, Vanninen R, Helisalmi S, Levälahti E, Kivipelto M, Soininen H, Solomon A (2017) Associations of CAIDE Dementia Risk Score with MRI, PIB-PET measures, and cognition. J Alzheimers Dis 59, 695–705. [DOI] [PMC free article] [PubMed] [Google Scholar]
- 36.Enache D, Solomon A, Cavallin L, Kåreholt I, Kramberger MG, Aarsland D, Kivipelto M, Eriksdotter M, Winblad B, Jelic V (2016) CAIDE Dementia Risk Score and biomarkers of neurodegeneration in memory clinic patients without dementia. Neurobiol Aging 42, 124–31. [DOI] [PubMed] [Google Scholar]
- 37.Gomez G, Beason-Held LL, Bilgel M, An Y, Wong DF, Studenski S, Ferrucci L, Resnick SM (2018) Metabolic Syndrome and Amyloid Accumulation in the Aging Brain. J Alzheimers Dis 65, 629–639. [DOI] [PMC free article] [PubMed] [Google Scholar]