

Abstract
High digital connectivity and a focus on reproducibility are contributing to an open science revolution in neuroscience. Repositories and platforms have emerged across the whole spectrum of subdisciplines, paving the way for a paradigm shift in the way we share, analyze, and reuse vast amounts of data collected across many laboratories. Here, we describe how open access web-based tools are changing the landscape and culture of neuroscience, highlighting six free resources that span subdisciplines from behavior to whole-brain mapping, circuits, neurons, and gene variants.
Keywords: online repositories, open access, open science, open source, neuroscience, web-based tools
Introduction
The basic structure of biomedical research sharing has not advanced as much as expected despite radical innovations in communication, computational capacity, and statistical and machine learning methods. One of the main impediments is that datasets and metadata are still fragmented, often poorly annotated, and evaporate quickly after publication (Williams, 2009). The same criticism can be levied against most software code in biomedical research (Prins et al., 2015; Gleeson et al., 2017). In this context, open science and data-sharing platforms are emerging across neuroscience disciplines, indelibly changing our approach to collaborative research. Open science can usher in a new era of efficient data pooling, global collaboration, and maximized data reusability and impact. Some tools also provide training opportunities, consequently serving as an avenue for research to directly impact public policy and public health (Zuccala, 2010; Sukhov et al., 2016). A growing number of free resources are rapidly coming online in neuroscience. Here, we describe six (Fig. 1): MouseBytes.ca for cognitive behavioral data analyses; MouseCircuits.org for rodent circuit mapping; WholeBrainSoftware.org for neuroanatomical analyses; the Allen Mouse Brain Connectivity Atlas at brain-map.org for mesoscale connectome analyses; NeuroMorpho.Org for digital reconstructions of neurons; and GeneNetwork.org for genetic analyses. Exemplifying the global reach, NeuroMorpho.Org contains data from 193 countries.
Figure 1.
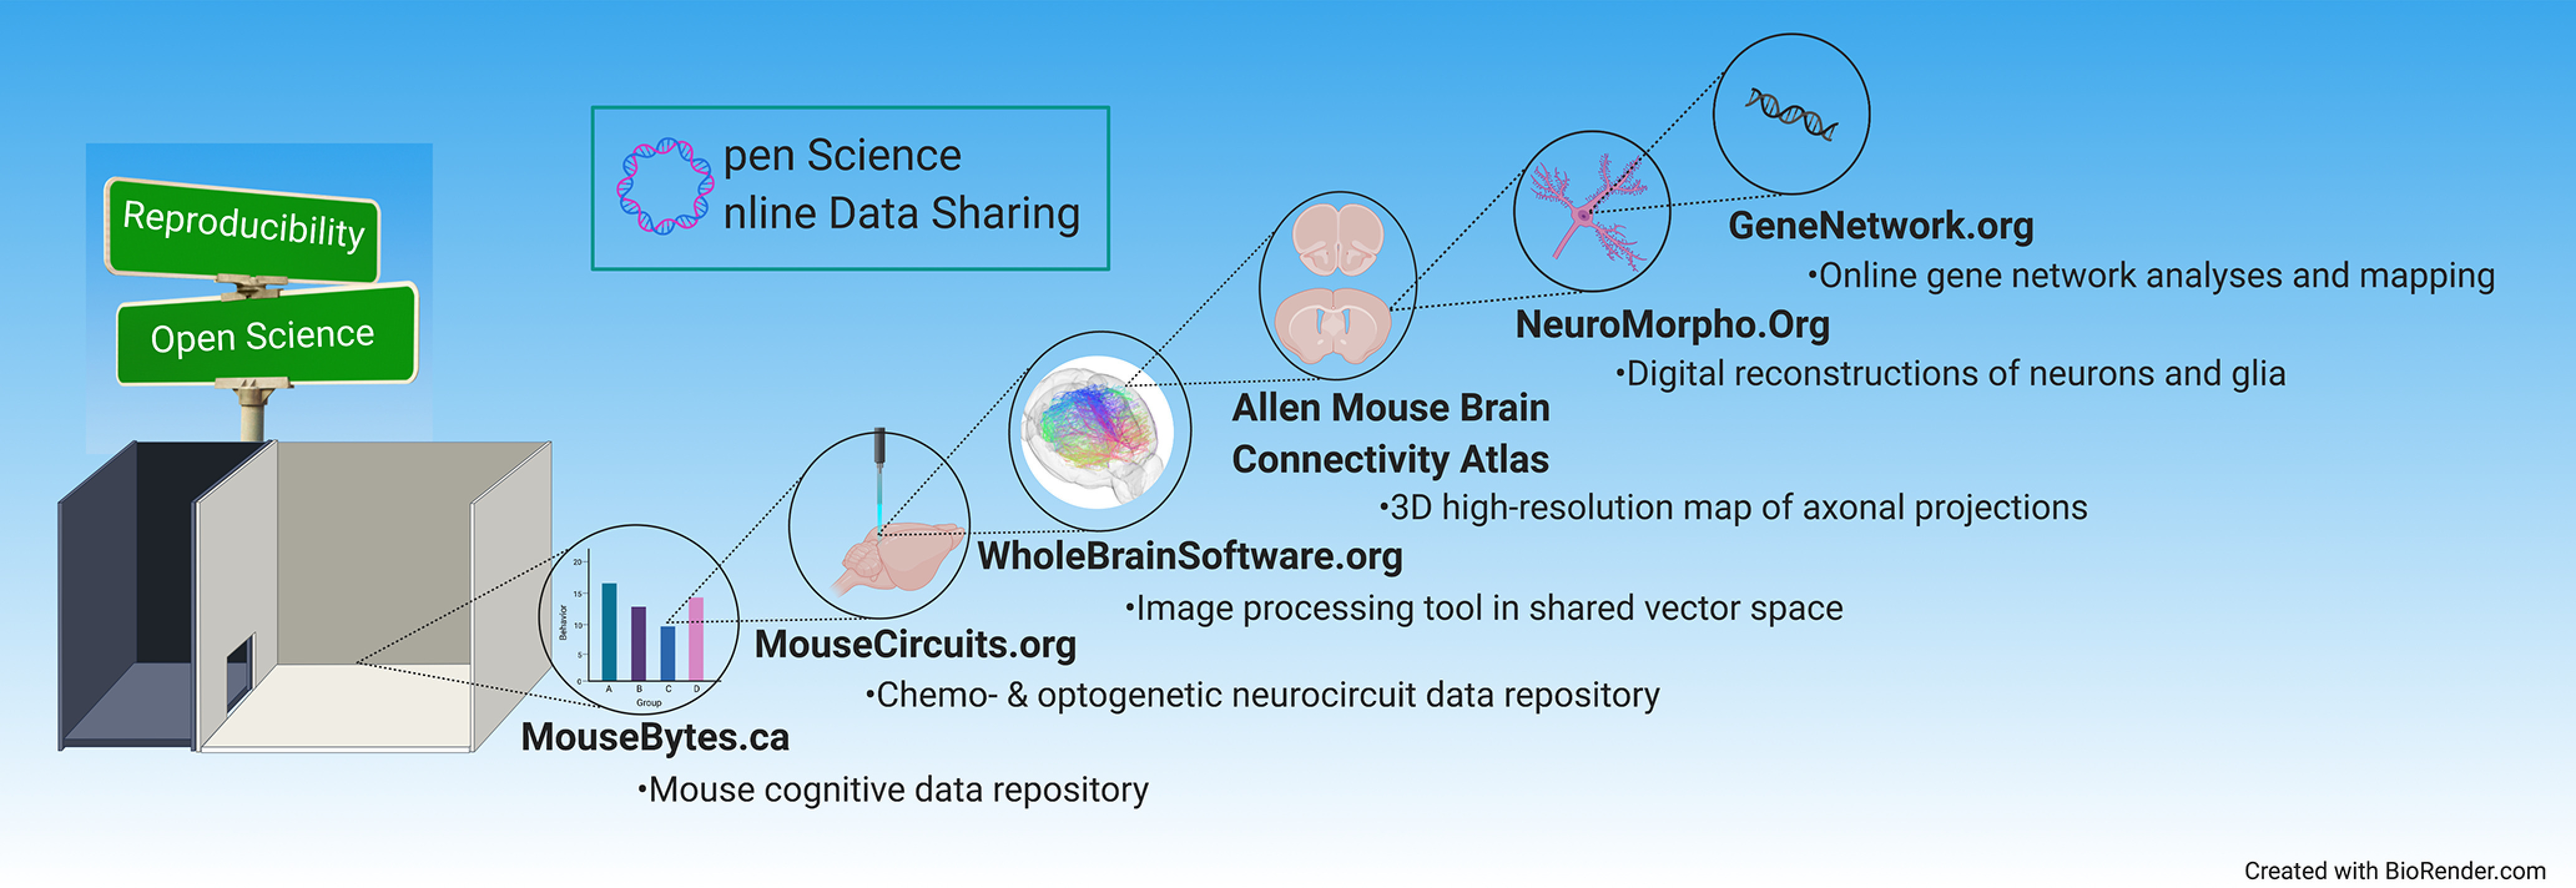
The new era of online open science data sharing. Data-sharing platforms are emerging across neuroscience disciplines, ushering in a new era of efficient data pooling, global collaboration, and maximized data reusability and impact. This review highlights six free resources that span subdisciplines from behavior to whole-brain mapping, circuits, neurons, and gene variants.
These platforms are instrumental in addressing the current reproducibility crisis. A recent survey reported that 70% of researchers were unable to reproduce the work of another group, and over half also reported being unable to reproduce an experiment performed in their own laboratory (Baker, 2016). Open science directly impacts many of the causes for low reproducibility, including the pressure to publish high-visibility studies, which can result in rushed experiments and hyped claims that are not supported by adequate replication before publication (Baker, 2016; McKiernan et al., 2016; Cuschieri et al., 2018).
Robust experimental design is key for reproducibility (Baker, 2016), but constraints of time, cost, and capacity make it challenging to carry out optimal experiments. Data repositories and web-based reanalysis tools now provide ways to compare and reevaluate results and conditions across studies, within and across laboratories, offering the possibility of gauging robustness of claims, often without further replication. Results that are similar across laboratories and trials become iteratively or externally validated. For instance, MouseBytes.ca allows users to analyze their own new behavioral data alongside the stored data of other researchers, providing quick feedback about whether control animals are behaving within the expected variance. Repositories also promote consensus building regarding critical elements for reproducibility in future experiments and consistent reporting of key experimental details.
The pressure to publish also contributes to the well described bias in favor of positive results (de Vries et al., 2018). Open science can equalize the visibility of negative and positive results, as repositories host data—published and even unpublished—without attaching value to any particular result or the impact factor of the journal. Last, heterogeneity in reagents, types of models, environments, and analytic tools can all result in fundamental experimental differences (Loscalzo, 2012). Open source tools such as the Allen Mouse Brain Connectivity Atlas, GeneNetwork.org, and WholeBrainSoftware.org enable researchers to compare and combine data on a wide range of core methods in neuroscience within a standard or even an intentionally heterogenized framework (Voelkl et al., 2020).
Access is an additional key factor to reproducibility. In 2016, the FAIR Data Principles were outlined by stakeholders from academia and beyond, including industry, funding bodies, and publishing houses (Wilkinson et al., 2016). Four principles were outlined with the goal of improving automated metadata analyses and equitable reuse of data: Findability, Accessibility, Interoperability, and Reusability. Open science web-based tools provide FAIR-compliant and free access to all comers, independent of geographic or social boundaries. This can be a great benefit for early career scientists, for whom the demand for high productivity is often coupled with modest resources, leading to increased risk of errors and increased risk of bias toward positive results (Fanelli et al., 2017; Munafò et al., 2017; Allen and Mehler, 2019). In this way, open science can also be part of a solution toward social equity. Although reaching equity is a complex and multifaceted issue (Hoppe et al., 2019), the increased use of open science can be an equalizer of resources for disadvantaged researchers who tend to be less well funded (Ginther et al., 2011; Hoppe et al., 2019).
MouseBytes.ca: open access database of cognitive behavioral data
Compared with the rapid generation of large open access datasets in other areas of neuroscience, such as neuroimaging (Biswal et al., 2010; Poldrack and Gorgolewski, 2014) and neuroanatomy (Ascoli, 2006, 2007; Oh et al., 2014; Kuan et al., 2015), behavioral data from animal models has lagged behind. One contributing factor has been the lack of standardized experiments and data output. Thanks to a new set of automated tests based on touchscreen technology (Mar et al., 2013) and used by over 300 laboratories worldwide, there is now potential for standardized outputs in animal behavioral neuroscience that are consistent with open access sharing. Automated touchscreen-based tests, which are similar to human tests, enable systematic high-throughput cognitive assessment with standardized outputs that can facilitate data reproducibility, analysis, and dissemination.
To leverage the development of a standardized cognitive assessment toolbox, the first ever open access database for translational research (Beraldo et al., 2019) was developed by a collaborative team of neuroscientists, neuroinformaticians, and touchscreen researchers at Western University. Launched in the summer of 2018, MouseBytes.ca is a fundamental step toward increasing the availability, transparency, and reproducibility of behavioral data, which to date have been notoriously difficult to reproduce (Bale et al., 2019). MouseBytes.ca is a user-friendly repository that uses advanced web technologies to connect the user to a repository of cognitive data, allowing researchers across the globe to preprocess, run automated quality control scripts, visualize, and analyze their data alone or alongside the stored data of other researchers. Furthermore, a unique link is generated for sharing the data of individual analyses, and this link can be added to publications to connect researchers directly with the raw data in MouseBytes.ca. Conversely, the DOI of a published manuscript is linked to datasets as metadata in MouseBytes.ca to help with the finding and retrieval of original data associated with a study.
Users can set the status of their data and experiments to either private or public in MouseBytes.ca. Data with public status can be shared under CC0 license, allowing neuroscientists to reuse, reanalyze, and share the data without any restriction, thus increasing reproducibility and facilitating new collaborative efforts that require big datasets. On the other hand, the accessibility and use of private data are limited to the owner of the data and those designated to have access by the owner. This protects the unpublished data of the researcher from being used without proper approvals while still allowing the use of the analytic resources within MouseBytes.ca.
Currently, MouseBytes.ca hosts 28 private and 8 public datasets and has been visited ∼1500 times. In the future, the team plans to build on the base software to incorporate neuroimaging data and recordings of neuronal activity in behaving mice; include cognitive analysis from other species, with a focus in deidentified human datasets; and develop novel algorithms that integrate different imaging and recording datasets. The goal of this relatively novel resource is to provide comprehensive multimodal analysis to accelerate discovery across disease contexts. The integration and use of MouseBytes.ca could revolutionize research in mouse cognitive neuroscience and lead to an iterative development of reliable and reproducible rodent behavioral data, especially with respect to control animal datasets, as similar results from across laboratories accumulate.
MouseCircuits.org: consolidated functional circuit-mapping data
Groundbreaking technological advances have allowed neuroscientists to control neural firing with impressive precision and specificity during behavior in rodents, allowing mechanistic dissection of various affective states (Deisseroth, 2011; Tye and Deisseroth, 2012; Roth, 2016; Whissell et al., 2016; DeNardo and Luo, 2017). While rapid progress followed the advent of these technologies, much of the amassed data exists in scientific silos, complicating efforts to compare across studies, laboratories, tools, and other key experimental details. MouseCircuits.org was established as an online platform to consolidate and integrate rapidly growing neurocircuit data for anxiety-, fear-, and depressive-like behavior through experimental summaries, landscape overviews, and a whole-brain perspective (Anderson and Dumitriu, 2020). Users can input their data with graphical displays updating in real time to provide the most up to date resource for the era of circuit mapping (Fig. 2).
Figure 2.
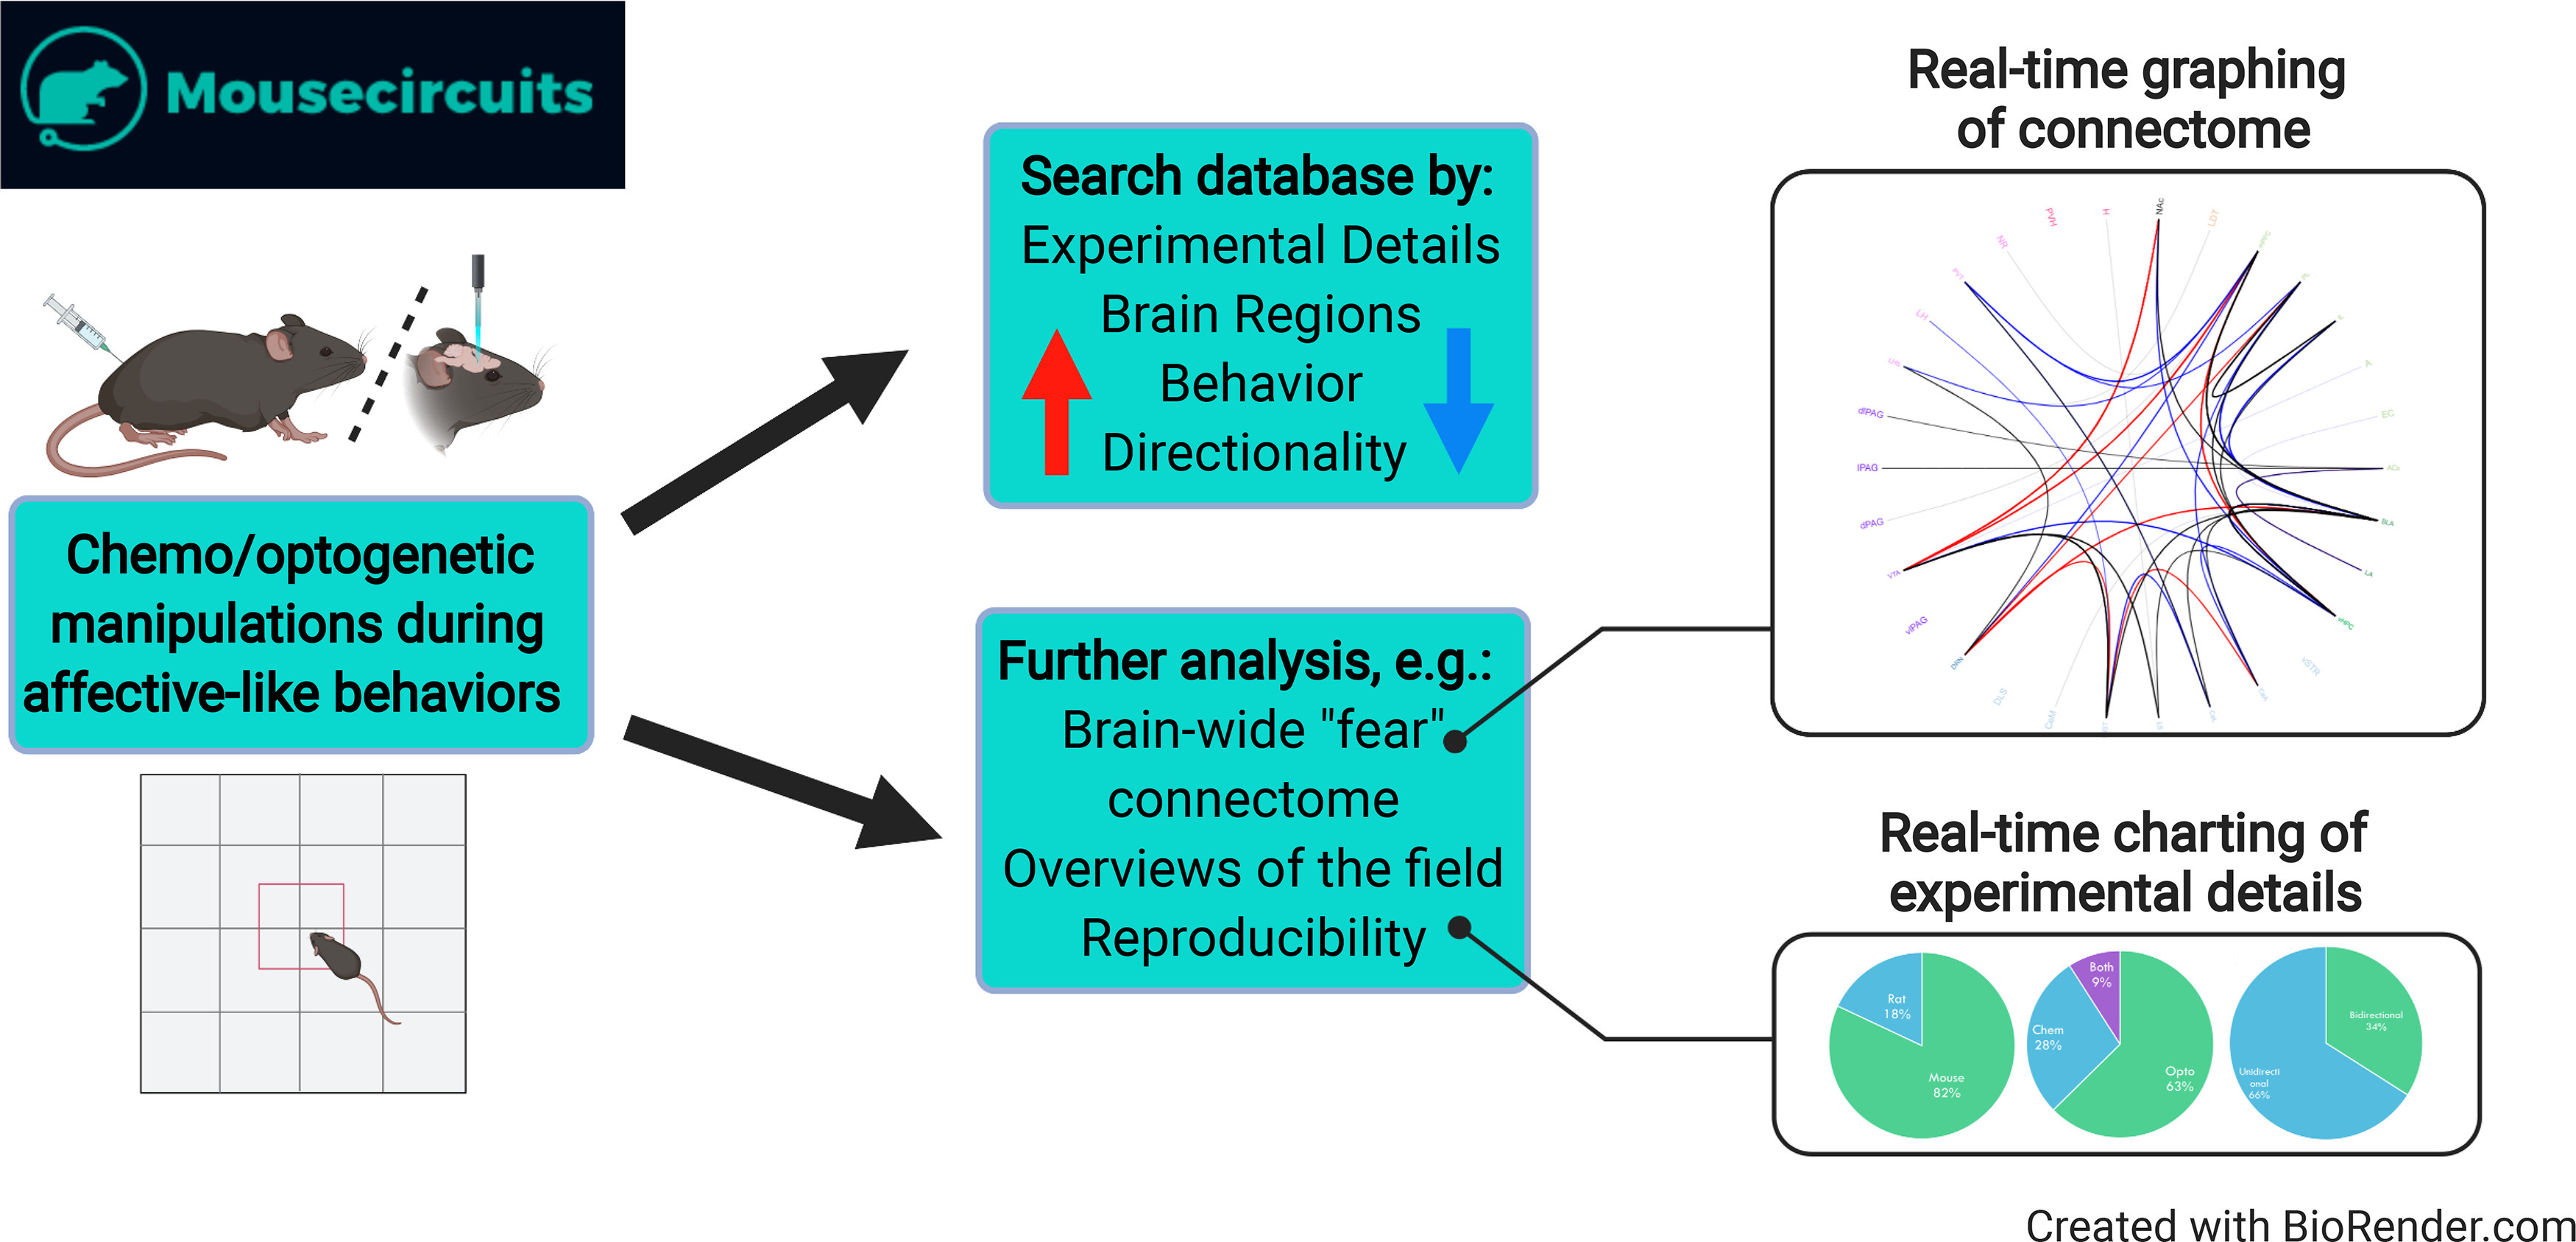
Overview of MouseCircuit.org pipeline. Data on optogenetic or chemogenetic manipulations during affective-like behaviors is entered into the database from literature searches or by user input. Users can search the database by experimental details (e.g., optogenetic vs chemogenetic manipulation or inhibition vs excitation), brain region or pathway of interest, type of behavior (currently available data for anxiety-like, depressive-like, and fear-like behaviors), and directionality of the effect of manipulation on behavior (e.g., increased vs decreased anxiety-like behavior). Real-time graphing and charting of brain-wide connectome, key experimental details, and trends in the field are available to users.
MouseCircuits.org provides a searchable brain-wide network that summarizes all the studies present in the platform. Users can search by affective domain, behavioral paradigm, experimental tool used, and more, depending on the unique question asked. This allows users to quickly view the rodent affective connectome dissected to date and to gauge the feasibility and novelty of planned experiments, which could potentially spark novel ideas that might not emerge from reading through hundreds of siloed articles. This type of bird's eye view also allows critical evaluation of the progress amassed to date. For example, the MouseCircuits.org dataset can be held up as a ruler to measure the relevance of rodent circuit dissection to human affective disorders. Are brain regions manipulated in rodent studies generally those implicated in human studies? If so, this resource can keep the translational field on-track to continued progress. If not, this bird's eye view could motivate the investigation of novel circuits.
A brain-wide view of the affective connectome also highlights pathways that replicate across studies and species, an integral component of the recently introduced Research Domain Criteria (RDoC) framework (Insel et al., 2010; Cuthbert, 2014, 2015; Meyers et al., 2017). RDoC posits that behavioral outputs, such as “fear” and “anxiety,” share genetic, environmental, developmental, and neurocircuit etiology across both diseases and species. The availability of a centralized database for circuit maps will therefore help with both consensus building on the precise relationship between individual circuits and behavioral outputs, as well as early identification of incongruencies, which may help to determine the origins of experimental variance, the contribution of various states to behavioral output, and how the precise activity of specific individual neurons alter behavior.
MouseCircuits.org also offers summary tables that provide many of the key details of experimental designs. Tables are searchable, enabling quick identification of relevant literature for a planned experiment. Such tables might increase transparency and standardization of reported methods, ultimately improving reproducibility. Separate tabs for regional and pathway-specific manipulations contain graphical representation of current trends in the field. This includes information on the most studied brain regions, the types of manipulations and behaviors used, manipulated cell types, and the sexes of rodents studied. This can highlight both the immense progress amassed and the remaining knowledge gaps. For example, the current landscape highlights the need for increased use of female rodents, replication studies both within and across laboratories, enhanced heterogeneity of neuronal populations studied (the majority of studies to date target excitatory neurons), and experiments targeting the interactions between different cell types within a region or pathway. Overall, this integrative view of circuit mapping can lead to novel theories on individual neurocircuit function and whole-brain network organization, and the generation of hypotheses for how manipulations of specific circuits might affect upstream and downstream circuits.
Future collaborations will expand MouseCircuits.org beyond affective-like behaviors, such as those employed in cognitive or addiction studies. It is envisioned that MouseCircuits.org can support the shared vision of circuit dissection that ultimately leads to the prevention and treatment of human disorders. Wide adoption of this resource will connect rodent data, in which perturbation is possible, to human data, the motivation for all rodent stress work.
WholeBrainSoftware.org: from single molecules to mesoscale structures
Rapid development is pushing the technical limitations of current circuit and genetic lineage tracing techniques (Kalhor et al., 2018; Kornfeld and Denk, 2018; Huang et al., 2020), but neuroscientists are still largely limited in their ability to probe mesoscale brain function. For example, there is to date no single method that can deliver the complete input/output map of a circuit, including its synaptic weights and identities. Until molecular techniques have caught up to the theoretical questions neuroscientists wish to answer, the natural question from a data science perspective is: what does an ideal dataset look like and what is its data structure? At a minimum, an ideal dataset would contain connections among neurons, connection strength and type, information on cell type, the developmental lineage history, functional measurements over time, and molecular changes over time (Church et al., 2015). It is with these kinds of data structures, and with agnosticism for techniques used to generate the data, that WholeBrainSoftware.org was developed (Fürth et al., 2018). This agnosticism made it fairly straightforward to adapt WholeBrainSoftware.org to handle the data from new sequencing technologies, enabling researchers to label long-range projections from thousands of cells at single-neuron resolution in the brain from a single animal (Huang et al., 2020).
WholeBrainSoftware.org is a C/C++ image-processing code base with an interface to the statistical language R, as well as JavaScript. The software has an active and growing userbase scattered across the globe (Fig. 3A). The data structures of WholeBrainSoftware.org are similar to how spatial data on maps are handled by Geographical Information Systems (GIS). A neuroanatomical information system that is built around plastic vector graphics rather than static voxel- or pixel-based atlases enables rapid updating of anatomic entities, and their relations and attributes, while keeping a record of those changes. This is important because the exact definition of brain regions is based on consensus within the scientific community and can therefore change over time. Currently, the Allen CCFv3 (Wang et al., 2020) is the default atlas used by the majority of users (see below). Atlases for multiple model organisms can easily be managed at any resolution, from the mesoscale to the single-molecule subcellular level (Fig. 3B).
Figure 3.
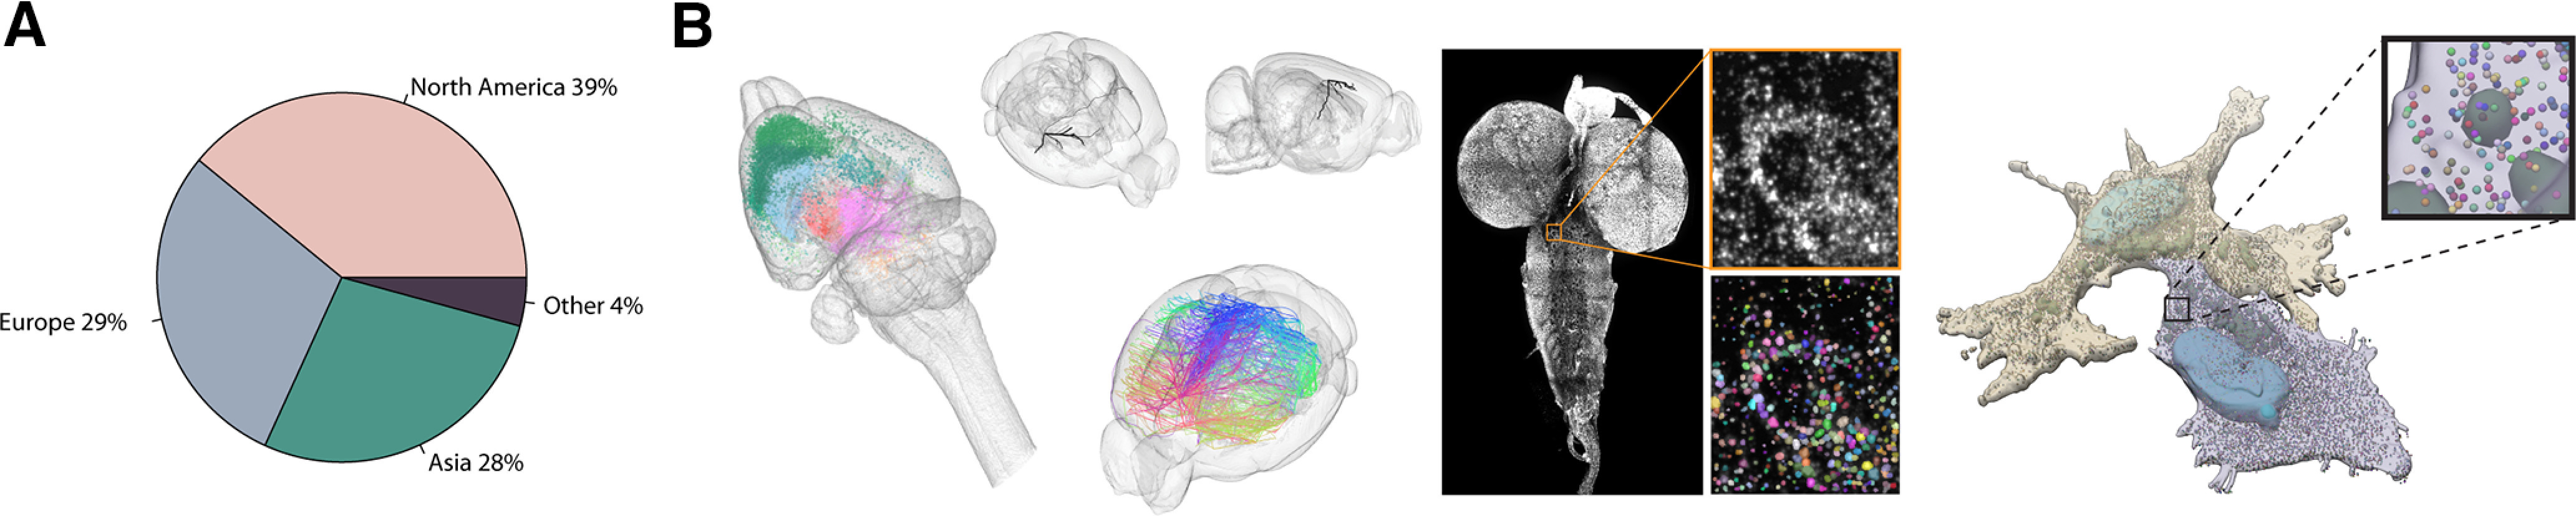
WholeBrainSoftware.org enables anatomic maps in different model systems from mesoscale to single-molecule level. A, WholeBrainSoftware.org userbase spans the entire globe. B, Examples of WholeBrainSoftware.org-generated datasets. Left to right, Monosynaptic input tracing in the rat brain (Choi et al., 2020). Mesoscale projection patterns of the cortex in a single mouse brain (Huang et al., 2020). A single mesoscale projection with bar code density represented by vertex thickness shown for clarity. In situ sequencing of the entire Drosophila melanogaster third instar larvae brain. Subcellular single-molecule RNA sequencing in two human astrocytes at the level of individual granules.
Current and future developments for WholeBrainSoftware.org include enabling the description of neuroanatomical hierarchies and architectures in compact models, akin to the neural network architectures used in libraries such as Pytorch or Tensorflow. To enhance usability given that most neuroscientists do not have significant programming skills, developments in WebAssembly and WebGL will be key. This will allow users to generate self-contained code from any language with the only requirement being a web browser.
Allen Mouse Brain Connectivity Atlas
The Allen Mouse Brain Connectivity Atlas project is an open access large-scale brain-mapping effort. The ultimate goal of this project was to provide a comprehensive, quantitative, directional description of brain-wide anatomic wiring patterns at the level of cell classes (i.e., a mesoscale connectome; Bohland et al., 2009). The Atlas is a three-dimensional, high-resolution map of axonal projections across the mouse brain, built using genetic tools, including an array of transgenic mice. To achieve this, a protocol was established for systematic, standardized viral tracer injections, serial two-photon tomography imaging and an informatics pipeline to generate a large database of mouse neural projections from ∼300 distinct brain regions (Oh et al., 2014; Kuan et al., 2015). Today, the Allen Mouse Connectivity Atlas resource consists of data from ∼3000 viral-mediated anterograde tracer experiments distributed across the whole brain (Oh et al., 2014; Harris et al., 2019; Whitesell et al., 2020) and retina (Martersteck et al., 2017). All data can be accessed through the Allen Institute online data portal (https://connectivity.brain-map.org/).
Since the first publication in 2014, this comprehensive resource has enabled a wide range of scientific analyses aimed at discovering organizational principles of mammalian brain networks (Fulcher et al., 2019; Van Essen et al., 2019), describing anatomic features of specific pathways of interest (Quina et al., 2015), understanding the network architecture of cortical connectomes (Gămănuţ et al., 2018; Harris et al., 2019), and providing quantitative data used to construct and computationally model structural and functional connectivity (Melozzi et al., 2017, 2019; Choi and Mihalas, 2019; Reimann et al., 2019). The Allen Connectivity Atlas is recognized as a foundational, “ground-truth” axonal tracing dataset that is useful for comparing results from novel circuit-tracing tools (Huang et al., 2020) and morphologic reconstructions of single long-range projection neurons (Winnubst et al., 2019; Peng et al., 2020).
This broad range of uses was supported in large part by having accessible data in multiple formats and providing other important informatics tools. The online atlas currently consists of high-resolution, whole-brain 2D image data for each experiment, 3D visualization tools, image segmentation, and automated quantification of axons across all brain regions. Multiple other web tools are available, including spatial/ontological searches of connectivity patterns through a combination of manual and informatics analyses. Data can be accessed as well through the Allen Software Development Toolkit (https://allensdk.readthedocs.io/en/latest/).
Notably, the scientific requirements for the Allen Mouse Brain Connectivity Atlas also directly led to the development of two other dependent resources: (1) anatomic characterization of a large set of transgenic Cre driver lines (Harris et al., 2014; Daigle et al., 2018); and (2) the creation of a new 3D reference atlas, the Allen Mouse Common Coordinate Framework, version 3 (CCFv3; Wang et al., 2020). Most axonal projection-mapping datasets in the Allen Connectivity Atlas were acquired using transgenic Cre driver mice with Cre-dependent adeno-associated virus-mediated GFP expression to selectively label axons from restricted anatomic regions and genetically defined classes of projection neurons in the cortex (Harris et al., 2019). The transgenic characterization portal (http://connectivity.brain-map.org/transgenic) thus contains datasets that map the expression of Cre and other transgenes in ∼100 driver and reporter lines in adults and at several developmental time points using in situ hybridization and other histologic methods. This resource was developed to identify useful Cre lines and appropriate locations for targeting the viral tracer experiments.
To provide a suitable high-resolution 3D anatomic framework for the Allen Mouse Brain Connectivity Atlas, the Allen CCFv3 was created (http://atlas.brain-map.org/). CCFv3 is an annotated 3D reference space with 10 µm voxel resolution. First, an average template brain was constructed from whole-brain images of 1675 mice that were part of the Allen Mouse Brain Connectivity Atlas pipeline. Then, using multimodal reference data (e.g., histologic stains, immunohistochemistry, transgene expression, connectivity patterns, and endogenous gene expression), the entire brain was parcellated directly in 3D, labeling every voxel with a brain structure, resulting in 43 isocortical areas and their layers, 329 subcortical gray matter structures, 81 fiber tracts, and 8 ventricular structures.
The Allen Mouse Brain Connectivity Atlas continues to provide a rich resource of data for exploration and analyses at the Allen Institute and for external users. Recently, the Allen Institute team reported results from ∼1000 tracer experiments performed in Cre driver lines to selectively label axons from distinct cell types across the cortex and its major satellite structure, the thalamus (Harris et al., 2019). A computational model was developed that assigned connections between areas as either feedforward or feedback based on anatomic patterns. Results revealed that cell class-specific connections are organized in a shallow hierarchy within the cortical thalamic network. The Allen Mouse Brain Connectivity Atlas, CCFv3, and many associated tools continue to be openly accessible through the main web portal: www.brain-map.org.
NeuroMorpho.Org: a well used resource of single-neuron neuroanatomy
Launched 14 years ago (Ascoli, 2006, 2007), NeuroMorpho.Org is, to date, the largest public database of digital reconstructions of neuronal axons and dendrites and glial processes. The latest major release (version 8.0, summer 2020) includes >130,000 freely available 3D arbor tracings and related metadata. The content is broadly representative of research in the field, including data from 77 species ranging from commonly used animal models such as rat, mouse, and Drosophila, to more exotic species such as giraffe, mormyrid fish, and moss animal (Fig. 4). Users can browse through and access 1252 distinct cell types from 384 anatomic regions contributed from ∼700 independent laboratories. The carefully designed, continuously curated, and searchable metadata contains rich information across multiple dimensions (Parekh et al., 2015), including the subject (e.g., species, strain, age, weight, and sex), specimen (anatomic region and cell type and characteristics), method (experimental condition, preparation protocol, labeling, slicing, imaging, and reconstruction process), tracing completeness (physical integrity of the trees, structural domains included or excluded, and morphologic attributes recorded such as branch diameter), and provenance (contributing laboratory, reference publication, and original data format). Moreover, every reconstruction is accompanied by a battery of morphometric features that can also be used to identify data of interest (Scorcioni et al., 2008). Neuroscientists can search and download data through an intuitive web interface via simple keywords, semantic queries, metadata dropdown menus, morphometric filters, and an increasingly popular application programming interface (API; Polavaram and Ascoli, 2017; Akram et al., 2018). Additionally, the repository is integrated and interoperable with other major resources such as PubMed (Marenco et al., 2008) and the Neuroscience Information Network (Halavi et al., 2008).
Figure 4.
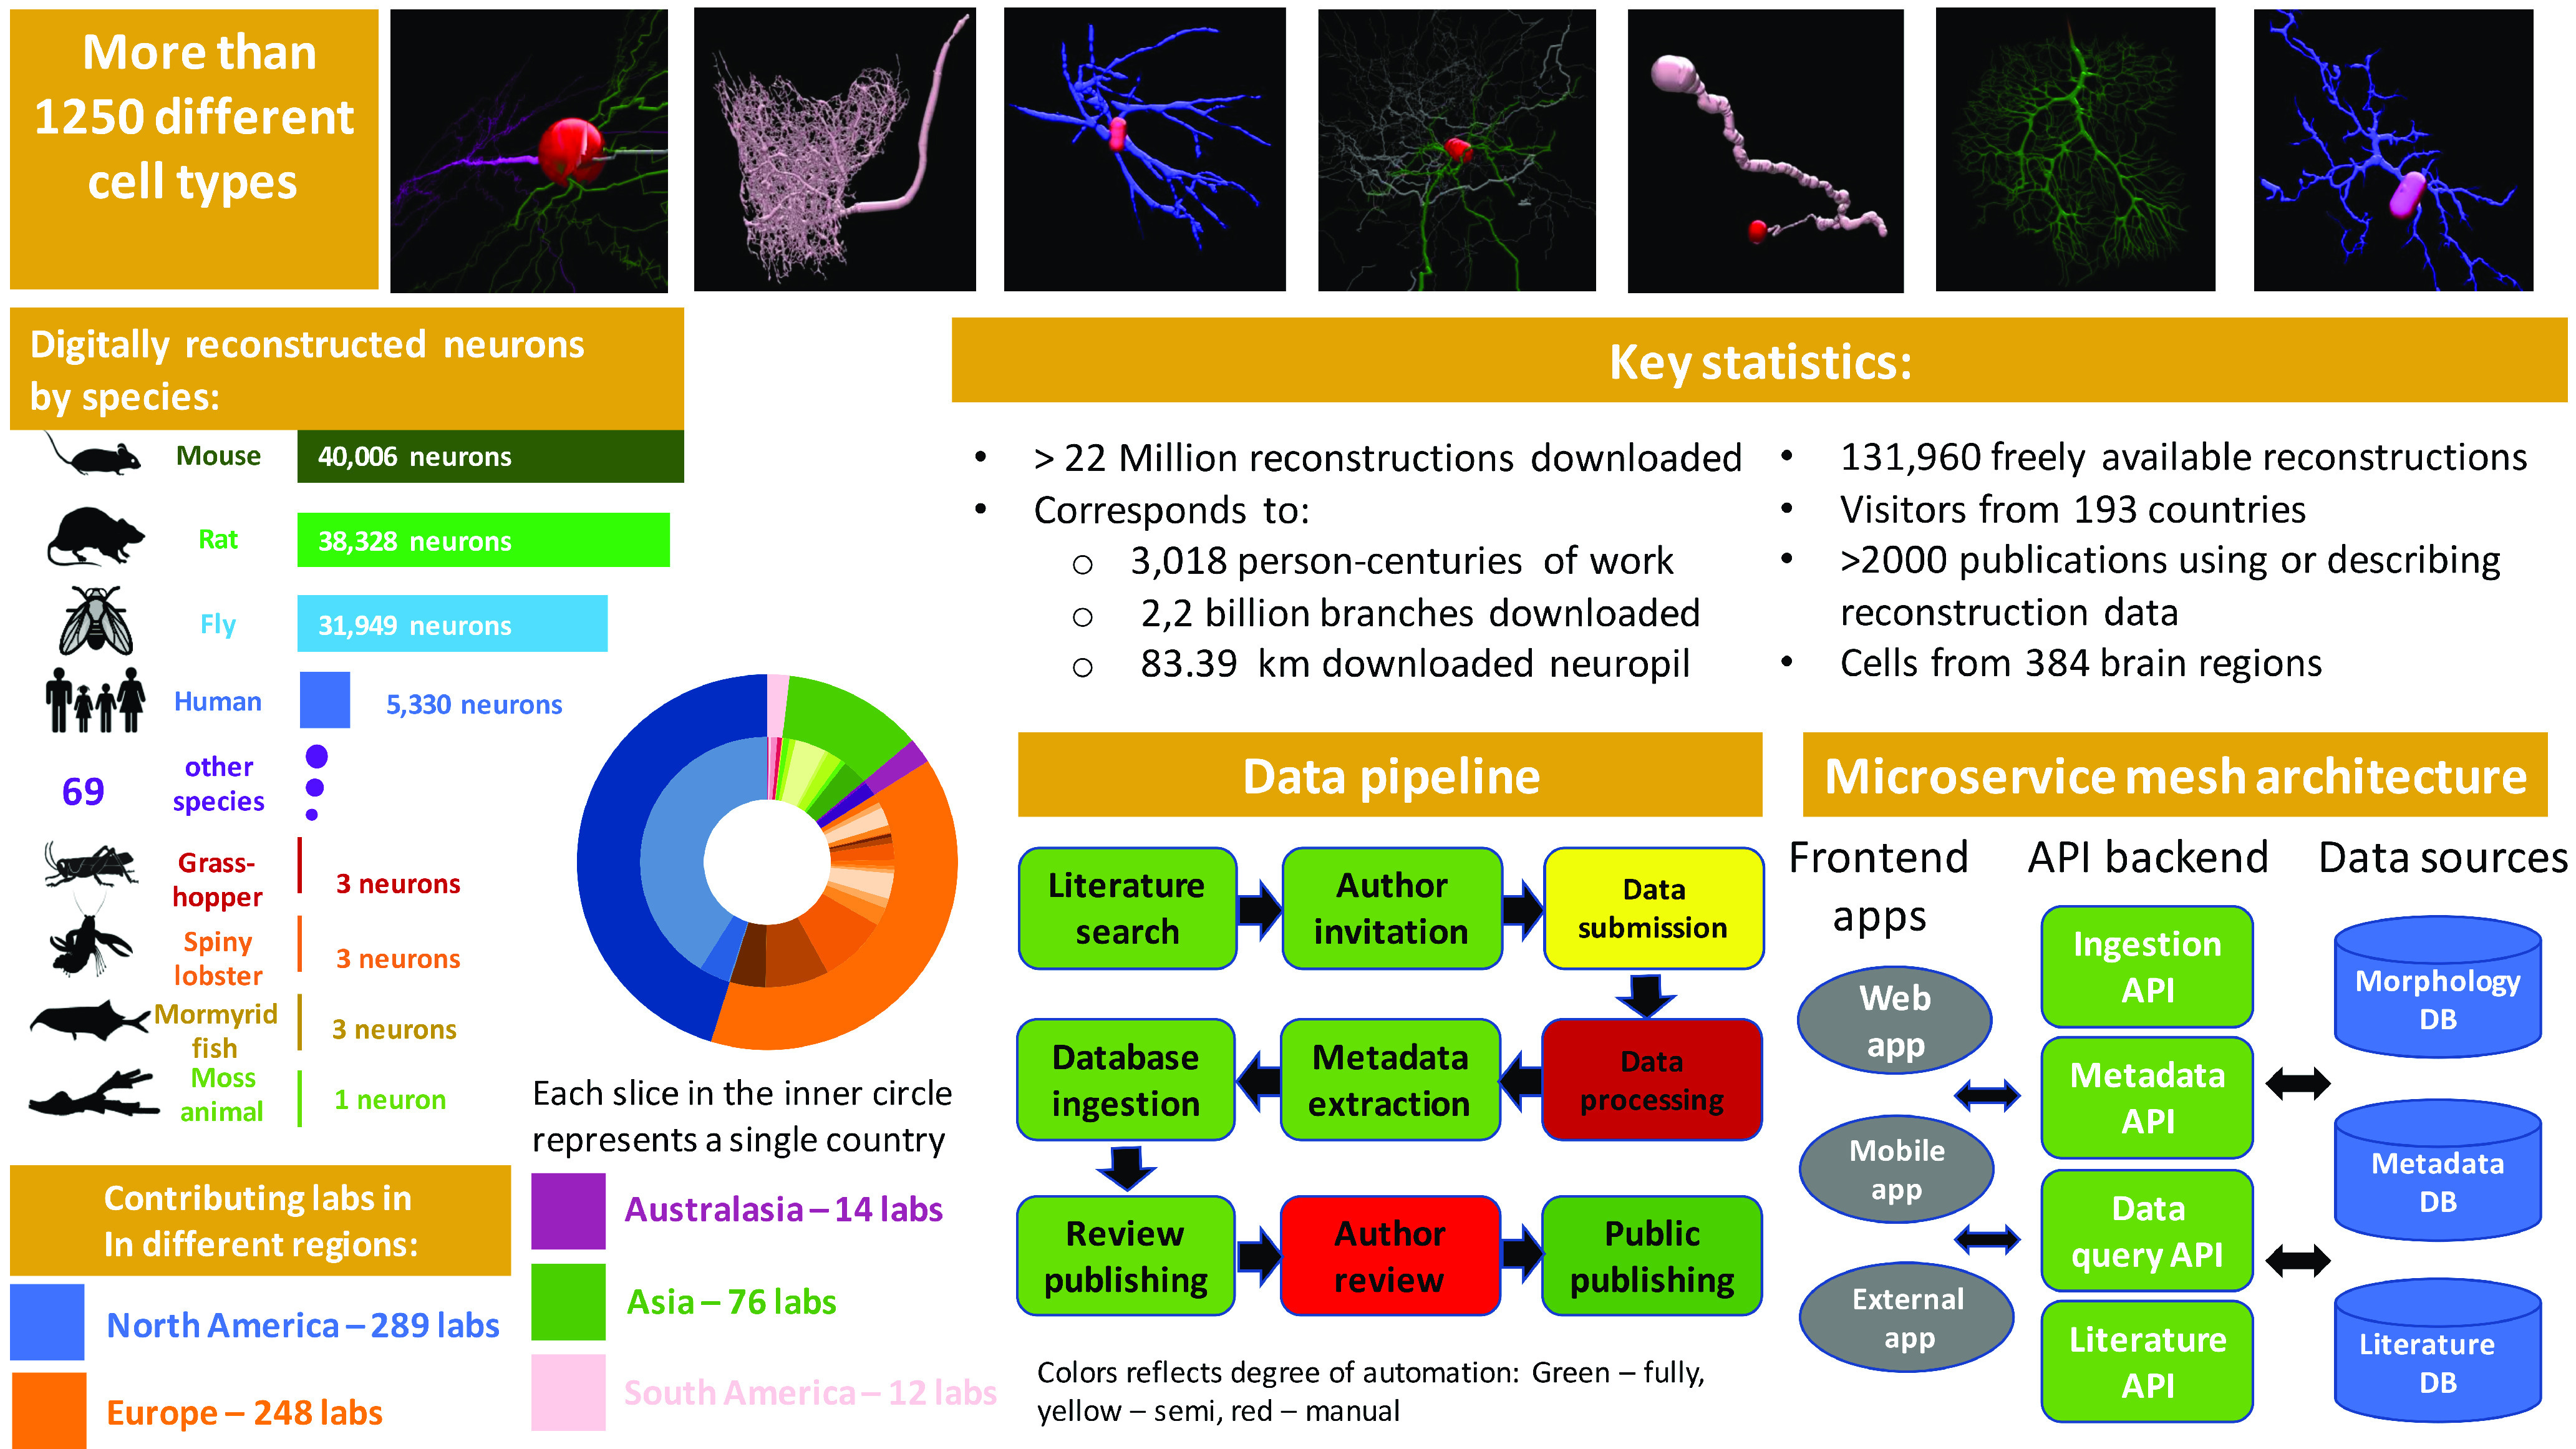
Overview of NeuroMorpho.Org data content, processing pipeline, and novel microservice mesh system architecture. Top, Representative selection of digital reconstructions of neural morphologies (red, soma; green, dendrites; magenta, apical dendrites; pink, unspecified neurites; silver, axon; blue, glial processes). Left, Distribution of different animal species represented in the database and geographic provenance of the data. Bottom right, Ongoing automation of the data-sharing pipeline with a novel microservice architecture to cater for an increasingly computer-to-computer interchange of data.
With >13 million downloads and 2000 peer-reviewed publications describing or using data, NeuroMorpho.Org contributes to all three main functions of academia, namely education, research, and knowledge transfer (Parekh and Ascoli, 2015). For teaching purposes, NeuroMorpho.Org is frequently used in higher education, including courses at both undergraduate and graduate level, especially for neurobiology topics (Chu et al., 2015), but also for data mining and statistical techniques (Maiorana, 2014). The discoveries enabled by NeuroMorpho.Org are numerous and span several fields. Computational physics applications leveraged reconstructions from this database to assess the interaction between neural geometry and different types of electromagnetic radiation, for example analyzing how dendrites affect a diffusion magnetic resonance imaging signal in brain tissue (Van Nguyen et al., 2015) or the possible damage of high-energy irradiation on neurons (Alp et al., 2015). The repository offers ample opportunities for comparative morphometric analyses (Zawadzki et al., 2012; Hansen et al., 2013) and for developing or testing novel algorithms or tools (Li et al., 2018; O'Halloran, 2020). More generally, fostering dissemination of societal knowledge, NeuroMorpho.Org serves as the reference repository for sharing published data among scholars (Kubota et al., 2011) and for presenting neuromorphology to the lay audience through the inspiration of painters (Neuromission: https://www.instagram.com/neuromission), large-scale art installations (“Neurons/Neurónios” at Galeria Nuno Centeno: https://www.facebook.com/galerianunocenteno/videos/453103735266229/), and 3D printing (McDougal and Shepherd, 2015).
Presently, NeuroMorpho.Org is growing at a pace of >20,000 reconstructions per year, with a substantial rate increase since 2016 (Ascoli, 2019). This acceleration results from a combination of factors, including but not limited to community production of ever larger datasets thanks to continuous neurotechnology developments along with faster and more affordable computing (Nanda et al., 2015), transparent disclosures of data availability (Ascoli, 2015), rising interest in and openness toward data sharing in neuroscience (Ascoli, 2007; Ascoli et al., 2017), and the progressive automation of literature searches (Maraver et al., 2019) and metadata retrieval from scientific publications (Bijari et al., 2020).
Perhaps equally important is the global outreach of this operation. Both contributions to, and use of, NeuroMorpho.Org span a worldwide coverage of 193 countries on 6 continents (Fig. 4). The web accesses, programmatic queries, and data transfers have been consistently increasing supralinearly. Although these successes are encouraging, they also come with serious challenges. Most notably, the centralized organization and standardization of all submitted data require a substantial manual component that is exceedingly time consuming, error prone, and labor intensive. Furthermore, the ability of computers to autonomously access online resources is gradually increasing server load with enhanced risk of down time. Eventually, the sheer amount of data may reach a capacity ceiling in generating processed resources such as visualizations, dynamic queries, and real-time computation.
Accordingly, NeuroMorpho.Org is undergoing extensive development of its back-end data processing and publishing workflow. A core element of this transformation consists of a largely automated data ingestion pipeline, namely organization and retrieval of data from prepared internal repositories. This innovation is enabled by a switch from a servlet-based monolithic platform to a microservice mesh-based architecture (Fig. 4). Although the former information technology design has served the community effectively for over a decade, it is suited neither to the pervasive computer-to-computer interaction from the end-user perspective nor to the rapid data publication that is highly desirable by contributors and curators alike. In contrast, the modern microservice architecture, deployed in Docker containers (Merkel, 2014), allows for almost completely automated data organization and quality control, which remains to this date one of the most significant efforts in the project. Moreover, this solution is fully scalable (Bernstein, 2014), thereby catering to a new era of robust and distributed neuroscience data sharing with ever expanding prospects for future breakthroughs.
GeneNetwork.org: genetic analysis for all neuroscientists
Originally named webqtl, GeneNetwork.org is the oldest continuously operating website in biomedical research (Williams, 1994). This massive database contains ∼40 million datasets. GeneNetwork.org also offers a powerful statistical platform for online network analyses and mapping, enabling numerous molecular questions to be probed in one centralized location (Chesler et al., 2003, 2005; Li et al., 2010; Mulligan et al., 2012, 2017, 2019). Most data are from groups of animals or humans who have been fully genotyped or even sequenced. As a result, it can be used to model causal networks that link DNA differences to traits such as differences in expression, cell number, volumes, and behavior using real-time computation and graphing. Computations can be as simple as sets of correlations and principal components, or as complex as whole transcriptome maps computed with correction for kinship and cofactors.
For example, Li et al. (2010) used GeneNetwork.org to identify key sequence variants of catechol-O-methyltransferase (COMT), an enzyme involved in dopamine and norepinephrine degradation, that mediate synaptic function and behavior in mice. The included expression datasets spanned many brain regions, peripheral tissues, and mouse strains and showed that different COMT variants lead to varying expression levels of synaptic proteins, ultimately contributing to changes in behavior (Li et al., 2010). Other examples include the relationship between GABAA receptor subunit sequence variants in striatum and hippocampus and behavioral phenotypes (Mulligan et al., 2012; 2019); the genetic causes of differences in serotonin transporter expression levels in the midbrain and accompanying differences in neuropharmacological responses (Ye et al., 2014); the genetic causes of differences in neurogenesis in hippocampus and of neuron/glia ratios in various brain regions (Seecharan et al., 2003; Kempermann et al., 2006; Overall et al., 2009).
GeneNetwork.org uses open source code, and all datasets hosted on the website are FAIR-compliant (Sloan et al., 2016; Wilkinson et al., 2016). Figure 5 illustrates an example workflow in GeneNetwork.org. The goal of this query was to find loci and candidate genes that modulate striatal volume. The search revealed three regions that have strong control, particularly the Qrr1 region of Chromosome 1 (Fig. 5C; Mozhui et al., 2008; Hager et al., 2012). To further investigate whether volume covaries with neuron numbers in the 68 strains identified, a “get” command can be used to evaluate the relationship between brain volume and neuron number (Fig. 5D). This type of information is important, for example, when extrapolating from MRI volume differences in humans to potential variations in cell number (Hibar et al., 2015).
Figure 5.

Example workflow in GeneNetwork.org. A, The pull-down menus and global search fields are used to find phenotype or expression datasets, in this case related to gene expression in the hippocampus of the large BXD family. B, Histogram of the bilateral volume of the striatum for 68 different genotypes of mice (n = ∼6/genotype. C, Map of the chromosomal regions that control striatal volume, with linkage peaks on chromosome 1 at 173 Mb in the Qrr1 region (Mozhui et al., 2008), and on chromosomes 3 and 5. The x-axis lists positions along the first five chromosomes on a megabase scale. The y-axis gives linkage p values on a logarithmic scale with a peak of 6.73 at marker rs31612847. D, A get command can be used to probe the relationship between volume and neuron number, which reveals a Pearson r value of 0.49, demonstrating that volume differences explain ∼25% of the heritable differences in numbers of neurons—primarily medium spiny neurons—in mouse striatum.
One exciting area of research enabled by GeneNetwork.org is the reanalysis of phenotypes generated before 2010, which would greatly benefit from recent computational methods and datasets. For example, given the intense current interest in opiate addiction, it is important to remap decade-old data using new linear mixed-model mapping algorithms available in GeneNetwork.org. There is a great amount of amassed data on opiate-induced changes in locomotion, and hundreds of other drug-related traits (Philip et al., 2010) for >60 strains of recombinant inbred mice that have all been fully genotyped. This analysis can identify the gene variants that influence responses to these drugs-of-abuse.
GeneNetwork.org is also a valuable teaching tool. While mainly designed for researchers interested in testing gene-to-phenotype relationships, GeneNetwork.org has been adapted for dry-lab teaching in neuroscience and genetics (Grisham et al., 2017). A useful approach is to assign sets of vetted questions, such as the examples discussed above, and to help students work toward answers, solutions, or novel questions. Several examples relating to the analysis of behavior and for neurologic diseases are provided in the study by Mulligan et al. (2017).
GeneNetwork.org is committed to data and code workflows that are FAIR compliant, ensuring that those who generate data and key ideas get the deserved credit. To further ensure effective and secure dissemination of data and ideas, as well as improved reproducibility, the GeneNetwork.org infrastructure is currently being redesigned using more modular structures and APIs that communicate well with other open source software efforts, such as R/qtl2 and DataTables. Publications will soon be reproducible as R/shiny and Jupyter notebooks. Readers and data reusers will be able to extend analyses and test their own hypotheses, but with access to big data and powerful computational hardware. Scientists will share and publish work directly from live laboratory notebooks—a trend already taking roots in industry. Additional planned new features include better methods to package software and data so that the user can come back at any point in time and rerun the same code in virtual machines, the development of GNU Guix software packaging manager, and storing packages and data using the InterPlanetary File System (IPFS).
Conclusions
The tools highlighted here demonstrate the growing movement toward open science within the neuroscience community. Numerous other web-based tools and resources are rapidly coming online, with noteworthy examples including the Janelia MouseLight Project—which contains brain-wide reconstructions of molecularly characterized neurons in the mouse (Winnubst et al., 2019)—RePAIR—a novel statistical tool for power calculations in animal experimentation that takes into account previous datasets to decrease sample sizes (Bonapersona et al., 2019)—and DeepLabCut—a free open source software for animal behavioral quantification that eliminates the need for expensive commercial alternatives (Mathis et al., 2018; Nath et al., 2019). These tools are built by researchers for researchers, to facilitate access to relevant data and analysis, increase reproducibility, promote standardization of experimental design, provide avenues for innovative secondary analyses, and encourage data sharing and collaborations. The success of open source science relies on the buy-in of the scientific community. The use and maintenance of these resources requires a cultural shift that prioritizes open science and makes it a part of the standard operating procedure of every laboratory.
Stark contrast continues to exist between the substantial basic science understanding of how the building blocks of the brain—from genes to neurons to circuits—impact behavior, and the translation of this knowledge into clinical practice and technological progress. Open data and data sharing have the power to maximize scientific output, accelerate progress, enhance the equitable distribution of resources, create new avenues for innovative research, and enhance reproducibility. Ultimately, this cultural shift could lead to novel actionable clinical and technological advances that provide the scaffolding for a translational bridge.
Footnotes
MouseBytes.ca is supported in part by a Canadian Open Neuroscience Platform grant to S.M. MouseCircuits.org is supported in part by National Institutes of Health (NIH) Grants R01-MH-111918 to D.D. and T32-MH-015174 to K.R.A. The Allen Mouse Brain Connectivity was supported by the Allen Institute for Brain Science (J.A.H. and L.N.). NeuroMorpho.Org is supported in part by NIH Grants R01-NS-39600, U01-MH-114829, and R01-NS-86082 to G.A.A. GeneNetwork.org is supported in part by NIH Grant P30-DA-044223 to R.W.W. J.A.H and L.N. thank the Allen Institute for Brain Science founder, Paul G. Allen (1953–2018), for his vision, encouragement, and support.
The authors declare no competing financial interests.
References
- Akram MA, Nanda S, Maraver P, Armañanzas R, Ascoli GA (2018) An open repository for single-cell reconstructions of the brain forest. Sci Data 5:180006. 10.1038/sdata.2018.6 [DOI] [PMC free article] [PubMed] [Google Scholar]
- Allen C, Mehler DMA (2019) Open science challenges, benefits and tips in early career and beyond. PLoS Biol 17:e3000246. 10.1371/journal.pbio.3000246 [DOI] [PMC free article] [PubMed] [Google Scholar]
- Alp M, Parihar VK, Limoli CL, Cucinotta FA (2015) Irradiation of neurons with high-energy charged particles: an in silico modeling approach. PLoS Comput Biol 11:e1004428. 10.1371/journal.pcbi.1004428 [DOI] [PMC free article] [PubMed] [Google Scholar]
- Anderson KR, Dumitriu D (2020) MouseCircuits. org: an online repository to guide the circuit era of disordered affect. bioRxiv 951608. doi: 10.1101/2020.02.16.951608 10.1101/2020.02.16.951608 [DOI] [Google Scholar]
- Ascoli GA (2006) Mobilizing the base of neuroscience data: the case of neuronal morphologies. Nat Rev Neurosci 7:318–324. 10.1038/nrn1885 [DOI] [PubMed] [Google Scholar]
- Ascoli GA (2007) Successes and rewards in sharing digital reconstructions of neuronal morphology. Neuroinformatics 5:154–160. 10.1007/s12021-007-0010-7 [DOI] [PubMed] [Google Scholar]
- Ascoli GA (2015) Sharing neuron data: carrots, sticks, and digital records. PLoS Biol 13:e1002275. 10.1371/journal.pbio.1002275 [DOI] [PMC free article] [PubMed] [Google Scholar]
- Ascoli GA (2019) Turning the tide of data sharing. Neuroinformatics 17:473–474. 10.1007/s12021-019-09437-8 [DOI] [PMC free article] [PubMed] [Google Scholar]
- Ascoli GA, Maraver P, Nanda S, Polavaram S, Armañanzas R (2017) Win–win data sharing in neuroscience. Nat Methods 14:112–116. 10.1038/nmeth.4152 [DOI] [PMC free article] [PubMed] [Google Scholar]
- Baker M (2016) 1,500 scientists lift the lid on reproducibility. Nature 533:452–454. 10.1038/533452a [DOI] [PubMed] [Google Scholar]
- Bale TL, Abel T, Akil H, Carlezon WA Jr, Moghaddam B, Nestler EJ, Ressler KJ, Thompson SM (2019) The critical importance of basic animal research for neuropsychiatric disorders. Neuropsychopharmacology 44:1349–1353. 10.1038/s41386-019-0405-9 [DOI] [PMC free article] [PubMed] [Google Scholar]
- Beraldo FH, Palmer D, Memar S, Wasserman DI, Lee W-JV, Liang S, Creighton SD, Kolisnyk B, Cowan MF, Mels J, Masood TS, Fodor C, Al-Onaizi MA, Bartha R, Gee T, Saksida LM, Bussey TJ, Strother SS, Prado VF, Winters BD, et al. (2019) MouseBytes, an open-access high-throughput pipeline and database for rodent touchscreen-based cognitive assessment. Elife 8:e49630 10.7554/eLife.49630 [DOI] [PMC free article] [PubMed] [Google Scholar]
- Bernstein D (2014) Containers and cloud: from LXC to docker to kubernetes. IEEE Cloud Comput 1:81–84. 10.1109/MCC.2014.51 [DOI] [Google Scholar]
- Bijari K, Akram MA, Ascoli GA (2020) An open-source framework for neuroscience metadata management applied to digital reconstructions of neuronal morphology. Brain Inform 7:2. 10.1186/s40708-020-00103-3 [DOI] [PMC free article] [PubMed] [Google Scholar]
- Biswal BB, Mennes M, Zuo X-N, Gohel S, Kelly C, Smith SM, Beckmann CF, Adelstein JS, Buckner RL, Colcombe S, Dogonowski A-M, Ernst M, Fair D, Hampson M, Hoptman MJ, Hyde JS, Kiviniemi VJ, Kötter R, Li S-J, Lin C-P, et al. (2010) Toward discovery science of human brain function. Proc Natl Acad Sci U S A 107:4734 10.1073/pnas.0911855107 [DOI] [PMC free article] [PubMed] [Google Scholar]
- Bohland JW, Wu C, Barbas H, Bokil H, Bota M, Breiter HC, Cline HT, Doyle JC, Freed PJ, Greenspan RJ, Haber SN, Hawrylycz M, Herrera DG, Hilgetag CC, Huang ZJ, Jones A, Jones EG, Karten HJ, Kleinfeld D, Kötter R, et al. (2009) A proposal for a coordinated effort for the determination of brainwide neuroanatomical connectivity in model organisms at a mesoscopic scale. PLoS Comput Biol 5:e1000334. 10.1371/journal.pcbi.1000334 [DOI] [PMC free article] [PubMed] [Google Scholar]
- Bonapersona V, Hoijtink H, Sarabdjitsingh RA, Joëls M (2019) RePAIR: a power solution to animal experimentation. bioRxiv 864652. doi: 10.1101/864652 10.1101/864652 [DOI] [Google Scholar]
- Chesler EJ, Wang J, Lu L, Qu Y, Manly KF, Williams RW (2003) Genetic correlates of gene expression in recombinant inbred strains: a relational model system to explore neurobehavioral phenotypes. Neuroinformatics 1:343–357. 10.1385/NI:1:4:343 [DOI] [PubMed] [Google Scholar]
- Chesler EJ, Lu L, Shou S, Qu Y, Gu J, Wang J, Hsu HC, Mountz JD, Baldwin NE, Langston MA, Threadgill DW, Manly KF, Williams RW (2005) Complex trait analysis of gene expression uncovers polygenic and pleiotropic networks that modulate nervous system function. Nat Genet 37:233–242. 10.1038/ng1518 [DOI] [PubMed] [Google Scholar]
- Choi H, Mihalas S (2019) Synchronization dependent on spatial structures of a mesoscopic whole-brain network. PLoS Comput Biol 15:e1006978. 10.1371/journal.pcbi.1006978 [DOI] [PMC free article] [PubMed] [Google Scholar]
- Choi JY, Jang H, Ornelas S, Fleming W, Fürth D, Au J, Bandi A, Witten IB (2020) A comparison of dopaminergic and cholinergic populations reveals unique contributions of VTA dopamine neurons to short-term memory. Cell Reports 33:108492 10.1101/2020.07.26.221713 [DOI] [PMC free article] [PubMed] [Google Scholar]
- Chu P, Peck J, Brumberg JC (2015) Exercises in anatomy: connectivity, and morphology using Neuromorpho.org and the Allen Brain Atlas. J Undergrad Neurosci Educ 13:A95–A100. [PMC free article] [PubMed] [Google Scholar]
- Church G, Marblestone A, Kalhor R (2015) The future of the brain: essays by the world's leading neuroscientists. Princeton, NJ: Princeton UP. [Google Scholar]
- Cuschieri S, Grech V, Savona-Ventura C (2018) WASP (write a scientific paper): how to write a scientific thesis. Early Hum Dev 127:101–105. 10.1016/j.earlhumdev.2018.07.012 [DOI] [PubMed] [Google Scholar]
- Cuthbert BN (2014) The RDoC framework: facilitating transition from ICD/DSM to dimensional approaches that integrate neuroscience and psychopathology. World Psychiatry 13:28–35. 10.1002/wps.20087 [DOI] [PMC free article] [PubMed] [Google Scholar]
- Cuthbert BN (2015) Research domain criteria: toward future psychiatric nosologies. Dialogues Clin Neurosci 17:89–97. [DOI] [PMC free article] [PubMed] [Google Scholar]
- Daigle TL, Madisen L, Hage TA, Valley MT, Knoblich U, Larsen RS, Takeno MM, Huang L, Gu H, Larsen R, Mills M, Bosma-Moody A, Siverts LA, Walker M, Graybuck LT, Yao Z, Fong O, Nguyen TN, Garren E, Lenz GH, et al. (2018) A suite of transgenic driver and reporter mouse lines with enhanced brain-cell-type targeting and functionality. Cell 174:465–480.e22. 10.1016/j.cell.2018.06.035 [DOI] [PMC free article] [PubMed] [Google Scholar]
- de Vries YA, Roest AM, de Jonge P, Cuijpers P, Munafò MR, Bastiaansen JA (2018) The cumulative effect of reporting and citation biases on the apparent efficacy of treatments: the case of depression. Psychol Med 48:2453–2455. 10.1017/S0033291718001873 [DOI] [PMC free article] [PubMed] [Google Scholar]
- Deisseroth K (2011) Optogenetics. Nat Methods 8:26–29. 10.1038/nmeth.f.324 [DOI] [PMC free article] [PubMed] [Google Scholar]
- DeNardo L, Luo L (2017) Genetic strategies to access activated neurons. Curr Opin Neurobiol 45:121–129. 10.1016/j.conb.2017.05.014 [DOI] [PMC free article] [PubMed] [Google Scholar]
- Fanelli D, Costas R, Ioannidis JP (2017) Meta-assessment of bias in science. Proc Natl Acad Sci U S A 114:3714–3719. 10.1073/pnas.1618569114 [DOI] [PMC free article] [PubMed] [Google Scholar]
- Fulcher BD, Murray JD, Zerbi V, Wang X-J (2019) Multimodal gradients across mouse cortex. Proc Natl Acad Sci U S A 116:4689–4695. 10.1073/pnas.1814144116 [DOI] [PMC free article] [PubMed] [Google Scholar]
- Fürth D, Vaissière T, Tzortzi O, Xuan Y, Märtin A, Lazaridis I, Spigolon G, Fisone G, Tomer R, Deisseroth K, Carlén M, Miller CA, Rumbaugh G, Meletis K (2018) An interactive framework for whole-brain maps at cellular resolution. Nat Neurosci 21:139–149. 10.1038/s41593-017-0027-7 [DOI] [PMC free article] [PubMed] [Google Scholar]
- Gămănuţ R, Kennedy H, Toroczkai Z, Ercsey-Ravasz M, Van Essen DC, Knoblauch K, Burkhalter A (2018) The mouse cortical connectome, characterized by an ultra-dense cortical graph, maintains specificity by distinct connectivity profiles. Neuron 97:698–715.e10. 10.1016/j.neuron.2017.12.037 [DOI] [PMC free article] [PubMed] [Google Scholar]
- Ginther DK, Schaffer WT, Schnell J, Masimore B, Liu F, Haak LL, Kington R (2011) Race, ethnicity, and NIH research awards. Science 333:1015–1019. 10.1126/science.1196783 [DOI] [PMC free article] [PubMed] [Google Scholar]
- Gleeson P, Davison AP, Silver RA, Ascoli GA (2017) A commitment to open source in neuroscience. Neuron 96:964–965. 10.1016/j.neuron.2017.10.013 [DOI] [PubMed] [Google Scholar]
- Grisham W, Brumberg JC, Gilbert T, Lanyon L, Williams RW, Olivo R (2017) Teaching with big data: report from the 2016 Society for Neuroscience Teaching Workshop. J Undergrad Neurosci Educ 16:A68–A76. [PMC free article] [PubMed] [Google Scholar]
- Hager R, Lu L, Rosen GD, Williams RW (2012) Genetic architecture supports mosaic brain evolution and independent brain-body size regulation. Nat Commun 3:1079–1079. 10.1038/ncomms2086 [DOI] [PMC free article] [PubMed] [Google Scholar]
- Halavi M, Polavaram S, Donohue DE, Hamilton G, Hoyt J, Smith KP, Ascoli GA (2008) NeuroMorpho.Org implementation of digital neuroscience: dense coverage and integration with the NIF. Neuroinformatics 6:241–252. 10.1007/s12021-008-9030-1 [DOI] [PMC free article] [PubMed] [Google Scholar]
- Hansen MB, Jespersen SN, Leigland LA, Kroenke CD (2013) Using diffusion anisotropy to characterize neuronal morphology in gray matter: the orientation distribution of axons and dendrites in the NeuroMorpho.org database. Front Integr Neurosci 7:31. 10.3389/fnint.2013.00031 [DOI] [PMC free article] [PubMed] [Google Scholar]
- Harris JA, Hirokawa KE, Sorensen SA, Gu H, Mills M, Ng LL, Bohn P, Mortrud M, Ouellette B, Kidney J, Smith KA, Dang C, Sunkin S, Bernard A, Oh SW, Madisen L, Zeng H (2014) Anatomical characterization of Cre driver mice for neural circuit mapping and manipulation. Front Neural Circuits 8:76. 10.3389/fncir.2014.00076 [DOI] [PMC free article] [PubMed] [Google Scholar]
- Harris JA, Mihalas S, Hirokawa KE, Whitesell JD, Choi H, Bernard A, Bohn P, Caldejon S, Casal L, Cho A, Feiner A, Feng D, Gaudreault N, Gerfen CR, Graddis N, Groblewski PA, Henry AM, Ho A, Howard R, Knox JE, et al. (2019) Hierarchical organization of cortical and thalamic connectivity. Nature 575:195–202. 10.1038/s41586-019-1716-z [DOI] [PMC free article] [PubMed] [Google Scholar]
- Hibar DP, Stein JL, Renteria ME, Arias-Vasquez A, Desrivières S, Jahanshad N, Toro R, Wittfeld K, Abramovic L, Andersson M, Aribisala BS, Armstrong NJ, Bernard M, Bohlken MM, Boks MP, Bralten J, Brown AA, Chakravarty MM, Chen Q, Ching CRK, et al. (2015) Common genetic variants influence human subcortical brain structures. Nature 520:224–229. 10.1038/nature14101 [DOI] [PMC free article] [PubMed] [Google Scholar]
- Hoppe TA, Litovitz A, Willis KA, Meseroll RA, Perkins MJ, Hutchins BI, Davis AF, Lauer MS, Valantine HA, Anderson JM, Santangelo GM (2019) Topic choice contributes to the lower rate of NIH awards to African-American/black scientists. Sci Adv 5:eaaw7238. 10.1126/sciadv.aaw7238 [DOI] [PMC free article] [PubMed] [Google Scholar]
- Huang L, Kebschull JM, Fürth D, Musall S, Kaufman MT, Churchland AK, Zador AM (2020) BRICseq bridges brain-wide interregional connectivity to neural activity and gene expression in single animals. Cell 182:177–188.e27. 10.1016/j.cell.2020.05.029 [DOI] [PMC free article] [PubMed] [Google Scholar]
- Insel T, Cuthbert B, Garvey M, Heinssen R, Pine DS, Quinn K, Sanislow C, Wang P (2010) Research domain criteria (RDoC): toward a new classification framework for research on mental disorders. Am J Psychiatry 167:748–751. 10.1176/appi.ajp.2010.09091379 [DOI] [PubMed] [Google Scholar]
- Kalhor R, Kalhor K, Mejia L, Leeper K, Graveline A, Mali P, Church GM (2018) Developmental barcoding of whole mouse via homing CRISPR. Science 361:eaat9804 10.1126/science.aat9804 [DOI] [PMC free article] [PubMed] [Google Scholar]
- Kempermann G, Chesler EJ, Lu L, Williams RW, Gage FH (2006) Natural variation and genetic covariance in adult hippocampal neurogenesis. Proc Natl Acad Sci U S A 103:780–785. 10.1073/pnas.0510291103 [DOI] [PMC free article] [PubMed] [Google Scholar]
- Kornfeld J, Denk W (2018) Progress and remaining challenges in high-throughput volume electron microscopy. Curr Opin Neurobiol 50:261–267. 10.1016/j.conb.2018.04.030 [DOI] [PubMed] [Google Scholar]
- Kuan L, Li Y, Lau C, Feng D, Bernard A, Sunkin SM, Zeng H, Dang C, Hawrylycz M, Ng L (2015) Neuroinformatics of the Allen Mouse Brain Connectivity Atlas. Methods 73:4–17. 10.1016/j.ymeth.2014.12.013 [DOI] [PubMed] [Google Scholar]
- Kubota Y, Karube F, Nomura M, Gulledge AT, Mochizuki A, Schertel A, Kawaguchi Y (2011) Conserved properties of dendritic trees in four cortical interneuron subtypes. Sci Rep 1:89. 10.1038/srep00089 [DOI] [PMC free article] [PubMed] [Google Scholar]
- Li Z, Mulligan MK, Wang X, Miles MF, Lu L, Williams RW (2010) A transposon in Comt generates mRNA variants and causes widespread expression and behavioral differences among mice. PLoS One 5:e12181. 10.1371/journal.pone.0012181 [DOI] [PMC free article] [PubMed] [Google Scholar]
- Li Z, Butler E, Li K, Lu A, Ji S, Zhang S (2018) Large-scale exploration of neuronal morphologies using deep learning and augmented reality. Neuroinformatics 16:339–349. 10.1007/s12021-018-9361-5 [DOI] [PubMed] [Google Scholar]
- Loscalzo J (2012) Irreproducible experimental results: causes, (mis)interpretations, and consequences. Circulation 125:1211–1214. 10.1161/CIRCULATIONAHA.112.098244 [DOI] [PMC free article] [PubMed] [Google Scholar]
- Maiorana F (2014) Neuromorphology: a case study based on data mining and statistical techniques in an educational setting. In: Frontier and future development of information technology in medicine and education (Li S, Jin Q, Jiang X, Park JJ, eds), pp 3095–3101. Dordrecht, Germany: Springer Nature. [Google Scholar]
- Mar AC, Horner AE, Nilsson SRO, Alsiö J, Kent BA, Kim CH, Holmes A, Saksida LM, Bussey TJ (2013) The touchscreen operant platform for assessing executive function in rats and mice. Nat Protoc 8:1985–2005. 10.1038/nprot.2013.123 [DOI] [PMC free article] [PubMed] [Google Scholar]
- Maraver P, Armañanzas R, Gillette TA, Ascoli GA (2019) PaperBot: open-source web-based search and metadata organization of scientific literature. BMC Bioinformatics 20:50. 10.1186/s12859-019-2613-z [DOI] [PMC free article] [PubMed] [Google Scholar]
- Marenco L, Ascoli GA, Martone ME, Shepherd GM, Miller PL (2008) The NIF LinkOut broker: a web resource to facilitate federated data integration using NCBI identifiers. Neuroinformatics 6:219–227. 10.1007/s12021-008-9025-y [DOI] [PMC free article] [PubMed] [Google Scholar]
- Martersteck EM, Hirokawa KE, Evarts M, Bernard A, Duan X, Li Y, Ng L, Oh SW, Ouellette B, Royall JJ, Stoecklin M, Wang Q, Zeng H, Sanes JR, Harris JA (2017) Diverse central projection patterns of retinal ganglion cells. Cell Rep 18:2058–2072. 10.1016/j.celrep.2017.01.075 [DOI] [PMC free article] [PubMed] [Google Scholar]
- Mathis A, Mamidanna P, Cury KM, Abe T, Murthy VN, Mathis MW, Bethge M (2018) DeepLabCut: markerless pose estimation of user-defined body parts with deep learning. Nat Neurosci 21:1281–1289. 10.1038/s41593-018-0209-y [DOI] [PubMed] [Google Scholar]
- McDougal R, Shepherd G (2015) 3D-printer visualization of neuron models. Front Neuroinform 9:18. 10.3389/fninf.2015.00018 [DOI] [PMC free article] [PubMed] [Google Scholar]
- McKiernan E, Bourne P, Brown C (2016) The open research value proposition: how sharing can help researchers succeed. figshare. Dataset. Available at 10.6084/m9.figshare.1619902.v2. [DOI]
- Melozzi F, Woodman MM, Jirsa VK, Bernard C (2017) The virtual mouse brain: a computational neuroinformatics platform to study whole mouse brain dynamics. eNeuro 4:ENEURO.0111-17.2017–0117 10.1523/ENEURO.0111-17.2017 [DOI] [PMC free article] [PubMed] [Google Scholar]
- Melozzi F, Bergmann E, Harris JA, Kahn I, Jirsa V, Bernard C (2019) Individual structural features constrain the mouse functional connectome. Proc Natl Acad Sci U S A 116:26961–26969. 10.1073/pnas.1906694116 [DOI] [PMC free article] [PubMed] [Google Scholar]
- Merkel D (2014) Docker: lightweight linux containers for consistent development and deployment. Linux J 2014:May 19. [Google Scholar]
- Meyers E, DeSerisy M, Roy AK (2017) Disruptive mood dysregulation disorder (DMDD): an RDoC perspective. J Affect Disord 216:117–122. 10.1016/j.jad.2016.08.007 [DOI] [PMC free article] [PubMed] [Google Scholar]
- Mozhui K, Ciobanu DC, Schikorski T, Wang X, Lu L, Williams RW (2008) Dissection of a QTL hotspot on mouse distal chromosome 1 that modulates neurobehavioral phenotypes and gene expression. PLoS Genet 4:e1000260. 10.1371/journal.pgen.1000260 [DOI] [PMC free article] [PubMed] [Google Scholar]
- Mulligan MK, Wang X, Adler AL, Mozhui K, Lu L, Williams RW (2012) Complex control of GABA(A) receptor subunit mRNA expression: variation, covariation, and genetic regulation. PLoS One 7:e34586. 10.1371/journal.pone.0034586 [DOI] [PMC free article] [PubMed] [Google Scholar]
- Mulligan MK, Mozhui K, Prins P, Williams RW (2017) GeneNetwork: a toolbox for systems genetics. In: Systems genetics: methods and protocols (Schughart K, Williams RW, eds), pp 75–120. New York: Springer. [DOI] [PMC free article] [PubMed] [Google Scholar]
- Mulligan MK, Abreo T, Neuner SM, Parks C, Watkins CE, Houseal MT, Shapaker TM, Hook M, Tan H, Wang X, Ingels J, Peng J, Lu L, Kaczorowski CC, Bryant CD, Homanics GE, Williams RW (2019) Identification of a functional non-coding variant in the GABAA receptor α2 subunit of the C57BL/6J mouse reference genome: major implications for neuroscience research. Front Genet 10:188 10.3389/fgene.2019.00188 [DOI] [PMC free article] [PubMed] [Google Scholar]
- Munafò MR, Nosek BA, Bishop DVM, Button KS, Chambers CD, Percie du Sert N, Simonsohn U, Wagenmakers E-J, Ware JJ, Ioannidis JPA (2017) A manifesto for reproducible science. Nat Hum Behav 1:0021 10.1038/s41562-016-0021 [DOI] [PMC free article] [PubMed] [Google Scholar]
- Nanda S, Allaham MM, Bergamino M, Polavaram S, Armañanzas R, Ascoli GA, Parekh R (2015) Doubling up on the fly: neuroMorpho.Org meets big data. Neuroinformatics 13:127–129. 10.1007/s12021-014-9257-y [DOI] [PMC free article] [PubMed] [Google Scholar]
- Nath T, Mathis A, Chen AC, Patel A, Bethge M, Mathis MW (2019) Using DeepLabCut for 3D markerless pose estimation across species and behaviors. Nat Protoc 14:2152–2176. 10.1038/s41596-019-0176-0 [DOI] [PubMed] [Google Scholar]
- O'Halloran DM (2020) Module for SWC neuron morphology file validation and correction enabled for high throughput batch processing. PLoS One 15:e0228091 10.1371/journal.pone.0228091 [DOI] [PMC free article] [PubMed] [Google Scholar]
- Oh SW, Harris JA, Ng L, Winslow B, Cain N, Mihalas S, Wang Q, Lau C, Kuan L, Henry AM, Mortrud MT, Ouellette B, Nguyen TN, Sorensen SA, Slaughterbeck CR, Wakeman W, Li Y, Feng D, Ho A, Nicholas E, et al. (2014) A mesoscale connectome of the mouse brain. Nature 508:207–214. 10.1038/nature13186 [DOI] [PMC free article] [PubMed] [Google Scholar]
- Overall R, Kempermann G, Peirce J, Lu L, Goldowitz D, Gage F, Goodwin S, Smit A, Airey D, Rosen G, Schalkwyk L, Sutter T, Nowakowski R, Whatley S, Williams R (2009) Genetics of the hippocampal transcriptome in mouse: a systematic survey and online neurogenomics resource. Front Neurosci 3:3 10.3389/neuro.15.003.2009 [DOI] [PMC free article] [PubMed] [Google Scholar]
- Parekh R, Ascoli GA (2015) Quantitative investigations of axonal and dendritic arbors: development, structure, function, and pathology. Neuroscientist 21:241–254. 10.1177/1073858414540216 [DOI] [PMC free article] [PubMed] [Google Scholar]
- Parekh R, Armañanzas R, Ascoli GA (2015) The importance of metadata to assess information content in digital reconstructions of neuronal morphology. Cell Tissue Res 360:121–127. 10.1007/s00441-014-2103-6 [DOI] [PMC free article] [PubMed] [Google Scholar]
- Peng H, Xie P, Liu L, Kuang X, Wang Y, Qu L, Gong H, Jiang S, Li A, Ruan Z, Ding L, Chen C, Chen M, Daigle TL, Ding Z, Duan Y, Feiner A, He P, Hill C, Hirokawa KE, et al. (2020) Brain-wide single neuron reconstruction reveals morphological diversity in molecularly defined striatal, thalamic, cortical and claustral neuron types. bioRxiv 675280. doi: 10.1101/675280 10.1101/675280 [DOI] [Google Scholar]
- Philip VM, Duvvuru S, Gomero B, Ansah TA, Blaha CD, Cook MN, Hamre KM, Lariviere WR, Matthews DB, Mittleman G, Goldowitz D, Chesler EJ (2010) High-throughput behavioral phenotyping in the expanded panel of BXD recombinant inbred strains. Genes Brain Behav 9:129–159. 10.1111/j.1601-183X.2009.00540.x [DOI] [PMC free article] [PubMed] [Google Scholar]
- Polavaram S, Ascoli GA (2017) An ontology-based search engine for digital reconstructions of neuronal morphology. Brain Inform 4:123–134. 10.1007/s40708-017-0062-x [DOI] [PMC free article] [PubMed] [Google Scholar]
- Poldrack RA, Gorgolewski KJ (2014) Making big data open: data sharing in neuroimaging. Nat Neurosci 17:1510–1517. 10.1038/nn.3818 [DOI] [PubMed] [Google Scholar]
- Prins P, de Ligt J, Tarasov A, Jansen RC, Cuppen E, Bourne PE (2015) Toward effective software solutions for big biology. Nat Biotechnol 33:686–687. 10.1038/nbt.3240 [DOI] [PubMed] [Google Scholar]
- Quina LA, Tempest L, Ng L, Harris JA, Ferguson S, Jhou TC, Turner EE (2015) Efferent pathways of the mouse lateral habenula. J Comp Neurol 523:32–60. 10.1002/cne.23662 [DOI] [PMC free article] [PubMed] [Google Scholar]
- Reimann MW, Gevaert M, Shi Y, Lu H, Markram H, Muller E (2019) A null model of the mouse whole-neocortex micro-connectome. Nat Commun 10:3903. 10.1038/s41467-019-11630-x [DOI] [PMC free article] [PubMed] [Google Scholar]
- Roth BL (2016) DREADDs for neuroscientists. Neuron 89:683–694. 10.1016/j.neuron.2016.01.040 [DOI] [PMC free article] [PubMed] [Google Scholar]
- Scorcioni R, Polavaram S, Ascoli GA (2008) L-Measure: a web-accessible tool for the analysis, comparison and search of digital reconstructions of neuronal morphologies. Nat Protoc 3:866–876. 10.1038/nprot.2008.51 [DOI] [PMC free article] [PubMed] [Google Scholar]
- Seecharan DJ, Kulkarni AL, Lu L, Rosen GD, Williams RW (2003) Genetic control of interconnected neuronal populations in the mouse primary visual system. J Neurosci 23:11178–11188. 10.1523/JNEUROSCI.23-35-11178.2003 [DOI] [PMC free article] [PubMed] [Google Scholar]
- Sloan Z, Arends D, Broman KW, Centeno A, Furlotte N, Nijveen H, Yan L, Zhou X, Williams RW, Prins P (2016) GeneNetwork: framework for web-based genetics. JOSS 1:25 10.21105/joss.00025 [DOI] [Google Scholar]
- Sukhov A, Burrall B, Maverakis E (2016) The history of open access medical publishing: a comprehensive review. Dermatol Online J 22:13030. [PubMed] [Google Scholar]
- Tye KM, Deisseroth K (2012) Optogenetic investigation of neural circuits underlying brain disease in animal models. Nat Rev Neurosci 13:251–266. 10.1038/nrn3171 [DOI] [PMC free article] [PubMed] [Google Scholar]
- Van Essen DC, Donahue CJ, Coalson TS, Kennedy H, Hayashi T, Glasser MF (2019) Cerebral cortical folding, parcellation, and connectivity in humans, nonhuman primates, and mice. Proc Natl Acad Sci U S A 116:26173–26180. 10.1073/pnas.1902299116 [DOI] [PMC free article] [PubMed] [Google Scholar]
- Van Nguyen D, Grebenkov D, Le Bihan D, Li J-R (2015) Numerical study of a cylinder model of the diffusion MRI signal for neuronal dendrite trees. J Magn Reson 252:103–113. 10.1016/j.jmr.2015.01.008 [DOI] [PubMed] [Google Scholar]
- Voelkl B, Altman NS, Forsman A, Forstmeier W, Gurevitch J, Jaric I, Karp NA, Kas MJ, Schielzeth H, Van de Casteele T, Würbel H (2020) Reproducibility of animal research in light of biological variation. Nat Rev Neurosci 21:384–393. 10.1038/s41583-020-0313-3 [DOI] [PubMed] [Google Scholar]
- Wang Q, Ding S-L, Li Y, Royall J, Feng D, Lesnar P, Graddis N, Naeemi M, Facer B, Ho A, Dolbeare T, Blanchard B, Dee N, Wakeman W, Hirokawa KE, Szafer A, Sunkin SM, Oh SW, Bernard A, Phillips JW, et al. (2020) The Allen mouse brain common coordinate framework: a 3D reference atlas. Cell 181:936–953.e20. 10.1016/j.cell.2020.04.007 [DOI] [PMC free article] [PubMed] [Google Scholar]
- Whissell PD, Tohyama S, Martin LJ (2016) The use of DREADDs to deconstruct behavior. Front Genet 7:70. 10.3389/fgene.2016.00070 [DOI] [PMC free article] [PubMed] [Google Scholar]
- Whitesell JD, Liska A, Coletta L, Hirokawa KE, Bohn P, Williford A, Groblewski PA, Graddis N, Kuan L, Knox JE, Ho A, Wakeman W, Nicovich PR, Nguyen TN, Garren E, van Velthoven CTJ, Fong O, Feng D, Naeemi M, Henry AM, et al. (2020) Regional, layer, and cell-class specific connectivity of the mouse default mode network. Advance online publication. Retrieved December 7, 2020. doi: 10.1101/2020.05.13.094458. [DOI] [PMC free article] [PubMed] [Google Scholar]
- Wilkinson MD, Dumontier M, Aalbersberg IJJ, Appleton G, Axton M, Baak A, Blomberg N, Boiten J-W, da Silva Santos LB, Bourne PE, Bouwman J, Brookes AJ, Clark T, Crosas M, Dillo I, Dumon O, Edmunds S, Evelo CT, Finkers R, Gonzalez-Beltran A, et al. (2016) The FAIR Guiding Principles for scientific data management and stewardship. Sci Data 3:160018. 10.1038/sdata.2016.18 [DOI] [PMC free article] [PubMed] [Google Scholar]
- Williams RW (1994) The portable dictionary of the mouse genome: a personal database for gene mapping and molecular biology. Mamm Genome 5:372–375. 10.1007/BF00356557 [DOI] [PubMed] [Google Scholar]
- Williams RW (2009) Herding cats: the sociology of data integration. Front Neurosci 3:154–156. 10.3389/neuro.01.016.2009 [DOI] [PMC free article] [PubMed] [Google Scholar]
- Winnubst J, Bas E, Ferreira TA, Wu Z, Economo MN, Edson P, Arthur BJ, Bruns C, Rokicki K, Schauder D, Olbris DJ, Murphy SD, Ackerman DG, Arshadi C, Baldwin P, Blake R, Elsayed A, Hasan M, Ramirez D, Dos Santos B, et al. (2019) Reconstruction of 1,000 projection neurons reveals new cell types and organization of long-range connectivity in the mouse brain. Cell 179:268–281. e213. 10.1016/j.cell.2019.07.042 [DOI] [PMC free article] [PubMed] [Google Scholar]
- Ye R, Carneiro AM, Han Q, Airey D, Sanders-Bush E, Zhang B, Lu L, Williams R, Blakely RD (2014) Quantitative trait loci mapping and gene network analysis implicate protocadherin-15 as a determinant of brain serotonin transporter expression. Genes Brain Behav 13:261–275. 10.1111/gbb.12119 [DOI] [PMC free article] [PubMed] [Google Scholar]
- Zawadzki K, Feenders C, Viana MP, Kaiser M, Costa LDF (2012) Morphological homogeneity of neurons: searching for outlier neuronal cells. Neuroinformatics 10:379–389. 10.1007/s12021-012-9150-5 [DOI] [PubMed] [Google Scholar]
- Zuccala A (2010) Open access and civic scientific information literacy. Information Res 15:1–27. [Google Scholar]