Figure 4.
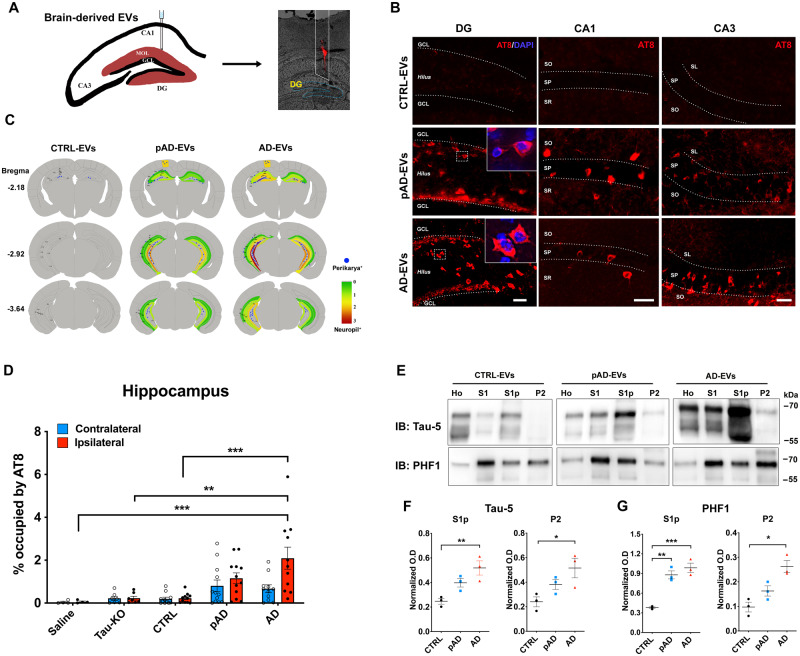
Alzheimer’s disease EV but not control EV injection causes progressive tauopathy in aged B6 mouse brains. (A) A schema illustrating 300 pg of tau containing EVs from human brain unilaterally injected to the hippocampus of B6 mice at 18–19 months of age. DiI (red) indicated the injection site of the OML of the hippocampus. (B) Representative image of AT8 staining (red) 4.5 months after intrahippocampal injection of Alzheimer’s disease EV and pAD EV into aged B6 mouse brain. Original magnification: ×20. Scale bar = 50 μm. (C) Semi-quantitative analysis of Alzheimer’s disease-like tau pathologies based on AT8 immunostaining of brains from control, pAD, and Alzheimer’s disease (AD) EV-injected mice at 4.5 months post-injection. Blue dots represent AT8+ perikaryal inclusions. AT8+ density from green (0, low) to red (3, high). (D) Quantification of AT8+ occupied area in the contralateral (blue) and ipsilateral (red) in entire hippocampal regions of recipient mice. **P < 0.01 and ***P < 0.001 compared with the control EV group determined by one-way ANOVA (alpha = 0.05) and Tukey’s post hoc. Total mice in each group for the quantification were 4, 6, 12, 12, and 11 for saline, tau-KO, control, pAD, and Alzheimer’s disease. Two donors for EVs per group for control (Donors 1 and 2), pAD (Donors 4 and 5), and Alzheimer’s disease (Donors 7 and 9), (n = 5–6 mice per donor). Bregma −1.34 to −3.64, four sections per mouse were analysed. Each dot represents mean value from one animal. Graphs indicate mean ± SEM. (E) Immunoblotting of biochemically fractionated brain tissue samples for homogenate (Ho), TBS supernatant (S1), tau oligomer enriched (S1p) and tau fibril enriched fractions (P2) by Tau-5 (total tau) and PHF1 (pSer396/pSer404 tau) (top) and their quantification (bottom). Equal proportions of homogenate (Ho), S1, S1p, and P2 fractions were analysed (n = 3 mice/group). Optical density (OD) was normalized to that for the homogenate fraction from each corresponding mouse. *P < 0.05, **P < 0.01 and ***P < 0.001 compared with the control group as determined by one-way ANOVA (alpha = 0.05) and Tukey’s post hoc. Graphs indicate mean ± SEM. CTRL = control; DG = dentate gyrus; IB = immunoblot.

