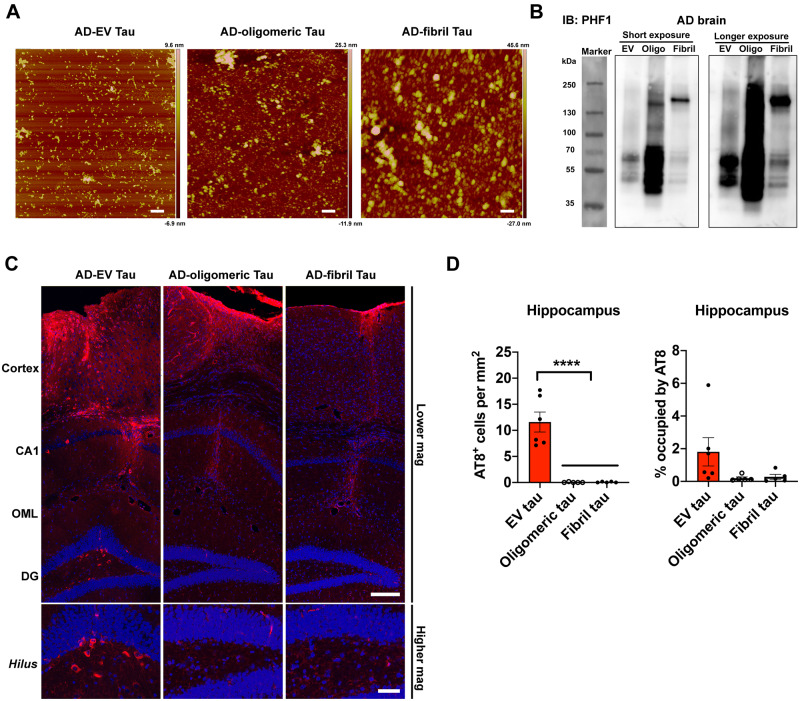
Figure 5.
EV-tau but not oligomeric or fibrillar tau enriched samples derived from the same Alzheimer’s disease brain induced tau propagation in mouse brain. (A) Atomic force microscopy images of EVs and tau aggregates isolated from the same Alzheimer’s disease (AD) brain tissues. Scale bars = 200 nm. (B) Representative images of PHF1 immunoblotting of isolated EVs, tau oligos and tau fibrils by PHF1 antibody. (C) Representative images of AT8 immunostained recipient mice after unilateral injection of Alzheimer’s disease EVs (left), tau oligomer-enriched fraction (middle) and tau fibril-enriched fraction (right) in cortical region (top) and dentate gyrus (DG, bottom). Scale bars = 200 µm (top), 50 µm (bottom). (D) Quantification of AT8+ neurons in the hippocampus of recipient mice. ****P < 0.0001 compared between EV-tau injected group and oligomeric or fibril tau group, as determined by one-way ANOVA (alpha = 0.05) and Tukey’s post hoc. EV-tau, oligomeric, and fibril tau group: n = 5–6 mice per group for quantification. Bregma −1.34 to −3.64, four sections per mouse were analysed. Each dot represents mean value per animal. Graphs indicate mean ± SEM. (A–D) Donor 7 was used (Supplementary Table 2). IB = immunoblot.

