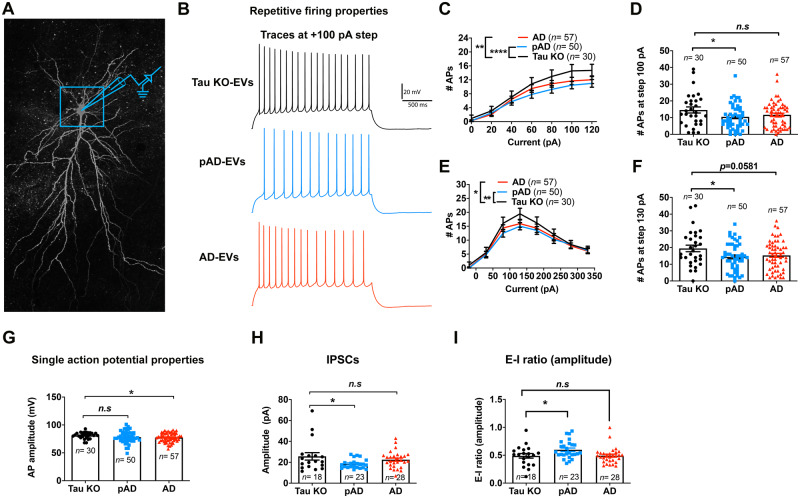
Figure 8.
Whole-cell patch clamp recording of CA1 pyramidal neurons. (A) Confocal z-stack montage (×63 magnification) image of biocytin-filled mouse CA1 pyramidal neurons after recording. (B–G) AP-firing recorded in whole-cell current clamp mode. (B) Representative traces for tau-KO (black colour), pAD (blue colour), and Alzheimer’s disease EV (red colour) for 100 pA steps at 2-s long high input resistance protocol. (C) Quantification of repetitive firing at high input resistance step current injection protocol. **P < 0.01 Alzheimer’s disease EV versus tau-KO EV, ****P < 0.0001 as group as determined by two-way ANOVA; (D) pAD EV significantly reduce the firing at 100 pA, *P < 0.05 pAD EV versus tau-KO EV as determined by one-way ANOVA. (E) Quantification of repetitive firing at high input resistance step current injection protocol. *P < 0.05 Alzheimer’s disease EV versus tau-KO EV, **P < 0.01 as group as determined by two-way ANOVA. (D) pAD EV significantly reduce the firing at 130 pA, *P < 0.05 pAD EV versus tau-KO EV as determined by one-way ANOVA. (G) Alzheimer’s disease EVs significantly reduced AP amplitude, *P < 0.05 Alzheimer’s disease EV versus tau-KO EV, as determined by one-way ANOVA. (C–G) n = 30, 50, and 57 cells for tau-KO, pAD, and Alzheimer’s disease (AD) EV injected mice, respectively; n = 5–7 mice per group. Each dot represents one recorded cell. Graphs indicate mean ± SEM. (H and I) Quantification of GABAergic sIPSCs recorded in whole-cell voltage clamp mode from neuronal network. The pAD group showed a significant decrease in sIPSC amplitude (H) and E-I amplitude ratio (I). *P < 0.05 as compared with the control group, as determined by one-way ANOVA (alpha = 0.05) and Dunnett’s post hoc. (H and I) n = 18, 23, and 28 cells for tau-KO, pAD and Alzheimer’s disease-EV injected mice, n = 5–7 mice per group. Each dot represents one recorded cell. Graphs indicate mean ± SEM. (A–I) Donors 1, 4 and 7 were used (Supplementary Table 2). See also Supplementary Tables 4–7.

