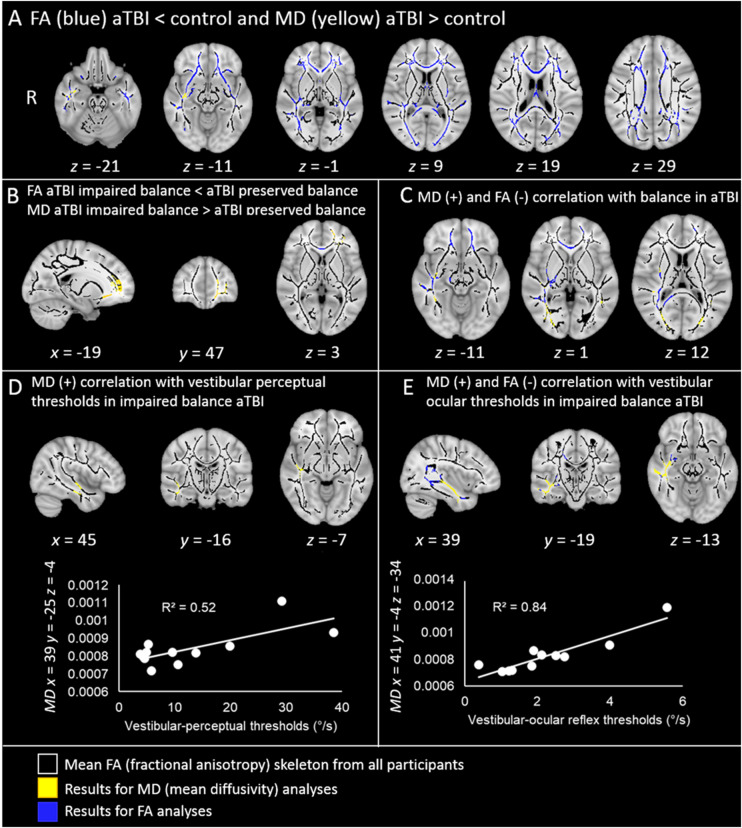
Figure 3.
Widespread white matter disruption following TBI and correlations with behavioural measures. All contrasts are overlaid upon a standard MNI 152 T1 1 mm brain atlas and the mean FA skeleton (black) with display thresholds set to range from 0.2 to 0.8. The results of FA tract-based spatial statistics contrasts (blue) and the results of MD tract-based spatial statistics contrasts (yellow), are thresholded at P < 0.05, corrected for multiple comparisons. (A) Axial slices of the results of the FA contrast acute TBI < control (blue), and of the MD contrast between acute TBI > control groups (yellow). (B) Sagittal, coronal and axial slices of the results of the FA contrast between patients with impaired balance < patients with preserved balance (blue), and of the MD contrast between patients with impaired balance > patients with preserved balance (yellow). (C) Axial slices of the results of the contrast where MD values positively correlate with balance performance (yellow), and where FA values negatively correlate with balance performance in acute TBI patients (i.e. the higher the MD values, the more instability in acute TBI; the lower the FA values, the more instability in acute TBI). (D) Top: Orthogonal view of the areas in the inferior longitudinal fasciculus where patients with impaired balance (but not patients with preserved balance and controls) showed significant positive correlations between MD and vestibular-perceptual thresholds (i.e. the higher the MD value, the more severe the vestibular agnosia, in acute TBI with impaired balance). Bottom: The plot shows the positive correlation between MD and vestibular-perceptual thresholds (°/s) in the significant voxel in the inferior longitudinal fasciculus with the highest correlation with vestibular-perceptual thresholds (x = 39, y = −25, z = −4). (E) Top: Orthogonal view of the areas where patients with impaired balance (but not patients with preserved balance and controls) showed significant correlations between vestibular-ocular reflex thresholds and MD (positive correlation, in yellow) and between vestibular-ocular thresholds and FA (negative correlations, in blue). Bottom: For illustrative purposes, the plot shows the positive correlation between MD and vestibular-ocular reflex thresholds (°/s), in the voxel with the highest correlation with vestibular-ocular reflex thresholds (x = 41, y = −4, z = −34).

