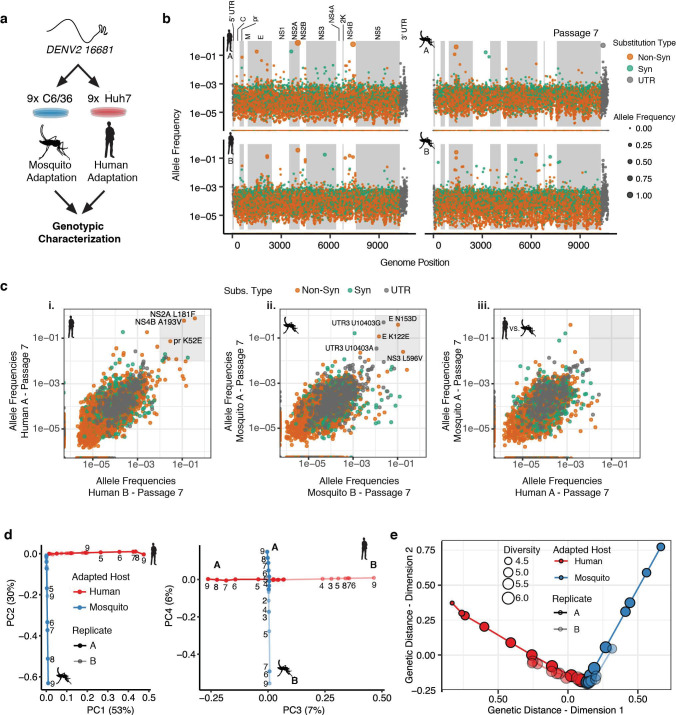
Figure 2. Adapting viral lineages show host-specific patterns of genetic variance.
(a) Adapted viral populations were subject to genotypic characterization by ultra-deep sequencing using the CirSeq procedure. (b) Plots of allele frequency across the viral genomes for all four viral populations at passage 7. Alleles are colored by mutation type (Nonsynonymous, Orange; Synonymous, Green; Mutations in the untranslated region (UTR), Dark Gray). Shaded regions denote mature peptide boundaries in viral ORF. (c) Scatter plots comparing allele frequencies between adapted populations of human- and mosquito-adapted dengue virus. Replicate host-adapted populations share multiple high-frequency non-synonymous mutations, but populations from alternative hosts do not (gray square, >10%). (d) Dimension reduction of the allele frequencies by principal components analysis summarizes the host-specific patterns of variance (left), and the replicate-specific differences in genetic variability over passage (right). (e) A two-dimensional embedding of the pairwise genetic distances between the sequenced viral populations (Weir-Reynolds Distance) by multidimensional scaling. The viral populations (red- and blue-hued trajectories) project out from the founding genotype in orthogonal and host-specific directions.


