Abstract
Background
Obesity has been shown to have a positive mortality benefit in patients undergoing percutaneous coronary intervention, dialysis, those with rheumatoid arthritis, chronic obstructive pulmonary disease, and various wasting diseases. Studies for this mortality benefit in ischemic stroke patients are conflicting, and it has not been well studied in mechanical thrombectomy patients. We sought to determine the impact of obesity on outcomes of mechanical thrombectomy patients.
Methodology
We used a large global health research network to gather clinical data extracted from the electronic medical records of ischemic stroke patients who underwent mechanical thrombectomy, and then stratified these patients into obese and non-obese cohorts. The primary endpoint was mortality.
Results
After propensity score matching, obese patients who underwent mechanical thrombectomy had decreased mortality (p = 0.0033, odds ratio = 0.81, 95% confidence interval = 0.704,0.932) compared to non-obese patients. No statistically significant difference was shown between these two cohorts for the outcomes of ventilator dependence, hemicraniectomy, or post-procedure intracerebral hemorrhage.
Conclusion
Despite increasing risk of ischemic stroke, obese patients who undergo mechanical thrombectomy have decreased mortality rates compared to their non-obese counterparts.
Keywords: neurosurgery, stroke, thrombectomy, obesity, outcomes, mortality, hemorrhagic conversion, trinetx, bmi, cerebrovascular
Introduction
Obesity increases the risk of stroke [1-4]. Risk increases roughly 6% with increase in body mass index (BMI) [4]. Despite this, obesity has been shown to have a positive mortality benefit in stroke patients [4-14]; however, not all studies agree [15,16]. A recent study examined mortality as an outcome for ischemic stroke patients undergoing mechanical thrombectomy. The study found that higher BMI is associated with decreased intracerebral hemorrhage post-procedure, and that BMI positively correlates with non-hemorrhagic inpatient mortality [3]. We sought to support or refute this claim using a multi-institutional database.
Materials and methods
The TriNetX research database was retrospectively queried to evaluate all patients with a diagnosis of ischemic stroke who underwent mechanical thrombectomy. The patients were then divided into cohorts of obese and overweight versus non-obese and non-overweight patients according to the International Classification of Diseases, Tenth Revision code E66. Analysis was performed using unmatched and propensity score-matched cohorts using known stroke risk factors. The primary endpoint was mortality. The secondary endpoints included ventilator dependence, hemicraniectomy, and intracerebral hemorrhage. Hazard ratios were calculated using R Studio’s survival package v3.2-3 and were validated comparing the output to that of SAS version 9.4. Chi-square analysis was performed on categorical variables.
Results
The baseline demographics and characteristics are shown in Table 1. Of the patients who underwent mechanical thrombectomy, 3,230 were obese and 8,256 were non-obese.
Table 1. Baseline demographics and characteristics. Top box represents cohort 1: thrombectomy and obese. Bottom box represents cohort 2: thrombectomy and non-obese.
ICD, International Classification of Diseases, Tenth Revision; Index, date of thrombectomy; Max, maximum; Min, minimum; SD, standard deviation; Std diff, standard difference
| Demographics, ICD 10 codes/Diagnoses | Mean ± SD | Min | Max | P-Value | Std diff | Patients | % of Cohort |
| Age at index | 67.2 ± 13.4 | 13 | 90 | <0.0001 | 0.2372 | 3,230 | 100% |
| 70.5 ± 14.6 | 0 | 90 | 8,256 | 100% | |||
| <0.0001 | 0.105 | 1,804 | 56% | ||||
| Female | 4,179 | 51% | |||||
| <0.0001 | 0.105 | 1,426 | 44% | ||||
| Male | 4,077 | 49% | |||||
| <0.0001 | 0.1512 | 2,382 | 74% | ||||
| Unknown race | 6,613 | 80% | |||||
| <0.0001 | 0.0902 | 652 | 20% | ||||
| White | 1,378 | 17% | |||||
| <0.0001 | 0.1456 | 189 | 6% | ||||
| African American | 238 | 3% | |||||
| 0.8821 | 0.0031 | 10 | 0% | ||||
| Asian | 27 | 0% | |||||
| E08-E13 | <0.0001 | 0.4556 | 1,602 | 50% | |||
| Diabetes mellitus | 2,308 | 28% | |||||
| E78 | <0.0001 | 0.4244 | 2,398 | 74% | |||
| Disorders of lipoprotein metabolism and other lipidemias | 4,487 | 54% | |||||
| I10-I16 | <0.0001 | 0.4455 | 2,749 | 85% | |||
| Hypertensive diseases | 5,489 | 66% | |||||
| I20-I25 | <0.0001 | 0.2162 | 1,424 | 44% | |||
| Ischemic heart diseases | 2,775 | 34% | |||||
| I73 | <0.0001 | 0.1782 | 573 | 18% | |||
| Other peripheral vascular diseases | 947 | 11% | |||||
| J40-J47 | <0.0001 | 0.2939 | 1,250 | 39% | |||
| Chronic lower respiratory diseases | 2,076 | 25% | |||||
| F17 | <0.0001 | 0.1478 | 704 | 22% | |||
| Nicotine dependence | 1,323 | 16% | |||||
| F10.1 | 0.0958 | 0.0339 | 126 | 4% | |||
| Alcohol abuse | 270 | 3% | |||||
| N17-N19 | <0.0001 | 0.2712 | 1,143 | 35% | |||
| Acute kidney failure and chronic kidney disease | 1,912 | 23% | |||||
| K74 | <0.0001 | 0.0836 | 73 | 2% | |||
| Fibrosis and cirrhosis of liver | 97 | 1% | |||||
| I48 | <0.0001 | 0.1062 | 1,188 | 37% | |||
| Atrial fibrillation and flutter | 2,621 | 32% | |||||
| I50 | <0.0001 | 0.2549 | 1,127 | 35% | |||
| Heart failure | 1,932 | 23% |
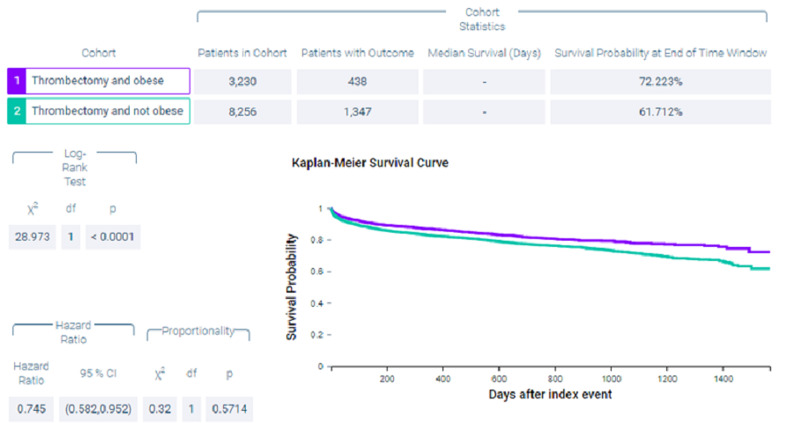
Figure 1 shows measures of association for cohort 1 (thrombectomy and obese) versus cohort 2 (thrombectomy and non-obese) for the outcome of mortality. Figure 2 shows a Kaplan-Meier analysis for this outcome. A total of 13.56% of patients in cohort 1 and 16.315% of patients in cohort 2 died (p < 0.0002, odds ratio [OR] = 0.805, 95% confidence interval [CI] = 0.716,0.904). Survival probability at the end of 1,600 days after mechanical thrombectomy was 72.223% for cohort 1 and 61.712% for cohort 2.
Figure 1. Measures of association for the outcome deceased.
Figure 2. Kaplan-Meier analysis for the outcome deceased.
Index event, date of thrombectomy
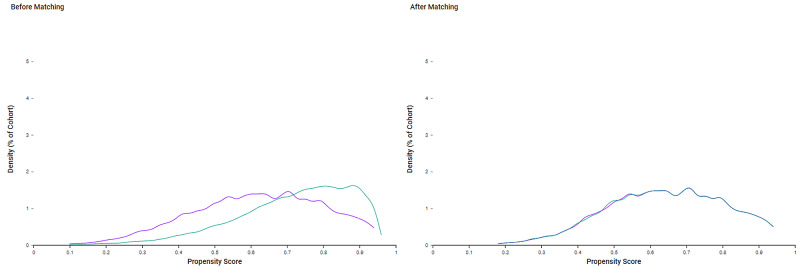
Because of the differences in baseline demographics seen in Table 1, cohorts were propensity score-matched (Figure 3). As seen in Table 2, after propensity score matching, both cohort 1 (thrombectomy and obese) and cohort 2 (thrombectomy and non-obese) included 3,020 patients.
Table 2. Baseline demographics and characteristics after matching. Top box represents cohort 1: thrombectomy and obese. Bottom box represents cohort 2: thrombectomy and non-obese.
ICD, International Classification of Diseases, Tenth Revision; Index, date of thrombectomy; Max, maximum; Min, minimum; SD, standard deviation; Std diff, standard difference
| Demographics, ICD 10 codes/Diagnoses | Mean ± SD | Min | Max | P-Value | Std diff | Patients | % of Cohort |
| Age at index | 67.9 ± 13.1 | 0.8706 | 0.0042 | 3,020 | 100% | ||
| 67.9 ± 15.3 | 3,020 | 100% | |||||
| 0.9056 | 0.0031 | 2,258 | 74.77% | ||||
| Female | 2,262 | 74.90% | |||||
| 0.7959 | 0.0067 | 1,656 | 54.83% | ||||
| Male | 1,666 | 55.17% | |||||
| 0.7959 | 0.0067 | 1,364 | 45.17% | ||||
| Unknown race | 1,354 | 44.83% | |||||
| 0.6753 | 0.0108 | 608 | 20.13% | ||||
| White | 595 | 19.70% | |||||
| 0.5562 | 0.0151 | 147 | 4.87% | ||||
| African American | 157 | 5.20% | |||||
| 1 | <0.0001 | 10 | 0.33% | ||||
| Asian | 10 | 0.33% | |||||
| E08-E13 | 0.6002 | 0.0135 | 2,539 | 84.07% | |||
| Diabetes mellitus | 2,524 | 83.58% | |||||
| E78 | 0.885 | 0.0037 | 2,198 | 72.78% | |||
| Disorders of lipoprotein metabolism and other lipidemias | 2,203 | 72.95% | |||||
| I10-I16 | 0.8165 | 0.006 | 1,411 | 46.72% | |||
| Hypertensive diseases | 1,420 | 47.02% | |||||
| I20-I25 | 0.3353 | 0.0248 | 1,298 | 42.98% | |||
| Ischemic heart diseases | 1,261 | 41.76% | |||||
| I73 | 0.7687 | 0.0076 | 1,106 | 36.62% | |||
| Other peripheral vascular diseases | 1,095 | 36.26% | |||||
| J40-J47 | 0.6878 | 0.0103 | 1,098 | 36.36% | |||
| Chronic lower respiratory diseases | 1,083 | 35.86% | |||||
| F17 | 0.228 | 0.031 | 1,014 | 33.58% | |||
| Nicotine dependence | 970 | 32.12% | |||||
| F10.1 | 0.7634 | 0.0077 | 1,002 | 33.18% | |||
| Alcohol abuse | 991 | 32.82% | |||||
| N17-N19 | 0.7741 | 0.0074 | 623 | 20.63% | |||
| Acute kidney failure and chronic kidney disease | 614 | 20.33% | |||||
| K74 | 0.6279 | 0.0125 | 507 | 16.79% | |||
| Fibrosis and cirrhosis of liver | 493 | 16.33% | |||||
| I48 | 0.2357 | 0.0305 | 115 | 3.81% | |||
| Atrial fibrillation and flutter | 98 | 3.25% | |||||
| I50 | 0.846 | 0.005 | 53 | 1.76% | |||
| Heart failure | 55 | 1.82% |
Figure 3. Propensity score matching. Purple: thrombectomy and obese. Green: thrombectomy and non-obese.
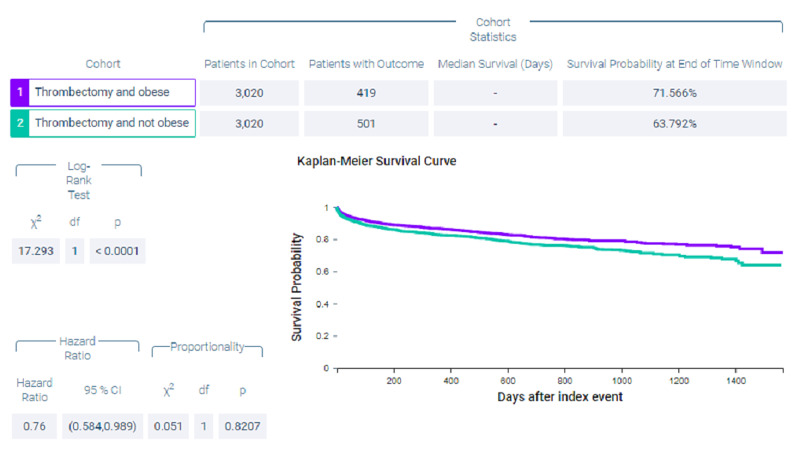
Figure 4 shows measures of association for both cohort 1 (thrombectomy and obese) and cohort 2 (thrombectomy and non-obese) for the outcome of mortality. Figure 5 shows a Kaplan-Meier analysis for this outcome. A total of 13.874% of patients in cohort 1 and 16.589% of patients in cohort 2 died (p = 0.0033, OR = 0.81, 95% CI = 0.704,0.932). Survival probability at the end of 1,600 days after mechanical thrombectomy was 71.566% for cohort 1 and 63.792% for cohort 2.
Figure 4. Measures of association for the matched cohort; outcome: deceased.
Figure 5. Kaplan-Meier analysis for the matched cohort; outcome: deceased.
Figure 6 shows measures of association for both cohort 1 (thrombectomy and obese) and cohort 2 (thrombectomy and non-obese) for the outcome of ventilator dependence. Figure 7 shows a Kaplan-Meier analysis for this outcome. A total of 7.947% of patients in cohort 1 required ventilator use compared to 7.351% of patients in cohort 2 (p = 0.3835, OR = 1.088, 95% CI = 0.9,1.316).
Figure 6. Measures of association for the matched cohort; outcome: ventilator dependence.
Figure 7. Kaplan-Meier analysis for the matched cohort; outcome: ventilator dependence.
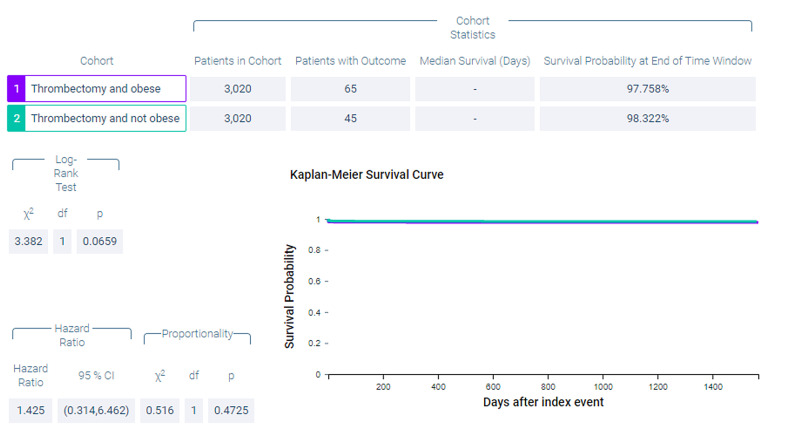
Figure 8 shows measures of association for both cohort 1 (thrombectomy and obese) and cohort 2 (thrombectomy and non-obese) for the outcome of hemicraniectomy. Figure 9 shows a Kaplan-Meier analysis for this outcome. A total of 2.152% of patients in cohort 1 underwent hemicraniectomy compared to 1.49% of patients in cohort 2 (p = 0.0543, OR = 1.454, 95% CI = 0.991,2.134).
Figure 8. Measures of association for the matched cohort; outcome: hemicraniectomy.
Figure 9. Kaplan-Meier analysis for the matched cohort; outcome: hemicraniectomy.
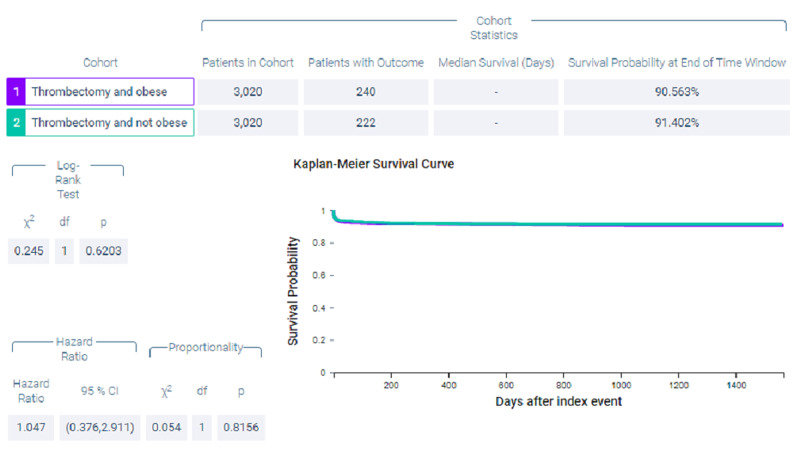
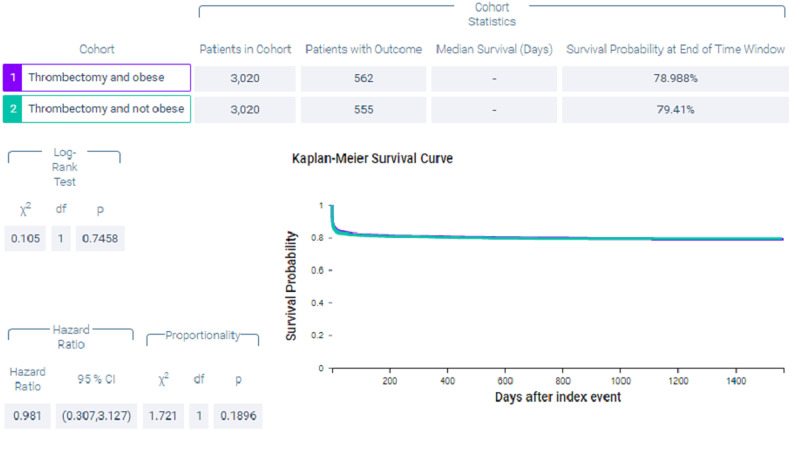
Figure 10 shows measures of association for both cohort 1 (thrombectomy and obese) and cohort 2 (thrombectomy and non-obese) for the outcome of intracerebral hemorrhage. Figure 11 shows a Kaplan-Meier analysis for this outcome. A total of 18.609% of patients in cohort 1 experienced post-procedural intracerebral hemorrhage compared to 18.377% of patients in cohort 2 (p = 0.8165, OR = 1.015, 95% CI = 0.892,1.156).
Figure 10. Measures of association for the matched cohort; outcome: intracerebral hemorrhage.
Figure 11. Kaplan-Meier analysis for the matched cohort; outcome: intracerebral hemorrhage.
Discussion
Over 30% of the world’s population is estimated to be overweight, and this number is increasing [4]. A meta-analysis from 2008 showed that patients with higher BMI had better mortality in heart failure. Further studies have shown similar outcomes in patients undergoing percutaneous coronary intervention, dialysis, those with rheumatoid arthritis, chronic obstructive pulmonary disease, and various wasting diseases [4,17-22]. This became known as the obesity paradox, wherein those undergoing vascular reperfusion for myocardial infarction and obese patients had decreased mortality [3,23,24].
Of the 12 studies examining BMI and stroke, 10 showed higher BMI to be associated with lower mortality [4-14]. Two of the studies did not show such an association when adjusted for stroke severity [16] and when looking at mortality within a 30-day period [15]. To my knowledge, only one study examined BMI as it relates to mechanical thrombectomy. It is possible that higher BMI might influence time to arterial puncture due to increased difficulties gaining arterial access in obese patients, transporting obese patients, and transferring obese patients [3]. They found that higher BMI is associated with decreased intracerebral hemorrhage post-procedure, and that BMI correlates with higher non-hemorrhagic inpatient mortality [3]. However, the results of this study disagree and show no statistical difference in post-procedure hemorrhage rates, as well as decreased mortality in obese patients.
This analysis was not without limitations. The major limitation of this study was that it was retrospective in nature. Furthermore, due to the nature of the database, patient-level data on specific outcomes could not be collected. Moreover, radiology information was not available. Additionally, information on the type of diagnostic test used for the confirmation of disease was not available. The data collected was for billing purposes, not for clinical use, and thus much clinical information is missing. In addition, some misidentification is inevitable in database studies.
Conclusions
Despite increasing risk of ischemic stroke, obese patients who undergo mechanical thrombectomy have decreased mortality rates compared to their non-obese counterparts. Future studies can use a frailty index to assess mortality in this population.
The content published in Cureus is the result of clinical experience and/or research by independent individuals or organizations. Cureus is not responsible for the scientific accuracy or reliability of data or conclusions published herein. All content published within Cureus is intended only for educational, research and reference purposes. Additionally, articles published within Cureus should not be deemed a suitable substitute for the advice of a qualified health care professional. Do not disregard or avoid professional medical advice due to content published within Cureus.
The authors have declared that no competing interests exist.
Human Ethics
Consent was obtained or waived by all participants in this study
Animal Ethics
Animal subjects: All authors have confirmed that this study did not involve animal subjects or tissue.
References
- 1.Excess body weight and incidence of stroke: meta-analysis of prospective studies with 2 million participants. Strazzullo P, D’Elia L, Cairella G, Garbagnati F, Cappuccio FP, Scalfi L. Stroke. 2010;41:26. doi: 10.1161/STROKEAHA.109.576967. [DOI] [PubMed] [Google Scholar]
- 2.Body mass index and the risk of stroke in men. Kurth T, Gaziano JM, Berger K, et al. Arch Intern Med. 2002;162:2557–2562. doi: 10.1001/archinte.162.22.2557. [DOI] [PubMed] [Google Scholar]
- 3.Effect of body mass index on outcomes of mechanical thrombectomy in acute ischemic stroke. Chen SH, McCarthy D, Saini V, Brunet MC, Peterson EC, Yavagal D, Starke RM. World Neurosurg. 2020;143:503–515. doi: 10.1016/j.wneu.2020.07.220. [DOI] [PubMed] [Google Scholar]
- 4.Obesity paradox in stroke ± myth or reality? A systematic review. Oesch L, Tatlisumak T, Arnold M, Sarikaya H. PLoS One. 2017;12:171334. doi: 10.1371/journal.pone.0171334. [DOI] [PMC free article] [PubMed] [Google Scholar]
- 5.Body mass index and poststroke mortality. Olsen TS, Dehlendorff C, Petersen HG, Andersen KK. Neuroepidemiology. 2008;30:93–100. doi: 10.1159/000118945. [DOI] [PubMed] [Google Scholar]
- 6.The obesity paradox in stroke: lower mortality and lower risk of readmission for recurrent stroke in obese stroke patients. Andersen KK, Olsen TS. Int J Stroke. 2015;10:99–104. doi: 10.1111/ijs.12016. [DOI] [PubMed] [Google Scholar]
- 7.The impact of body mass index on mortality after stroke. Towfighi A, Ovbiagele B. Stroke. 2009;40:2704–2708. doi: 10.1161/STROKEAHA.109.550228. [DOI] [PubMed] [Google Scholar]
- 8.Association between obesity and mortality after acute first-ever stroke: the obesity-stroke paradox. Vemmos K, Ntaios G, Spengos K, et al. Stroke. 2011;42:30–36. doi: 10.1161/STROKEAHA.110.593434. [DOI] [PubMed] [Google Scholar]
- 9.Paradoxical longevity in obese patients with intracerebral hemorrhage. Kim BJ, Lee SH, Ryu WS, Kim CK, Lee J, Yoon BW. Neurology. 2011;76:567–573. doi: 10.1212/WNL.0b013e31820b7667. [DOI] [PubMed] [Google Scholar]
- 10.Dynamics of obesity paradox after stroke, related to time from onset, age, and causes of death. Kim BJ, Lee SH, Jung KH, Yu KH, Lee BC, Roh JK, For Korean Stroke Registry investigators. Neurology. 2012;79:856–863. doi: 10.1212/WNL.0b013e318266fad1. [DOI] [PubMed] [Google Scholar]
- 11.Prestroke factors associated with poststroke mortality and recovery in older women in the women’s health initiative. Bell CL, Lacroix A, Masaki K, et al. J Am Geriatr Soc. 2013;61:1324–1330. doi: 10.1111/jgs.12361. [DOI] [PMC free article] [PubMed] [Google Scholar]
- 12.Association of body mass index and mortality after acute ischemic stroke. Skolarus LE, Sanchez BN, Levine DA, et al. Circ Cardiovasc Qual Outcomes. 2014;7:64–69. doi: 10.1161/CIRCOUTCOMES.113.000129. [DOI] [PMC free article] [PubMed] [Google Scholar]
- 13.Favorable functional recovery in overweight ischemic stroke survivors: findings from the China National Stroke Registry. Zhao L, Du W, Zhao X, et al. J Stroke Cerebrovasc Dis. 2014;23:201–206. doi: 10.1016/j.jstrokecerebrovasdis.2013.10.002. [DOI] [PubMed] [Google Scholar]
- 14.Overweight and obesity are associated with improved survival, functional outcome, and stroke recurrence after acute stroke or transient ischaemic attack: observations from the TEMPiS trial. Doehner W, Schenkel J, Anker SD, Springer J, Audebert H. Eur Heart J. 2013;34:268–277. doi: 10.1093/eurheartj/ehs340. [DOI] [PubMed] [Google Scholar]
- 15.Body mass index and death by stroke no obesity paradox. Dehlendorff C, Andersen KK, Olsen TS. JAMA Neurol. 2014;71:978–984. doi: 10.1001/jamaneurol.2014.1017. [DOI] [PubMed] [Google Scholar]
- 16.Body mass index, initial neurological severity and long-term mortality in ischemic stroke. Ryu WS, Lee SH, Kim CK, Kim BJ, Yoon BW. Cerebrovasc Dis. 2011;32:170–176. doi: 10.1159/000328250. [DOI] [PubMed] [Google Scholar]
- 17.Body mass index and mortality in heart failure: a meta-analysis. Oreopoulos A, Padwal R, Kalantar-Zadeh K, Fonarow GC, Norris CM, McAlister FA. Am Heart J. 2008;156:13–22. doi: 10.1016/j.ahj.2008.02.014. [DOI] [PubMed] [Google Scholar]
- 18.Obesity paradox in a cohort of 4880 consecutive patients undergoing percutaneous coronary intervention. Hastie CE, Padmanabhan S, Slack R, et al. Eur Heart J. 2010;31:222–226. doi: 10.1093/eurheartj/ehp317. [DOI] [PubMed] [Google Scholar]
- 19.Kalantar-Zadeh K, Block G, Humphreys MH, Kopple JD. Kidney Int. Vol. 63. Blackwell Publishing Inc; 2003. Reverse epidemiology of cardiovascular risk factors in maintenance dialysis patients; pp. 793–808. [DOI] [PubMed] [Google Scholar]
- 20.Paradoxical effect of body mass index on survival in rheumatoid arthritis: role of comorbidity and systemic inflammation. Escalante A, Haas RW, Del Rincón I. Arch Intern Med. 2005;165:1624–1629. doi: 10.1001/archinte.165.14.1624. [DOI] [PubMed] [Google Scholar]
- 21.Prognostic value of nutritional status in chronic obstructive pulmonary disease. Landbo C, Prescott E, Lange P, Vestbo J, Almdal TP. Am J Respir Crit Care Med. 1999;160:1856–1861. doi: 10.1164/ajrccm.160.6.9902115. [DOI] [PubMed] [Google Scholar]
- 22.Risk factor paradox in wasting diseases. Kalantar-Zadeh K, Horwich TB, Oreopoulos A, Kovesdy CP, Younessi H, Anker SD, Morley JE. Curr Opin Clin Nutr Metab Care. 2007;10:433–442. doi: 10.1097/MCO.0b013e3281a30594. [DOI] [PubMed] [Google Scholar]
- 23.Association of bodyweight with total mortality and with cardiovascular events in coronary artery disease: a systematic review of cohort studies. Romero-Corral A, Montori VM, Somers VK, et al. Lancet. 2006;368:666–678. doi: 10.1016/S0140-6736(06)69251-9. [DOI] [PubMed] [Google Scholar]
- 24.Effect of potentially modifiable risk factors associated with myocardial infarction in 52 countries (the INTERHEART study): case-control study. Yusuf PS, Hawken S, Ôunpuu S, et al. Lancet. 2004;364:937–952. doi: 10.1016/S0140-6736(04)17018-9. [DOI] [PubMed] [Google Scholar]


