

Abstract
To clarify whether a surface can be rough with faceted macrosteps that maintain their shape on the surface, crystal surface roughness is studied by a Monte Carlo method for a nucleation-limited crystal-growth process. As a surface model, the restricted solid-on-solid (RSOS) model with point-contact-type step–step attraction (p-RSOS model) is adopted. At equilibrium and at sufficiently low temperatures, the vicinal surface of the p-RSOS model consists of faceted macrosteps with (111) side surfaces and smooth terraces with (001) surfaces (the step-faceting zone). We found that a surface with faceted macrosteps has an approximately self-affine-rough structure on a ‘faceted-rough surface’; the surface width is strongly divergent at the step-disassembling point, which is a characteristic driving force for crystal growth. A ‘faceted-rough surface’ is realized in the region between the step-disassembling point and a crossover point where the single nucleation growth changes to poly-nucleation growth.
Subject terms: Theory and computation, Scaling laws, Nonlinear phenomena, Phase transitions and critical phenomena
Introduction
Determining surface roughness is crucial for understanding many phenomena associated with crystal surfaces1–13. However, developing methods to measure surface roughness has proven to be not as straightforward as had been expected14,15. The roughness of a surface is defined by the variance of the surface height associated with the roughening transition on low Miller-index surfaces such as the (001) surface at equilibrium14,15. The roughening transition belongs to the Berezinskii–Kosterlitz–Thouless (BKT)16–22 universality class. Denoting the roughening transition temperature of the (001) surface as , the (001) surface is rough for temperatures , where the square of the surface width is logarithmically divergent with respect to the linear system-size L. For , the (001) surface is smooth and the surface width is constant and does not depend on the system size.
It has been believed that a faceted surface is necessarily smooth. The roughening transition is connected to the faceting transition at equilibrium23–28. For a small crystal droplet, the shape of the droplet with the least surface free energy is the equilibrium crystal shape (ECS), which is obtained by the Wulff construction29,30 or by the Andreev method31–33. On the ECS, the faceting transition occurs at the roughening transition temperature. The Gaussian curvature on the ECS is proportional to and the inverse of the determinant of the surface stiffness tensor25. Hence, for , the Gaussian curvature of the (001) surface is zero, and the (001) surface then appears on the ECS as a facet. The ECS consists of facets of smooth surfaces and curved rough vicinal surfaces.
For “sharp” but rough surfaces at non-equilibrium, the self-affinity on a surface obtained by a symmetry principle argument can explain a wide range of surfaces or interface phenomena34–39. Here, a “sharp” surface means an atomically smooth surface locally. Hence, the surface height is well defined as h(x, y) at a site (x, y) on a 2D square lattice. Self-affinity is invariance under anisotropic scale transformations, in contrast to self-similarity, which is invariance under isotropic scale transformations. Using the surface height h(x, y), the surface width W(L, t) is defined by
| 1 |
where t is time and is an ensemble average. The surface width W(L, t) for a kinetically roughened surface is known to satisfy a Family–Vicsek scaling relation35,36:
| 2 |
where the , , and z exponents are referred to as the roughness, growth, and dynamic exponents, respectively. In the non-equilibrium steady-state (in the limit ), the surface width W becomes . The theoretical values of for a 2D surface in 3D are 0 and 0.386 for the BKT-rough and the Kardar–Parisi–Zhang (KPZ)-rough40,41 surfaces, respectively.
Although the Family–Vicsek scaling relation can explain many cases of algebraic divergence of surface or interface width, the KPZ exponent is rarely observed in crystal growth36,41,42. For example, a recent experiment on thin film growth of CdS43 showed a roughness exponent of .
Faceted-like rocky and “rough” crystal shapes such as SiC7, Si3–5, or faceted-like dendritic shapes such as snowflakes1, are commonly observed crystal formations. The branching dendrites seen in snowflakes are caused by the Mullins–Sekerka (MS) instability44 in the thermodynamic scale. The tip velocity of a dendrite obeys a universal behaviour based on MS-instability1,45. Interestingly, the branching of the tip of a dendrite for a faceted surface also seems to obey a universal behaviour. However, the reason for the similarity between tip branching for a faceted shape and a rough surface has not been studied sufficiently.
To reproduce a faceted-like shape of a crystal for “diffuse” and rough surfaces, many phase-field models have been applied46–49. The most recent phase-field model and calculations on ice49 reproduced the 3D faceted shapes, including snowflakes. Here, a “diffuse” surface means an “atomically rough” surface, originating from a liquid–gas interface21,50,51. An example of a diffuse (atomically rough) but smooth surface is the (0001) surface of He crystals in superfluid helium52. The (110) surfaces of AgSe and AgS53,54 and the (100) and (111) surfaces of tetrabrommethane55 are considered to be examples of diffuse but globally smooth surfaces at lower temperatures than the roughening transition temperatures. Since the phase-field model applies for the mesoscopic scale, it reproduces the MS instability automatically under appropriate boundary conditions.
However, the problem with phase-field modelling is the connection between the phenomenological parameters in the basic equations of the phase-field model and the physical quantities based on the atomic surface structure46–49.
The aim of this article is to clarify whether a vicinal surface with faceted macrosteps can have a self-affine-rough structure in nucleation-limited crystal growth. We will show how sharp and faceted surfaces at equilibrium can roughen while keeping a faceted structure. The squared surface width is calculated using the Monte Carlo method on the vicinal surface tilted from the (001) surface to the (111) surface. To set up faceted macrosteps at equilibrium, the restricted solid-on-solid model with point-contact-type step–step attraction (p-RSOS model)33,56–64 is adopted (refer to the section “Methods”). The temperature is set in the step-faceting zone59, where the surface tension is discontinuous, and only the (001) surface and (111) surface are thermodynamically stable at equilibrium.
Results
Faceted-rough surface
Figure 1a shows the dependence of (Eq. (15)). has a maximum at (Table 1)63. The maximum value increases as the system size increases. increases as L increases for , contrary to the expectation that is independent of system size for . Here, is the crossover point from a vicinal surface with (111) faceted macrosteps to a tilted surface with locally merged steps, and is the crossover point from single nucleation growth to poly-nucleation growth at the lower edge of a faceted macrostep63. In the region , the vicinal surface of the p-RSOS model grows in a step-detachment process in the manner of 2D poly-nucleation at the lower edge of a faceted macrostep63,64.
Figure 1.

dependence of the square of the surface width , where is the driving force for crystal growth. g is , where is the mean surface slope. . . . (a) , with a maximum value at . The lines represent different sizes and are generated from Eqs. (6)–(12). (b) scaled by with , which is the 2D KPZ roughness exponent in 3D. (c) Y(x, L) (Eq. (6)) scaled by with .
Table 1.
Characteristic driving forces.
| Value | Description | |
|---|---|---|
| 0.016 | Yielding point of the self-detachment of steps from a macrostep63 | |
| 0.049 | Crossover point from single 2D nucleation mode to 2D poly-nucleation mode63 | |
| 0.124 | Transition point between the step-assembled phase and the step-disassembled phase62,63 | |
| 0.3 | Crossover point between BKT-rough surface and KPZ-rough surface (, RSOS)65 | |
| 1.15 | Kinetic roughening point for the (001) surface65 |
Surface slope . () for , , and .
Figure 2 shows a typical morphology of a vicinal surface in the region (see also Figs. S1b, and S2a,b). From the side view of the surface, we can see that the surface is covered with (111) side-surfaces and (001) terrace-surfaces. From the top view of the surface, islands with rounded triangle shapes are seen at the lower edge of the faceted macrosteps. Though the vicinal surface seems to be covered with smooth (001) and (111) surfaces, we can confirm that the surface grows continuously under the non-equilibrium steady state63,64. Hence, we call this surface structure for the faceted-rough surface.
Figure 2.
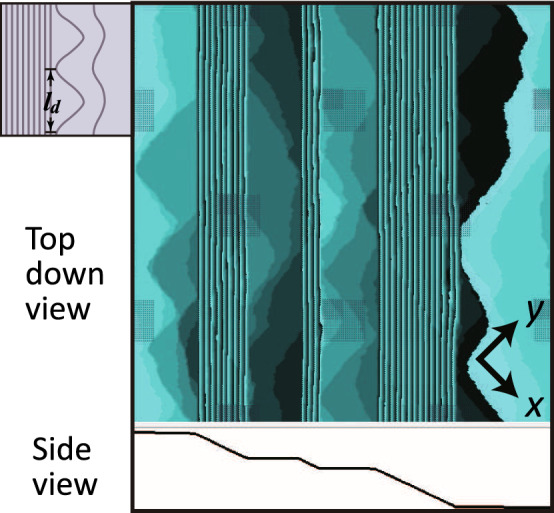
Typical morphology of a faceted-rough surface: snapshot generated by the Monte Carlo method at MCS/site. . . . Size: . . . (mean equal distance between 2D nuclei 63), , and are 28a, 13a, and MCS/site (Eq. (4)). Inset: Illustration of a step-detachment mode in a poly-nucleation process at the edge of a faceted macrostep.
Nucleation-limited continuous growth
Figure 3 shows the driving force dependences of the surface velocity V and kinetic coefficient k, where ), is the time for an MCS/site, and . In contrast to the surface width, V and k do not depend on the system size except at the region near equilibrium. V and k are similar to the original RSOS model for in the previous work65. This means that for , steps are well separated in most cases (Figs. S1 and S2e,f). It should be noted that the critical nucleus sizes with a square shape are 2 and 1 for of 1 and 2, respectively. For , k increases approximately linearly with respect to , which gives . For where the surface is rough with locally faceted macrosteps (Figs. S1 and S2c,d), k decreases rapidly as decreases.
Figure 3.
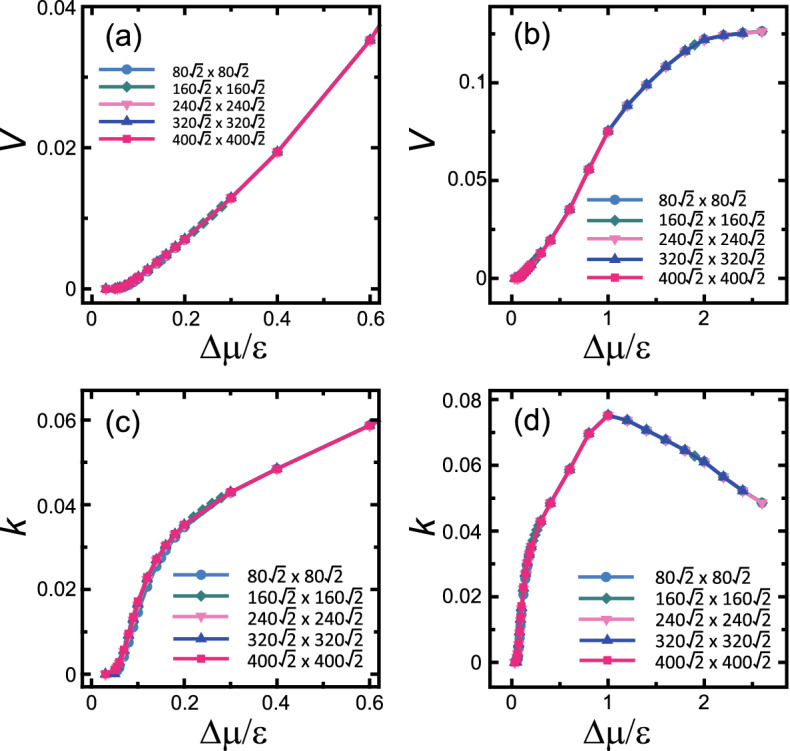
(a,b) Driving force dependence of the surface growth velocity. (c,d) Driving force dependence of the kinetic coefficient. . . . °.
In the region with a faceted-rough surface and for a rough surface with locally faceted macrosteps (), the vicinal surface grows in the 2D nucleation process at the lower edge of a faceted macrostep63,64. The mean height of a faceted macrostep obeys the equation
| 3 |
where is the attachment rate of elementary steps to the faceted macrostep, is the growth velocity of an elementary step, p is the surface slope on a “terrace”, a is the lattice constant, and is the detachment rate of an elementary step from the faceted macrostep. is determined by the 2D poly-nucleation rate at the lower edge of the faceted macrostep63,64. At steady state, , and . The surface slope on a “terrace” is determined by , so that the step-attachment rate balances the step-detachment rate.
To understand the poly nucleation rate near equilibrium, a characteristic length is introduced, representing the mean equal distance at which critical nuclei arise at the edge of a macrostep (inset in Fig. 2). The nuclei grow to merge with neighbouring nuclei after a time , at which point a step detaches from the macrostep. The mean step-detachment time , which is a characteristic time, is then expressed as63,66 where is the step zipping velocity and is the 2D nucleation rate at the step edge. Then, we obtain for 63
| 4 |
where , is the total step free energy of a critical nucleus at the macrostep-edge with critical size , Z is the Zeldovich factor, C is a coefficient, is the kinetic coefficient for an elementary step, V is the surface growth velocity, and a (=1) is the height of an elementary step. Here, is a correction term introduced in our previous work63 to ensure that the surface velocity agrees with that obtained by the classical 2D nucleation theory. The Monte Carlo results are well reproduced by Eq. (4) for 63. When decreases and approaches , the surface growth velocity V decreases, whereas and increase, based on Eq. (4).
For and , the vicinal surface grows continuously. While for , the surface grows intermittently in the manner of a 2D single nucleation process at the macrostep edges due to the finite size effect (Fig. S1a). is approximately estimated by
| 5 |
Roughness exponents
Figure 1b shows the ratio of to . The obtained results do not depend on the initial configuration. This is in contrast to the mean-height of a faceted macrostep , which is known to be sensitive to the history of the surface configuration63,64. As seen from Fig. 1b, the lines for for different system sizes coincide. The power 0.385 is a universal value for the roughness exponent for 2D KPZ-rough surfaces in 3D. Therefore, a vicinal surface for is KPZ-rough.
In our previous work on the original RSOS model65, where , the vicinal surface for is shown to be KPZ-rough. Around , a broad peak is observed corresponding to the kinetic roughening point for the (001) surface. However, such a peak is not observed for p-RSOS. Instead, there is a sharp peak at , which is less than of the RSOS model.
For , shows algebraic growth for lengths less than 200a. A typical case is shown in Fig. 4 for . At a small scale, increases as . The value of the exponent agrees with that for a zigzag structure of a 1D single step on a surface. Since relatively large locally merged steps remain, the value of the exponent indicates that the merged steps shift location in a “wiggly” manner, as if they were single steps.
Figure 4.
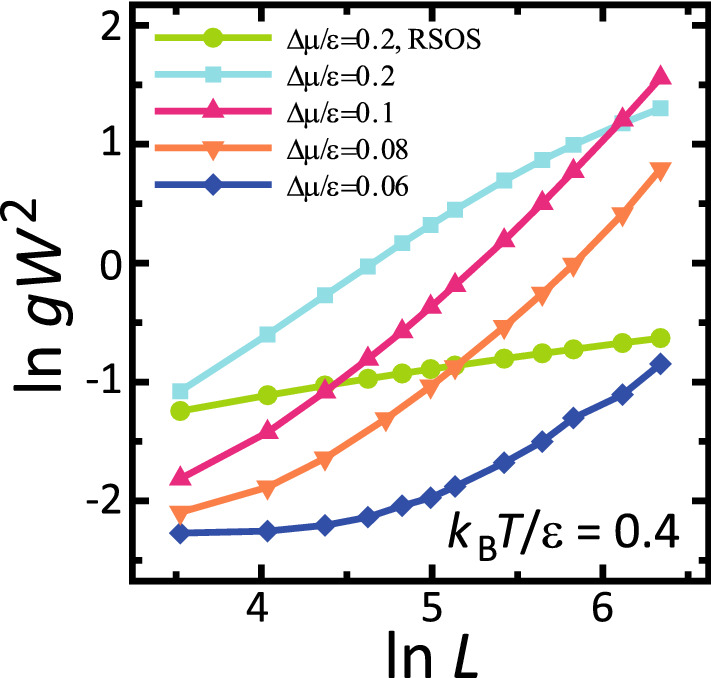
Size dependence of . . . .
At a scale larger than 200a, the slope changes. We will return to this point in the following subsection.
For the faceted-rough region , shows an approximate algebraic increase as the system size L increases for large L (Fig. 4). For large lengths , the Monte Carlo results were fitted to by the least square method. The obtained values are listed in Table 2. Irrespective of temperature, has values between 0.58 and 0.79. These values are about twice the KPZ-universal value of 0.386. Hence, the roughness of a faceted-rough surface is larger than the roughness of the original RSOS model. For large L, the vicinal surface is approximately self-affine. It is interesting that many observed values on the vicinal surface at nanometer scale are similar to those of the roughness exponent36,41. In a real system, a length with corresponds to about 230 nm.
Table 2.
Roughness exponent and provisional roughness exponent .
| 0.06 | 0.58 | 0.016 | 0.2 | 0.71 | 0.022 |
| 0.08 | 0.78 | 0.010 | 0.25 | 0.72 | 0.041 |
| 0.1 | 0.77 | 0.017 | 0.275 | 0.68 | 0.059 |
| 0.12 | 0.67 | 0.036 | 0.3 | 0.59 | 0.11 |
| − | − | ||||
| 0.090 | 0.60 | − | 0.27 | 0.59 | − |
. .
As shown in Fig. 4, the roughness depends on the length scale (refer to the following subsection). For relatively small , this change of roughness can be seen clearly. For , where and [MCS/site], the vicinal surface is smooth for lengths less than (Fig. S1a). While L increases to over , increases algebraically. The slope of the lines becomes slightly steeper as L increases. Therefore, we conclude that faceted-rough surfaces consist of faceted structures at lengths less than , whereas faceted-rough surfaces have approximately self-affine structures larger than .
Scaling function for step-disassembly
To explain why the provisional roughness exponent gradually changes, we further analyse the driving force dependence of the surface width.
We assume that is expressed by the following equation:
| 6 |
where represents the contribution from the “terrace” between the faceted macrosteps with slope , represents the contribution from step-disassembling/assembling of the macrosteps, and x is an inverse-driving-force distance derived from the maximum value of as .
At equilibrium, ; whereas increases as increases when exceeds a characteristic value . This is because an elementary step detaches from the lower edge of a faceted macrostep periodically on average (Eq. (4)). The slope dependence of at is expressed by65:
| 7 |
It should be noted that A and B for , 0.4, and 1.7 at equilibrium are the same within errors, as stated in Ref.65.
The dependence of the surface slope is obtained by the following equation63:
| 8 |
where , , and are fitting parameters. It should be noted that the set of values in Eq. (4) and Table 1 were obtained by fitting Monte Carlo data to Eq. (8) in the fitting region 63. To describe the dependence of in the range , the Monte Carlo data is re-fitted to Eq. (8), giving , , and .
We found that has a maximum at , and Y(x, L) is approximated by a Gaussian function for (Fig. 5), as follows:
| 9 |
Figure 5.
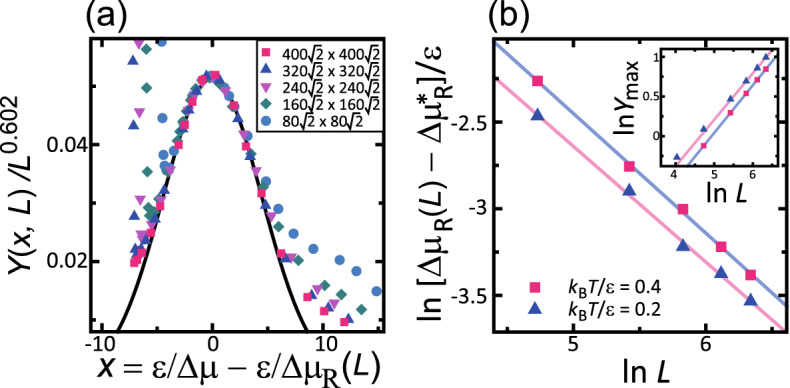
. . . (a) Scaling function for step-disassembly. Y(x, L) follows Eq. (6) with Eqs. (7) and (8). The line follows Eq. (10). (b) Log–log plot of the linear system size L and the difference between and , where is in the limit . Inset: log–log plot of and L, where is the value Y(0, L) (Eqs. (11) and (12)). Blue triangles and pink line: . Red squares and light blue line: .
We introduce a scaling function such that:
| 10 |
| 11 |
| 12 |
The values of , , , , , and are listed in Table 3.
Table 3.
Scaling parameters.
| () | 0.60 | 0.59 |
| 0.69 | 0.67 | |
| 2.7 | 2.0 | |
| 0.051 | 0.065 | |
| 0.025 | 1.26 |
The shape of is shown in Fig. 5a by a black line. The Monte Carlo data and agree well around . For , the surface grows in the single nucleation mode. Hence, the data strays from the line of . Since the change to the single nucleation mode is a finite size effect, the data for the smaller size begins to deviate for smaller x from the scaling function. For , faceted macrosteps disassemble to become locally merged steps.
The power law behaviours of (Eq. (12)) and (Eq. (11)) are shown in Fig. 5b. The data agree well with the lines. From the slope of the lines, we obtained and . The powers and at different temperatures agree well.
The lines calculated using Eq. (6) for and L with Eqs. (9)–(12) are shown in Fig. 1. The lines reproduce the Monte Carlo results well for . For , is similar to the case for . It is interesting that the values of and are similar for the cases of and 0.2. This suggests that the step-disassembling phenomenon around is a universal phenomenon. In addition, the point is a candidate for the non-equilibrium phase transition point.
Unexpectedly, as seen from Fig. 1c, Y(x, L) calculated by Eq. (6) from the Monte Carlo data shows algebraic divergence with respect to L with a roughness exponent . The line for each size agrees well with the others for . If is simply divided by , the – lines do not coincide with each other. The value is the same as that for the tracer diffusion on a 1D lattice67. However, the physical connection between the tracer diffusion and the present case is unclear. This is left as a problem for a future study.
agrees with the roughness exponent in the limit . The maximum of diverges with exponent in the limit (Eq. (11), Table 2). For around , increases asymptotically as . This also means that for . Therefore, is the roughness exponent in the limit .
For the L dependence of around , since from Eqs. (9)–(12), we obtain
| 13 |
The second term in the right-hand side of Eq. (13) indicates the contribution from the shift of . For with , becomes larger than . However, for with , becomes smaller than .
Discussion
The results for faceted-rough surfaces can explain why the giant Naica gypsum (CaSO 2H0)9–11 has a euhedral shape with a large size and high transparency. From laser confocal differential interference contrast microscopy (LCM-DIM) and atomic force microscopy (AFM) observations10, the gypsum surface was found to grow by a 2D nucleation process at the microscopic scale. The giant planar {010} surfaces of the crystal faces were found to consist of a hillock structure at the mesoscopic scale. The side surface of a hillock is a (100) surface, which grows very slowly. Such a slow growth is realised close to equilibrium. The surface is near equilibrium and the size of the critical nucleus is large, and therefore the time between formation of individual nuclei is long. Hence, inhomogeneity of inclusions should occur, which would cloud the crystal.
The continuous growth for the faceted-rough region in this work is possible for , where is given by Eq. (5). Physically, can be interpreted as a smaller limit of the driving force for poly-nucleation at the lower edge of a faceted macrostep. When the size is larger, decreases. As pointed out by Alexander et al.10, 2D nucleation at the “valley” of the hillock, which is a concave line on the surface and corresponds to the lower edge of a faceted macrostep, has a lower activation energy than 2D nucleation on the {010} terrace surface. A similar 2D nucleation from the lower edge of a macrostep is observed experimentally for diamond68. These observed 2D nucleations at the lower edge of a macrostep are consistent with the present Monte Carlo results for a faceted-rough surface. Since the activation energy for 2D nucleation is significantly smaller than that on a terrace, continuous growth is possible. This contributes to keeping the inclusions homogeneous.
In addition, since the roughness exponent is , W/L converges to zero in the limit . This means that the hillocks have an approximate self-affine structure, while the hillocks’ area converges to zero in a large length limit. Therefore, the giant gypsum has a euhedral shape and high transparency.
The faceted-rough surface in the present study may provide a connection between the strong anisotropic parameters in the phase-field modellings and the parameters for the atomic scale. The p-RSOS model has sharp surfaces and the height h(x, y) is well defined. However, when a surface is rough, the location of the surface becomes ambiguous. Hence, we consider the mean height of the surface and the variance of the height of the surface, which is divergent with respect to the system size L.
At equilibrium, asymptotically equals the inverse of the determinant of the surface stiffness tensor25 of the BKT rough-surface in the limit . For a smooth surface, since converges to zero in the large L limit, the determinant of the stiffness tensor is divergent, and the Gaussian curvature on the ECS should be zero.
At non-equilibrium in the faceted-rough region, if we regard the amplitude as a local degree of roughness, we can explain the anisotropy of the local roughness of the faceted-rough surface. In the faceted-rough region, is 0.01–0.03, as seen from Table 2, whereas for a non-faceted vicinal surface is 0.0865,69. This anisotropy in is consistent with the anisotropies which were phenomenologically assumed47–49.
The results in the present study are consistent with the phenomena observed for Si melt–solid interfaces. In the case of Si melt growth, faceted dendrites5 similar to a rough surface or a faceted saw-like shape larger than 10 μm in length are known to appear on a vicinal interface during fast crystal growth, whereas the vicinal interface is planar for slow crystal growth3. Studies on Si melt growth have shown that the faceted plane is close to the (111) surface. Hence, the faceted surface was considered to be smooth and the surface grows in the 2D nucleation process. Nevertheless, the faceted saw-like shape was shown to be formed by MS instability44,45 by the observation of a negative temperature gradient before the solid–liquid interface4. The MS instability should be applicable to a rough surface45. This observed conflict may be solved by the present study. In the present work, we showed that the interface can be rough while maintaining a self-affine faceted macrostep structure near equilibrium with a 2D poly-nucleation process at the macrostep edges. Further experimental studies are expected.
Conclusions
In the faceted-rough region, a surface is smooth and faceted on the small scale, whereas at large scales, surfaces are rough and statistically self-affine with a roughness exponent of .
The surface width W has a maximum at , where is the step disassembling point and L is the linear size of the system. The maximum value of W diverges as with . agrees with in the limit . is much closer to the equilibrium than the kinetic roughening point of the terraces.
converges to in the limit . is a candidate for the non-equilibrium phase transition point.
A faceted-rough vicinal surface is realized for , where is the crossover point between the 2D single nucleation mode and the successive poly-nucleation mode at the lower edge of a faceted macrostep. In this region, the provisional roughness exponent is .
Methods
p-RSOS model
The surface energy of a vicinal surface around the (001) surface is expressed by the following discrete Hamiltonian:
| 14 |
where h(n, m) is the surface height at site (n, m), is the total number of lattice points, is the surface energy per unit cell on the planar (001) surface, and is the microscopic ledge energy. The summation with respect to (n, m) is taken over all sites on the square lattice. The RSOS condition, in which the height difference between the nearest neighbouring sites is restricted to , is required implicitly.
The third and fourth terms in the right-hand side of Eq. (14) represent the point-contact-type step–step attraction. Here, is the Kronecker delta and is the microscopic point-contact-type step–step interaction energy. contributes to the surface energy only at the collision point of neighbouring steps where the height difference can be . When is negative, the step–step interaction becomes attractive (sticky steps). Quantum mechanically, is regarded as the energy gain by forming a bonding state between the dangling bonds at step edges at the collision point of neighbouring steps.
The fifth term in the right-hand side of Eq. (14) represents the driving force for crystal growth. Here, is , where and are the bulk chemical potentials in the ambient phase and the crystal, respectively. At equilibrium, ; for , the crystal grows, while for , the crystal shrinks. Explicitly, is expressed by for an ideal gas and by for an ideal solution, where is the Boltzmann constant, T is temperature, P is vapour pressure, is the vapour pressure at equilibrium, C is the solute-concentration, and is the solute-concentration at equilibrium. If or is expressed by , where is the super saturation, for .
The p-RSOS model is a coarse-grained model relative to the model for first-principle quantum mechanical calculations, but it is a microscopic model relative to the phase-field model. In the p-RSOS model (Eq. (14)), the step–step attraction is the origin of the discontinuous surface tension. The surface energy corresponds to the surface free-energy, which includes entropy originating from lattice vibrations and distortions70. and may soften due to lattice vibrations as the temperature increases. Hence, , , or may slightly decrease as the temperature increases. However, , , and are assumed to be constant throughout the work because we concentrate on studying the size and driving force dependence of the surface roughness.
Mean surface slope and discontinuous surface tension
The mean surface slope tilted towards the direction is determined to be , where is the number of elementary steps and a is the lattice constant. The partition function of the vicinal surface with slope is obtained from with fixed . The surface free energy is obtained from , and the surface tension is obtained from .
Our previous studies at equilibrium showed that the p-RSOS model has a discontinuous surface tension33,56–59,61 at low temperatures with respect to the surface slope. The faceting diagram corresponding to the connectivity of the surface tension is obtained by calculating the partition function using the density-matrix renormalization group (DMRG) method. For , the surface tension near the (111) surface becomes discontinuous. For , which we refer to as the step-faceting zone59, only the surfaces with (001) and (111) are thermodynamically stable at equilibrium57. Hence, the vicinal surface with mean slope becomes covered in hillocks with (001) terrace-surfaces and (111) side surfaces.
Monte Carlo method
The vicinal surface between the (001) surface and the (111) surface is considered using the Monte Carlo method with the Metropolis algorithm. The external parameters are temperature T, , number of steps , and the linear size of the system L. Atoms are captured from the ambient phase to the crystal surface, and escape from the crystal surface to the ambient phase. The number of atoms in a crystal is not conserved. Details of the Monte Carlo calculations are given in Ref.69. Figure 2 shows a snapshot of the vicinal surface.
Mean surface height and surface width
The square of the surface width W for a tilted surface in the non-equilibrium steady state is defined by69
| 15 |
where and represent a site on the surface along the and directions, respectively, is the time average, g is the determinant of the first fundamental quantity of a curved surface25, and is the tilt angle inclined towards the direction from the direction. The time average is taken over Monte Carlo steps per site (MCS/site), discarding the first MCS/site69.
In our previous study on the surface width for the original RSOS model65, we found that the kinetic roughening point of the (001) surface is different from the crossover point between the BKT-rough surface and the KPZ-rough surface (Table 1) with respect to the driving force for crystal growth . For high , the vicinal surface of the RSOS model near the (111) surface is KPZ-rough; whereas the vicinal surface of the RSOS model near the (001) surface is BKT-rough.
Surface velocity and “terrace slope”
Using the Monte Carlo method, the surface velocity is calculated by , where is the mean surface height averaged over the surface area at time t, and and are MCS/site62–64.
At equilibrium, the terrace surface is exactly the (001) surface. However, at non-equilibrium, due to step-detachments the “terrace” surface is slightly tilted. The “terrace slope” is obtained from the mean-macrostep-height , which is calculated by the Monte Carlo method, as follows62–64:
| 16 |
where is , is the number of elementary steps, and is the number of macrosteps in the simulated system.
Supplementary Information
Acknowledgements
The author wishes to acknowledge Prof. T. Ohachi, Prof. G. Sazaki, Prof. Fujiwara, Dr. Maeda, and Prof. Y. Kangawa for their valuable advice. The author also wishes to acknowledge Prof. K. Tsukamoto, Prof. T. Koshikawa, Dr. A. Pavlovska, and Prof. E. Bauer for their continual encouragement. This work was supported by KAKENHI Grants-in-Aid (nos. JP25400413 and JP17K05503) from the Japan Society for the Promotion of Science (JSPS). This work was supported in part by the Collaborative Research Program of Research Institute for Applied Mechanics, Kyushu University.
Author contributions
N.A. conceived and conducted the calculations, and analyzed the results.
Competing interests
The author declares no competing interests.
Footnotes
Publisher's note
Springer Nature remains neutral with regard to jurisdictional claims in published maps and institutional affiliations.
Supplementary Information
The online version contains supplementary material available at 10.1038/s41598-021-83227-8.
References
- 1.Furukawa Y, Shimada W. Three-dimensional pattern formation during growth of ice dendrites—Its relation to universal law of dendritic growth. J. Cryst. Growth. 1993;128:234–239. doi: 10.1016/0022-0248(93)90325-Q. [DOI] [Google Scholar]
- 2.Libbrecht KG. The physics of snow crystals. Rep. Prog. Phys. 2005;68:855–895. doi: 10.1088/0034-4885/68/4/R03. [DOI] [Google Scholar]
- 3.Fujiwara K, Nakajima K, Ujihara T, Usami N, Sazaki G, Hasegawa H, Mizoguchi S, Nakajima K. In situ observations of crystal growth behavior of silicon melt. J. Cryst. Growth. 2002;243:275–282. doi: 10.1016/S0022-0248(02)01521-X. [DOI] [Google Scholar]
- 4.Tokairin M, Fujiwara K, Kutsukake K, Usami N, Nakajima K. Formation mechanism of a faceted interface: In situ observation of the Si(100) crystal-melt interface during crystal growth. Phys. Rev. B. 2009;80(174108):1–4. [Google Scholar]
- 5.Nagashio K, Kuribayashi K. Growth mechanism of twin-related and twin-free facet Si dendrites. Acta Materialia. 2005;53:3021–3029. doi: 10.1016/j.actamat.2005.03.022. [DOI] [Google Scholar]
- 6.Krzyzewski F, Zaluska-Kotur MA. Coexistence of bunching and meandering instability in simulated growth of 4H-SiC(0001) surface. J. Appl. Phys. 2014;115:213517. doi: 10.1063/1.4881816. [DOI] [Google Scholar]
- 7.Mitani T, Komatsu N, Takahashi T, Kato T, Harada S, Ujihara T, Matsumoto Y, Kurashige K, Okumura H. Effect of aluminum addition on the surface step morphology of 4H-SiC grown from Si-Cr-C solution. J. Cryst. Growth. 2015;423:45–49. doi: 10.1016/j.jcrysgro.2015.04.032. [DOI] [Google Scholar]
- 8.Paxon AT, Varanasi KK. Self-similarity of contact line depinning from textured surfaces. Nat. Commun. 2013;4(1492):1–8. doi: 10.1038/ncomms2482. [DOI] [PMC free article] [PubMed] [Google Scholar]
- 9.Van Driessche AES, Garcia-Ruiz JM, Tsukamoto K, Patrino-Lopez LD, Satoh H. Ultraslow growth rates of giant gypsum crystals. PNAS. 2011;108:15721–15726. doi: 10.1073/pnas.1105233108. [DOI] [PMC free article] [PubMed] [Google Scholar]
- 10.Van Driessche AES, Garcia-Ruiz JM, Delgado-Lopez JM, Sazaki G. In situ observation of step dynamics on gypsum crystals. Crystal Growth Des. 2010;10:3909–3916. doi: 10.1021/cg100323e. [DOI] [Google Scholar]
- 11.García-Ruiz JM, Villasuso R, Ayora C, Canals A, Otálora F. Formation of natural gypsum megacrystals in Naica. Mexico. Geol. 2007;35:327–330. doi: 10.1130/G23393A.1. [DOI] [Google Scholar]
- 12.Schneider NM, Park JH, Grogan JM, Steingart DA, Bau HH, Ross FM. Nanoscale evolution of interface morphology during electrodeposition. Nat. Commun. 2017;8(2174):1–10. doi: 10.1038/s41467-017-02364-9. [DOI] [PMC free article] [PubMed] [Google Scholar]
- 13.Lin K, Huang X, Zhao Y. Combining image recognition and simulation to reproduce the adsorption/desorption behaviors of shale gas. Energy Fuels. 2020;34:258–269. doi: 10.1021/acs.energyfuels.9b03669. [DOI] [Google Scholar]
- 14.Burton WK, Cabrera N, Frank FC. The growth of crystals and the equilibrium structure of their surfaces. Philos. Trans. R. Soc. Lond. A. 1951;243:299–358. doi: 10.1098/rsta.1951.0006. [DOI] [Google Scholar]
- 15.Weeks JD, Gilmer GH, Leamy HJ. Structural transition in the Ising-model interface. Phys. Rev. Lett. 1973;20:549–551. doi: 10.1103/PhysRevLett.31.549. [DOI] [Google Scholar]
- 16.Berezinskii VL. Destruction of long-range order in one-dimensional and two-dimensional systems having a continuous symmetry group I. Classical Syst. Sov. Phys. JETP. 1971;32:493–500. [Google Scholar]
- 17.Kosterlitz JM, Thouless DJ. Ordering, metastability and phase transitions in two-dimensional systems. J. Phys. C. 1973;6:1181–1203. doi: 10.1088/0022-3719/6/7/010. [DOI] [PubMed] [Google Scholar]
- 18.Knops HJF. Exact relation between the solid-on-solid model and the XY model. Phys. Rev. Lett. 1977;39:766–769. doi: 10.1103/PhysRevLett.39.766. [DOI] [Google Scholar]
- 19.Chui ST, Weeks JD. Phase transition in the two-dimensional Coulomb gas, and the interfacial roughening transition. Phys. Rev. B. 1976;14:4978–4982. doi: 10.1103/PhysRevB.14.4978. [DOI] [Google Scholar]
- 20.van Beijeren H. Exactly solvable model for the roughening transition of a crystal surface. Phys. Rev. Lett. 1977;38:993–996. doi: 10.1103/PhysRevLett.38.993. [DOI] [Google Scholar]
- 21.Weeks, J.D. The roughening transition. In Ordering in Strongly Fluctuation Condensed Matter Systems (ed. Riste, T.) 293 (Plenum, New York, 1980).
- 22.Pimpinelli A, Villain J. Physics of Crystal Growth. Cambridge: Cambridge University Press; 1998. [Google Scholar]
- 23.Jayaprakash C, Saam WF, Teitel S. Roughening and facet formation in crystals. Phys. Rev. Lett. 1983;50:2017–2020. doi: 10.1103/PhysRevLett.50.2017. [DOI] [Google Scholar]
- 24.Beijeren, V.H. & Nolden, I. In Structure and Dynamics of Surfaces, Vol. 2 (eds Schommers, W. & Blancken-Hagen, V.) 259 (Springer, Berlin, 1987).
- 25.Akutsu N, Akutsu Y. Roughening, faceting and equilibrium shape of two-dimensional anisotropic interface. I. Thermodynamics of interface fluctuations and geometry of equilibrium crystal shape. J. Phys. Soc. Jpn. 1987;56:1443–1453. doi: 10.1143/JPSJ.56.1443. [DOI] [Google Scholar]
- 26.Akutsu N, Akutsu Y. Equilibrium crystal shape: Two dimensions and three dimensions. J. Phys. Soc. Jpn. 1987;56:2248–2251. doi: 10.1143/JPSJ.56.2248. [DOI] [Google Scholar]
- 27.Akutsu Y, Akutsu N, Yamamoto T. Universal jump of Gaussian curvature at the facet edge of a crystal. Phys. Rev. Lett. 1988;61:424–427. doi: 10.1103/PhysRevLett.61.424. [DOI] [PubMed] [Google Scholar]
- 28.Akutsu Y. Exact Landau free-energy of solvable N-state vertex model. J. Phys. Soc. Jpn. 1989;58:2219–2222. doi: 10.1143/JPSJ.58.2219. [DOI] [Google Scholar]
- 29.Cabrera N. The equilibrium of crystal surfaces. Surf. Sci. 1964;2:320–345. doi: 10.1016/0039-6028(64)90073-1. [DOI] [Google Scholar]
- 30.Einstein, T.L. Equilibrium shape of crystals. In Handbook of Crystal Growth, Vol. I, (ed Nishinaga, T.) 216 (Elsevier, London, 2015).
- 31.Landau LD, Lifshitz EM. Statistical Physics. 2. New York: Pergamon; 1968. [Google Scholar]
- 32.Andreev AF. Faceting phase transitions of crystals. Sov. Phys. JETP. 1981;53:1063–1069. [Google Scholar]
- 33.Akutsu, N. & Yamamoto, T. Rough-smooth transition of step and surface. In Handbook of Crystal Growth, Vol. I (ed. Nishinaga, T.) 265 (Elsevier, London, 2015).
- 34.Kardar M, Parisi G, Zhang Y-C. Dynamic scaling of growing interfaces. Phys. Rev. Lett. 1986;56:889–892. doi: 10.1103/PhysRevLett.56.889. [DOI] [PubMed] [Google Scholar]
- 35.Vicsek T. Fractal Growth Phenomena. Singapore: World Scientific; 1989. [Google Scholar]
- 36.Barabasi AL, Stanley HE. Fractal Concepts in Surface Growth. Cambridge: Cambridge University Press; 1995. [Google Scholar]
- 37.Wolf DE, Villain J. Growth with surface diffusion. Europhys. Lett. 1990;13:389–394. doi: 10.1209/0295-5075/13/5/002. [DOI] [Google Scholar]
- 38.Wolf DE. Kinetic roughening of vicinal surface. Phys. Rev. Lett. 1991;67:1783–1786. doi: 10.1103/PhysRevLett.67.1783. [DOI] [PubMed] [Google Scholar]
- 39.Pimpinelli A, Tonchev V, Videcoq A, Vladimirova M. Scaling and universality of self-organized patterns on unstable vicinal surfaces. Phys. Rev. Lett. 2002;88:206103. doi: 10.1103/PhysRevLett.88.206103. [DOI] [PubMed] [Google Scholar]
- 40.Pagnani A, Parisi G. Numerical estimate of the Karder-Parisi-Zhang universality class in (2+1) dimensions. Phys. Rev. Lett. 2015;92:010101. doi: 10.1103/PhysRevE.92.010101. [DOI] [PubMed] [Google Scholar]
- 41.Takeuchi KA. An appetizer to modern developments on the Kardar-Parisi-Zhang universality class. Phys. A. 2018;504:77–105. doi: 10.1016/j.physa.2018.03.009. [DOI] [Google Scholar]
- 42.Krim J, Palasantzas G. Experimental observations of self-affine scaling and kinetic roughening at sub-micron length scales. Int. J. Mod. Phys. B. 1995;9:599–632. doi: 10.1142/S0217979295000239. [DOI] [Google Scholar]
- 43.Gupta I, Mohanty BC. Dynamics of surface evolusion in semiconductor thin films grown from a chemical bath. Sci. Rep. 2016;6:33136. doi: 10.1038/srep33136. [DOI] [PMC free article] [PubMed] [Google Scholar]
- 44.Mullins WW, Sekerka RF. Stability of a planar interface during solidification of a dilute binary alloy. J. Appl. Phys. 1964;35:444–451. doi: 10.1063/1.1713333. [DOI] [Google Scholar]
- 45.Langer JS. Instabilities and pattern formation in crystal growth. Rev. Mod. Phys. 1980;52:1–30. doi: 10.1103/RevModPhys.52.1. [DOI] [Google Scholar]
- 46.Kobayashi R. Modeling and numerical simulations of dendritic crystal growth. Phys. D. 1993;63:410–423. doi: 10.1016/0167-2789(93)90120-P. [DOI] [Google Scholar]
- 47.Karma A, Rappel W-J. Phase-field method for computationally efficient modelling of solidification with arbitrary interface kinetics. Phys. Rev. E. 1995;53:R3107. doi: 10.1103/physreve.53.r3017. [DOI] [PubMed] [Google Scholar]
- 48.Debierre J-M, Karma A, Celestini F, Guerin R. Phase-field approach for faceted solidification. Phys. Rev. E. 2003;68(041604):1–13. doi: 10.1103/PhysRevE.68.041604. [DOI] [PubMed] [Google Scholar]
- 49.Demange G, Zapolsky H, Patte R, Brunel M. A phase field model for snow crystal growth in three dimensions. npj Comput. Mater. 2017;3(1):1–7. doi: 10.1038/s41524-017-0015-1. [DOI] [Google Scholar]
- 50.Buff FP, Lovett RA, Stillinger FH. Interfacial density profile for fluids in the critical region. Phys. Rev. Lett. 1965;15:621–623. doi: 10.1103/PhysRevLett.15.621. [DOI] [Google Scholar]
- 51.Jasnow D. Critical phenomena at interfaces. Rep. Prog. Phys. 1984;47:1059–1132. doi: 10.1088/0034-4885/47/9/001. [DOI] [Google Scholar]
- 52.Abe H, Saitoh Y, Ueda T, Ogasavara F, Nomura R, Okuda Y, Parshin AY. Facet growth of He crystal induced by acoustic wave. J. Phys. Soc. Jpn. 2006;75:023601. doi: 10.1143/JPSJ.75.023601. [DOI] [Google Scholar]
- 53.Ohachi T, Taniguchi I. Growth of -AgS and -AgSe single crystals in a solid/vapour system. J. Cryst. Growth. 1977;40:109–117. doi: 10.1016/0022-0248(77)90035-5. [DOI] [Google Scholar]
- 54.Ohachi T, Taniguchi I. Roughening transition for the ionic-electronic mixed superioninc conductor -AgS. J. Cryst. Growth. 1983;65:84–88. doi: 10.1016/0022-0248(83)90042-8. [DOI] [Google Scholar]
- 55.Pavlovska A, Nenaw D. Experimental study of the surface melting of tetrabrommethane. J. Cryst. Growth. 1977;39:346–352. doi: 10.1016/0022-0248(77)90284-6. [DOI] [Google Scholar]
- 56.Akutsu N. Thermal step bunching on the restricted solid-on-solid model with point contact inter-step attractions. Appl. Surf. Sci. 2009;256:1205–1209. doi: 10.1016/j.apsusc.2009.05.080. [DOI] [Google Scholar]
- 57.Akutsu N. Non-universal equilibrium crystal shape results from sticky steps. J. Phys. Condens. Matter. 2011;23:485004. doi: 10.1088/0953-8984/23/48/485004. [DOI] [PubMed] [Google Scholar]
- 58.Akutsu N. Sticky steps inhibit step motions near equilibrium. Phys. Rev. E. 2012;86(061604):1–14. doi: 10.1103/PhysRevE.86.061604. [DOI] [PubMed] [Google Scholar]
- 59.Akutsu N. Faceting diagram for sticky steps. AIP Adv. 2016;6:035301. doi: 10.1063/1.4943400. [DOI] [Google Scholar]
- 60.Akutsu N. Effect of the roughening transition on the vicinal surface in the step droplet zone. J. Cryst. Growth. 2017;468:57–62. doi: 10.1016/j.jcrysgro.2016.10.014. [DOI] [Google Scholar]
- 61.Akutsu, N. Profile of a faceted macrostep caused by anomalous surface tension. Adv. Condens. Matter Phys.2017, 2021510.
- 62.Akutsu N. Disassembly of faceted macrosteps in the step droplet zone in non-equilibrium steady state. Crystals. 2017;7:7020042. doi: 10.3390/cryst7020042. [DOI] [Google Scholar]
- 63.Akutsu N. Height of a faceted macrostep for sticky steps in a step-faceting zone. Phys. Rev. Mater. 2018;2:023603. doi: 10.1103/PhysRevMaterials.2.023603. [DOI] [Google Scholar]
- 64.Akutsu N. Relationship between macrostep height and surface velocity for a reaction-limited crystal growth process. Cryst. Growth Des. 2019;19:2970–2978. doi: 10.1021/acs.cgd.9b00168. [DOI] [Google Scholar]
- 65.Akutsu N. Crossover from BKT-rough to KPZ-rough surfaces for interface-limited crystal growth/recession. Sci. Rep. 2020;10(13057):1–11. doi: 10.1038/s41598-020-70008-y. [DOI] [PMC free article] [PubMed] [Google Scholar]
- 66.Ookawa A. Crystal Growth. Tokyo: Syōkabō; 1977. [Google Scholar]
- 67.van Beijeren H, Kehr KW. Kutner, Rduffysuib ub cibcebtrated kattuce gases, III. Tracer diffusion on a one-dimensional lattice. Phys. Rev. B. 1983;28:5711–5723. doi: 10.1103/PhysRevB.28.5711. [DOI] [Google Scholar]
- 68.Khokhryakov AF, Palyanov YN, Borzdov YM, Kozhukhov AS, Shcheglov DV. Step patterns on 100 faces of diamond crystals as-grown in Mg-based systems. Cryst. Growth Des. 2018;18:152–158. doi: 10.1021/acs.cgd.7b01025. [DOI] [Google Scholar]
- 69.Akutsu N, Sugioka Y, Murata N. Surface roughness changes induced by stoichiometric deviation in ambient phase for two-component semiconductor crystals. Crystals. 2020;10(151):1–25. [Google Scholar]
- 70.Kempisty P, Kangawa Y. Evolution of the free energy of the GaN(0001) surface based on first-principles phonon calculations. Phys. Rev. B. 2019;100(085304):1–12. [Google Scholar]
Associated Data
This section collects any data citations, data availability statements, or supplementary materials included in this article.