

Abstract
Renin cells are crucial for the regulation of blood pressure and fluid electrolyte homeostasis. We have recently shown that renin cells possess unique chromatin features at regulatory regions throughout the genome that may determine the identity and memory of the renin phenotype. The 3-D structure of chromatin may be equally important in the determination of cell identity and fate. CCCTC-binding factor (Ctcf) is a highly conserved chromatin organizer that may regulate the renin phenotype by controlling chromatin structure. We found that Ctcf binds at several conserved DNA sites surrounding and within the renin locus, suggesting that Ctcf may regulate the transcriptional activity of renin cells. In fact, deletion of Ctcf in cells of the renin lineage led to decreased endowment of renin-expressing cells accompanied by decreased circulating renin, hypotension, and severe morphological abnormalities of the kidney, including defects in arteriolar branching, and ultimately renal failure. We conclude that control of chromatin architecture by Ctcf is necessary for the appropriate expression of renin, control of renin cell number and structural integrity of the kidney.
Keywords: renin, hypertension, renin-angiotensin system
Subjects: Cardiovascular System & Vascular Biology, Molecular Bases of Health & Disease
INTRODUCTION
Renin-expressing cells are fundamental for the maintenance of extracellular fluid volume, blood pressure homeostasis. Through evolution, these cells have acquired additional roles in kidney vascular development, regeneration and innate immune defense1,2. In adult mammals, renin-expressing cells are localized to the walls of the afferent arterioles at the entrance to the glomeruli3. These juxtaglomerular (JG) cells synthesize and release the enzyme/hormone renin in response to changes in blood pressure and extracellular fluid volume. We have recently shown that renin cells possess unique chromatin features at regulatory regions throughout the genome that determine the identity and memory of the renin phenotype4. A group of these regulatory regions denominated as super-enhancers are characterized by high levels of histone 3 lysine 27 acetylation (H3K27ac), a histone mark associated with active enhancers, open chromatin as determined by ATAC-seq, and high levels of transcription factor binding such as deposition of the Mediator subunit 1 (Med1)4 as determined by Chip-Seq, and high transcriptional activity of the genes they regulate as it is the case with the renin gene in native and tumoral renin-expressing cells4. In addition to the aforementioned layer of regulation, the 3D organization of chromatin may be crucial in determining the fate of renin cells during development and disease. Within the cell nucleus, the chromatin is packed in chromosomal territories which are compartmentalized by the formation of topological associated domains (TADS) that are delimitated by the CCCTC-binding factor (Ctcf), the best-characterized chromatin architectural protein5. Ctcf is a DNA binding factor localized at chromosome 8 on the mouse genome that plays an essential role in the regulation of gene expression. Ctcf is an 11-zinc finger protein, highly conserved among vertebrates, that binds numerous intergenic sites genome-wide regulating transcriptional activity through the different combinations of its zinc fingers6,7. Initially, Ctcf was discovered as a transcriptional repressor of the Myc gen8, but it has other significant regulatory functions, for example as a transcriptional activator or repressor, as an insulator acting as a barrier preventing undesired gene activation9 and mediating long-range chromatin interactions bringing into proximity enhancers to the promoter of target genes10.
Because our general interest is to understand how the chromatin is organized to regulate the renin phenotype, we sought to determine whether Ctcf is involved in the regulation of renin and the maintenance of the renin phenotype in vivo. Conditional loss of Ctcf in cells from the renin lineage resulted in a decrease endowment of renin-expressing cells accompanied by decreased circulating renin, hypotension, severe renal abnormalities and ultimately renal failure. Results indicate that Ctcf is necessary for the control of renin cell number, renin expression and the structural integrity of the kidney.
Experimental Methods
Animals.
Ctcf floxed mice were obtained from Niels Galjart from the Erasmus Medical Center in the Netherlands11. To investigate the function of Ctcf in renin-expressing cells we bred Ctcffl/fl with Ren1dCre/+ expressing Cre recombinase in renin cells12. After a few generations, we generated Ctcffl/fl; Ren1dCre/+ conditional knock-out mice and Ctcffl/fl; Ren1d+/+ as control mice. Mice were studied at 1, 2 and 4 months of age. Males and females were used for this study. Although the dispersion of the data seemed to indicate that there was not statistical difference between males and females, we did not have sufficient numbers of animals in either sex limiting our statistical power to detect differences between the sexes. Therefore, animals from both sexes were grouped to perform statistics and to display the data. All the animal experiments were performed in the Pediatric Center of Excellence in Nephrology at the University of Virginia.
All animals were handled following the National Institutes of Health guidelines for the care and use of experimental animals, and the study was approved by the Institutional Animal Care and Use Committee of the University of Virginia.
Genotyping.
Mouse genotypes from tail biopsies were determined using real-time PCR with specific probes designed by Transnetyx, Cordova, TN.
Cell Culture.
As4.1 renin expressing cell line (ATCC® CRL-2193TM)13, was cultured in high glucose DMEM (Gibco #11965–092) + 10% FBS at 37°C in a humidified incubator containing 5% of CO2.
Chromatin Immunoprecipitation Assay.
ChIP was performed in As4.1 cells using the ChIP-IT High Sensitivity® (HS) Kit (Cat. No. 53040; Active Motif, Carlsbad, CA, USA) and ChIP-IT® qPCR Analysis Kit (Cat. No. 53029; Active Motif, Carlsbad, CA, USA) following the manufacturer’s protocol and using a polyclonal antibody against CTCF (Cat. No. 07–729, Millipore). Quantitative real-time PCR amplification was performed using SsoAdvanced SYBR® Green Supermix (Cat. No. 172–5260, Bio-Rad Laboratories, Inc, CA, USA) and 5 μL of DNA sample. Specific primers were designed to detect Ctcf binding sites at the neighborhood of the mouse Ren1 gene. The program we used to quantify the amplification was 2 min at 98 °C, 5 s at 98 °C, 15 s at 58 °C for 40 cycles in 20 μL reaction volume. Data were plotted and presented in the form of a histogram.
RNA extraction and Quantitative Real-Time PCR.
Whole kidneys from control and mutant mice were removed and placed in RNAlater (Ambion, Austin, TX) overnight at 4°C and then stored at −20°C. Total RNA was isolated using TRIzol extraction (Life Technologies, Grand Island, NY) according to the manufacturer’s instructions. cDNA was prepared from 3μg of RNA using Maloney murine leukemia virus reverse transcriptase (Promega) and an oligo(dT) primer according to the manufacturer’s instructions. Quantitative reverse transcription polymerase chain reaction (RT-PCR) was performed using SYBR Green I (Invitrogen Molecular Probes, Eugene, OR) in a CFX Connect system (BioRad, Hercules, CA). Ren1 mRNA expression was normalized to S14 expression, and the changes in expression were determined by the ΔΔCt method and the reported as relative expression compared to control mice. The following gene-specific primers were used: Ren1, forward, 5’- ACAGTATCCCAACAGGAGAGACAAG-3’, reverse, 5’-GCACCCAGGACCCAGACA −3’; S14, forward, 5’-CAGGACCAAGACCCCTGGA-3’, reverse 5’-ATCTTCATCCCAGAGCGAGC-3’.
Histological and immunohistochemical analysis.
Mice were anesthetized with tribromoethanol (300 mg/kg). Kidneys were harvested at indicated time points, weighed, and either fixed in 2% paraformaldehyde (PFA) for 1 hour at 4°C for frozen sections or fixed overnight in Bouin’s or formalin fixative, and embedded in paraffin. Sections (5–10 μm) from paraffin-embedded or cryo-fixed tissues were used for histological analysis. Bouin’s fixed paraffin kidney sections were deparaffinized in xylenes and graded alcohols and stained with Hematoxylin and Eosin to examine overall kidney morphology. Masson’s Trichrome was performed to identify areas of fibrosis as described previously14,15. We performed immunohistochemistry for renin (1:500 dilution of rabbit polyclonal anti-mouse antibody)14 to determine the distribution of renin-expressing cells and α-smooth muscle actin (SMA, 1: 10,000 dilution of mouse monoclonal antibody; Sigma, St.Louis, MO) to evaluate vascular architecture, as described previously16,17. The juxtaglomerular apparatus (JGA) index was calculated as the number of renin-positive JGA per total number of glomeruli and expressed as a percentage4,18. Immunostaining using DAB was performed with the appropriate Vectastain ABC kits (Vector Laboratories, Burlingame, CA).
Blood Pressure Measurement.
Mice at 4 months of age were anesthetized with 1.5% isoflurane and placed on a thermostatically controlled heating table at 37.5°C. A polyethylene catheter (Becton Dickinson) pre-filled with heparinized saline was inserted into the right carotid so that the catheter tip lied at the aortic root. Mean arterial pressure was continuously recorded from this catheter by means of an RX104A transducer coupled to a data acquisition system and AcqKnowledge software (Biopac Systems, Inc.). Measurements of mean arterial pressure, systolic and diastolic blood pressure were taken over a 10-min period19,20. Animals were euthanized after the procedure.
Blood Chemistry.
Blood was collected by cardiac puncture or through the carotid catheter when mice were subjected to blood pressure measurement. After blood was collected for renin measurements, blood samples were collected into heparinized and EDTA plasma separator tubes (Microtainer). Complete blood count and the basic metabolic panel were performed by the University of Virginia Hospital clinical laboratory.
Plasma renin.
Plasma renin concentration was determined using ELISA following the manufacturer’s instructions (RayBiotech, Norcross, GA).
Renal arterial tree micro-dissection.
Kidneys attached to the aorta were harvested from 4 months old mice and incubated in 6 M hydrochloric acid for one hour followed by several washes with acidified water (pH 2.5), as we previously described21,22. The arterial trees were carefully dissected and imaged under a stereomicroscope for counting the arteriolar branches.
Statistics.
Number of animals studied and statistical parameters are reported in each of the figures and figure legends. Results statistically significant were obtained when p <0.05 by two-tailed Student’s t-test or ANOVA. Statistical analysis was performed in GraphPad Prism 8.
RESULTS
Ctcf binds to the renin locus and surrounding domains in renin cells
To investigate whether Ctcf binds at the Ren1 locus, we first inquired into published data generated by the ENCODE project23. Figure 1A shows the binding of Ctcf within the neighborhood of the Ren1 gene in different mouse tissues and cell types. The pervasiveness of these binding sites in intergenic and intronic regions at this locus, suggest that Ctcf may play a role as a general chromatin organizer of this genomic region (Figure 1A). These binding sites were also identified in other species (data not shown)23, indicating that these sites are highly conserved throughout evolution. To define the distribution of Ctcf binding in renin-expressing cells, we performed chromatin immunoprecipitation followed by qPCR (ChIP-qPCR) to identify either new sites, or to verify the Ctcf binding sites mentioned above at the Ren1 locus in As4.1 cells in culture13. As mentioned above, As4.1 cells are constantly producing and secreting renin from the Ren1c gene, and as we have recently published they shared with the native renin cells isolated from mice, the same chromatin pattern and a set of unique super-enhancers that control renin cell identity4. ChIP-qPCR results in As4.1 cells showed that the binding enrichment of Ctcf (at Ctcf binding sites) exceeds 5-fold with respect to the negative region tested which also has a low background, evidenced by the binding events detected per 1,000 cells below a value of 2 (Figure 1B). We detected Ctcf signal enrichment in regions that coincide with the areas mentioned above and found in ENCODE: upstream the coding region of the renin gene, within intron one and between Etnk2 and Sox13 (Figure1B, green dashed lines). Only one binding area for Ctcf in kidney tissue sample did not show an enrichment in As4.1 cells (Figure 1B, pink dashed line) which could be tissue specific, although its function remains to be determined. Overall, these results indicate that Ctcf binds within and around the renin locus and might be involved in renin regulation by controlling chromatin architecture.
Figure 1. Ctcf binding at the Ren1 locus.

A. Genome browser image shows that Ctcf binds in the neighborhood and within intron 1 of the Ren1 gene in different mouse tissues and cell types. B. ChIP-qPCR for Ctcf binding sites in As4.1 cells. The histogram presents the immunoprecipitated DNA fragments amplified by quantitative real-time PCR. Bars represent the mean ± SD (n=3). Green dashed lines: areas of Ctcf binding coinciding in both panels; pink dashed line: indicates the Ctcf binding region in the kidney sample that is not enriched in the ChIP-seq samples or in the ChIP-qPCR from As4.1 cells.
Deletion of Ctcf in renin cells results in decrease renin mRNA levels, circulating renin, and arterial blood pressure.
Because homozygous deletion of Ctcf results in embryonic lethality24, we generated mice with conditional deletion of Ctcf in cells of the renin lineage by crossing floxed Ctcf mice11 with mice expressing Cre recombinase under the control of the Ren1d promoter (Ctcf-cKO)15 (Supplementary Figure 1). Throughout fetal and early postnatal life during vascular development, renin precursor cells differentiate into smooth muscle cells, mesangial cells, and interstitial pericytes12. Thus, Ctcf in our mouse model is deleted throughout the renal arterial tree, in all cells that had ever expressed renin. We studied Ctcf-cKO mice at 4 months of age. Deletion of Ctcf in renin cells in vivo caused an 80% reduction of relative renin mRNA levels in comparison with control mice (0.231 ± 0.046 vs. 1.04 ± 0.103; p<0.0001, Figure 2A). In addition, circulating plasma renin was significantly decreased in Ctcf-cKO versus control mice (15,277 ± 2,562 vs. 62,322 ± 8,933 pg/mL; p<0.001, Figure 2B). Consistent with these results, Ctcf-cKO mice exhibited a significantly lower mean arterial blood pressure than control mice (60.09 ± 1.10 vs. 75.07 ± 1.25 mmHg, p<0.0001), Figure 2C.
Figure 2. Deletion of Ctcf in renin cells causes a decrease in renin mRNA levels, circulating renin, and arterial blood pressure.
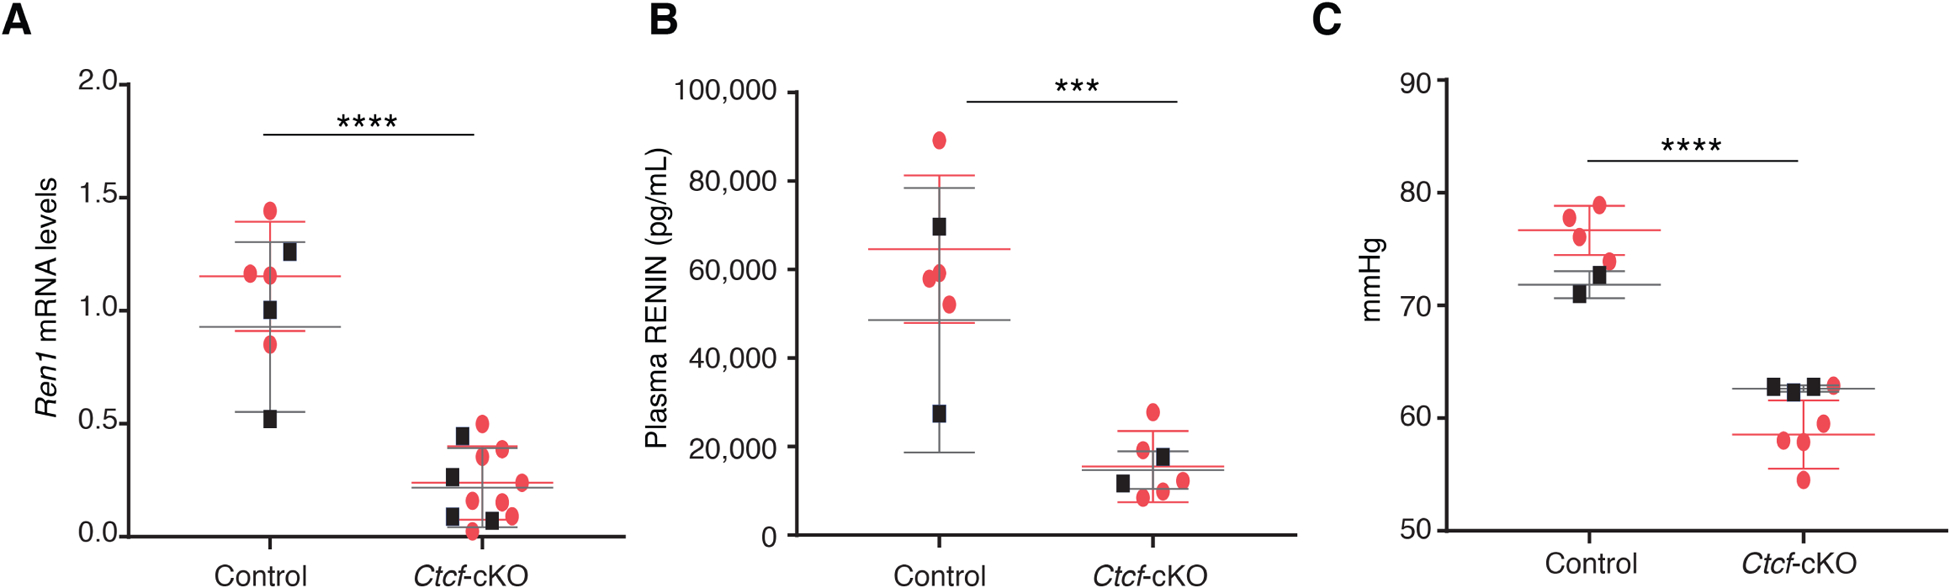
A. Renin mRNA levels were markedly reduced in Ctcf-cKO mice (n=12) in comparison to control mice (n=7). B. Ctcf-cKO mice (n=7) showed a significant decreased in plasma renin levels compared to control mice (n=6). C. Ctcf-cKO mice (n=8) were hypotensive when compared to control mice (n=6). Data are presented as Mean ± SD. ***p<0. 001, ****p<0.0001, by unpaired, 2-sided Student’s t-test. Black squares, males; red dots, females.
Deletion of Ctcf causes severe depletion of renin cells.
Figure 3A shows renin immunostaining revealing fewer renin positive juxtaglomerular areas in Ctcf-cKO mice when compared to control mice. A way to quantitate the decreased in renin staining is calculating the juxtaglomerular index (JGI), which is the number of renin positive JG areas ÷ total number of glomeruli × 1004,18. Ctcf-cKO kidneys have a severely decreased JG index in comparison with control mice (9.69 ± 1.65 vs. 49.62 ± 2.91%; p<0.0001, Figure 3B).
Figure 3. Deletion of Ctcf causes severe depletion of renin cells.

A. Immunohistochemistry for renin shows the normal renin distribution (brown, red arrows) at the entrance of the glomeruli in control kidneys (Left) whereas a marked decrease in renin distribution and storage is seen in kidneys of Ctcf-cKO mice (Right). Circles indicate glomeruli. B. JG index is markedly reduced in Ctcf-cKO mice (n=4) when compared to control mice (n=4). Data are presented as mean ± SD. ****p<0. 0001, by unpaired, 2-sided Student’s t-test. Black squares, males; red dots, females.
Loss of Ctcf affects the branching pattern of the renal arterial tree.
Since renin cells are associated with the maturation of the renal vasculature, participating in the branching and elongation of the renal arterial tree, we wanted to investigate whether deletion of Ctcf in our mouse model also affects the kidney vasculature. We performed kidney arterial tree microdissections in both control and mutant mice21. As shown in Figure 4A, the arterial tree in Ctcf-cKO mice shows fewer branches than in control mice. Further, counting of arteriolar branching order revealed that mutant mice possess a reduced number of smaller arteries when compared with control mice which show a more extensive branching in the outer cortical region of the kidney (Figure 4B). Immunostaining for renin after vascular tree microdissection also showed fewer renin positive spots at the tip of afferent arterioles in Ctcf-cKO kidneys (Figure 4C).
Figure 4. Deletion of Ctcf affects the branching pattern of the renal arterial tree.

A. Renal arterial tree of control mice (left) and Ctcf-cKO mice (right) at 4 months of age. B. Left. The histogram shows that mutant mice (n=4) show fewer smaller branches of the 5th order than control mice (n=4). Data are presented as mean ± SD. ****p<0.0001, by 2-way ANOVA, using Sidak’s multiple comparisons test. Right. Scheme showing the branching order (from 1st to 5th). Black squares, males; red dots, females; C, Control group; M, Mutant group C. Renin immunolocalization (brown) in microdissected arterial trees show fewer and also lighter renin positive spots at the tip of afferent arterioles in Ctcf-cKO mice than in control mice.
Deletion of Ctcf in renin cells affects somatic and kidney growth and leads to kidney abnormalities.
The kidneys from 4-month-old Ctcf-cKO mice were, small, pale, and hard, displaying an irregular granular surface with areas of cortical depressions underlying morphological abnormalities and fibrosis (Figure 5A). Ctcf-cKO mice had lower body weights than control mice (20.91 ± 0.84 vs 25.15 ± 1.51g; p<0.05, Figure 5B). Moreover, the kidney/body weight ratio was markedly decreased in Ctcf-cKO mice indicating a more pronounced effect in the kidney than on somatic growth (1.032 ± 0.037 vs. 1.27 ± 0.032; p< 0.001, Figure 5C).
Figure 5. Deletion of Ctcf affects somatic and kidney growth and leads to severe kidney abnormalities.

A. Kidneys from Ctcf-cKO mice are small, pale, and with irregular surfaces. B. Body weights of Ctcf-cKO mice (n=12) were significantly lower than in control animals (n=7). C. The kidney/body weight ratio was markedly decreased in Ctcf-cKO mice. D. A tiled image of H&E staining reveals disorganized kidney structure, lack of cortical-medullary junctions, and dilated tubules in kidneys from Ctcf-cKO mice (bottom). E. Left, Masson’s trichrome shows interstitial fibrosis (blue) with cortical depressions (arrow) in Ctcf-cKO kidneys. Also, peri and intraglomerular fibrosis are observed. Middle, PAS staining indicates intraluminal casts in dilated tubules (black arrows) and sclerotic glomeruli with fibrocellular crescent formation (yellow arrow) surrounded by disorganized packed cells. Right, αSMA immunostaining shows an increased expression of αSMA in the interstitium, around and within glomeruli. Quantitative data are presented as mean ± SD. *p<0.05, ***p<0.001, by unpaired, 2-sided Student’s t-test. Black squares, males; red dots, females.
Hematoxylin staining of Ctcf-cKO kidneys revealed a disorganized kidney structure and lack of cortical-medullary demarcation, dilated tubules and proliferative tissue as evidenced by the large basophilic areas with numerous nuclei indicating areas of proliferation. These abnormalities were not present in control mice (Figure 5D). Masson’s trichrome staining evidenced multiple fibrotic areas with increased collagen fibers (colored in blue) in kidneys of Ctcf-cKO mice coinciding with the cortical depressions mentioned above (Figure 5E, left). These areas of sclerosis were also observed surrounding the glomeruli and within glomeruli expanding the mesangium and reducing capillary lumens. Periodic Acid-Schiff-stained kidneys showed dilated tubules with intraluminal casts, and areas with crowded sclerotic glomeruli with extra-capillary hypercellularity and crescent glomeruli, as evidenced by the proliferating epithelial cells in the Bowman’s space (Figure 5E, middle). Glomeruli also showed global thickened basement membranes and were surrounded by disorganized packed cells (Figure 5E, middle). Immunostaining for alpha-smooth muscle actin (αSMA) revealed active fibrotic processes in the kidneys of Ctcf-cKO mice indicated by interstitial cells expressing αSMA as well as cells surrounding and within the sclerotic glomeruli (Figure 5E, right).
Deletion of Ctcf leads to kidney failure.
Ctcf-cKO mice present chronic normocytic anemia characterized by low hemoglobin (9.773 ± 0.473 vs. 12.88 ± 0.289 g/dL; p<0.001, Figure 6A) and low hematocrit (37.18 ± 1.77 vs. 48.24 ± 1.18%; p<0.001, Figure 6B). In addition, blood urea nitrogen was increased in Ctcf-cKO mice when compared to control animals indicating renal failure (40.09 ± 4.699 vs. 24.29 ± 2.327mg/dL; p<0.05, Figure 6C). Moreover, measurement of urine osmolality indicated that Ctcf-cKO mice could not concentrate their urine appropriately (445.8 ± 36.21 vs. 1593 ± 165.5 mOSM/Kg; p<0.0001, Figure 6D).
Figure 6. Deletion of Ctcf causes anemia and renal failure.

Ctcf-cKO mice shows anemia characterized by low hemoglobin (A. Ctcf-cKO, n= 11; Control, n= 6) and low hematocrit (B. Ctcf-cKO, n= 12; Control, n= 7). C. The blood urea nitrogen was significantly increased in Ctcf-cKO mice (n=11) compared to control mice (n=6), indicating renal failure. D. Measurement of urine osmolality indicated that Ctcf-cKO mice (n=11) cannot concentrate their urine. Mean ± SD. *p<0.05, ***p<0.001, ****p<0.0001, unpaired, 2-sided Student’s t test. Black squares, males; red dots, females.
Renin production is impaired in Ctcf-cKO mice at early stages.
To investigate when the phenotype described above for the deletion of Ctcf begins we studied mice at earlier stages, at 2 and 1 months of age. Macroscopically, at 2 months, kidneys of Ctcf-cKO mice have a normal shape and reddish appearance similar to the control group (Supplementary Figure 2A). We found no differences in somatic or kidney weight of Ctcf-cKO mice when compared to control mice (Supplementary Figure 2B–C). Histology of the kidneys showed a variable phenotype between mice showing focal areas of disorganized tissue structure (Supplementary Figure 2D). PAS staining evidenced focal areas with dilated tubules with the presence of casts and thickening of the glomeruli basement membrane (Supplementary Figure 2E, left). Masson trichrome performed in kidneys from Ctcf-cKO mice showed fibrosis in the interstitium as well as around and within glomeruli (Supplementary Figure 2E, middle). Immunostaining for αSMA revealed an increase of signal in the interstitium and surrounding glomeruli (Supplementary Figure 2E, right). Although positive areas for renin were encountered in Ctcf-cKO mice (Supplementary Figure 3A), the JG index revealed a reduced percentage of positive juxtaglomerular areas compared with control mice (22.5 ± 4.05 vs. 43.4 ± 6.2%, p<0.001; Supplementary Figure 3B) that was accompanied by a decreased in relative renin mRNA levels measured in kidney cortices of Ctcf-cKO mice (0.34 ± 0.11 vs. 1.07 ± 0.17, p<0.01; Supplementary Figure 3C). In addition, circulating plasma renin measured by ELISA was significantly decreased in Ctcf-cKO versus control mice (12,280 ± 2,049 vs. 36,692 ± 4,135 pg/mL; p<0.0001, Supplementary Figure 3D). Furthermore, we observed that Ctcf-cKO mice at 2 months of age were not able to concentrate their urine (407.9 ± 74.13 vs. 933.3 ± 124.1 mOSM/Kg, p<0.01; Supplementary Figure 3E).
On the other hand, at 1 month of age, we did not find macroscopic differences between Ctcf-cKO and control kidneys, and hematoxylin & eosin staining showed no visible alterations in kidney structure (Supplemental Figure 4, top). PAS staining showed few collapsed glomeruli with thickened glomeruli basement membrane in Ctcf-cKO mice (Supplementary Figure 4, middle). Also, we found a segmental and focal nodular expansion of the extracellular matrix in one kidney section from one Ctcf-cKO mouse (Supplementary Figure 4, middle). Masson trichrome evidenced small fibrotic areas in the interstitium and hypercellular glomeruli surrounded by a more intense collagen fiber staining in Ctcf-cKO mice than in control mice (Supplementary Figure 4, bottom). Renin immunostaining demonstrated many positive areas in Ctcf-cKO kidneys with a similar distribution found in the control group (Supplementary Figure 5A); however, the JG index revealed a 5% decreased in positive areas in the mutant mice (Supplementary Figure 5B). Measurements of the stained areas did not show a significative difference between groups (data not shown). We also found a significant decreased in circulating renin (16,601 ± 5,645 vs. 25,819 ± 9,665 pg/mL) and in relative renin mRNA levels (0.689 ± 0.14 vs. 1.20 ± 0.15) of Ctcf-cKO mice when compared to control mice (Supplementary Figure 5C and D, respectively).
DISCUSSION
The present study shows that Ctcf is crucial for the maintenance of renin-expressing cells, kidney structure, and blood pressure/fluid homeostasis in adult mice. Because Ctcf-null mice are not viable24, we generated conditional Ctcf knockout mice where Ctcf was deleted in cells from the renin lineage by crossing Ctcf floxed mice11 with our mice expressing Cre-recombinase under the control of the endogenous Ren1d regulatory regions12. Loss of Ctcf in renin cells of mice at 4 months of age resulted in a severe depletion of renin-expressing cells with the attendant decrease in renin synthesis and release, decreased circulating renin and low blood pressure. Phenotypic changes were already present at 1 month of age and became more severe as the animals aged ultimately compromising kidney structure and function. Under the constant homeostatic threat of low blood pressure and fluid loss, the demands for renin increased over time leading to constant activation of the renin promoter driving the Cre-recombinase resulting in unremitting accumulation of Ctcf deletions and depletion of Ctcf along the arterial tree. In turn, the progressive lack of renin led to dehydration, inability to concentrate the urine, and widespread focal histological changes of tubular atrophy, sclerotic glomeruli, and interstitial fibrosis found at 2 months of age. The partial compensation at earlier stages may also be due to neogenesis of renin cells or recruitment of other cells to synthesize renin over time; however, as the deletions accumulate the number of cells expressing renin cannot be replenished.
In addition to a decreased in renin cell number, kidneys from Ctcf-cKO mice at 4 months of age showed additional abnormalities including reduced arteriolar branching of the kidney vasculature, tubular dilation, fibrosis and sclerotic glomeruli with abnormal Bowman’s capsules. This phenotype resembles the phenotype seen in mice with deletion of CBP and p300 also characterized by depletion of renin-expressing cells14. It also shares with such study the lack of concentric arteriolar hypertrophy consistently found in mice with deletion of any of the renin-angiotensin genes including the Ren1c−/− mice25. This suggests that the functions of Ctcf in renin cells extend beyond its influence on the renin gene and that the kidney abnormalities may not be due solely to the lack of renin. In the case of Ren1c-KO mice, there is absolute lack of renin throughout life, but the endowment of renin null cells is not diminished as it occurs with double homozygous deletion of Cbp/p300 or in Ctcf-cKO mice. Contrary to that, in Ren1c-KO mice, cells of the renin lineage (even though they cannot produce renin) persist, increase in number throughout the kidney vasculature and retain the molecular program of the renin phenotype in a futile attempt to regain homeostasis25. Those overstimulated renin null cells retain embryonic characteristics and produce a variety of secreted growth factors that are likely to induce concentric vascular hypertrophy25. By the contrary, in Ctcf mice the endowment of renin-expressing cells is clearly diminished and the transcriptional machinery that governs the identity of the renin cells is compromised. It is therefore plausible that lacks of Ctcf completely distorts the ability of renin cells to maintain the molecular program that characterizes their phenotype, thus explaining the lack of arteriolar hypertrophy heavily dependent on the presence of properly functioning overstimulated renin null cells. Ctcf mice displayed an arteriolar branching defect. We have previously shown that vascular renin is necessary for the proper morphogenesis (including branching and elongation) of the renal arterial tree21. It is therefore likely that the branching defect observed in our Ctcf mice is the result of the marked renin deficiency we encountered in the renal vasculature. These results are in keeping with the fundamental roles of Ctcf in chromatin structure including the establishment of large chromatin domains5 and chromatin looping to regulate enhancer promoter interactions within topological associated domains where gene transcriptional activity occurs. Recently, Donlon and Morris26 suggested the interesting possibility that Ctcf binding-sites serve as insulators of the REN human promoter in other cell types, preventing renin expression. As disruption of insulator’s areas occurs in aging cells, genes may undergo inappropriate gene expression facilitated by its neighboring super-enhancers26. Further studies in our model will need to be performed to test this hypothesis. Further, it will be important to determine whether deletion of Ctcf caused changes in 3D chromatin organization of the renin cells and as a result altered renin cell fate. In this regard and as shown in Figure 1, we found that Ctcf has several conserved binding sites in renin cells within 40kb surrounding the Ren1 locus and a binding site in the first intron of the renin gene. It could be possible that some of these sites are directly implicated in TAD formation as shown in the MCF-7 cell line26. It is therefore likely that the decreased number of renin-expressing cells, as a primary effect, could be due to lack of Ctcf binding to these sites in the proximity to the renin gene. Further studies may need to be performed to test whether specific deletion of those binding sites alters chromatin structure and renin cell fate.
In summary, Ctcf is necessary for the maintenance of renin cell identity and renin expression. Thus, we propose a model where mice lacking Ctcf in renin cells, develop severe kidney abnormalities and renal insufficiency throughout postnatal life. In normal renin cells, Ctcf might be part of the chromatin loop formation machinery required to bring into proximity crucial super-enhancers to their promoters. We suggest the distinct possibility that disruption of chromatin architecture in renin cells might be underlying our findings.
Supplementary Material
Clinical Perspectives.
Experimental deletion of Ctcf in cells from the renin lineage led to a model of kidney fibrosis an end stage renal disease.
Lack of Ctcf leads to decreased endowment of renin-expressing cells accompanied by decreased circulating renin, hypotension, severe morphological abnormalities of the kidney, including arteriolar branching defect, and ultimately renal failure.
Understanding the role of key regulators involved in renin expression and renin lineage cell identity may be of benefit for the management of patients with blood pressure disorders and renal diseases.
Acknowledgments
We thank Tiffany Southard, Fang Xu, Minghong Li, Rajwinderjit Kaur and Xiuyin Liang for technical assistance.
Funding: This work was funded by National Institutes of Health grants DK-096373 and DK-116718 to RAG, and DK-116196, DK-096373 and HL-148044 to MLSSL.
Footnotes
Conflict of interest: The authors have declared that no conflict of interest exists.
References
- 1.Gomez RA, Sequeira-Lopez MLS. Renin cells in homeostasis, regeneration and immune defence mechanisms. Nat Rev Nephrol. 2018;14:231 10.1038/nrneph.2017.186. [DOI] [PMC free article] [PubMed] [Google Scholar]
- 2.Belyea BC, Santiago AE, Vasconez WA, et al. A primitive type of renin-expressing lymphocyte protects the organism against infections. bioRxiv. January 2019:770511. doi: 10.1101/770511 [DOI] [PMC free article] [PubMed] [Google Scholar]
- 3.Gomez RA, Lynch KR, Chevalier RL, et al. Renin and angiotensinogen gene expression and intrarenal renin distribution during ACE inhibition. Am J Physiol Physiol. 1988;254(6):F900–F906. doi: 10.1152/ajprenal.1988.254.6.F900 [DOI] [PubMed] [Google Scholar]
- 4.Martinez MF, Medrano S, Brown EA, et al. Super-enhancers maintain renin-expressing cell identity and memory to preserve multi-system homeostasis. J Clin Invest. 2018;128(11):4787–4803. doi: 10.1172/JCI121361 [DOI] [PMC free article] [PubMed] [Google Scholar]
- 5.Ong C-T, Corces VG. CTCF: an architectural protein bridging genome topology and function. Nat Rev Genet. 2014;15(4):234–246. doi: 10.1038/nrg3663 [DOI] [PMC free article] [PubMed] [Google Scholar]
- 6.Ohlsson R, Renkawitz R, Lobanenkov V. CTCF is a uniquely versatile transcription regulator linked to epigenetics and disease. Trends Genet. 2001;17(9):520–527. doi: 10.1016/S0168-9525(01)02366-6 [DOI] [PubMed] [Google Scholar]
- 7.Chen H, Tian Y, Shu W, Bo X, Wang S. Comprehensive identification and annotation of cell type-specific and ubiquitous CTCF-binding sites in the human genome. PLoS One. 2012;7(7):e41374–e41374. doi: 10.1371/journal.pone.0041374 [DOI] [PMC free article] [PubMed] [Google Scholar]
- 8.Klenova EM, Nicolas RH, Paterson HF, et al. CTCF, a conserved nuclear factor required for optimal transcriptional activity of the chicken c-myc gene, is an 11-Zn-finger protein differentially expressed in multiple forms. Mol Cell Biol. 1993;13(12):7612–7624. https://www.ncbi.nlm.nih.gov/pubmed/8246978. [DOI] [PMC free article] [PubMed] [Google Scholar]
- 9.Recillas-Targa F, Pikaart MJ, Burgess-Beusse B, et al. Position-effect protection and enhancer blocking by the chicken beta-globin insulator are separable activities. Proc Natl Acad Sci U S A. 2002;99(10):6883–6888. doi: 10.1073/pnas.102179399 [DOI] [PMC free article] [PubMed] [Google Scholar]
- 10.Guo Y, Xu Q, Canzio D, et al. CRISPR Inversion of CTCF Sites Alters Genome Topology and Enhancer/Promoter Function. Cell. 2015;162(4):900–910. doi: 10.1016/j.cell.2015.07.038 [DOI] [PMC free article] [PubMed] [Google Scholar]
- 11.Heath H, de Almeida CR, Sleutels F, et al. CTCF regulates cell cycle progression of αβ T cells in the thymus. EMBO J. 2008;27(21):2839–2850. doi: 10.1038/emboj.2008.214 [DOI] [PMC free article] [PubMed] [Google Scholar]
- 12.Sequeira López MLS, Pentz ES, Nomasa T, Smithies O, Gomez RA. Renin cells are precursors for multiple cell types that switch to the renin phenotype when homeostasis is threatened. Dev Cell. 2004;6(5):719–728. doi: 10.1016/S1534-5807(04)00134-0 [DOI] [PubMed] [Google Scholar]
- 13.Sigmund CD, Okuyama K, Ingelfinger J, et al. Isolation and characterization of renin-expressing cell lines from transgenic mice containing a renin-promoter viral oncogene fusion construct. J Biol Chem. 1990. [PubMed] [Google Scholar]
- 14.Gomez RA, Pentz ES, Jin X, Cordaillat M, Sequeira Lopez MLS. CBP and p300 are essential for renin cell identity and morphological integrity of the kidney. AJP Hear Circ Physiol. 2009;296(5):H1255–H1262. doi: 10.1152/ajpheart.01266.2008 [DOI] [PMC free article] [PubMed] [Google Scholar]
- 15.Sequeira-Lopez MLS, Weatherford ET, Borges GR, et al. The MicroRNA-Processing Enzyme Dicer Maintains Juxtaglomerular Cells. J Am Soc Nephrol . 2010;21(3):460–467. doi: 10.1681/ASN.2009090964 [DOI] [PMC free article] [PubMed] [Google Scholar]
- 16.Sequeira Lopez ML, Pentz ES, Robert B, Abrahamson DR, Gomez RA. Embryonic origin and lineage of juxtaglomerular cells. Am J Physiol Renal Physiol. 2001;281(2):F345–56. http://ajprenal.physiology.org/content/281/2/F345.abstract. Accessed January 14, 2017. [DOI] [PubMed] [Google Scholar]
- 17.Lin EE, Sequeira-Lopez MLS, Gomez RA. RBP-J in FOXD1+ renal stromal progenitors is crucial for the proper development and assembly of the kidney vasculature and glomerular mesangial cells. Am J Physiol - Ren Physiol. 2014;306(2):F249–F258. doi: 10.1152/ajprenal.00313.2013 [DOI] [PMC free article] [PubMed] [Google Scholar]
- 18.Pentz ES, Cordaillat M, Carretero OA, Tucker AE, Sequeira Lopez MLS, Gomez RA. Histone acetyl transferases CBP and p300 are necessary for maintenance of renin cell identity and transformation of smooth muscle cells to the renin phenotype. AJP Hear Circ Physiol. 2012;302(12):H2545–H2552. doi: 10.1152/ajpheart.00782.2011 [DOI] [PMC free article] [PubMed] [Google Scholar]
- 19.Pentz ES, Moyano MA, Thornhill BA, Sequeira Lopez MLS, Gomez RA. Ablation of renin-expressing juxtaglomerular cells results in a distinct kidney phenotype. Am J Physiol Integr Comp Physiol. 2004;286(3):R474–R483. doi: 10.1152/ajpregu.00426.2003 [DOI] [PubMed] [Google Scholar]
- 20.Pentz ES, Lopez, KIM H-S, CARRETERO O, SMITHIES O, GOMEZ RA. Ren1d and Ren2 cooperate to preserve homeostasis: evidence from mice expressing GFP in place of Ren1d. Physiol Genomics. 2001;6(1):45–55. doi: 10.1152/physiolgenomics.2001.6.1.45 [DOI] [PubMed] [Google Scholar]
- 21.Reddi V, Zaglul A, Pentz ES, Gomez RA. Renin-expressing cells are associated with branching of the developing kidney vasculature. J Am Soc Nephrol. 1998;9(1):63 LP - 71. http://jasn.asnjournals.org/content/9/1/63.abstract. [DOI] [PubMed] [Google Scholar]
- 22.Nagalakshmi VK, Li M, Shah S, et al. Changes in cell fate determine the regenerative and functional capacity of the developing kidney before and after release of obstruction. Clin Sci. 2018;132(23):2519 LP - 2545. doi: 10.1042/CS20180623 [DOI] [PMC free article] [PubMed] [Google Scholar]
- 23.Davis CA, Hitz BC, Sloan CA, et al. The Encyclopedia of DNA elements (ENCODE): data portal update. Nucleic Acids Res. 2018;46(D1):D794–D801. doi: 10.1093/nar/gkx1081 [DOI] [PMC free article] [PubMed] [Google Scholar]
- 24.Fedoriw AM, Stein P, Svoboda P, Schultz RM, Bartolomei MS. Transgenic RNAi Reveals Essential Function for CTCF in H19 Gene Imprinting. Science (80- ). 2004;303(5655):238 LP - 240. http://science.sciencemag.org/content/303/5655/238.abstract. [DOI] [PubMed] [Google Scholar]
- 25.Oka M, Medrano S, Sequeira-Lόpez MLS, Gómez RA. Chronic Stimulation of Renin Cells Leads to Vascular Pathology. Hypertension. 2017;70(1):119 LP - 128. http://hyper.ahajournals.org/content/70/1/119.abstract. [DOI] [PMC free article] [PubMed] [Google Scholar]
- 26.Donlon TA & Morris B In silico analysis of human renin gene–gene interactions and neighborhood topologically associated domains suggests breakdown of insulators contribute to ageing-associated diseases. Biogerontology. 2019:pp 1–13. doi: 10.1007/s10522-019-09834-1 [DOI] [PubMed] [Google Scholar]
Associated Data
This section collects any data citations, data availability statements, or supplementary materials included in this article.