

Abstract
Bone marrow adipose tissue (BMAT) resides within the bone marrow microenvironment where its function remains poorly understood. BMAT is elevated in anorexia nervosa, a disease model of chronic starvation, despite depletion of other fat depots. In addition to BMAT, the marrow microenvironment also consists of osteoblast and hematopoietic progenitors. BMAT is inversely associated with bone mineral density (BMD) in multiple populations including women with anorexia nervosa, and regulates hematopoiesis in animal models. We hypothesized that BMAT would be associated with circulating populations of hematopoietic cells (red and white blood cells) in humans and performed a post-hoc analysis of two studies – a cross-sectional study and longitudinal study – to investigate this hypothesis. We studied 89 premenopausal women cross-sectionally (median age [interquartile range]: 27 [24.5, 31.7] years), including 35 with anorexia nervosa. We investigated associations between red blood cell (RBC) and white blood cell (WBC) counts and BMAT assessed by 1H- magnetic resonance spectroscopy, BMD assessed by DXA, and bone microarchitecture assessed by HR-pQCT. In addition, we analyzed longitudinal data in six premenopausal women with anorexia nervosa treated with transdermal estrogen for six months and measured changes in BMAT and blood cell counts during treatment. Cross-sectionally, BMAT was inversely associated with WBC and RBC counts. In contrast, BMD and parameters of bone microarchitecture were positively associated with WBC and RBC. In women with anorexia nervosa treated with transdermal estrogen for six months, decreases in BMAT were significantly associated with increases in both RBC and hematocrit (rho= −0.83, p=0.04 for both). In conclusion, we demonstrate that marrow adipose tissue is inversely associated with WBC and RBC in premenopausal women, and there is a potential association between longitudinal changes in BMAT and changes in RBC. These associations warrant further study and may provide further insight into the role and function of this understudied adipose depot.
Keywords: Hematopoiesis, marrow adipose tissue; bone mineral density; anorexia nervosa, bone microarchitecture
Introduction:
The bone marrow consists of two types of stem cells: (1) mesenchymal stem cells, which differentiate into osteoblasts or adipocytes, and (2) hematopoietic stem cells, which differentiate into red blood cells (RBC), white blood cells (WBC), or platelets. In murine models, osteoblasts are important regulators of hematopoiesis (1) and induced osteoblast-depletion results in a decrease in erythroid, lymphoid and myeloid progenitors (2). In humans, both red and white blood cell populations are associated with bone mineral density (BMD) and anemia has been shown to be an independent predictor of fracture (3). Further, low hemoglobin levels are associated with low bone mineral density in older adults (4) and higher rates of bone loss at the hip have been associated with both an increased risk of anemia as well as low lymphocyte counts in men 65 years or older (5).
Bone marrow adipose tissue (BMAT), another component of the bone marrow microenvironment, is inversely associated with bone parameters in humans. BMAT is inversely associated with bone mineral density (BMD) in populations of healthy adults (6,7) and also in a model of chronic starvation, anorexia nervosa (8). Women with anorexia nervosa have higher levels of BMAT compared to normal-weight controls despite having significantly lower levels of subcutaneous and visceral adipose tissue depots (8). Although the function of BMAT is not currently known, the fact that this adipose tissue depot is preserved during chronic starvation, when other fat depots are being used as a source of energy, suggests it may have an important role.
In murine models, granulocyte-colony stimulating factor, which leads to an increase in circulating neutrophils, has been associated with reductions in BMAT (9) and BMAT has also been associated with reduced hematopoiesis (10). Therefore, to better understand the potential function and determinants of BMAT in humans, we explored the association between BMAT and cells from the hematopoietic lineage, specifically RBC and WBC counts in premenopausal women using both cross-sectional and longitudinal study designs. We hypothesized that BMAT would be negatively associated with cells from the hematopoietic lineage.
Materials and Methods:
Subjects
We performed post-hoc analyses of two prior studies. The first was a study investigating levels of BMAT in premenopausal women, inclusive of women with anorexia nervosa, normal-weight controls, and obese women (11-14). The second study was a longitudinal study investigating the effects of low-dose, transdermal estrogen on BMD and BMAT in premenopausal women with anorexia nervosa (15). Eighty-nine premenopausal women were studied cross-sectionally, inclusive of 35 women with anorexia nervosa (median age [interquartile range]: 26.8 [24.6, 31.0] years and range: 20.3-45.1 years). In addition, we studied six women with anorexia nervosa (median age [interquartile range]: 34.3 [28.5, 45.4] years and range: 25.3-45.5 years) longitudinally for six months during which time they were treated with low-dose, transdermal estrogen (Climara Pro, Bayer Pharmaceuticals) a treatment which has been associated with a reduction in BMAT in postmenopausal and premenopausal women (15,16). This particular transdermal formulation contains 0.045 mg of estradiol/day and 0.015mg of levonorgestrel/day, a progesterone, which is necessary for the prevention of endometrial hyperplasia in women with an intact uterus. As previously described (15), this formulation was chosen because it contains a dose of estradiol that we hypothesized would be effective in improving BMD based on data in postmenopausal women (17). BMAT and/or bone parameters from a subset of subjects were previously reported (11-15,18). Hematologic data have not been previously reported. Subjects were recruited either through on-line advertisements or through referrals from local eating disorder providers for both the cross-sectional and longitudinal studies. Subjects with anorexia nervosa met DSM-5 criteria for the disorder (19). Subjects without anorexia nervosa had a BMI > 18.5 kg/m2 (range: 20.8-41.7 kg/m2), none reported a past or current history of an eating disorder, none were taking medications known to affect bone mass, and all reported having regular menstrual cycles. Participants who had abnormal thyroid function tests or chronic diseases which affect bone mineral density (other than anorexia nervosa) were excluded.
Cross-sectional study
All subjects were evaluated at the Translational and Clinical Research Center at the Massachusetts General Hospital during two study visits: a screening visit and a baseline study visit. All subjects had a complete blood count inclusive of RBC count, WBC count, hemoglobin and hematocrit levels, and a platelet count at the time of their screening visit, performed by a clinical laboratory (LabCorp). Subjects then returned for a study visit within 3 months of their screening visit at which time they were weighed on an electronic scale while wearing a hospital gown, their height was measured on a single stadiometer as the average of three readings, and radiologic imaging including dual energy X-ray absorptiometry (DXA), 1H-Magnetic Resonance Spectroscopy (1H-MRS) , and high resolution peripheral quantitative CT (HR-pQCT), was performed (radiologic imaging described below).
Longitudinal study
All subjects were evaluated at the Translational and Clinical Research Center at the Massachusetts General Hospital for baseline and 6-month study visits. After the baseline visit, subjects were started on low-dose, transdermal estrogen/progesterone and they continued using the patch until their six-month study visit. At each study visit, all six subjects had a complete blood count, inclusive of RBC count, WBC count, hemoglobin and hematocrit levels, and a platelet count, and 1H-MRS (described below) performed.
The study complied with the Health Insurance Portability and Accountability Act guidelines and was approved by the Partners Institutional Review Board. All subjects provided written informed consent prior to the initiation of study procedures.
Radiologic Imaging
Dual energy X-ray absorptiometry
All subjects underwent DXA to measure areal BMD of the posterior-anterior (PA) lumbar spine (L1-L4), lateral spine (L2-L4), left total hip, left femoral neck and total body using a Hologic Discovery A densitometer (Hologic Inc., Bedford, MA). Coefficients of variation for the measurement of BMD by DXA have been reported to be less than 2.2% (20).
High resolution peripheral quantitative computed tomography (HR-pQCT)
HR-pQCT (isotropic voxel size of 82 μm3) was performed in the non-dominant distal radius and tibia (Xtreme CT; Scanco Medical AG, Bruttisellen, Switzerland) as previously described (21). As previously described (22,23), linear microfinite element analysis of HR-pQCT images was subsequently performed in order to estimate the biomechanical properties of the distal radius and the distal tibia under uniaxial compression loading. Outcomes from linear microfinite element analysis included both compressive stiffness (kN/mm) and failure load (kN). The biomechanical properties estimated from microfinite element analysis are strongly correlated with those measured through the ex vivo testing of elderly human cadaveric radii (24).
1H-Magnetic Resonance Spectroscopy (1H-MRS)
The Metabolic Imaging Core of the Nutrition and Obesity Research Center at Harvard performed 1H-Magnetic Resonance Spectroscopy (1H-MRS) as previously described (8). Briefly, lipid content of the L4 vertebra, proximal femoral epiphysis, metaphysis and mid-diaphysis was measured using 1H-MRS (Siemens Trio, 3T, Siemens Medical Systems, Erlangen, Germany). This was performed by placing a voxel measuring 15 × 15 × 15 mm (3.4 mL) within the body of the L4 vertebra and then using spatially localized spectroscopy (PRESS) pulse sequence without water suppression (parameters: TE of 30 ms, TR of 3,000 ms, 8 acquisitions, 1024 data points, and receiver bandwidth of 2000 Hz), single-voxel 1H-MRS data were obtained. Similarly, in the femur, single voxel 1H-MRS, using the same non-water suppressed PRESS pulse sequence, was performed in the femur after a 12 x 12 x 12 mm (1.7 mL) voxel was placed in the proximal femoral epiphysis and repeated after voxel placement in the mid-diaphysis and the inter-trochanteric region of the femoral metaphysis. Automated procedures were used to optimize gradient shimming and transmit and receive gain. We have previously reported that the coefficient of variation (cv) for marrow fat quantification, obtained by scanning 5 subjects two times each, is 3% (25).
1H-MRS data were fitted using LCModel software (version 6.1-4A) (Stephen Provencher, Oakville, ON, Canada). Metabolite quantification was obtained using eddy current correction and water scaling after data were transferred to a Linux workstation. A fitting algorithm customized for analysis of bone marrow was used to provide estimates for all of the lipid signals combined (0.9, 1.3, and 2.3 ppm). The lipid estimates for bone marrow using LCModel software were automatically scaled to an unsuppressed water peak (4.7 ppm) and results were expressed as a lipid to water ratio.
Statistical Analysis
JMP Pro 13.0 (SAS Institute, Carry, NC) software was used to perform statistical analyses. The Student’s t-test was used to compare means and standard deviations (SD) unless data were not normally distributed, in which case the Wilcoxon test was used to compare medians [interquartile range]. Univariate associations were assessed using Pearson correlation coefficients (R), or if data were non-normally distributed, Spearman’s coefficients (rho). Spearman’s coefficients were calculated in the analysis of the longitudinal data, given the small sample size (n=6). A p-value < 0.05 was used to indicate significance.
Results:
Clinical characteristics
Clinical characteristics of the study subjects, including bone mineral density and bone microarchitecture data, are listed in Table 1. Subjects were all premenopausal. Subjects in the cross-sectional study were a median of 27 years of age (median age [interquartile range]: 27 [24.5, 31.7] years and range: 20.0-45.7 years). Subjects in the longitudinal study had anorexia nervosa for a median of 13 years (range: 3-17 years) and had amenorrhea for a median of 135 months (range: 34-204 months). BMAT was inversely associated with BMD, parameters of bone microarchitecture and bone strength (Table 2).
Table 1:
Clinical characteristics of participants in cross-sectional study and baseline characteristics of subjects with anorexia nervosa in longitudinal study. Mean ± SD or median [interquartile range] when data were not normally distributed.
| Cross-sectional study participants (n=89) |
Longitudinal study participants (n=6) |
|
|---|---|---|
| Age (years) | 27.0 [24.5, 31.7] (range: 20-45.7) | 35.7 ± 3.5 (range: 25.3-45.5) |
| BMI (kg/m2) | 22.1 [17.8, 30.8] | 17.1 ± 1.4 |
| Bone mineral density (BMD) | ||
| Lumbar spine BMD (g/cm2) | 0.955 [0.854, 1.078] | 0.808 ± 0.111 |
| Lateral spine BMD (g/cm2) | 0.743 ± 0.149 | 0.628± 0.109 |
| Total Hip BMD (g/cm2) | 0.919 ± 0.170 | 0.739± 0.093 |
| Femoral neck BMD (g/cm2) | 0.799 ± 0.159 | 0.647± 0.087 |
| Total body BMD (g/cm2) | 1.020 ± 0.097 | 0.982 ± 0.052 |
| Bone marrow adipose tissue | ||
| L4 vertebra (lipid/water) | 0.54 [0.40, 0.87] | 1.18 ± 0.42 |
| Femoral epiphysis (lipid/water) | 7.25 ± 2.90 | 8.17 ± 2.17 |
| Femoral diaphysis (lipid/water) | 4.84 [2.61, 7.09] | 7.58 ± 1.71 |
| Femoral metaphysis (lipid/water) | 3.18 [2.04, 4.89] | 5.77 ± 1.96 |
| Microarchitecture parameters at radius | ||
| Trabecular BV/TV (%) | 0.128 [0.109, 0.151] | 0.108 ± 0.024 |
| Trabecular number (1/mm)* | 1.91 [1.71, 2.12] | 1.67 ± 0.24 |
| Trabecular thickness (mm) | 0.066 [0.060, 0.074] | 0.061 [0.057, 0.072] |
| Trabecular separation (mm) | 0.452 [0.407, 0.520] | 0.546 ± 0.093 |
| Cortical thickness (mm) | 0.77 ± 0.18 | 0.61 ± 0.08 |
| Estimates of bone strength at radius | ||
| Stiffness (kN/mm) | 71.1 ± 15.8 | 60.0 ± 2.6 |
| Failure load (kN) | 3.6 ± 0.8 | 2.9 ± 0.2 |
| Microarchitecture parameters at tibia | ||
| Trabecular BV/TV (%) | 0.142 ± 0.038 | 0.115 ± 0.028 |
| Trabecular number (1/mm)* | 1.87 ± 0.42 | 1.70 [1.49, 1.81] |
| Trabecular thickness (mm) | 0.076 ± 0.013 | 0.071 ± 0.008 |
| Trabecular separation (mm) | 0.458 [0.398, 0.540] | 0.510 [0.483, 0.638] |
| Cortical thickness (mm) | 1.17 [0.98, 1.33] | 0.97 ± 0.22 |
| Estimates of bone strength at tibia | ||
| Stiffness (kN/mm) | 200.4 ± 44.9 | 165.6 ± 23.9 |
| Failure load (kN) | 10.1 ± 2.2 | 8.2 ± 1.3 |
| Hematologic parameters | ||
| White blood cell count (x10E3/uL) | 5.6 [4.7, 7.1] | 4.4 ± 1.0 |
| Red blood cell count (x10E6/uL) | 4.30 ± 0.34 | 4.21 ± 0.42 |
| Hemoglobin (g/dL) | 12.9 ± 1.0 | 13.1 ± 1.0 |
| Hematocrit (%) | 38.3 ± 2.7 | 38.9 ± 3.2 |
| Platelet count (x10E3/uL) | 254 ± 60 | 247 ± 63 |
Table 2:
Univariate associations between bone marrow adipose tissue at the spine and hip and bone parameters in cross-sectional study participants (n=89). NS=not significant.
| Bone marrow adipose tissue at L4 Vertebra (lipid/water) |
Bone marrow adipose tissue at femoral epiphysis (lipid/water) |
Bone marrow adipose tissue at femoral diaphysis (lipid/water) |
Bone marrow adipose tissue at femoral metaphysis (lipid/water) |
|
|---|---|---|---|---|
| Bone mineral density (BMD) | ||||
| Lumbar spine BMD (g/cm2) | rho= −0.49 p < 0.0001 |
NS | rho= −0.41 p < 0.0001 |
rho= −0.60 p < 0.0001 |
| Lateral spine BMD (g/cm2) | rho= −0.57 p < 0.0001 |
NS | rho= −0.31 p < 0.004 |
rho= −0.62 p < 0.0001 |
| Total Hip BMD (g/cm2) | rho= −0.55 p < 0.0001 |
NS | rho= −0.40 p = 0.0001 |
rho= −0.63 p < 0.0001 |
| Femoral neck BMD (g/cm2) | rho= −0.54 p < 0.0001 |
NS | rho= −0.40 p < 0.0001 |
rho= −0.63 p < 0.0001 |
| Total body BMD (g/cm2) | rho= −0.51 p < 0.0001 |
NS | rho= −0.34 p = 0.001 |
rho= −0.52 p < 0.0001 |
| Microarchitecture parameters at radius | ||||
| Trabecular BV/TV (%) | rho= −0.42 p < 0.0001 |
rho= −0.27 p = 0.01 |
rho= −0.31 p < 0.004 |
rho= −0.50 p < 0.0001 |
| Trabecular number (1/mm)* | rho= −0.30 p = 0.004 |
NS | rho= −0.23 p = 0.03 |
rho= −0.43 p < 0.0001 |
| Trabecular thickness (mm) | rho= −0.32 p = 0.002 |
rho= −0.23 p = 0.03 |
rho= −0.22 p = 0.04 |
rho= −0.30 p < 0.005 |
| Trabecular separation (mm) | rho= 0.34 p = 0.001 |
NS | rho= 0.27 p = 0.01 |
rho= 0.47 p < 0.0001 |
| Cortical thickness (mm) | rho= −0.45 p < 0.0001 |
NS | rho= −0.35 p = 0.0009 |
rho= −0.40 p = 0.0001 |
| Estimates of bone strength at radius | ||||
| Stiffness (kN/mm) | rho= −0.40 p < 0.0001 |
NS | NS | rho= −0.42 p < 0.0001 |
| Failure load (kN) | rho= −0.41 p < 0.0001 |
NS | NS | rho= −0.44 p < 0.0001 |
| Microarchitecture parameters at tibia | ||||
| Trabecular BV/TV (%) | rho= −0.33 p < 0.002 |
NS | NS | rho= −0.37 p = 0.0003 |
| Trabecular number (1/mm)* | rho= −0.38 p = 0.0003 |
NS | rho= −0.33 p < 0.002 |
rho= −0.49 p < 0.0001 |
| Trabecular thickness (mm) | NS | NS | NS | NS |
| Trabecular separation (mm) | rho= 0.37 p = 0.0003 |
NS | rho= 0.31 p < 0.003 |
rho= 0.49 p < 0.0001 |
| Cortical thickness (mm) | rho= −0.37 p = 0.0004 |
NS | rho= −0.33 p < 0.002 |
rho= −0.42 p < 0.0001 |
| Estimates of bone strength at tibia | ||||
| Stiffness (kN/mm) | rho= −0.35 p = 0.0008 |
NS | NS | rho= −0.39 p = 0.0002 |
| Failure load (kN) | rho= −0.35 p = 0.0008 |
NS | NS | rho= −0.39 p = 0.0001 |
Association between blood counts parameters and BMAT
BMAT at the vertebra and femur was inversely associated with WBC and/or RBC counts. In particular, BMAT at the L4 vertebra was significantly inversely associated with WBC count (rho = −0.37, p=0.0003) (Figure 1). BMAT at the femoral diaphysis and femoral metaphysis were both significantly and inversely associated with WBC and RBC counts (Table 3). There was a trend towards an inverse association between BMAT at the femoral diaphysis and both hemoglobin and hematocrit levels (rho = −0.20, p=0.057 for both). There were no significant associations between BMAT and platelet count.
Figure 1:
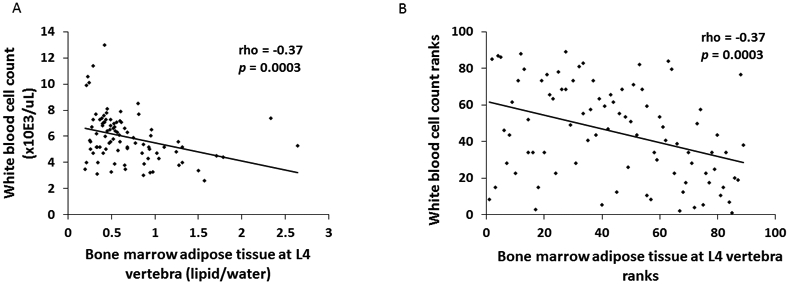
There was a significant inverse association between white blood cell count and bone marrow adipose tissue at the L4 vertebra (rho = −0.37, p=0.0003) (Panel A). When we performed a sensitivity analysis and excluded the two subjects with L4 BMAT ≥ 2 lipid/water and the five subjects with WBC count ≥ 9 x10E3/uL, the association remained significant (rho = −0.33, p=0.002). Data are also plotted as ranks (Panel B).
Table 3:
Univariate associations between bone marrow adipose tissue at the spine and hip and hematopoietic parameters. NS = not significant.
| White blood cell count (x10E3/uL) |
Red blood cell count (x10E6/uL) |
Hemoglobin (g/dL) |
Hematocrit (%) |
Platelet count (x10E3/uL) |
|
|---|---|---|---|---|---|
| Bone marrow adipose tissue at L4 vertebra (lipid/water) | rho = −0.37 p = 0.0003 |
NS | NS | NS | NS |
| Bone marrow adipose tissue at femoral epiphysis (lipid/water) | NS | NS | NS | NS | NS |
| Bone marrow adipose tissue at femoral diaphysis (lipid/water) | rho = −0.24 p < 0.03 |
rho = −0.31 p < 0.004 |
rho = −0.20 p = 0.057 |
rho = −0.20 p = 0.057 |
NS |
| Bone marrow adipose tissue at femoral metaphysis (lipid/water) | rho = −0.36 p = 0.0005 |
rho = −0.32 p = 0.002 |
NS | NS | NS |
When we divided the group based on diagnosis/BMI: anorexia nervosa (n=35), normal-weight (n=28) and overweight/obese (n=26), there were no significant associations between BMAT and any hematologic parameters in the women with anorexia nervosa or normal-weight women. In the women who were overweight/obese, in contrast to what was observed in the group as a whole, there was a significant positive association between L4 vertebral BMAT and RBC count (rho = 0.43, p=0.03) and between BMAT at the femoral metaphysis and WBC count (rho=0.46, p=0.02). There was also a positive association between BMAT at the femoral metaphysis and platelet count in this group (R=0.48, p=0.01).
Association between blood counts and bone parameters
BMD
There were significant and positive associations between WBC and RBC counts and BMD at the spine and hip (Table 4). BMD at the posterior-anterior spine was significantly associated with RBC count (rho = 0.32, p=0.002) and WBC count (rho = 0.45, p<0.0001). There were no significant associations between hemoglobin or hematocrit and BMD. Platelet count was positively associated with both total hip BMD (R=0.21, p=0.04) and femoral neck BMD (R=0.21, p=0.04).
Table 4:
Univariate associations between bone mineral density, bone microarchitecture and estimated bone strength and hematopoietic parameters. NS = not significant.
| White blood cell count (x10E6/uL) |
Red blood cell count (x10E3/uL) |
|
|---|---|---|
| Bone mineral density (BMD) | ||
| Lumbar spine BMD (g/cm2) | rho = 0.45; p< 0.0001 | rho = 0.32; p=0.002 |
| Lateral spine BMD (g/cm2) | rho = 0.52; p< 0.0001 | R = 0.29; p=0.006 |
| Total Hip BMD (g/cm2) | rho = 0.49; p< 0.0001 | R = 0.30; p=0.004 |
| Femoral neck BMD (g/cm2) | rho = 0.50; p< 0.0001 | R = 0.32; p=0.002 |
| Total body BMD (g/cm2) | rho = 0.34; p=0.001 | NS |
| Radial microarchitecture parameters | ||
| Trabecular BV/TV (%) | rho = 0.33; p=0.002 | rho = 0.25; p< 0.02 |
| Trabecular number (1/mm)* | rho = 0.26; p=0.01 | rho = 0.29; p< 0.006 |
| Trabecular thickness (mm) | rho = 0.25; p< 0.02 | NS |
| Trabecular separation (mm) | rho = −0.29; p< 0.01 | rho = −0.29; p< 0.007 |
| Cortical thickness (mm) | rho = 0.24; p< 0.03 | NS |
| Estimates of bone strength at radius | ||
| Stiffness (kN/mm) | rho = 0.39; p=0.0002 | R = 0.25; p=0.02 |
| Failure load (kN) | rho = 0.40; p< 0.0001 | R = 0.26; p=0.01 |
| Microarchitecture parameters at tibia | ||
| Trabecular BV/TV (%) | rho = 0.31; p=0.003 | R=0.28; p=0.007 |
| Trabecular number (1/mm)* | rho = 0.38; p=0.0003 | R=0.26; p< 0.02 |
| Trabecular thickness (mm) | NS | NS |
| Trabecular separation (mm) | rho = −0.37; p=0.0004 | rho = −0.29; p< 0.007 |
| Cortical thickness (mm) | rho = 0.24; p=0.02 | NS |
| Estimates of bone strength at tibia | ||
| Stiffness (kN/mm) | rho = 0.40; p=0.0001 | R = 0.24; p< 0.03 |
| Failure load (kN) | rho = 0.41; p< 0.0001 | R = 0.24; p< 0.03 |
Bone microarchitecture and estimated bone strength
Parameters of bone microarchitecture and estimated bone strength (stiffness and failure load) at the radius and tibia were significantly associated with WBC and RBC counts (Table 4). WBC count was positively associated with estimates of failure load at the radius (rho=0.40, p<0.0001) and tibia (rho=0.41, p<0.0001) (Figure 2). RBC count was also positively associated with estimates of failure load at both the radius (rho=0.26, p=0.01) and tibia (rho=0.24, p<0.03). There were no significant associations between microarchitecture parameters and hemoglobin or hematocrit levels. Platelet count was only associated with trabecular bone volume fraction at the radius (rho=0.24, p<0.03) and trabecular thickness at the radius (rho=0.22, p<0.04).
Figure 2:

There was a significant positive association between white blood cell count and failure load, an estimate of bone strength, at the radius (rho = 0.40, p<0.0001) (Panel A with ranks plotted in Panel B) and at the tibia (rho = 0.41, p<0.0001) (Panel C with ranks plotted in Panel D).
Association between changes in blood counts and changes in MAT
Treatment with transdermal estrogen is associated with changes in BMAT in both postmenopausal women and premenopausal women (15,16). In an exploratory analysis, we measured complete blood counts at baseline and after six-months of treatment with transdermal estrogen in six amenorrheic women with anorexia nervosa. Changes in BMAT at the femoral diaphysis were significantly inversely associated with changes in red blood cell count over the six-month study (Figures 3A and 3B) and with changes in hematocrit level (Figures 3C and 3D). There were no significant associations between change in WBC count and change in MAT.
Figure 3:
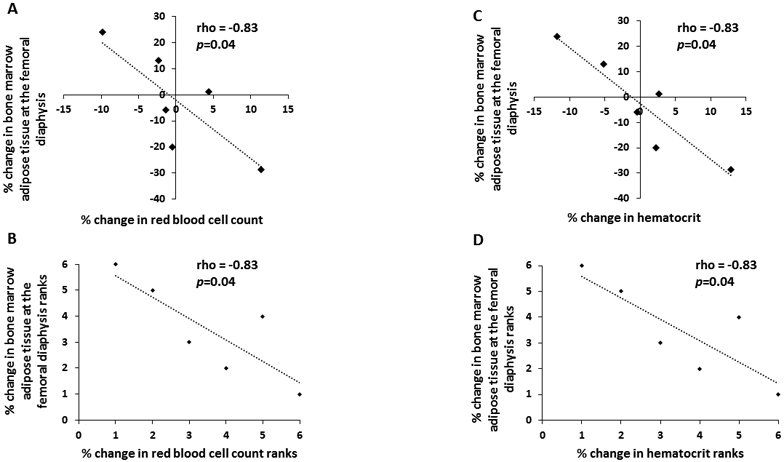
There was a significant inverse association between % change in bone marrow adipose tissue at the femoral diaphysis and % change in red blood cell count (rho = −0.83, p=0.04) (Panel A with ranks plotted in Panel B) and % change in hematocrit (rho = −0.83, p=0.04) (Panel C with ranks plotted in Panel D) after six months of transdermal estrogen treatment in six women with anorexia nervosa.
Discussion:
In this exploratory analysis, we have shown that MAT, a component of the bone marrow microenvironment, is inversely associated with red and white blood cell counts in a population of premenopausal women. Although the function of BMAT is not known, it is inversely associated with bone parameters and therefore may have a role in mineral metabolism. We now demonstrate that there may be an association between BMAT and hematopoietic cells in humans, suggesting a possible role for BMAT in hematopoiesis.
Although marrow adipose tissue, a component of the bone marrow microenvironment, has been associated with low bone density (6-8), its function has not been fully described. Paradoxically, in models of chronic starvation, such as anorexia nervosa, although subcutaneous and visceral adipose tissue stores are reduced, levels of BMAT are elevated (8). Why lipid would be stored in the marrow while other adipose tissue depots are actively being utilized as an energy source during periods of caloric deprivation is not known but understanding this paradox may allow us to better understand the function of this fat depot.
Given the inverse association between marrow adiposity and bone density, BMAT has been hypothesized to be an important determinant of the low BMD and increased fracture risk observed in women with anorexia nervosa (26). BMAT is associated with decreased bone integrity(27) and BMAT is inversely associated with finite element analysis derived estimates of bone strength both in adolescents with anorexia nervosa (28) and as our data here demonstrate in premenopausal adult women also, but whether BMAT is a causative factor of the increased fracture risk observed in anorexia nervosa remains to be determined.
In addition to marrow adipocytes, the bone marrow microenvironment also consists of osteoblast and hematopoietic progenitors. A number of studies in both animal models and humans have investigated the association between hematopoiesis and bone formation. In murine models, osteoblastic cells have been shown to be potential important regulators of hematopoiesis (1,2). In addition, in human studies, bone loss at the hip has been associated with an increased risk of anemia (5) and hemoglobin levels have been positively associated with BMD measured by peripheral quantitative CT (4) and ultrasound (29). Anemia has also been associated with increased fracture risk (3). Our data demonstrate that the association between red and white blood cell counts and bone parameters is also significant and positive in premenopausal women; both red and white blood cell counts were significantly associated with BMD as well as parameters of bone microarchitecture and estimates of bone strength.
In contrast, less is known about the association between marrow adipocytes and hematopoiesis. In a murine model, skeletal regions with greater BMAT have been associated with fewer hematopoietic stem cells and in mice who are irradiated and receive a bone-marrow transplant, inhibition of adipogenesis after irradiation is associated with improved bone-marrow engraftment and increased white blood cell counts (10). More recently, reductions in BMAT in a bariatric surgery mouse model have been associated with increased granulocyte-colony stimulating factor which, in turn, leads to increased circulating neutrophils (9). Our data now demonstrate an inverse association between BMAT and both red and white blood cell counts in humans. Whether BMAT is a negative regulator of hematopoiesis (10) or whether it may be utilized to fuel myelopoiesis (9) in humans remains unknown and future studies will be necessary to further explore this association. Given the known association between BMAT and decreased bone integrity (27), whether this association between BMAT and hematopoietic parameters is a potential mediator in the association between anemia and increased fracture risk, which has been shown in some populations to be independent of BMD (30) also warrants further study.
Interestingly, when we divided the group by BMI, we found that the association between BMAT and WBC and RBC counts was opposite to that observed in the group as whole. In overweight/obese women, the relationship between BMAT and WBC/RBC counts was positive. These data are consistent with prior studies suggesting potential differences in BMAT in women with anorexia nervosa as compared to those who are normal-weight or overweight/obese. For example, in overweight/obese women, BMAT is positively associated with visceral adipose tissue (31), whereas this association is not observed in lower-weight women (14). These data may provide further support for the concept that BMAT may have a different function in states of nutrient insufficiency as compared to nutrient sufficiency.
Although a major limitation of our study is its cross-sectional nature, which does not allow us to make any inferences about causality, the longitudinal component of our study demonstrates a strong association between changes in BMAT and changes in RBC counts over a short-time interval. Importantly, this is a small exploratory study and therefore meant to be hypothesis generating, given the very small sample size, but these data suggest that BMAT may potentially be a determinant of RBC count. Estrogen has been shown to increase hematopoietic stem cell division and therefore it will be important to determine in future studies whether this association between changes in BMAT and changes in red blood cell count are independent of estrogen (32). An additional limitation is that we did not have data on specific WBC populations (lymphocytes and neutrophil counts) and prior human studies have demonstrated differential findings with respect to the association between BMD and specific WBC populations (5). Furthermore, the univariate associations we observed in this study are prone to confounding, including potential confounding by inflammatory cytokines. Inflammatory cytokines, specifically interleukin-6 (IL-6), have been shown to be associated with low hemoglobin levels in frail, elderly adults (33) and IL-6 is also a mediator of osteoclastogenesis (34), suggesting a possible link between anemia and decreased BMD. Although our population included premenopausal women, increased IL-6 levels have been reported both in women with anorexia nervosa and obese individuals (35,36) and therefore future studies will be necessary to further explore the possible association between inflammatory cytokines, BMD and blood counts in these populations.
In conclusion, in this exploratory study, we demonstrate an association between BMAT and RBC and WBC counts. Further studies will therefore be necessary to better understand the complex relationship between adipocyte, osteoblast, and hematopoietic precursors in the marrow microenvironment in order to gain insight into the function of MAT.
Acknowledgements:
We would like to thank the nurses and bionutritionists of the MGH Clinical Research Center for their expert care. The project described was supported by grants UL 1TR002541 (The Harvard Clinical and Translational Science Center, National Center for Advancing Translational Sciences), UL1 RR025758 (Harvard Clinical and Translational Science Center), 1S10RR023405 (National Center for Research Resources) and NIH grants R24 DK084970, R03 DK084970, and P30 DK040561. The content is solely the responsibility of the authors and does not necessarily represent the official views of the National Center for Research Resources or the National Institutes of Health. Authors' roles: Study design: PKF, AK, OAM. Study conduct: SP, MR, ATF, EM, PKF. Data collection/analysis: SP, MR, ATF, EM, MAB, MB, PKF. Statistical analysis: PKF and HL. Drafting manuscript: PKF. Revising manuscript content: All authors. Approving final version of manuscript: All authors. PKF takes responsibility for the integrity of the data analysis.
This work was supported in part by the following grants from the National Institutes of Health:
UL 1TR002541
UL1 RR025758
1S10RR023405
R24 DK084970
R03 DK084970
P30 DK040561
Footnotes
Disclosures: All authors state that they have no conflicts of interest.
References:
- 1.Calvi LM, Adams GB, Weibrecht KW, Weber JM, Olson DP, Knight MC, et al. Osteoblastic cells regulate the haematopoietic stem cell niche. Nature. October 23 2003;425(6960):841–6. [DOI] [PubMed] [Google Scholar]
- 2.Visnjic D, Kalajzic Z, Rowe DW, Katavic V, Lorenzo J, Aguila HL. Hematopoiesis is severely altered in mice with an induced osteoblast deficiency. Blood. May 1 2004;103(9):3258–64. [DOI] [PubMed] [Google Scholar]
- 3.van Staa TP, Leufkens HG, Cooper C. Utility of medical and drug history in fracture risk prediction among men and women. Bone. October 2002;31(4):508–14. [DOI] [PubMed] [Google Scholar]
- 4.Cesari M, Pahor M, Lauretani F, Penninx BW, Bartali B, Russo R, et al. Bone density and hemoglobin levels in older persons: results from the InCHIANTI study. Osteoporosis international : a journal established as result of cooperation between the European Foundation for Osteoporosis and the National Osteoporosis Foundation of the USA. June 2005;16(6):691–9. [DOI] [PubMed] [Google Scholar]
- 5.Valderrabano RJ, Lui LY, Lee J, Cummings SR, Orwoll ES, Hoffman AR, et al. Bone Density Loss Is Associated With Blood Cell Counts. Journal of bone and mineral research : the official journal of the American Society for Bone and Mineral Research. February 2017;32(2):212–20. [DOI] [PMC free article] [PubMed] [Google Scholar]
- 6.Shen W, Chen J, Punyanitya M, Shapses S, Heshka S, Heymsfield SB. MRI-measured bone marrow adipose tissue is inversely related to DXA-measured bone mineral in Caucasian women. Osteoporosis international : a journal established as result of cooperation between the European Foundation for Osteoporosis and the National Osteoporosis Foundation of the USA. May 2007;18(5):641–7. [DOI] [PMC free article] [PubMed] [Google Scholar]
- 7.Shen W, Scherzer R, Gantz M, Chen J, Punyanitya M, Lewis CE, et al. Relationship between MRI-measured bone marrow adipose tissue and hip and spine bone mineral density in African-American and Caucasian participants: the CARDIA study. The Journal of clinical endocrinology and metabolism. April 2012;97(4):1337–46. [DOI] [PMC free article] [PubMed] [Google Scholar]
- 8.Bredella MA, Fazeli PK, Miller KK, Misra M, Torriani M, Thomas BJ, et al. Increased bone marrow fat in anorexia nervosa. The Journal of clinical endocrinology and metabolism. June 2009;94(6):2129–36. [DOI] [PMC free article] [PubMed] [Google Scholar]
- 9.Li Z, Hardij J, Evers SS, Hutch CR, Choi SM, Shao Y, et al. G-CSF partially mediates effects of sleeve gastrectomy on the bone marrow niche. The Journal of clinical investigation. May 6 2019;130:2404–16. [DOI] [PMC free article] [PubMed] [Google Scholar]
- 10.Naveiras O, Nardi V, Wenzel PL, Hauschka PV, Fahey F, Daley GQ. Bone-marrow adipocytes as negative regulators of the haematopoietic microenvironment. Nature. July 9 2009;460(7252):259–63. [DOI] [PMC free article] [PubMed] [Google Scholar]
- 11.Bredella MA, Fazeli PK, Daley SM, Miller KK, Rosen CJ, Klibanski A, et al. Marrow fat composition in anorexia nervosa. Bone. September 2014;66:199–204. [DOI] [PMC free article] [PubMed] [Google Scholar]
- 12.Cawthorn WP, Scheller EL, Learman BS, Parlee SD, Simon BR, Mori H, et al. Bone marrow adipose tissue is an endocrine organ that contributes to increased circulating adiponectin during caloric restriction. Cell metabolism. August 5 2014;20(2):368–75. [DOI] [PMC free article] [PubMed] [Google Scholar]
- 13.Fazeli PK, Faje AT, Cross EJ, Lee H, Rosen CJ, Bouxsein ML, et al. Serum FGF-21 levels are associated with worsened radial trabecular bone microarchitecture and decreased radial bone strength in women with anorexia nervosa. Bone. August 2015;77:6–11. [DOI] [PMC free article] [PubMed] [Google Scholar]
- 14.Fazeli PK, Faje A, Bredella MA, Polineni S, Russell S, Resulaj M, et al. Changes in marrow adipose tissue with short-term changes in weight in premenopausal women with anorexia nervosa. European journal of endocrinology / European Federation of Endocrine Societies. December 1 2018. [DOI] [PMC free article] [PubMed] [Google Scholar]
- 15.Resulaj M, Polineni S, Meenaghan E, Eddy KT, Lee H, Fazeli PK. Transdermal estrogen in women with anorexia nervosa: an exploratory pilot study. JBMR Plus. 2019. Epub 12 Nov 2019. [DOI] [PMC free article] [PubMed] [Google Scholar]
- 16.Syed FA, Oursler MJ, Hefferanm TE, Peterson JM, Riggs BL, Khosla S. Effects of estrogen therapy on bone marrow adipocytes in postmenopausal osteoporotic women. Osteoporosis international : a journal established as result of cooperation between the European Foundation for Osteoporosis and the National Osteoporosis Foundation of the USA. September 2008;19(9):1323–30. [DOI] [PMC free article] [PubMed] [Google Scholar]
- 17.Ettinger B, Ensrud KE, Wallace R, Johnson KC, Cummings SR, Yankov V, et al. Effects of ultralow-dose transdermal estradiol on bone mineral density: a randomized clinical trial. Obstetrics and gynecology. September 2004;104(3):443–51. [DOI] [PubMed] [Google Scholar]
- 18.Schorr M, Fazeli PK, Bachmann KN, Faje AT, Meenaghan E, Kimball A, et al. Differences in trabecular plate and rod structure in premenopausal women across the weight spectrum. The Journal of clinical endocrinology and metabolism. June 20 2019. [DOI] [PMC free article] [PubMed] [Google Scholar]
- 19.American Psychiatric Association. Diagnostic and statistical manual of mental disorders (DSM-5). 2013;5th edition:Washington, DC. [Google Scholar]
- 20.Johnson J, Dawson-Hughes B. Precision and stability of dual-energy X-ray absorptiometry measurements. Calcified tissue international. September 1991;49(3):174–8. Epub 1991/09/01. [DOI] [PubMed] [Google Scholar]
- 21.Boutroy S, Bouxsein ML, Munoz F, Delmas PD. In vivo assessment of trabecular bone microarchitecture by high-resolution peripheral quantitative computed tomography. The Journal of clinical endocrinology and metabolism. December 2005;90(12):6508–15. [DOI] [PubMed] [Google Scholar]
- 22.Pistoia W, van Rietbergen B, Lochmuller EM, Lill CA, Eckstein F, Ruegsegger P. Estimation of distal radius failure load with micro-finite element analysis models based on three-dimensional peripheral quantitative computed tomography images. Bone. June 2002;30(6):842–8. [DOI] [PubMed] [Google Scholar]
- 23.Macneil JA, Boyd SK. Bone strength at the distal radius can be estimated from high-resolution peripheral quantitative computed tomography and the finite element method. Bone. June 2008;42(6):1203–13. [DOI] [PubMed] [Google Scholar]
- 24.Mueller TL, Christen D, Sandercott S, Boyd SK, van Rietbergen B, Eckstein F, et al. Computational finite element bone mechanics accurately predicts mechanical competence in the human radius of an elderly population. Bone. June 1 2011;48(6):1232–8. [DOI] [PubMed] [Google Scholar]
- 25.Fazeli PK, Bredella MA, Freedman L, Thomas BJ, Breggia A, Meenaghan E, et al. Marrow fat and preadipocyte factor-1 levels decrease with recovery in women with anorexia nervosa. Journal of bone and mineral research : the official journal of the American Society for Bone and Mineral Research. September 2012;27(9):1864–71. [DOI] [PMC free article] [PubMed] [Google Scholar]
- 26.Miller KK, Grinspoon SK, Ciampa J, Hier J, Herzog D, Klibanski A. Medical findings in outpatients with anorexia nervosa. Archives of internal medicine. March 14 2005;165(5):561–6. [DOI] [PubMed] [Google Scholar]
- 27.Schellinger D, Lin CS, Hatipoglu HG, Fertikh D. Potential value of vertebral proton MR spectroscopy in determining bone weakness. AJNR American journal of neuroradiology. September 2001;22(8):1620–7. [PMC free article] [PubMed] [Google Scholar]
- 28.Singhal V, Tulsiani S, Campoverde KJ, Mitchell DM, Slattery M, Schorr M, et al. Impaired bone strength estimates at the distal tibia and its determinants in adolescents with anorexia nervosa. Bone. January 2018;106:61–8. [DOI] [PMC free article] [PubMed] [Google Scholar]
- 29.Laudisio A, Marzetti E, Pagano F, Bernabei R, Zuccala G. Haemoglobin levels are associated with bone mineral density in the elderly: a population-based study. Clinical rheumatology. February 2009;28(2):145–51. [DOI] [PubMed] [Google Scholar]
- 30.Valderrabano RJ, Lee J, Lui LY, Hoffman AR, Cummings SR, Orwoll ES, et al. Older Men With Anemia Have Increased Fracture Risk Independent of Bone Mineral Density. The Journal of clinical endocrinology and metabolism. July 1 2017;102(7):2199–206. [DOI] [PMC free article] [PubMed] [Google Scholar]
- 31.Bredella MA, Torriani M, Ghomi RH, Thomas BJ, Brick DJ, Gerweck AV, et al. Vertebral bone marrow fat is positively associated with visceral fat and inversely associated with IGF-1 in obese women. Obesity (Silver Spring). January 2011;19(1):49–53. [DOI] [PMC free article] [PubMed] [Google Scholar]
- 32.Nakada D, Oguro H, Levi BP, Ryan N, Kitano A, Saitoh Y, et al. Oestrogen increases haematopoietic stem-cell self-renewal in females and during pregnancy. Nature. January 23 2014;505(7484):555–8. [DOI] [PMC free article] [PubMed] [Google Scholar]
- 33.Leng S, Chaves P, Koenig K, Walston J. Serum interleukin-6 and hemoglobin as physiological correlates in the geriatric syndrome of frailty: a pilot study. Journal of the American Geriatrics Society. July 2002;50(7):1268–71. [DOI] [PubMed] [Google Scholar]
- 34.Jilka RL, Hangoc G, Girasole G, Passeri G, Williams DC, Abrams JS, et al. Increased osteoclast development after estrogen loss: mediation by interleukin-6. Science. July 3 1992;257(5066):88–91. [DOI] [PubMed] [Google Scholar]
- 35.Solmi M, Veronese N, Favaro A, Santonastaso P, Manzato E, Sergi G, et al. Inflammatory cytokines and anorexia nervosa: A meta-analysis of cross-sectional and longitudinal studies. Psychoneuroendocrinology. January 2015;51:237–52. [DOI] [PubMed] [Google Scholar]
- 36.Kern PA, Ranganathan S, Li C, Wood L, Ranganathan G. Adipose tissue tumor necrosis factor and interleukin-6 expression in human obesity and insulin resistance. American journal of physiology Endocrinology and metabolism. May 2001;280(5):E745–51. [DOI] [PubMed] [Google Scholar]