

Abstract
Clinical anxiety and depression are the most prevalent mental illnesses, and likely represent maladaptive expressions of the negative valence systems concerned with conditioned responses to fear, threat, loss and frustrative nonreward. These conditions have long been known to exhibit similar and striking sex/gender-related differences in their patterns of onset, incidence and severity for which the neural correlates have not yet been established. In a large sample of neurotypical young adults, we demonstrate that high-dimension metrics of intrinsic brain dynamism derived from two sex-sensitive models of whole-brain network function are significantly associated with behavioral measures associated with negative and positive valence systems. Surprisingly, we found that greater intrinsic brain dynamism is strongly positively correlated to anxiety and depression traits in males, but almost wholly decoupled from traits for important cognitive control and reappraisal strategies toward stimuli with positive valence, in particular drive, novelty-seeking and self-control. Conversely, we found that intrinsic brain dynamism was strongly positively coupled to drive, novelty-seeking and self-control in females, but exhibited only rare or non-significant directional negative correlations with traits for anxiety and depression. Our results suggest that the dynamic neural correlates of normal traits and behaviors related to negative and positive valence systems and propensity for clinical anxiety and depression are significantly different in males/men and females/women. These findings may relate to the known sex/gender-related differences in cognitive reappraisal of emotional experiences and clinical presentations of anxiety and depression, with potential relevance to the gold standard therapies for these conditions that are based on enhancing cognitive control strategies.
Keywords: Sex/gender, brain networks, dynamism, anxiety, depression, positive valence, negative valence
1. Introduction
Clinical anxiety and depression are the most prevalent mental illnesses in the general population. One of the most well-established findings in psychiatric epidemiology is that disorders of anxiety and depression exhibit similar and striking sex/gender differences in their patterns of onset, incidence and severity. Both emerge during peri-adolescence to peak in young adulthood, where they affect nearly 1 in 5 adults (Kessler, Berglund, et al., 2005; Kessler, Chiu, Demler, Merikangas, & Walters, 2005). Importantly, females/women average twice the lifetime rates of anxiety disorders and depression across cultures (Gater et al., 1998; Kessler, Berglund, et al., 2005; Weissman et al., 1996). Moreover, the illness course experienced by females/women is different: clinical anxiety onsets earlier in adolescent females/women (Twenge & Nolen-Hoeksema, 2002) with both anxiety and depression showing increasing trajectories over time in females/women versus (vs) males/men (Hankin, 2009). A further well-established finding is that clinical anxiety and depression are often co-morbid (Kessler, Chiu, et al., 2005), though it is not yet definitively known why this is the case. Candidate hypotheses include the presence of similar biological mechanisms (Magalhaes et al., 2010), predisposing risk factors and/or psycho-social triggers such as stress and trauma. Prior epidemiological work indicates that females/women also suffer higher rates of co-occurring clinical anxiety and depression, subclinical anxiety and depression and greater illness burdens (McLean, Asnaani, Litz, & Hofmann, 2011; Schuch, Roest, Nolen, Penninx, & de Jonge, 2014).
Disorders of anxiety and depression are diagnosed when experiential states or behaviors such as anxiety/worry, sadness/low mood, fatigue, sleep and concentration disturbances that are normal human functional responses become disordered to a degree that causes distress and impairs adaptive function. For example, temporary worry or fear is an expected and common life experience related to threat response and only becomes a clinical concern under current diagnostic schema when it is unresolvable, persistent and/or functionally disabling. Given this likely continuum between normal anxiety and low mood and clinical symptoms, there is substantial research interest in investigating dimensional constructs related to anxiety and depression (as well as other mental health disorders) as opposed to conceptualizing psychiatric conditions as binary categories of illness or health. This is particularly intuitive with the everyday experiences of worry and low mood, and a broad array of psychometric assessment instruments have been developed to generate dimensional measures related to individual traits, symptoms and behaviors associated with anxiety and depression. Notably, even when these dimensional traits are considered, a sex/gender-related bias is often present. For example, females/women have scored higher than men on psychometric scales of trait anxiety (Nakazato & Shimonaka, 1989). Thus, the extant evidence suggests that sex/gender-related differences exist in behaviors related to anxiety and depression across spectra ranging from dimensional traits to full-blown clinical symptomatology.
From a neurobiological perspective, recent research has explored dimensional relationships that may characterize continuous spectra of normal behaviors and clinical symptomatology. Perhaps the most widely-used construct is the research domain criteria project (RDoC) sponsored by the National Institute of Mental Health. This has advanced a dimensional framework through which to approach biological and behavioral functions on continua from normal to abnormal (Health, 2011; Insel et al., 2010) responses. In the case of anxiety and depression, these are associated with negative valence systems, a complementary set of constructs to positive valence systems. Valence (or emotional valence) is a psychological construct referring to the experienced attractiveness or aversiveness of an environmental stimulus. Negative valence systems are concerned with concepts such as fear, threat, loss and frustrative nonreward. Within this framework, anxiety is seen as a normal behavioral response to an ambiguous or lower probability potential threat or harm (qualitatively differing from the fear response to a high imminence threat) which can become maladaptively upregulated and lead to avoidance behaviors and clinical anxiety. Clinical depression is posited to be a maladaptive, sustained or enhanced response to the negative valence of social or non-social loss in contrast to normal grief, low mood, sadness or (in children) boredom or irritability. Concomitantly, a set of positive valence constructs has also been defined as a framework through which to understand biological and behavioral responses to attractive or rewarding stimuli: Reward responsiveness, reward learning and reward valuation. Positive valence systems therefore have an intimate relationship with executive function and cognitive control, which modulate emotional and cognitive processes to further goal-directed behavior. Cognitive control likely also meaningfully modulates negative valence systems, for example by fostering procrastination and maladaptive self-regulation which are well-associated with depression and self-criticism (Rabin, Fogel, & Nutter-Upham, 2011; Shalev, 2018). The neurobiological correlates of emotional valence have long been of substantial research interest and there is an extensive literature exploring various aspects of these systems (see for example the excellent review by Tye (Tye, 2018)). Sex/gender-related differences in emotional valence processing have also attracted much interest with results in multiple neurobiological systems suggesting overall that females/women may exhibit increased reactivity to stimuli with negative valence, and males/men increased activation to stimuli with positive valence (see for example: (Blanch, Lucas, Balada, Blanco, & Aluja, 2018; Gomez, von Gunten, & Danuser, 2016; Spalek et al., 2015). Less extant work has examined sex/gender-related differences in valence processing as they relate specifically to RDoC-type continua with clinical symptoms. While this is an area of active ongoing research, recent studies have demonstrated that sex/gender-related differences do appear to exist across a dimensional continuum in positive and negative valence systems. For example, Mareckova et al identified “sex-dependent deficits in response to negative affective stimuli increasing as mood became more dysphoric” (Mareckova et al., 2016).
Sex/gender-related differences in brain function per se have been widely reported, though much of the historical research base has been concerned with cognitive processes (Gur & Gur, 2017). Many important questions remain as to how these differences are associated with the prominent sex/gender-related epidemiological phenomena observed in anxiety and depression traits and clinical symptoms and more broadly the positive and negative valence systems. Understanding such relationships may not only elucidate and differentiate the neurobiological bases of the spectrum of anxiety and depression/low mood behaviors and clinical symptoms, but also help disambiguate the complex roles played by psycho-social, cultural and developmental factors and relative risk among sub-groups of people and individuals. For example, with respect to clinical depression some studies have shown that divorced or separated males/men are actually at higher risk than females/women (Weissman et al., 1996) or observed that sex/gender-related differences in symptoms passing clinical thresholds may only onset in adolescence (Nolen-Hoeksema & Girgus, 1994). Biology and environment likely interact in complex ways. For example, it has been proposed that sex hormonal fluctuations may influence the observed sex/gender-related differences in anxiety by downregulating biological systems that regulate stress and/or promoting the ‘overconsolidation’ of traumatic memories during development to modulate symptom severity and/or treatment responsiveness in adulthood (S. H. Li & Graham, 2017). From a neurobiological perspective, Hidalgo-Lopez et al recently demonstrated that functional connectivity in the resting-state was influenced by menstrual cycle phase, in particular in subcortical regions (Hidalgo-Lopez et al., 2020).
Our work to date has focused on establishing whether baseline sex/gender-related differences exist in human functional neural networks and the patterns of activation between them, also called functional network connectivity. In a large sample of neurotypical young adults, we previously demonstrated that a mosaic of sex-related differences exists in the majority of functional (intrinsic) neural networks observed using resting (task-free) functional MRI (rsfMRI), with both female > male and male > female effects (many of moderate or large size) present, in total affecting some 0.2% of brain locations. These results comported with work by others in similar age groups (Allen et al., 2011; Jiang et al., 2019) and younger subjects (Satterthwaite et al., 2015). There have also been studies suggesting that sex-related differences may not be present in brain function, though these are fewer in number and tend to focus on within-network connectivity rather than functional network connectivity (see for example: (Weissman-Fogel, Moayedi, Taylor, Pope, & Davis, 2010)). We further identified that sex-related differences were particularly prevalent in task-positive control networks and pervasive in default-mode networks, paralleling earlier work by others in lower-order models (Biswal et al., 2010; Zuo et al., 2010). These networks are associated with executive function and cognitive control during task performance (Smith et al., 2009) and the control of brain state transitions i.e. task-initiation, maintenance, termination and state-switching (Dosenbach et al., 2007; Dosenbach et al., 2006).
Accordingly, an intuitive hypothesis was that concomitant sex-related differences would be present in dynamic (time-varying) functional connectivity and higher-order metrics of intrinsic brain dynamism. Dynamic connectivity techniques have attracted much recent interest given their ability to elucidate the temporal structure of relationships between intrinsic neural networks and analyze time-varying, transient brain states through which subjects transition over time (Calhoun, Miller, Pearlson, & Adali, 2014; Preti, Bolton, & Van De Ville, 2017). A leading approach employs a windowing and clustering strategy to estimate multiple, separable connectivity patterns within the functional neuroimaging data (Damaraju et al., 2014). Prior work had also shown that individual variance in dynamic state transitions is associated with executive and cognitive control and mental flexibility (Nomi et al., 2017; Yang, Craddock, Margulies, Yan, & Milham, 2014) and that males experience a significantly larger number of distinct neural state combinations than females (Yaesoubi, Miller, & Calhoun, 2015). Concomitantly, we and other groups have developed a range of metrics that quantify inter-individual and group differences in brain dynamism, embodying concepts of fluidity, range and transitions within computational subspaces that may be derived to represent how subjects move between the brain states identified via windowing and clustering (Miller et al., 2016). A number of studies (Jia, Hu, & Deshpande, 2014; Nomi et al., 2017; Yang et al., 2014) suggested that there may be relationships between brain functional dynamism and cognitive abilities in humans. Building on these insights, we recently demonstrated that many sex/gender-related differences indeed exist in whole-brain dynamic functional connectivity and these higher-order metrics of intrinsic brain dynamism and their relationship to cognition in young adults.
This work demonstrated that females exhibit lower brain dynamism than males, which may provide a ‘stickier’ neural substrate that we showed was significantly correlated with slower response inhibition, a cognitive control function. In contrast, males exhibited greater dynamic fluidity, changed between certain dynamic neural states more often and ranged over a larger dynamic state space, with these metrics being significantly correlated with superior performance in spatial tasks (de Lacy, McCauley, Kutz, & Calhoun, 2019b). A different group subsequently used a whole brain analysis similarly estimated with group independent component analysis within a time-varying graphical LASSO framework to confirm similar sex/gender-related differences in dynamic connectivity in different large youth cohorts, though they did not examine higher-order measures of intrinsic brain dynamism (Cai et al., 2020).
Taken together, this recent evidence base indicates that significant sex/gender-related differences exist in neural networks and brain dynamism in the crucial teenage to young adult age range corresponding to the peak incidence of clinical anxiety and depression, that dynamism is greater in males than females, and that brain dynamism is associated with cognitive and executive control networks and regions in the human brain that modulate individual traits of positive and negative valence systems. However, notwithstanding their wide prevalence and illness burden, there have been limited attempts to relate sex/gender-sensitive models of whole-brain dynamic function to traits for anxiety and depression and the positive and negative valence systems, though interest in these relationships is growing. In a small sample (80) of patients diagnosed with generalized anxiety disorder (GAD), most of whom were on medications, Cui et al used a voxel-based (rather than network-based) sliding-window approach to demonstrate abnormal dynamic connections in patients with GAD in the hippocampus, postcentral gyrus and medial prefrontal cortex, a core region of the default mode network (Cui, Chen, et al., 2019). They also showed increased dynamic amplitude of low-frequency fluctuations in GAD in fronto-temporo-parietal areas involved in executive and emotional function (Cui, Sheng, et al., 2019). Sex was included as a covariate but not explicitly analyzed. In a very large (10,343) sample of neurotypical individuals from the UK Biobank, Maglanoc et al (Maglanoc et al., 2019) used a node- and phase-based (rather than network-based) approach to generate dynamic functional connectivity data in a 21-component model to successfully predict age, sex/gender, educational attainment and fluid intelligence using a linear regression model. However, they failed to predict symptom load for depression and anxiety, which were albeit measured using the simple clinical screening tools of the 9-item patient health questionnaire (PHQ-9) and 7-item GAD questionnaire, respectively. Kaiser et al (Kaiser et al., 2016) examined dynamic functional connectivity in a 100 subjects with Major Depressive Disorder with a similar-size control group in an areal-based analysis. This study demonstrated reduced (less variable) dynamic connectivity between medial prefrontal and parahippocampal regions of the default network but increased (more variable) dynamic connectivity between the former region and insula. Again, sex/gender differences were not explicitly evaluated in this work.
The morbidity associated with clinical anxiety and depression continues to grow: depression alone is projected by the World Health Organization to become the leading global burden of disease by 2030 (Mathers & Loncar, 2006). The question of whether we can usefully identify functional neural correlates to the epidemiologically-observed sex/gender differences in anxiety and depression are important neurobiological as well as population health questions. Thus, we asked whether sex/gender-related differences in brain dynamism could also be related to dimensional constructs related to anxiety and depression. Specifically, whether established high-order metrics generated from sex-sensitive models of intrinsic brain dynamism are significantly associated with a range of well-validated measures of traits for anxiety, mood, positive and negative valence systems. Given the extant body of research reviewed above, we hypothesized that increasing dynamism would be significantly negatively correlated with traits for anxiety and propensity for depressed mood and that this negative correlation would be stronger in males than females. We further hypothesized that increasing brain dynamism would be positively correlated with measures of positive valence systems and negatively correlated with measures of negative valence systems with these effects again being stronger in males than females.
To address these questions, we analyzed sex-related differences in intrinsic brain dynamism metrics using two whole-brain functional parcellations estimated using group spatial independent component analysis (gsICA) in a large sample of neurotypical young adults matched for age, sex and head motion statistics. We computed 5 metrics of intrinsic brain dynamism in 24- and 51-network parcellations after regressing out the effect of age, intelligence quotient and head motion, and tested their relationships with continuous measures of traits for anxiety, mood states and positive and negative valence systems. To ensure robust comparisons, we selected dimensional behavioral measures derived from well-established psychometric instruments exhibiting the property that some individual variables showed significant sex-related differences while others did not and included measures from a psychometric assessment of personality traits.
Of note, much extant research into sex/gender-related differences in anxiety and mood does not specify whether sex vs gender is being examined or report the menstrual cycle status of participants. Many large epidemiologic studies are now more than 20 years old. Similarly, many studies of sex/gender-related differences in brain function do not specify whether sex and/or gender is specifically under consideration or compare these. Accordingly, we have used the terms sex/gender, females/women and males/men in our commentary. In referring to our own analyses, we have used the terms ‘sex’, ‘male’ and ‘female’ to conform to the nomenclature used by the originators of the data. It should also be noted that considerable variation exists between individuals and differences likely exist on spectra incorporating a range of sex/gender concepts. Further, we note that menstrual cycle status was not available for participants in the present study.
2. Materials and methods
Methods and materials used in this study are summarized below where similar our previously published work (de Lacy et al., 2019b) and described in detail otherwise. See also Figure 1 for a graphical outline of our computational pipeline. In summary, after pre-processing MRI data with SPM12, an age-, sex- and motion-matched sample of 534 subjects was constructed and 24- and 51-network whole brain functional parcellations estimated with gs ICA using the GIFT software libraries (http://trendscenter.org/software/gift). Dynamic connectivity analysis was then performed using ICA timecourses to examine sex-related differences in 5 metrics of brain dynamism: native space state-switching in brain connectivity states derived using k-means clustering within a sliding window method and four metrics of higher-dimension ‘meta-state’ dynamism computed using prototype connectivity patterns generated with the tICA algorithm. Correlations between these metrics and variables taken from a range of anxiety, mood and temperament psychometric batteries.
Figure 1: Computational Pipeline.
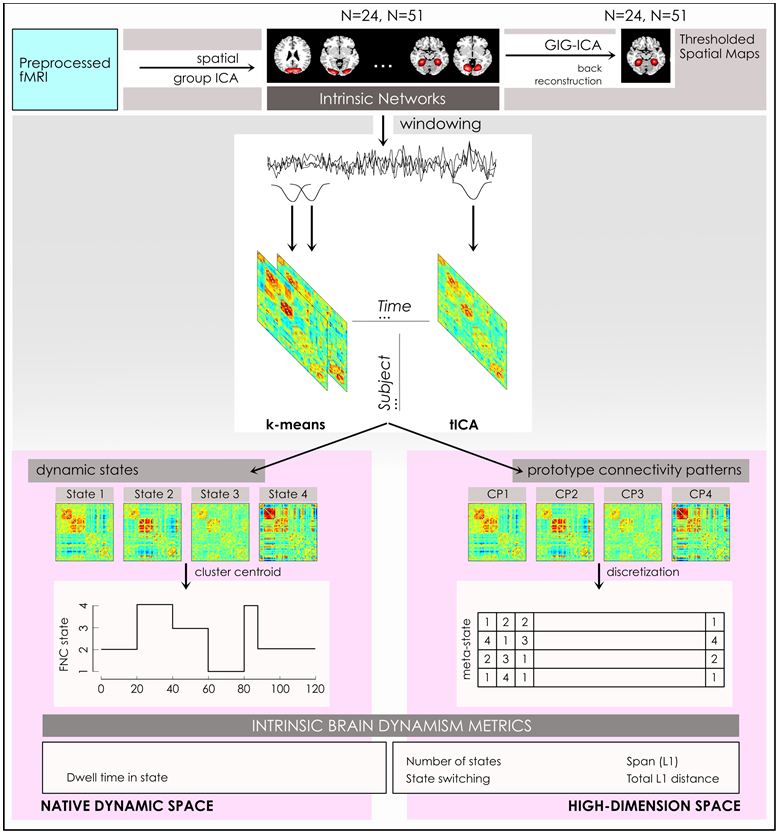
A schematic of our computational pipeline illustrates steps in the preparation of the outcome dynamism metrics. Preprocessed functional MRI scans were submitted to spatial group independent component analysis to estimate 24- and 51-network models of intrinsic networks, from which thresholded spatial maps of intrinsic networks (INs) are prepared via back-reconstruction using the GIG-ICA algorithm. We applied a sliding window approach to IN timecourses to formed windowed connectivity matrices that were clustered using the k-means algorithm to estimate 4 brain states, on which dwell time in individual states was computed in this native state space. Similarly, windowed connectivity matrices were clustered using the tICA algorithm to identify prototype connectivity patterns that were discretized to form the basis for 4 measures of dynamism computed in a high-dimension meta-state space.
2.1. Data
This study uses data from the Brain Genomics Superstruct project, collected from >3,000 young adults in the Boston community (https://www.neuroinfo.org/gsp). From this larger initiative, the originators released a repository comprising demographic, MRI and behavioral data for 1570 neurotypical adults ages 18-35. Extensive quality control was performed on the MRI scans prior to selecting datasets for release and 142 participants were excluded on this basis (Holmes et al., 2015). Age was specified within 2-year bins. For example, the 19 year-old bin includes subjects aged 18 and 19 at the time of scanning. Our study uses data from subjects in the publicly-released sample, where the “dispersion of estimated IQ scores [was] positively shifted relative to the general population” but personality traits “have distributions that would be expected of a clinically-screen population-based sample” (Holmes et al., 2015). Of note, IQ scores were derived from Shipley-Hartford Age-Corrected T scores. The present study was deemed not human subjects research by the University of Washington Institutional Review Board.
2.2. Description of psychometric batteries
Well-established, widely-used and validated psychometric batteries were selected for this study to provide a range of measures of mood states, anxiety and temperament. The profile of mood states (POMS) is a commonly-used psychometric instrument to measure self-reported distinct mood states. Questions are loaded onto seven scales to measure ‘anger/hostility’, ‘confusion/bewilderment’, ‘depression/dejection’, ‘fatigue/inertia’, ‘tension/anxiety’, ‘vigor/activity’ and a composite measure of total mood disturbance (McNair, 1971). The state-trait anxiety inventory (STAI) is an established inventory of state and trait anxiety with excellent internal consistency and good test-retest reliability (Spielberger, 1983). ‘State’ anxiety is a term commonly used to refer to transient physiologic and emotional anxiety-related reactivity to specific situations whereas ‘trait’ anxiety is related to an individual’s long-term or underlying propensity to experience anxiety regardless of the actual threat posed. This distinction has been validated (Gaudry, Vagg, & Spielberger, 1975). The POMS and STAI show good concordance (Spielberger CD, 1970). The temperament and character inventory (TCI) is an inventory of temperamental traits including ‘novelty-seeking’, ‘harm avoidance’ and ‘reward dependence’ (Cloninger, 1994). The behavioral inhibition and behavioral activation scale (BIS/BAS) assesses levels of behavioral arousal and self-regulation of arousal along dimensions of ‘drive’, ‘fun-seeking’, ‘reward responsiveness’ and ‘behavioral inhibition’ (Carver, 1994). The popular NEO personality inventory (NEO) is based on a widely-used five-factor model of personality and provides scores for dimensions of ‘neuroticism’, ‘extraversion’, ‘openness to experience’, ‘agreeableness’ and ‘conscientiousness’. The Barratt impulsiveness scale (BIS/BAS) is a widely-used measure of impulsiveness (Patton, Stanford, & Barratt, 1995) with high internal consistency that yield six first-order factors (attention, motor, self-control, cognitive complexity, perseverance and cognitive instability) and three second-order factors (attentional, motor and non-planning impulsiveness).
2.3. Primary behavioral outcome measures of anxiety and depression
The STAI measures of state (STAI_sAnxiety) and trait (STAI_tAnxiety) were selected as primary outcome measures for anxiety, with the POMS tension/anxiety (POMS_TensionAnxiety) subscale used as a secondary anxiety measure. In depression, the POMS measure of depression/dejection (POMS_DepressionDejection) was selected as the primary outcome measure with POMS subscale scores for activity level (POMS_VigorActivity), fatigue (POMS_FatigueInertia) and total mood disturbance (POMS_TotMdDisturb) as secondary measures. The subscale score of neuroticism (NEO_N) is a composite measure of interest since it contains information about anxiety and depression, though it is also loaded for dimensional scores of anger, impulsiveness and vulnerability to stress.
2.4. Subject sample construction
The 534-subject sample for this study was constructed by selecting right-handed subjects with estimated IQ scores available, and then sex-matching and matching for head motion (using the root mean square difference of volume N to volume N+1, also known as DVARS (Christodoulou et al., 2013; Power et al., 2014) within age bins. After our matching process, we determined that there was no significant difference in either the DVARS statistic or absolute displacement (in millimeters) between males and females. There was a significant difference (2-sample t-test, p<0.05) in IQ-level between males and females, with males having slightly higher mean IQ than females. In addition, there were significant differences in scores (2-sample t-test, p<0.05) in certain measures of anxiety, depression and temperament assessments. Subject demographics and statistics related to head motion and behavioral measures may be viewed in Figure 2 and a list of subjects with their original study ID codes inspected in Supplementary Figure 1.
Figure 2: Subject demographics and scores from psychometric batteries.

Demographic characteristics for males and females in the 534-subject study sample. Where a significant difference was observed (2-sample t-test, p<0.05) between males and females the statistical significance level is also displayed. Group averages, standard deviation and t-test results for scores for psychometric mood, anxiety and temperament batteries is displayed. Empty cells indicate insignificant results (p>0.05). Expanded definitions of the labels for each measure may be found in Supplementary Table 5, which is a key prepared by the Brain Genome Superstruct project.
2.5. MRI pre-processing
MRI scans were collected using matched 3T TIM Trio systems at Harvard University and Massachusetts General Hospital using vendor-supplied 12-channel head coils, on 5 different scanners.124 volumes (6.12 minutes) of functional MRI were acquired with 47 slices, interleaved sequence, voxel size 3.0 x 3.0 x 3.0mm and TR=3000 milliseconds, with subjects instructed to keep their eyes open. Full details of parameters may be viewed at the Brain Genomics Superstruct website (https://static1.squarespace.com/static/5b58b6da7106992fb15f7d50/t/5b68650d8a922db3bb807a90/1533568270847/GSP_README_140630.pdf). As recommended by the originators of the data, the first 4 volumes of each scan were removed to account for scanner equilibration effects, with 120 timepoints remaining. Subsequently, we slice-time corrected remaining volumes to the middle volume, realigned to the first volume, coregistered and normalized to the functional template, and resliced and smoothed at 6mm full width half maximum using standard algorithms in SPM12. After processing, data were submitted to quality control to assess the quality of the normalization and degree of subject motion by computing 1) spatial regression between each normalized functional image and a group mask constructed from all subjects and 2) DVARS. All subjects had >85% correspondence between their normalized image and the group mask with one exception. Normalization for this subject proved uncorrectable and this participant was eliminated from further consideration.
2.6. Group Spatial Independent Component Analysis
2.6.1. Estimation of Functional Parcellations with Group Spatial Independent Component Analysis
Group spatial ICA was performed on the pre-processed data using the Group ICA of fMRI Toolbox (GIFT) developed in our group, and widely used in ICA of fMRI (Calhoun & Adali, 2012; Calhoun, Adali, Pearlson, & Pekar, 2001). We performed two ICA decompositions to test the sensitivity of results to model parameters and provide an increasingly detailed view of brain networks. Resting-state scans were first pre-whitened followed by a subject-specific data reduction principal components analysis retaining 50 and 110 principle components (PCs) respectively, with the objective of stabilizing back reconstruction and retaining maximum variance at the individual level. Group ICA decompositions were then performed with 40 and 100 components respectively using the Infomax algorithm run 10 times with random initialization using ICASSO (Himberg, Hyvarinen, & Esposito, 2004; Y. O. Li, Adali, & Calhoun, 2007). Aggregate spatial maps were estimated as the centrotypes of component clusters to reduce sensitivity to initial algorithm parameters. Single-subject images were concatenated in time to perform the single group ICA estimation and subject specific spatial maps estimated using back reconstruction (Erhardt et al., 2011) with the group information guided ICA (GIG-ICA) algorithm (Du et al., 2016), an approach which we have shown well-captures individual subject variability (Allen, Erhardt, Wei, Eichele, & Calhoun, 2012). GIG-ICA estimates single-subject images and timecourses from the single group ICA estimation, thereby allowing individual variation in spatial maps constructed from each component (see below). The resulting independent components were scaled by converting each subject component image and the time course to z-scores.
2.6.2. Sorting Components from the Group Spatial ICA
For each of the ICA decompositions or model orders, we sorted components into gray-matter networks versus (vs) artifactual noise components with a combination of expert visual inspection by NdL and VDC, and quantitative metrics. For each component, we computed the quantitative spectral metrics of 1) Fractional amplitude of low frequency fluctuations and 2) Dynamic range (Allen et al., 2011). The former is the ratio of the integral of spectral power below 0.10 Hz to the integral of power between 0.15 and 0.25 Hz. Dynamic range is the difference between the peak power and minimum power at frequencies to the right of the peak. Generally, components representing gray matter have higher values in these metrics, while artefactual components (such as signals accruing from cerebrospinal fluid, vascular pulsations, white matter or head motion) have lower values, though there are currently no absolute cut-off points for inclusion or exclusion. Components were inspected by NdL and VDC and those with poor overlap with cerebral gray matter or low spectral metrics were discarded. We retained 24 components from the 40-component and 51 from the 100-component ICA, each considered a set of functional intrinsic brain networks (INs).
2.6.3. Construction of Intrinsic Functional Network Spatial Maps
We constructed a spatial map for each IN retained after the sorting process by selecting voxels that represented the strongest and most consistent coactivations, by performing a voxelwise one-sample t-test on the individual subject timecourses and thresholding individual voxels at (mean + 4 standard deviations), again following an established pipeline (Allen et al., 2011) using GIFT. Thus, these spatial maps represent the brain regions most associated with each component’s timecourse, instantiated in thresholded brain maps. This procedure enabled us to construct a group spatial map for each of the INs assembled from the relevant individual subject timecourses, in each of the model orders. These spatial maps were used to attribute the neurocognitive labels for each IN, and served as the inputs for the sFNC analysis to construct the sFNC matrices. Three-dimensional renderings of the resulting 3 sets of intrinsic networks may be inspected in Neurovault at https://neurovault.org/collections/4031/ (24-network model) and https://neurovault.org/collections/4032/ (51-network model). Each intrinsic network is labelled with its attributed neurocognitive function and number, corresponding to Figure 3.
Figure 3: Intrinsic networks grouped by neurocognitive function for the 24-network model.

Two-dimensional group spatial maps are displayed for a representative slice,for the 24-network model of intrinsic networks grouped by neurocognitive function. Spatial maps are created by thresholding gray-matter components from the group ICA at (mean + 4 standard deviations). Neurocognitive attributions were made using three methods described in the section Functional Intrinsic Network Attribution and Grouping. Readers may explore 3-dimensional maps of each network in Neurovault at https://neurovault.org/collections/4031/ (24-network model) and https://neurovault.org/collections/4032/ (51-network model), where networks are labelled with numbers and neurocognitive attributions.
2.6.4. Functional Intrinsic Network Attribution and Grouping
The primary neurocognitive function of each IN spatial map was attributed by visual inspection and quantitative comparisons using three methods. Firstly, we determined the coordinates in Montreal Neurologic Space (MNI) associated with peak intensities for each IN in each of the 3 sets of maps. The top 3 co-ordinates were compared with the literature. We found multiple literature-based confirmatory sources that gave specific Talairach or MNI coordinates and associated these with network labels for all networks in the task-positive network group, the DMN and primary sensorimotor and visual networks, (Dosenbach et al., 2007; Dosenbach et al., 2006; Fox et al., 2005; Laird et al., 2011; Seeley et al., 2007; Smith et al., 2009; Spreng, Sepulcre, Turner, Stevens, & Schacter, 2013; Vernet, Quentin, Chanes, Mitsumasu, & Valero-Cabre, 2014) but not for INs in the subcortical or speech/language groups. Secondly, the top 5 spatial locations in each IN were examined using the Brodmann Interactive Atlas (http://www.fmriconsulting.com/brodmann/Interact.html). Thirdly, network correlations with reverse inference maps of regional activations associated with specific neurocognitive functions were inspected in Neurosynth (Yarkoni, Poldrack, Nichols, Van Essen, & Wager, 2011). Attributions using the third method may be explored by readers by loading a spatial map in Neurovault and accessing the ‘Cognitive Decoding’ function.
2.7. Dynamic Connectivity Analysis
2.7.1. Computation of state-switching fluidity in the native state space
To identify dynamic brain states, we used an established sliding window method (Allen et al., 2014; Sakoglu et al., 2010) to derive stable dynamic whole-brain connectivity states from fMRI ICA timecourses and applying the k-means clustering algorithm to the connectivity windows. First, subject timecourses were detrended and despiked before regressing the 6 realignment parameters and their first temporal derivatives and scanner site from the timecourses using the general linear model and assembling windowed covariance matrices with a sliding window approach slid in steps of 1 TR. Windowed covariance matrices were estimated using a graphical LASSO method (Friedman, Hastie, & Tibshirani, 2008) as detailed in Allen et al (Allen et al., 2014). For each model (24- and 51-network) the covariance matrix consists of unique network-to-network pairs (for example, 276 unique pairs in the 24-network model) x number of windows x subject sample size. The window size was empirically selected based on previous studies showing that window sizes in the range of 40-60s produce reasonable and robust results (Allen et al., 2014; Damaraju et al., 2014; de Lacy, Doherty, King, Rachakonda, & Calhoun, 2017; de Lacy et al., 2019b). The k-means algorithm with Euclidean distance function (maximum iterations=200) was applied to the wFNC to derive stable dynamic states, initializing the clustering of data from all subjects with cluster centroids. Clustering with the k-means algorithm was repeated 5 times. We computed the number of clusters in the 24-network and 51-network models using the elbow criterion and the Bayes Information Criterion (BIC), testing over a range of 0-10 possible clusters. The elbow criterion indicated a cluster number of 4 in both the 24- and 51-network models for all window sizes (15, 17 and 20TR). The BIC indicated 4 clusters for window size = 17TR in both models, 5 clusters for window size = 20TR in both models and 7 clusters in the 15TR/24-network model and 6 clusters in the 15 window/51-network model. Accordingly, a 4 cluster model with window size = 17TR was selected as the baseline case for both 24-network and 51-network models with sensitivity analyses performed using other permutations suggested by the results obtained using the BIC. Cluster membership as a function of time provides the state transition vector, indicating the state membership at a given point in time for each subject. In addition, we applied a threshold concept requiring that a given FNC covariance matrix be present in a minimum number of 10 windows for each subject included. We determined state-switching propensity in this native state space (i.e. on these stable brain states computed with k-means) by computing the number of times each subject moved between states during their individual timecourses. This may be conceptualized as a metric of brain dynamic fluidity.
2.7.2. Computation of Prototype Connectivity Patterns in Meta-State Space
To create prototype connectivity patterns (CPs) to generate higher-dimensional measures of dynamism we followed a similar method but in this case preferred the use of the tICA algorithm (Miller et al., 2016), since its decomposition produces CPs whose weights in the windowed covariance matrices are maximally temporally independent, leveraging higher order statistics. We have previously demonstrated that results using our dynamic measures (below) provided consistent results if other clustering measures such as k-means, spatial ICA and principal component analysis are used (Miller et al., 2016). We applied the tICA algorithm to the windowed covariance matrices using the city method to compute the CPs used as the analytic substrate for the remainder of the study.
2.7.3. High-dimension measures of dynamic fluidity and range in meta-state space
We computed four measures of dynamism in the higher-dimensional meta-state space using an established method (Miller, Yaesoubi, & Calhoun, 2014; Miller et al., 2016). Time-varying, additive contributions made by CPs to each observed windowed covariance matrix are discretized. A 4-dimensional weight vector was obtained representing the contribution of each CP to each matrix by regressing the functional connectivity estimate onto the tICA cluster centroid. We then replaced real-valued weights accruing from this computation by a value in ± (1, 2, 3, 4) according to the signed quartile into which each weight fell. We call the resulting discretized vectors ‘meta-states’. Four metrics dynamism were computed for these meta-states. Discretization of the CP contributions to windowed connectivity constructs a state space comprised of 84 = 32,768 possible meta-states which subjects may occupy over time. Two metrics describe the fluidity with which subjects traverse the meta-state space: the number of distinct meta-states passed through by each individual and the number of times each subject switches between meta-states. The remaining two metrics describe the high-dimension dynamic range achieved by subjects: the maximal L1 span achieved between occupied meta-states, and the total distance ‘traveled’ by an individual through the state space (sum of all L1 distances).
2.7.4. Dynamic Statistical Analysis
Sex-related differences in each brain dynamism metric between males and females were calculated using two sample t-tests at a significance level of q<0.05, corrected to control false discovery rate (FDR) and multiple comparisons where relevant. Variance associated with site, DVARS measure, age and IQ-level was removed by regression using the general linear model from the correlation values prior to performing clustering, in order that any sex-related effects would be examined in isolation. After removing the variance attributable to site, DVARS measure, age and IQ-level, we computed Pearson correlations between individual scores in the 5 secondary metrics of dynamism (state-switching in the native state space and the meta-state metrics) and individual scores in each of the anxiety, mood and temperament measures. For each correlation, we computed the correlation or r value and the significance or q value, correcting the latter for multiple comparisons by controlling for the false discovery rate (FDR) using the Benjamini-Hochberg procedure. Original study acronyms for each of the metrics obtained in individual testing in the anxiety, mood and temperament measures may be viewed in Supplementary Table 3, which is a key prepared by the Brain Genome Superstruct project team. We also computed sex-related performance differences in the anxiety, mood and temperament measures using t-tests at a significance level of p<0.05.
3. Results
3.1. Anxiety traits are broadly and significantly positively correlated with brain dynamism in males but very rarely in females, where dynamism is typically negatively correlated with anxiety
In this participant sample there was a significant (p<0.05) difference between males and females in STAI state anxiety but not STAI trait anxiety, our primary behavioral anxiety measures. In our secondary anxiety measure of POMS tension/anxiety there was also no significant group difference (Figure 2). Directionally, males reported lower anxiety than females on all behavioral measures: STAI state and trait and POMS tension/anxiety (Figure 2).
We found that the pattern of relationships between brain dynamism and these anxiety traits differed sharply in males vs females. All 5 metrics of brain dynamism were positively correlated with STAI measures of both trait and state anxiety in both 24 and 51 network baseline models in males (Supplementary Table 2). This finding was replicated in all metrics in all sensitivity analyses with the exception of native space state-switching in the 51-network 15TR model. In contrast, all dynamism metrics were consistently negatively correlated with STAI trait anxiety in females (Supplementary Table 2). This replicated in all sensitivity analysis with the exception of native space state-switching in the 24-network 15TR model. In state anxiety, the negative correlation in females was slightly less reliable. It was present in all metrics in the 51-network model, replicating in the sensitivity analyses with the exception of meta-state span in the 20TR model. In the 24-network models the direction of correlation was mixed across metrics. In the combined sample of males and females, the directional relationship between dynamism and the behavioral measures was also less clear and varied between the 24- and 51-network models (Supplementary Table 2).
In our primary outcome measure of state anxiety (STAI_sAnxiety), we again observed a significant (q<0.05, corrected) positive correlation between all 4 meta-state dynamism metrics in males in the baseline 17TR 24-network model (Figure 4) that consistently replicated in the 15TR and 20TR sensitivity analyses (Supplementary Table 3). In the 51-network model, L1 span was significantly (q<0.05, corrected) positively correlated with state anxiety in males (Figure 4) and L1 total distance narrowly missed significance at q=0.072 (corrected) in the baseline 17TR model (Supplementary Table 2). In the 51-network 15TR and 17TR sensitivity analyses, both L1 span and distance were significantly (q<0.05, corrected) positively correlated with state anxiety (Supplementary Table 4). In contrast, in females and the combined sample there was no significant correlation between STAI_sAnxiety and any measure of brain dynamism with the single exception of meta-state fluidity in the 24-network, 15 TR model in the combined sample (Supplementary Table 3).
Figure 4: Significant relationships between dynamism and dimensional assessments of anxiety and mood states.

Statistical significance level (q-value) is displayed for significant (q<0.05) correlations between each measure of functional brain dynamism and measures of dimensional assessments of anxiety and mood states in a. 24-network and b. 51-network models of brain function. All values represent significant Pearson correlations corrected for FDR. Empty cells indicate insignificant results (q>0.05). This figure shows results for the 17TR baseline cases.
In terms of our primary outcome measure of trait anxiety we found that meta-state fluidity and L1 distance were significantly (q<0.05, corrected) correlated with STAI_tAnxiety in males in the 24-network 15TR sensitivity analysis only, with state span narrowly missing significance (q=0.095, corrected) in the baseline case (Supplementary Table 3). Meta-state metrics of number of states and dynamic range were significantly (corrected) correlated with trait anxiety in females only in the 24-network 20TR sensitivity analysis and not in our baseline case (Supplementary Table 3). However, in the higher-order 51-network model, all 4 meta-state dynamism metrics were significantly (q<0.05, corrected) associated with trait anxiety in males in our baseline 17 TR model (Figure 4). This finding replicated in the 15- and 20TR sensitivity analyses (Supplementary Table 4) with the exceptions of L1 distance in the 15TR (which narrowly missed significance at q=0.056, corrected) and fluidity in the 20TR model, with number of states narrowly missing significance at q=0.060, corrected. No significant correlations between any measure of dynamism and trait anxiety was seen in females in the 51-network model, and no significant correlations between trait anxiety and any dynamism metric were observed in either 24- or 51-network models in the combined sample.
The POMS tension/anxiety subscale also provides information about anxiety traits. In this measure, we also saw a generalized positive correlation with brain dynamism in males in both whole brain models, with the exception of the L1 span in the 51-network model. In females, the relationship was less clear-cut (Supplementary Table 2). In the POMS measure, we observed a significant (q<0.05, corrected) positive correlation between both metrics of dynamic range (L1 span and distance) in the baseline 17TR 24-network model, all meta-state metrics in the 20TR sensitivity analysis and all metrics excepting L1 span in the 15TR model in males (Figure 4). There were no significant results in males in the 51-network models. In females, no significant correlation with POMS tension/anxiety was found in either 24 or 51-network models. In the combined sample, only meta-state switching achieved significance (q<0.05, corrected) in the 24-network model (Figure 4).
Of note, across all our analyses and subject groups, the native state space switching metric was never significantly correlated with any primary or secondary measure of anxiety. Only the high-dimension meta-state measures achieved significant (q<0.05, corrected) results.
3.2. Brain dynamism is significantly positively correlated with predisposition for depressed mood in males but not in females
In our subject sample, no significant group differences were detected between males and females in either our primary or secondary behavioral measures of depressive traits (Figure 2). However, we did identify different sex-related patterns of sex-related relationships between these measures and metrics of brain dynamism. In our primary outcome measure of the POMs continuous subscale of depression/dejection, we observed positive correlations with all brain dynamism metrics in males in both models (Supplementary Table 2). This consistently replicated in all sensitivity analyses. This positive correlation reached statistical significance (q<0.05, corrected) in the 24-network model in both meta-state fluidity metrics in the 15TR analysis and in the L1 span metric in the 20TR analysis (Figure 4). In the 51-network model both metrics of meta-state fluidity were again significant (q<0.05, corrected) along with L1 distance (Figure 4). This finding replicated in the 15TR model, with L1 distance replicating in the 20TR model (Supplementary Tables 3 and 4). In females, depression/dejection was negatively correlated with all the meta-state measures of dynamism in the 24-network model but positively correlated in the higher-order 51-network model (Supplementary Table 2). These observations did not reliably replicate in the sensitivity analyses, where directionality was mixed. When males and females were considered together, depression/dejection was positively correlated with dynamism in the 51-network model but directionality varied across measures in the 24-network model (Supplementary Table 2). Of note, meta-state number of states also reached statistical significance (q<0.05, corrected) in the combined sample in the high-order 51-network model (Figure 4). This latter result was not replicated in our sensitivity analyses (Supplementary Table 4).
In terms of our secondary behavioral measures of depression, no dynamism metrics reached statistical significance (q<0.05, corrected) in their correlations with activity level (POMS_VigorActivity) or fatigue (POMS_FatigueInertia) in either model in the baseline 17TR case, either in the combined or when males or females were considered separately. Scattered exceptions in activity level were significant (q<0.05, corrected) in the 20TR sensitivity analyses with native space state-switching and L1 span in the 24-network model, and L1 distance in the 51-network model in males only (Supplementary Tables 3 and 4). In fatigue, in the 15TR analysis we observed significant (q<0.05, corrected) correlations with meta-state switching in males and native space state-switching in females. Interestingly, the direction of correlation between activity level and brain dynamism was almost universally negative across both models in both sexes combined, males and females (Supplementary Table 2). The fatigue/inertia measure presented a more nuanced picture resembling that of anxiety: dynamism metrics were typically positively correlated in males and negatively correlated in females (Supplementary Table 2). In terms of comparisons with other POMS measures not specifically related to anxiety or depression (anger/hostility, confusion/bewilderment and total mood disturbance) showed no significant sex-related differences in this sample either in their scores or the directionality of their relationships with dynamism metrics.
3.3. Drive and fun/novelty-seeking traits show much stronger and broader correlations with brain dynamism in females than males
We found significant sex-related differences in the BIS/BAS subscale measures of drive, reward responsiveness and behavioral inhibition in this sample of 534 young adults, with females scoring significantly (p<0.05) higher on all of these measures than males (Figure 2). Females also scored higher than males on the remaining dimension of fun-seeking, but this did not reach statistical significance.
For drive, the direction of correlation with metrics of brain dynamism was nearly always positive among the combined sample, males and females in both models, with scattered exceptions (Table 2). In the 24-network model, none of these proved significant. However, in our high-order 51-network model, all metrics of dynamism with the exception of L1 span were statistically significant (q<0.05, corrected) in females in our baseline model (Figure 5). This result duplicated in the 15TR sensitivity analysis excepting native space state-switching, but not in the 20TR sensitivity analysis (Supplementary Table 3). In males, there was no significant (q<0.05, corrected) correlation between dynamism and drive in the baseline case (Figure 5), with a few scattered exceptions in the 15TR (native space switching) and 20TR sensitivity analysis (meta-state fluidity metrics, Supplementary Table 3). There was no significant (q<0.05, corrected) correlation between dynamism and drive in any model in the combined sample (Figure 5).
Figure 5: Significant relationships between dynamism and dimensional assessments of temperament.

Statistical significance level (q-value) is displayed for significant (q<0.05) correlations between each measure of functional brain dynamism and measures of dimensional assessments of temperament in a. 24-network and b. 51-network models of brain function. All values represent significant Pearson correlations corrected for FDR. Empty cells indicate insignificant results (q>0.05). This figure shows results for the 17TR baseline cases.
This pattern of results with respect to females was similar in the BIS/BAS fun-seeking measure. Here, correlations with all dynamism metrics were consistently positive in females in both 24- and 51-network models but typically negative in males (Supplementary Table 2). As with drive, both metrics of meta-state fluidity were significantly (q<0.05, corrected) correlated with dun-seeking in the high-order 51-network model in females only and this duplicated across the 15TR and 20TR sensitivity analyses (Figure 5, Supplementary Table 4). In addition, total L1 distance was significantly (q<0.05, corrected) correlated with dun-seeking in females and this replicated in the 15TR sensitivity analysis (Figure 5, Supplementary Table 4). There was no significant (q<0.05, corrected) correlation between any metric of dynamism and fun-seeking in males or the combined sample in any of our models with the exception of native space state-switching (Figure 5, Supplementary Table 3). The TCI novelty-seeking measure provides a useful corollary to the BAS fun-seeking subscale and results in the TCI measure validated results from the BIS/BAS. For TCI novelty-seeking, we identified significant (q<0.05, corrected) positive correlations with all metrics of dynamism in females in the 51-network model, with the exception of meta-state number of states (Figure 5). This result cleanly duplicated in the 15- and 20-TR sensitivity analyses (Supplementary Table 4). In the 24-network model, meta-state number of states was significantly (q<0.05, corrected) correlated with novelty-seeking in females in both sensitivity analyses (though not the baseline case) and meta-state switching in the 20TR analysis (Supplementary Table 4). In males, only native space switching was significant (q<0.05, corrected) in the baseline and 20TR analysis and the direction of correlation was again typically negative. In the combined sample, only meta-state number of states was significant (q<0.05, corrected) and duplicated in the 20TR analysis in both 24- and 51-network models (Figure 5, Supplementary Tables 3 and 4).
In contrast, we detected no significant (q<0.05, corrected) correlations between dynamism metrics and reward responsiveness in any group other than meta-state switching in males in the 24-network baseline 17TR model. In the conceptually similar measure of TCI reward dependence, we also did not see any significant correlations with dynamism across all models with the exception of meta state number of states and L1 span in the 24-network 20TR analysis (Supplementary Table 3) and the latter measure in the 51-network model, again in males only (Supplementary Table 4). Similarly, there were no significant (q<0.05, corrected) correlations observed between dynamism and behavioral inhibition (the BIS measure) other than the significant positive correlation with native space state-switching in males in the 24-network model which replicated in the 15TR sensitivity analysis (Supplementary Table 3). Results in the high-order 51-network model for both reward responsiveness and behavioral inhibition were universally not significant. Interestingly, the remaining temperament trait assessed by the TCI of harm avoidance showed no significant (q<0.05, corrected) correlation with brain dynamism metrics across all models and groups (Figure 5, Supplementary Tables 3 and 4)
3.4. Self-control is significantly positively correlated with brain dynamism in females but not in males
The Barratt impulsiveness subscale of self-control provides a continuous measure of the ability to exert executive control over impulses. We detected a significant (p<0.05) sex-related difference in self-control, with males scoring higher than females in this participant sample (Figure 2). Self-control was typically negatively correlated with dynamism in males and positively correlated in females across both models (Supplementary Table 2), with a handful of exceptions which were not significant (q<0.05, corrected). In our 24-network model, we did not identify any significant correlations between self-control and dynamism across all analyses and groups. However, in females in the higher-order 51-network model we detected significant (q<0.05, corrected) positive correlations between self-control and both meta-state metrics of fluidity and L1 span, which replicate in the 15- and 20TR sensitivity analyses, as well as with meta-state number of states in the 15TR analysis (Figure 5, Supplementary Table 4). Results were uniformly negative in males. In the combined sample, correlations between meta-state number of states and self-control proved significant (q<0.05, corrected), which duplicated in the 15- and 20-TR sensitivity analyses, as well as native space state-switching in the baseline case and meta-state state switching in the sensitivity analyses (Figure 5, Supplementary Table 4). A number of other measures of impulsiveness subscales from the Barratt battery showed scattered significant (q<0.05, corrected) correlations with dynamism metrics, particularly in females (Figure 5, Supplementary Tables 3 and 4). Of these the most reliably replicated was the secondary measure of motor control (Barratt_2mot). Overall, impulsiveness measures tended to show significant relationships with dynamism were positively correlated in females and negatively correlated in males.
3.5. Brain dynamism is less reliably correlated with the personality traits of agreeableness, openness to experience and neuroticism in both sexes
The NEO inventory assesses participants along the ‘Big Five” personality dimensions of neuroticism, extraversion, openness to experience, agreeableness and conscientiousness. In this study sample, we found significant (p<0.05) sex-related differences in all of these dimensional subscales with the exception of openness to experience (Figure 2). Significant relationships with brain dynamism were concentrated in the agreeableness measure with some observations in openness to experience and neuroticism that were not well-replicated across models or sensitivity analyses. Across all of our models there were few significant correlations with metrics of dynamism in either extraversion or conscientiousness.
Interestingly, we found very few significant (q<0.05, corrected) correlations across all personality measures when the combined sample was analyzed (Figure 5, Supplementary Tables 3 and 4). Rather, scattered results were present in either the male or female sub-samples considered separately with the exception of agreeableness, where we did see significant (q<0.05, corrected) relationships with meta-state switching and L1 distance in the sensitivity analyses in the 24-network model, and with number of meta-states in the 15TR analysis (Supplementary Table 3). Further, both measures of meta-state fluidity were significantly (q<0.05, corrected) correlated with agreeableness in males (baseline case) and females (15 and 20 TR analyses) when considered alone as well as L1 distance in males (baseline case) in the 24-network model (Figure 5, Supplementary Table 3). In the 51-network model L1 span was significantly (q<0.05, corrected) correlated with agreeableness in the baseline case in females (Figure 5) as well both measures of meta-state fluidity and total L1 distance in the 15TR model (Supplementary Table 4). In the higher-order model there were no significant correlations with agreeableness in either males or the combined sample in any model (Supplementary Table 4).
In neuroticism, we detected no significant correlations in either model in the combined sample. We did identify a cluster of significant (q<0.05, corrected) relationships between neuroticism and all meta-state metrics in the sensitivity analyses in females in the 24-network model (Supplementary Table 3) but not the baseline case. In males, there were scattered observations in the sensitivity analyses in both the 24- and 51-network sensitivity analyses but again, not in the baseline model (Supplementary Tables 3 and 4). With respect to openness to experience, only in females considered separately were significant (q<0.05, corrected) correlations to dynamism seen in the 24-network model between native space state switching and L1 distance in the sensitivity analyses (Supplementary Table 3). In the higher-order 51-network model, we observed significant correlations with L1 distance in the baseline case and all meta-state metrics in the 20TR analysis. In females, meta-state switching and L1 span were significantly (q<0.05, corrected) correlated with openness to experience in the 20TR analysis alone (Supplementary Table 4).
4. Discussion
In recent years, macroscale brain dynamism has become a topic of substantial research interest in human neuroscience. The analysis of functional dynamics in the task-free state from rsfMRI provides a window into spontaneous neural activity in living humans and likely a more nuanced and information-rich view than earlier ‘static’ models of connectivity (Ciric, Nomi, Uddin, & Satpute, 2017). Recently, we published the first evidence that substantial sex-related differences exist in dynamic or time-varying connectivity. Moreover, we showed that certain of the high-order metrics of brain dynamism forming the substrate of the present study also exhibit marked sex-related differences. Specifically, we identified significantly greater dynamism in males vs females in native space state-switching and the high-order metrics pertaining to dynamic range: L1 span and total L1 distance (de Lacy et al., 2019b). In the present study we asked whether sex-related differences in these high-dimension metrics of brain dynamism were related to the well-established observations of sex-related bias in anxiety and depression traits. More broadly, we were also interested in evaluating whether functional neural dynamism was significantly associated with traits corresponding to the positive and negative valence systems posited as neurobiological substrates for normal and abnormal anxiety and depression, and whether this varied in males and females.
Given the epidemiologic evidence of sex-related bias in clinical anxiety and depression (where females have been observed to have increased rates of clinical symptoms) and our own prior work in dynamism showing that females exhibited less dynamism than males, we hypothesized that increasing dynamism would be significantly negatively correlated with anxiety traits and propensity for depressed mood with this negative correlation being more marked in males. We did detect that significant associations between metrics of intrinsic brain dynamism and dimensional measures of anxiety and depression traits were much more pronounced in males. Surprisingly, we identified that anxiety and depression traits were positively correlated with dynamism in males (who albeit had directionally lower anxiety and depression trait scores), though they did prove to be negatively correlated in females as we had originally hypothesized. These findings robustly replicated in our sensitivity analyses regardless of whether significant differences were present in the behavioral outcome measure. Similarly, we were surprised to find that drive and fun/novelty-seeking were significantly and robustly positively correlated with brain dynamism in females but not in males, as was the executive function of self-control, a cognitive process essential for behavioral self-regulation in the service of forming and achieving goals or rewards. The drive measure calibrates an individual’s motivation to follow their own goals, where fun-seeking measures exploratory activity in response to novel stimuli, avoidance of frustration, extravagance and impulsive decision-making (i.e. key positive valence system constructs). Of note, we have also previously demonstrated that increasing dynamism is significantly and negatively correlated with response inhibition reaction times (a cognitive control function measured with the Flanker task) and that this effect is more robust and widespread in females. Taken together, our results therefore suggest that increasing dynamism in males is strongly associated with increased propensity for state and trait anxiety and depression, and less commonly or only directionally associated with lower activity, increased fatigue, decreased activity, faster reaction/response inhibition, and increasing behavioral inhibition (BIS measure) and reward-seeking. In females, however, increasing dynamism is robustly associated with increased reward seeking and novelty-seeking and stronger executive function (self-control and shorter response inhibition reaction times) but only weakly or directionally linked to propensity for anxiety and depression, decreasing fatigue and activity level. In neither sex (or the combined sample) was there any significant association with the positive valence construct of responsiveness to reward, nor to the dimensional measure of harm avoidance, which has been posited as a substrate for anxiety. In the current study we have presented results from two model orders: 24- and 51-network models of intrinsic neural networks. This allows examination of whole-brain dynamism in increasing resolution since neural networks appear as smaller sub-networks as model order increases. For example, in higher-order models the default mode network typically presents as a single network in low model orders but as multiple sub-networks in higher model orders. While our core findings were replicated in both 24- and 51-network models, there were some differences between the two models, likely accruing from this increased detail and larger number of sub-networks present in the 51-network model.
In essence, our findings suggest that intrinsic brain dynamism is generally much more strongly associated with upstream core positive valence constructs in females and largely decoupled from frank traits for anxiety and depression, but quite robustly and broadly associated with dimensional traits for anxiety and depression (i.e. downstream negative valence constructs) in males. On its surface, this finding seems to conflict with historical claims that females/women are more sensitive to stimuli with negative valence and show enhanced emotional responding, and that this is linked to their increased predisposition to clinical anxiety and depression (Bradley, Codispoti, Sabatinelli, & Lang, 2001; Fujita, Diener, & Sandvik, 1991; Grossman & Wood, 1993; Hammen, 2005; Wild, Erb, & Bartels, 2001). For example, in simple tasks of viewing positive and negative stimuli (e.g. happy or sad faces), females/women have been shown to have higher levels of brain activation than males/men, especially to stimuli associated with negative emotions (Hofer et al., 2006; Stevens & Hamann, 2012). However, other work presents a less clear picture (Day & Stevenson, 2019) with many studies suggesting that males/men and females/women recruit different brain regions to accomplish ostensibly similar behavioral responses to emotional stimuli. Gard and Kring demonstrated that females/women showed enhanced emotional arousal relatively later than males/men when viewing aversive pictures (Gard & Kring, 2007) and a large meta-analysis by Wager et al identified that females/women preferentially recruited the anterior cingulate cortex, thalamus and midbrain during emotional processing while males/men showed increased activation in inferior frontal and posterior regions (Wager, Phan, Liberzon, & Taylor, 2003). The preponderance of evidence increasingly suggests that females/women and males/men crucially differ in implementing cognitive control over emotional responses, with the superimposition of different neural strategies to regulate and process their experienced reactions to the valence of emotional stimuli (Lee, Liu, Chan, Fang, & Gao, 2005; Lee et al., 2002). This process of cognitive reappraisal is central to the relationship formed by the individual to stimuli with both negative and positive valence, increasing or decreasing its emotional impact. Over time, repeated patterns in emotion regulation and cognitive reappraisal may lead either to adaptive integration of the event or maladaptive anxiety, depression or other mental illnesses such as post-traumatic stress disorder. Importantly, the brain areas involved in cognitive reappraisal are similar to those which implement executive functions such as conflict-detection and interference resolution: the dorsolateral prefrontal cortex, orbitofrontal cortex and anterior cingulate cortex (Eippert et al., 2007; Kim & Hamann, 2007; Ochsner, Bunge, Gross, & Gabrieli, 2002; Phan et al., 2005). Besides the degree of sex/gender-related differences in initial emotional reactivity to negative valence, the neural strategies for emotion regulation also seem to be quite different (McRae, Ochsner, Mauss, Gabrieli, & Gross, 2008). For example, in a careful study Domes et al examined emotion regulation in response to viewing negative stimuli in a delayed cognitive reappraisal paradigm and found that while females/women did show increased amygdala activity during early arousal, males/men “showed an increased recruitment of regulatory cognitive areas during cognitively increasing emotional reactions” vs females/women (Domes et al., 2010).
Evidence from a variety of other neurocognitive domains besides emotion regulation further supports the perspective that similar behaviors may be produced by distinct neural circuitry in males/men and females/women observable in vivo using fMRI. Importantly, this appears to be the case regardless of whether a performance differential is apparent. For example, Bell et al performed a straightforward comparison utilizing task fMRI across a battery of tasks from different cognitive domains and found that males/men and females/women recruited different areas of the brain to perform specific tasks, regardless of whether performance differentials occurred (Bell, Willson, Wilman, Dave, & Silverstone, 2006). Others have demonstrated similar findings (Garn, Allen, & Larsen, 2009; Gauthier, Duyme, Zanca, & Capron, 2009; Gur et al., 2000; Hugdahl, Thomsen, & Ersland, 2006). Similarly, we previously demonstrated in rsfMRI that a mosaic of sex-related differences exist in the majority of intrinsic functional neural networks concentrated in default mode and task-positive control networks associated with executive function and cognitive and motor control (de Lacy, McCauley, Kutz, & Calhoun, 2019a). These preferentially mapped onto neurocognitive association maps related to certain aspects of cognitive control (goal selection, reaction time, response selection, working memory and selective attention) vs others (sustained attention and cognitive flexibility) in addition to cognitive processes traditionally-associated with sex-related performance differentials (e.g. reading, verbal fluency and visuospatial tasks). In all cases, the number of unique brain locations with F<M effects was less than that of M>F effects, suggesting that the neurocognitive footprint of sex-related effects in brain functional networks is simply greater in males, including those linked to executive function and cognitive control, regardless of whether there is an observed performance differential in the underlying cognitive task or process. These intriguing phenomena imply that sex-related differences in the neural bases of behavior may not only relate to differential task performance, but in other cases to a compensatory or protective functional response that brings task performance up to similar levels in males/men and females/women. In the present study, we also observed that significant dynamism-behavioral relationships did not segregate with sex-related differences in a trait or behavior in this sample of neurotypical young adults. For example, there were strong and significant associations between dynamism and fun/novelty-seeking only in females, even though there was no significant sex-related difference in the BIS/BAS and TCI behavioral measures related to this positive valence construct.
While our results only pertain to intrinsic brain dynamism, and neither preclude other proposed neural bases of traits for anxiety and depression nor imply causality, it is also instructive to consider how our findings may relate to the different emphases in the presentation of clinical anxiety and depression found in males/men and females/women (Altemus, Sarvaiya, & Neill Epperson, 2014). In clinical anxiety disorders, females/women report more somatic and gastrointestinal symptoms, co-morbid mood disorders and fear of anxiety-sensitivity while males/men are more likely to experience relationship stress, fear of the social consequences of anxiety and co-morbid externalizing/disinhibited disorders such as alcohol and substance abuse. In clinical depression, females/women report more neurovegetative (atypical) symptoms, interpersonal sensitivity, somatic and gastrointestinal complaints, suicidal tendencies, co-morbid anxiety and eating disorders where males/men experience more typical mood symptoms and higher rates of lethal suicide attempts. It is possible that while increased brain dynamism in males/men is associated with and may even confer benefits such as reducing reaction times during conflict/interference tasks, it increases liability for low mood and anxiety, attenuates protective positive valence behavioral traits and tend to worsen inhibitory control. This may help explain the higher levels of co-morbid disorders of disinhibition in males/men and clinical emphasis on more typical depressed mood symptoms arising from the negative valence of loss. Conversely, the strong association between dynamism and certain aspects of positive valence and self-control in females may be adversely upregulated clinically to influence the female-specific presentation of clinical anxiety and depression, linking to symptoms associated with perfectionism and control such as disordered eating and somatic complaints. However, these and other open questions remain as to correspondences between fundamental behavioral traits for anxiety and low mood, the corresponding clinical disorders and their neural correlates. For example, multiple studies have demonstrated that the higher levels of social awareness, skills and empathy thought to be present in females/women are associated with differences in cortical structures known to be involved in social cognition (Cheng et al., 2009; Goldstein et al., 2001; Wood, Heitmiller, Andreasen, & Nopoulos, 2008). Yet, as noted above, it is the male presentation of clinical anxiety that is more characterized by social concerns and sensitivity to the social context of anxiety symptoms. Further, in the present study significant correlations between dynamism metrics segregated with a specific group of measures of traits for anxiety, depression, positive and negative valence and not with others. Most notably, harm avoidance is a trait that has been proposed to be upregulated in females/women (Miettunen, Veijola, Lauronen, Kantojarvi, & Joukamaa, 2007) and linked to maladaptive cognitive emotion regulation strategies in young adults (Chae, Park, Garcia, & Lee, 2019), but we found no significant relationship between this trait and dynamism metrics in any participant group. However, increasing fun/novelty-seeking (which has been proposed as being negatively-correlated with harm avoidance (Miettunen, Lauronen, Kantojarvi, Veijola, & Joukamaa, 2008) was quite sensitive to increasing brain dynamism in females, who have higher rates of clinical anxiety.
5. Limitations
Limitations exist in the present study. Firstly, IQ scores derived from the Shipley-Hartford Age-Corrected T-scores were provided in the original dataset and used in the current analysis. These are estimates of IQ rather than the result of full IQ testing. As may be seen in Figure 2, the average estimated IQ of this sample is above the population average due to the recruitment method, and results may not be fully extensible to broader populations. Further, our study includes only young neurotypical individuals and results may vary in younger or older subjects, individuals with neuropsychiatric differences or clinical mental health conditions. We provide two models of whole brain function derived from spatial group ICA, with 24- and 51-network functional parcellations, and sensitivity analyses with window sizes of 15-, 17- and 20TR as well as different cluster numbers based on our prior work in parameterizing dynamic connectivity analysis. However, this is not an exhaustive set of possible parameters. For example, the number of ICA components could be further varied to higher or lower numbers. Different results might be obtained if other analytic choices were made. Prior work in dynamic connectivity has also suggested that in addition to the conventional low-pass filter used in resting-state fMRI, window size may be selected based on the minimum frequency of interest to avoid leakage of signal and potentially spurious correlations (Leonardi & Van De Ville, 2015). Typically, this leads to a window size of ~100 seconds. However, such window sizes of well over 1 minute also attenuate some of the interesting dynamic functions in the data and potentially remove meaningful information which distinguishes subject groups(Vergara, Abrol, & Calhoun, 2019; Yaesoubi, Miller, & Calhoun, 2017). Because of a desire to maintain consistency with our prior work including large-scale replication studies (Abrol, Chaze, Damaraju, & Calhoun, 2016)we have retained our established pipeline using an 0.15Hz low pass filter with the addition of sensitivity analyses at variable window sizes to evaluate consistency. It is acknowledged that the selection of much longer or different window sizes could lead to differing results. Further, given the resting state condition, it is possible that subject vigilance or wakefulness may have been reduced during part or all of their scans, or varied among subjects and this may have affected results. Finally, as noted in the Introduction, we did not have information on sex vs gender identification or menstrual cycle phase in this subject sample and our results may have been different if gender was specified, if continuous rather than dichotomous information regarding sex/gender had been available, or if information on the menstrual cycle had been available.
6. Conclusions
This study demonstrates that high-dimension metrics of intrinsic brain dynamism derived from two sex-sensitive models of brain network function in young neurotypical adults are significantly associated with behavioral measures associated with negative and positive valence systems. Our work suggests that while greater intrinsic brain dynamism in males may be associated with certain advantages in specific neurocognitive abilities such as reaction time, it is also less tightly coupled to traits for important cognitive control and cognitive reappraisal strategies toward stimuli with positive valence, in particular drive, novelty-seeking and self-control. Moreover, this study had the surprising finding that dynamism is strongly positively correlated to traits for anxiety and depression in males, who are reported to experience more co-occurring disorders of disinhibition such as substance abuse. A reasonable hypothesis to investigate in future studies might be that increased dynamism in males/men is associated with a liability for their differential presentation of clinical anxiety and depression and attenuates or otherwise modulates the protective role of cognitive control in the cognitive reappraisal of experiences with negative valence. Conversely, we found that intrinsic brain dynamism was strongly coupled to drive, novelty-seeking and self-control in females/women, but exhibited only a weak or directional negative association with traits for anxiety and depression. Future work should help determine whether the strong association between intrinsic brain dynamism in females/women and positive valence system traits may be a compensatory mechanism for the underlying higher initial emotional reactivity (particularly to stimuli with negative valence) experienced by women and/or contributes to their differential clinical presentation of anxiety and depression characterized by increased vulnerability to co-morbid disorders of self-control such as eating disorders. More broadly, future studies will help discriminate the roles of observed sex-related differences in default-mode and task-positive control networks, their relationship to sex-related differences in dynamic connectivity and intrinsic dynamism, and potential downstream effects in traits and symptoms related to positive and negative valence systems such as normal and abnormal anxiety and depression as well as post-traumatic stress disorder and resilience to these conditions. Understanding how sex-related differences in the neural mechanisms of cognitive control and cognitive reappraisal may be related to the neurobiology of anxiety and depression traits and clinical disorders is not only of research interest, but also of great clinical import. For example, teaching and enhancing cognitive reappraisal and cognitive control is the lynchpin of gold standard therapeutic treatment strategies for anxiety and depression such as Cognitive Behavioral Therapy and Behavioral Activation Therapy. Our work builds on that of others in human neuroscience demonstrating that the neural correlates of normal traits and behaviors can be significantly different in males/men and females/women, underscoring the need for a careful consideration of sex/gender in sample selection, study design and analysis when examining brain function in both typical and clinical populations. Further, our results do not imply causality. It is challenging to disambiguate the directionality of the relationship between sex/gender-related differences in neurobiology, life experiences and cultural expectations, and there are important interactions between social processes of individuation and sex/gender during human development and indeed the lifespan, with sex/gender-related differences in brain function and behavior and likely sex/gender itself existing on a continuum with substantial individual variation.
Supplementary Material
Acknowledgements
The authors gratefully acknowledge the help of B. Ernesto Johnson in preparing figures. This study was supported by the National Institutes of Mental Health under Award Number 1K99MH118359 to NdL, and NIH 2R01EB005846, P20GM103472, P30GM122734 and R01EB020407 and NSF 153906 to VDC. The content is solely the responsibility of the authors and does not necessarily represent the official views of the NIH. NdL designed the study, performed the analysis and wrote the paper. VC and NK contributed to study design and writing the paper.
Data were provided in part by the Brain Genomics Superstruct Project of Harvard University and the Massachusetts General Hospital, (Principal Investigators: Randy Buckner, Joshua Roffman, and Jordan Smoller), with support from the Center for Brain Science Neuroinformatics Research Group, the Athinoula A. Martinos Center for Biomedical Imaging, and the Center for Human Genetic Research. 20 individual investigators at Harvard and MGH generously contributed data to the overall project.
Footnotes
The authors declare no conflicts of interest.
References
- Abrol A, Chaze C, Damaraju E, & Calhoun VD (2016). The chronnectome: Evaluating replicability of dynamic connectivity patterns in 7500 resting fMRI datasets. Conf Proc IEEE Eng Med Biol Soc, 2016, 5571–5574. doi: 10.1109/EMBC.2016.7591989 [DOI] [PubMed] [Google Scholar]
- Allen EA, Damaraju E, Plis SM, Erhardt EB, Eichele T, & Calhoun VD (2014). Tracking whole-brain connectivity dynamics in the resting state. Cereb Cortex, 24(3), 663–676. doi: 10.1093/cercor/bhs352 [DOI] [PMC free article] [PubMed] [Google Scholar]
- Allen EA, Erhardt EB, Damaraju E, Gruner W, Segall JM, Silva RF, … Calhoun VD (2011). A baseline for the multivariate comparison of resting-state networks. Front Syst Neurosci, 5, 2. doi: 10.3389/fnsys.2011.00002 [DOI] [PMC free article] [PubMed] [Google Scholar]
- Allen EA, Erhardt EB, Wei Y, Eichele T, & Calhoun VD (2012). Capturing inter-subject variability with group independent component analysis of fMRI data: a simulation study. Neuroimage, 59(4), 4141–4159. doi: 10.1016/j.neuroimage.2011.10.010 [DOI] [PMC free article] [PubMed] [Google Scholar]
- Altemus M, Sarvaiya N, & Neill Epperson C (2014). Sex differences in anxiety and depression clinical perspectives. Front Neuroendocrinol, 35(3), 320–330. doi: 10.1016/j.yfrne.2014.05.004 [DOI] [PMC free article] [PubMed] [Google Scholar]
- Bell EC, Willson MC, Wilman AH, Dave S, & Silverstone PH (2006). Males and females differ in brain activation during cognitive tasks. Neuroimage, 30(2), 529–538. doi: 10.1016/j.neuroimage.2005.09.049 [DOI] [PubMed] [Google Scholar]
- Biswal BB, Mennes M, Zuo XN, Gohel S, Kelly C, Smith SM, … Milham MP (2010). Toward discovery science of human brain function. Proc Natl Acad Sci U S A, 107(10), 4734–4739. doi: 10.1073/pnas.0911855107 [DOI] [PMC free article] [PubMed] [Google Scholar]
- Blanch A, Lucas I, Balada F, Blanco E, & Aluja A (2018). Sex differences and personality in the modulation of the acoustic startle reflex. Physiol Behav, 195, 20–27. doi: 10.1016/j.physbeh.2018.07.020 [DOI] [PubMed] [Google Scholar]
- Bradley MM, Codispoti M, Sabatinelli D, & Lang PJ (2001). Emotion and motivation II: sex differences in picture processing. Emotion, 1(3), 300–319. [PubMed] [Google Scholar]
- Cai B, Zhang G, Zhang A, Hu W, Stephen JM, Wilson TW, … Wang YP (2020). A GICA-TVGL framework to study sex differences in resting state fMRI dynamic connectivity. J Neurosci Methods, 332, 108531. doi: 10.1016/j.jneumeth.2019.108531 [DOI] [PMC free article] [PubMed] [Google Scholar]
- Calhoun VD, & Adali T (2012). Multisubject independent component analysis of fMRI: a decade of intrinsic networks, default mode, and neurodiagnostic discovery. IEEE Rev Biomed Eng, 5, 60–73. doi: 10.1109/RBME.2012.2211076 [DOI] [PMC free article] [PubMed] [Google Scholar]
- Calhoun VD, Adali T, Pearlson GD, & Pekar JJ (2001). A method for making group inferences from functional MRI data using independent component analysis. Hum Brain Mapp, 14(3), 140–151. [DOI] [PMC free article] [PubMed] [Google Scholar]
- Calhoun VD, Miller R, Pearlson G, & Adali T (2014). The chronnectome: time-varying connectivity networks as the next frontier in fMRI data discovery. Neuron, 84(2), 262–274. doi: 10.1016/j.neuron.2014.10.015 [DOI] [PMC free article] [PubMed] [Google Scholar]
- Carver CSW, T.L. (1994). Behavioral Inhibition, Behavioral Activation, and Affective Responses to Impending Reward and Punishment: The BIS/BAS Scales. Journal of Personality and Social Psychology, 67(2), 319–332. [Google Scholar]
- Chae H, Park SH, Garcia D, & Lee SJ (2019). Cloninger's TCI associations with adaptive and maladaptive emotion regulation strategies. PeerJ, 7, e7958. doi: 10.7717/peerj.7958 [DOI] [PMC free article] [PubMed] [Google Scholar]
- Cheng Y, Chou KH, Decety J, Chen IY, Hung D, Tzeng OJ, & Lin CP (2009). Sex differences in the neuroanatomy of human mirror-neuron system: a voxel-based morphometric investigation. Neuroscience, 158(2), 713–720. doi: 10.1016/j.neuroscience.2008.10.026 [DOI] [PubMed] [Google Scholar]
- Christodoulou AG, Bauer TE, Kiehl KA, Feldstein Ewing SW, Bryan AD, & Calhoun VD (2013). A quality control method for detecting and suppressing uncorrected residual motion in fMRI studies. Magn Reson Imaging, 31(5), 707–717. doi: 10.1016/j.mri.2012.11.007 [DOI] [PMC free article] [PubMed] [Google Scholar]
- Ciric R, Nomi JS, Uddin LQ, & Satpute AB (2017). Contextual connectivity: A framework for understanding the intrinsic dynamic architecture of large-scale functional brain networks. Sci Rep, 7(1), 6537. doi: 10.1038/s41598-017-06866-w [DOI] [PMC free article] [PubMed] [Google Scholar]
- Cloninger CR (1994). The temperament and character inventory (TCI): A guide to its development and use. St Louis, MO: Center for Psychobiology of Personality, Washington University. [Google Scholar]
- Cui Q, Chen Y, Tang Q, Han S, Hu S, Pang Y, … Chen H (2019). Disrupted dynamic local brain functional connectivity patterns in generalized anxiety disorder. Prog Neuropsychopharmacol Biol Psychiatry, 99, 109833. doi: 10.1016/j.pnpbp.2019.109833 [DOI] [PubMed] [Google Scholar]
- Cui Q, Sheng W, Chen Y, Pang Y, Lu F, Tang Q, … Chen H (2019). Dynamic changes of amplitude of low-frequency fluctuations in patients with generalized anxiety disorder. Hum Brain Mapp. doi: 10.1002/hbm.24902 [DOI] [PMC free article] [PubMed] [Google Scholar]
- Damaraju E, Allen EA, Belger A, Ford JM, McEwen S, Mathalon DH, … Calhoun VD (2014). Dynamic functional connectivity analysis reveals transient states of dysconnectivity in schizophrenia. Neuroimage Clin, 5, 298–308. doi: 10.1016/j.nicl.2014.07.003 [DOI] [PMC free article] [PubMed] [Google Scholar]
- Day HLL, & Stevenson CW (2019). The neurobiological basis of sex differences in learned fear and its inhibition. Eur J Neurosci. doi: 10.1111/ejn.14602 [DOI] [PMC free article] [PubMed] [Google Scholar]
- de Lacy N, Doherty D, King BH, Rachakonda S, & Calhoun VD (2017). Disruption to control network function correlates with altered dynamic connectivity in the wider autism spectrum. Neuroimage Clin, 15, 513–524. doi: 10.1016/j.nicl.2017.05.024 [DOI] [PMC free article] [PubMed] [Google Scholar]
- de Lacy N, McCauley E, Kutz JN, & Calhoun VD (2019a). Multilevel Mapping of Sexual Dimorphism in Intrinsic Functional Brain Networks. Front Neurosci, 13, 332. doi: 10.3389/fnins.2019.00332 [DOI] [PMC free article] [PubMed] [Google Scholar]
- de Lacy N, McCauley E, Kutz JN, & Calhoun VD (2019b). Sex-related differences in intrinsic brain dynamism and their neurocognitive correlates. Neuroimage, 202, 116116. doi: 10.1016/j.neuroimage.2019.116116 [DOI] [PubMed] [Google Scholar]
- Domes G, Schulze L, Bottger M, Grossmann A, Hauenstein K, Wirtz PH, … Herpertz SC (2010). The neural correlates of sex differences in emotional reactivity and emotion regulation. Hum Brain Mapp, 31(5), 758–769. doi: 10.1002/hbm.20903 [DOI] [PMC free article] [PubMed] [Google Scholar]
- Dosenbach NU, Fair DA, Miezin FM, Cohen AL, Wenger KK, Dosenbach RA, … Petersen SE (2007). Distinct brain networks for adaptive and stable task control in humans. Proc Natl Acad Sci U S A, 104(26), 11073–11078. doi: 10.1073/pnas.0704320104 [DOI] [PMC free article] [PubMed] [Google Scholar]
- Dosenbach NU, Visscher KM, Palmer ED, Miezin FM, Wenger KK, Kang HC, … Petersen SE (2006). A core system for the implementation of task sets. Neuron, 50(5), 799–812. doi: 10.1016/j.neuron.2006.04.031 [DOI] [PMC free article] [PubMed] [Google Scholar]
- Du Y, Allen EA, He H, Sui J, Wu L, & Calhoun VD (2016). Artifact removal in the context of group ICA: A comparison of single-subject and group approaches. Hum Brain Mapp, 37(3), 1005–1025. doi: 10.1002/hbm.23086 [DOI] [PMC free article] [PubMed] [Google Scholar]
- Eippert F, Veit R, Weiskopf N, Erb M, Birbaumer N, & Anders S (2007). Regulation of emotional responses elicited by threat-related stimuli. Hum Brain Mapp, 28(5), 409–423. doi: 10.1002/hbm.20291 [DOI] [PMC free article] [PubMed] [Google Scholar]
- Erhardt EB, Rachakonda S, Bedrick EJ, Allen EA, Adali T, & Calhoun VD (2011). Comparison of multi-subject ICA methods for analysis of fMRI data. Hum Brain Mapp, 32(12), 2075–2095. doi: 10.1002/hbm.21170 [DOI] [PMC free article] [PubMed] [Google Scholar]
- Fox MD, Snyder AZ, Vincent JL, Corbetta M, Van Essen DC, & Raichle ME (2005). The human brain is intrinsically organized into dynamic, anticorrelated functional networks. Proc Natl Acad Sci U S A, 102(27), 9673–9678. doi: 10.1073/pnas.0504136102 [DOI] [PMC free article] [PubMed] [Google Scholar]
- Friedman J, Hastie T, & Tibshirani R (2008). Sparse inverse covariance estimation with the graphical lasso. Biostatistics, 9(3), 432–441. doi: 10.1093/biostatistics/kxm045 [DOI] [PMC free article] [PubMed] [Google Scholar]
- Fujita F, Diener E, & Sandvik E (1991). Gender differences in negative affect and well-being: the case for emotional intensity. J Pers Soc Psychol, 61(3), 427–434. doi: 10.1037//0022-3514.61.3.427 [DOI] [PubMed] [Google Scholar]
- Gard MG, & Kring AM (2007). Sex differences in the time course of emotion. Emotion, 7(2), 429–437. doi: 10.1037/1528-3542.7.2.429 [DOI] [PubMed] [Google Scholar]
- Garn CL, Allen MD, & Larsen JD (2009). An fMRI study of sex differences in brain activation during object naming. Cortex, 45(5), 610–618. doi: 10.1016/j.cortex.2008.02.004 [DOI] [PubMed] [Google Scholar]
- Gater R, Tansella M, Korten A, Tiemens BG, Mavreas VG, & Olatawura MO (1998). Sex differences in the prevalence and detection of depressive and anxiety disorders in general health care settings: report from the World Health Organization Collaborative Study on Psychological Problems in General Health Care. Arch Gen Psychiatry, 55(5), 405–413. doi: 10.1001/archpsyc.55.5.405 [DOI] [PubMed] [Google Scholar]
- Gaudry E, Vagg P, & Spielberger CD (1975). Validation of the State-Trait Distinction in Anxiety Research. Multivariate Behav Res, 10(3), 331–341. doi: 10.1207/s15327906mbr1003_6 [DOI] [PubMed] [Google Scholar]
- Gauthier CT, Duyme M, Zanca M, & Capron C (2009). Sex and performance level effects on brain activation during a verbal fluency task: a functional magnetic resonance imaging study. Cortex, 45(2), 164–176. doi: 10.1016/j.cortex.2007.09.006 [DOI] [PubMed] [Google Scholar]
- Goldstein JM, Seidman LJ, Horton NJ, Makris N, Kennedy DN, Caviness VS Jr., … Tsuang MT (2001). Normal sexual dimorphism of the adult human brain assessed by in vivo magnetic resonance imaging. Cereb Cortex, 11(6), 490–497. doi: 10.1093/cercor/11.6.490 [DOI] [PubMed] [Google Scholar]
- Gomez P, von Gunten A, & Danuser B (2016). Autonomic nervous system reactivity within the valence-arousal affective space: Modulation by sex and age. Int J Psychophysiol, 109, 51–62. doi: 10.1016/j.ijpsycho.2016.10.002 [DOI] [PubMed] [Google Scholar]
- Grossman M, & Wood W (1993). Sex differences in intensity of emotional experience: a social role interpretation. J Pers Soc Psychol, 65(5), 1010–1022. doi: 10.1037//0022-3514.65.5.1010 [DOI] [PubMed] [Google Scholar]
- Gur RC, Alsop D, Glahn D, Petty R, Swanson CL, Maldjian JA, … Gur RE (2000). An fMRI study of sex differences in regional activation to a verbal and a spatial task. Brain Lang, 74(2), 157–170. doi: 10.1006/brln.2000.2325 [DOI] [PubMed] [Google Scholar]
- Gur RC, & Gur RE (2017). Complementarity of sex differences in brain and behavior: From laterality to multimodal neuroimaging. J Neurosci Res, 95(1-2), 189–199. doi: 10.1002/jnr.23830 [DOI] [PMC free article] [PubMed] [Google Scholar]
- Hammen C (2005). Stress and depression. Annu Rev Clin Psychol, 1, 293–319. doi: 10.1146/annurev.clinpsy.1.102803.143938 [DOI] [PubMed] [Google Scholar]
- Hankin BL (2009). Development of sex differences in depressive and co-occurring anxious symptoms during adolescence: descriptive trajectories and potential explanations in a multiwave prospective study. J Clin Child Adolesc Psychol, 38(4), 460–472. doi: 10.1080/15374410902976288 [DOI] [PMC free article] [PubMed] [Google Scholar]
- Health, N. I. o. M. (Producer). (2011, February 2020). Definitions of the RDoC Domains and Constructs. Retrieved from https://www.nimh.nih.gov/research/research-funded-by-nimh/rdoc/definitions-of-the-rdoc-domains-and-constructs.shtml
- Hidalgo-Lopez E, Mueller K, Harris T, Aichhorn M, Sacher J, & Pletzer B (2020). Human menstrual cycle variation in subcortical functional brain connectivity: a multimodal analysis approach. Brain Struct Funct, 225(2), 591–605. doi: 10.1007/s00429-019-02019-z [DOI] [PMC free article] [PubMed] [Google Scholar]
- Himberg J, Hyvarinen A, & Esposito F (2004). Validating the independent components of neuroimaging time series via clustering and visualization. Neuroimage, 22(3), 1214–1222. doi: 10.1016/j.neuroimage.2004.03.027 [DOI] [PubMed] [Google Scholar]
- Hofer A, Siedentopf CM, Ischebeck A, Rettenbacher MA, Verius M, Felber S, & Fleischhacker WW (2006). Gender differences in regional cerebral activity during the perception of emotion: a functional MRI study. Neuroimage, 32(2), 854–862. doi: 10.1016/j.neuroimage.2006.03.053 [DOI] [PubMed] [Google Scholar]
- Holmes AJ, Hollinshead MO, O'Keefe TM, Petrov VI, Fariello GR, Wald LL, … Buckner RL (2015). Brain Genomics Superstruct Project initial data release with structural, functional, and behavioral measures. Sci Data, 2, 150031. doi: 10.1038/sdata.2015.31 [DOI] [PMC free article] [PubMed] [Google Scholar]
- Hugdahl K, Thomsen T, & Ersland L (2006). Sex differences in visuo-spatial processing: an fMRI study of mental rotation. Neuropsychologia, 44(9), 1575–1583. doi: 10.1016/j.neuropsychologia.2006.01.026 [DOI] [PubMed] [Google Scholar]
- Insel T, Cuthbert B, Garvey M, Heinssen R, Pine DS, Quinn K, … Wang P (2010). Research domain criteria (RDoC): toward a new classification framework for research on mental disorders. Am J Psychiatry, 167(7), 748–751. doi: 10.1176/appi.ajp.2010.09091379 [DOI] [PubMed] [Google Scholar]
- Jia H, Hu X, & Deshpande G (2014). Behavioral relevance of the dynamics of the functional brain connectome. Brain Connect, 4(9), 741–759. doi: 10.1089/brain.2014.0300 [DOI] [PMC free article] [PubMed] [Google Scholar]
- Jiang R, Calhoun VD, Fan L, Zuo N, Jung R, Qi S, … Sui J (2019). Gender Differences in Connectome-based Predictions of Individualized Intelligence Quotient and Sub-domain Scores. Cereb Cortex. doi: 10.1093/cercor/bhz134 [DOI] [PMC free article] [PubMed] [Google Scholar]
- Kaiser RH, Whitfield-Gabrieli S, Dillon DG, Goer F, Beltzer M, Minkel J, … Pizzagalli DA (2016). Dynamic Resting-State Functional Connectivity in Major Depression. Neuropsychopharmacology, 41(7), 1822–1830. doi: 10.1038/npp.2015.352 [DOI] [PMC free article] [PubMed] [Google Scholar]
- Kessler RC, Berglund P, Demler O, Jin R, Merikangas KR, & Walters EE (2005). Lifetime prevalence and age-of-onset distributions of DSM-IV disorders in the National Comorbidity Survey Replication. Arch Gen Psychiatry, 62(6), 593–602. doi: 10.1001/archpsyc.62.6.593 [DOI] [PubMed] [Google Scholar]
- Kessler RC, Chiu WT, Demler O, Merikangas KR, & Walters EE (2005). Prevalence, severity, and comorbidity of 12-month DSM-IV disorders in the National Comorbidity Survey Replication. Arch Gen Psychiatry, 62(6), 617–627. doi: 10.1001/archpsyc.62.6.617 [DOI] [PMC free article] [PubMed] [Google Scholar]
- Kim SH, & Hamann S (2007). Neural correlates of positive and negative emotion regulation. J Cogn Neurosci, 19(5), 776–798. doi: 10.1162/jocn.2007.19.5.776 [DOI] [PubMed] [Google Scholar]
- Laird AR, Fox PM, Eickhoff SB, Turner JA, Ray KL, McKay DR, … Fox PT (2011). Behavioral interpretations of intrinsic connectivity networks. J Cogn Neurosci, 23(12), 4022–4037. doi: 10.1162/jocn_a_00077 [DOI] [PMC free article] [PubMed] [Google Scholar]
- Lee TM, Liu HL, Chan CC, Fang SY, & Gao JH (2005). Neural activities associated with emotion recognition observed in men and women. Mol Psychiatry, 10(5), 450–455. doi: 10.1038/sj.mp.4001595 [DOI] [PubMed] [Google Scholar]
- Lee TM, Liu HL, Hoosain R, Liao WT, Wu CT, Yuen KS, … Gao JH (2002). Gender differences in neural correlates of recognition of happy and sad faces in humans assessed by functional magnetic resonance imaging. Neurosci Lett, 333(1), 13–16. doi: 10.1016/s0304-3940(02)00965-5 [DOI] [PubMed] [Google Scholar]
- Leonardi N, & Van De Ville D (2015). On spurious and real fluctuations of dynamic functional connectivity during rest. Neuroimage, 104, 430–436. doi: 10.1016/j.neuroimage.2014.09.007 [DOI] [PubMed] [Google Scholar]
- Li SH, & Graham BM (2017). Why are women so vulnerable to anxiety, trauma-related and stress-related disorders? The potential role of sex hormones. Lancet Psychiatry, 4(1), 73–82. doi: 10.1016/S2215-0366(16)30358-3 [DOI] [PubMed] [Google Scholar]
- Li YO, Adali T, & Calhoun VD (2007). Estimating the number of independent components for functional magnetic resonance imaging data. Hum Brain Mapp, 28(11), 1251–1266. doi: 10.1002/hbm.20359 [DOI] [PMC free article] [PubMed] [Google Scholar]
- Magalhaes AC, Holmes KD, Dale LB, Comps-Agrar L, Lee D, Yadav PN, … Ferguson SS (2010). CRF receptor 1 regulates anxiety behavior via sensitization of 5-HT2 receptor signaling. Nat Neurosci, 13(5), 622–629. doi: 10.1038/nn.2529 [DOI] [PMC free article] [PubMed] [Google Scholar]
- Maglanoc LA, Kaufmann T, van der Meer D, Marquand AF, Wolfers T, Jonassen R, … Westlye LT (2019). Brain Connectome Mapping of Complex Human Traits and Their Polygenic Architecture Using Machine Learning. Biol Psychiatry. doi: 10.1016/j.biopsych.2019.10.011 [DOI] [PubMed] [Google Scholar]
- Mareckova K, Holsen LM, Admon R, Makris N, Seidman L, Buka S, … Goldstein JM (2016). Brain activity and connectivity in response to negative affective stimuli: Impact of dysphoric mood and sex across diagnoses. Hum Brain Mapp, 37(11), 3733–3744. doi: 10.1002/hbm.23271 [DOI] [PMC free article] [PubMed] [Google Scholar]
- Mathers CD, & Loncar D (2006). Projections of global mortality and burden of disease from 2002 to 2030. PLoS Med, 3(11), e442. doi: 10.1371/journal.pmed.0030442 [DOI] [PMC free article] [PubMed] [Google Scholar]
- McLean CP, Asnaani A, Litz BT, & Hofmann SG (2011). Gender differences in anxiety disorders: prevalence, course of illness, comorbidity and burden of illness. J Psychiatr Res, 45(8), 1027–1035. doi: 10.1016/j.jpsychires.2011.03.006 [DOI] [PMC free article] [PubMed] [Google Scholar]
- McNair DL, M.; Doppleman L (1971). POMS Manual for the Profile of Mood States. San Diego, CA: Educational and Industrial Testing Service. [Google Scholar]
- McRae K, Ochsner KN, Mauss IB, Gabrieli JJD, & Gross JJ (2008). Gender Differences in Emotion Regulation: An fMRI Study of Cognitive Reappraisal. Group Process Intergroup Relat, 11(2), 143–162. doi: 10.1177/1368430207088035 [DOI] [PMC free article] [PubMed] [Google Scholar]
- Miettunen J, Lauronen E, Kantojarvi L, Veijola J, & Joukamaa M (2008). Inter-correlations between Cloninger's temperament dimensions-- a meta-analysis. Psychiatry Res, 160(1), 106–114. doi: 10.1016/j.psychres.2007.05.003 [DOI] [PubMed] [Google Scholar]
- Miettunen J, Veijola J, Lauronen E, Kantojarvi L, & Joukamaa M (2007). Sex differences in Cloninger's temperament dimensions--a meta-analysis. Compr Psychiatry, 48(2), 161–169. doi: 10.1016/j.comppsych.2006.10.007 [DOI] [PubMed] [Google Scholar]
- Miller RL, Yaesoubi M, & Calhoun VD (2014). Higher dimensional analysis shows reduced dynamism of time-varying network connectivity in schizophrenia patients. Conf Proc IEEE Eng Med Biol Soc, 2014, 3837–3840. doi: 10.1109/EMBC.2014.6944460 [DOI] [PubMed] [Google Scholar]
- Miller RL, Yaesoubi M, Turner JA, Mathalon D, Preda A, Pearlson G, … Calhoun VD (2016). Higher Dimensional Meta-State Analysis Reveals Reduced Resting fMRI Connectivity Dynamism in Schizophrenia Patients. PLoS One, 11(3), e0149849. doi: 10.1371/journal.pone.0149849 [DOI] [PMC free article] [PubMed] [Google Scholar]
- Nakazato K, & Shimonaka Y (1989). The Japanese State-Trait Anxiety Inventory: age and sex differences. Percept Mot Skills, 69(2), 611–617. doi: 10.2466/pms.1989.69.2.611 [DOI] [PubMed] [Google Scholar]
- Nolen-Hoeksema S, & Girgus JS (1994). The emergence of gender differences in depression during adolescence. Psychol Bull, 115(3), 424–443. doi: 10.1037/0033-2909.115.3.424 [DOI] [PubMed] [Google Scholar]
- Nomi JS, Vij SG, Dajani DR, Steimke R, Damaraju E, Rachakonda S, … Uddin LQ (2017). Chronnectomic patterns and neural flexibility underlie executive function. Neuroimage, 147, 861–871. doi: 10.1016/j.neuroimage.2016.10.026 [DOI] [PMC free article] [PubMed] [Google Scholar]
- Ochsner KN, Bunge SA, Gross JJ, & Gabrieli JD (2002). Rethinking feelings: an FMRI study of the cognitive regulation of emotion. J Cogn Neurosci, 14(8), 1215–1229. doi: 10.1162/089892902760807212 [DOI] [PubMed] [Google Scholar]
- Patton JH, Stanford MS, & Barratt ES (1995). Factor structure of the Barratt impulsiveness scale. J Clin Psychol, 51(6), 768–774. doi: [DOI] [PubMed] [Google Scholar]
- Phan KL, Fitzgerald DA, Nathan PJ, Moore GJ, Uhde TW, & Tancer ME (2005). Neural substrates for voluntary suppression of negative affect: a functional magnetic resonance imaging study. Biol Psychiatry, 57(3), 210–219. doi: 10.1016/j.biopsych.2004.10.030 [DOI] [PubMed] [Google Scholar]
- Power JD, Mitra A, Laumann TO, Snyder AZ, Schlaggar BL, & Petersen SE (2014). Methods to detect, characterize, and remove motion artifact in resting state fMRI. Neuroimage, 84, 320–341. doi: 10.1016/j.neuroimage.2013.08.048 [DOI] [PMC free article] [PubMed] [Google Scholar]
- Preti MG, Bolton TA, & Van De Ville D (2017). The dynamic functional connectome: State-of-the-art and perspectives. Neuroimage, 160, 41–54. doi: 10.1016/j.neuroimage.2016.12.061 [DOI] [PubMed] [Google Scholar]
- Rabin LA, Fogel J, & Nutter-Upham KE (2011). Academic procrastination in college students: the role of self-reported executive function. J Clin Exp Neuropsychol, 33(3), 344–357. doi: 10.1080/13803395.2010.518597 [DOI] [PubMed] [Google Scholar]
- Sakoglu U, Pearlson GD, Kiehl KA, Wang YM, Michael AM, & Calhoun VD (2010). A method for evaluating dynamic functional network connectivity and task-modulation: application to schizophrenia. MAGMA, 23(5-6), 351–366. doi: 10.1007/s10334-010-0197-8 [DOI] [PMC free article] [PubMed] [Google Scholar]
- Satterthwaite TD, Wolf DH, Roalf DR, Ruparel K, Erus G, Vandekar S, … Gur RC (2015). Linked Sex Differences in Cognition and Functional Connectivity in Youth. Cereb Cortex, 25(9), 2383–2394. doi: 10.1093/cercor/bhu036 [DOI] [PMC free article] [PubMed] [Google Scholar]
- Schuch JJ, Roest AM, Nolen WA, Penninx BW, & de Jonge P (2014). Gender differences in major depressive disorder: results from the Netherlands study of depression and anxiety. J Affect Disord, 156, 156–163. doi: 10.1016/j.jad.2013.12.011 [DOI] [PubMed] [Google Scholar]
- Seeley WW, Menon V, Schatzberg AF, Keller J, Glover GH, Kenna H, … Greicius MD (2007). Dissociable intrinsic connectivity networks for salience processing and executive control. J Neurosci, 27(9), 2349–2356. doi: 10.1523/JNEUROSCI.5587-06.2007 [DOI] [PMC free article] [PubMed] [Google Scholar]
- Shalev I (2018). Use of a Self-Regulation Failure Framework and the NIMH Research Domain Criterion (RDoC) to Understand the Problem of Procrastination. Front Psychiatry, 9, 213. doi: 10.3389/fpsyt.2018.00213 [DOI] [PMC free article] [PubMed] [Google Scholar]
- Smith SM, Fox PT, Miller KL, Glahn DC, Fox PM, Mackay CE, … Beckmann CF (2009). Correspondence of the brain's functional architecture during activation and rest. Proc Natl Acad Sci U S A, 106(31), 13040–13045. doi: 10.1073/pnas.0905267106 [DOI] [PMC free article] [PubMed] [Google Scholar]
- Spalek K, Fastenrath M, Ackermann S, Auschra B, Coynel D, Frey J, … Milnik A (2015). Sex-dependent dissociation between emotional appraisal and memory: a large-scale behavioral and fMRI study. J Neurosci, 35(3), 920–935. doi: 10.1523/JNEUROSCI.2384-14.2015 [DOI] [PMC free article] [PubMed] [Google Scholar]
- Spielberger CD, Gorsuch RL, Lushene R, Vagg PR, & Jacobs GA . (1983). Manual for the State-Trait Anxiety Inventory. Palo Alto, CA: Consulting Psychologists Press. [Google Scholar]
- Spielberger CD, O. N. H., Hansen DN. (1970). Anxiety, drive theory, and computer-assisted learning (Vol. 14:67): Florida State University. [PubMed] [Google Scholar]
- Spreng RN, Sepulcre J, Turner GR, Stevens WD, & Schacter DL (2013). Intrinsic architecture underlying the relations among the default, dorsal attention, and frontoparietal control networks of the human brain. J Cogn Neurosci, 25(1), 74–86. doi: 10.1162/jocn_a_00281 [DOI] [PMC free article] [PubMed] [Google Scholar]
- Stevens JS, & Hamann S (2012). Sex differences in brain activation to emotional stimuli: a meta-analysis of neuroimaging studies. Neuropsychologia, 50(7), 1578–1593. doi: 10.1016/j.neuropsychologia.2012.03.011 [DOI] [PubMed] [Google Scholar]
- Twenge JM, & Nolen-Hoeksema S (2002). Age, gender, race, socioeconomic status, and birth cohort differences on the children's depression inventory: a meta-analysis. J Abnorm Psychol, 111(4), 578–588. doi: 10.1037//0021-843x.111.4.578 [DOI] [PubMed] [Google Scholar]
- Tye KM (2018). Neural Circuit Motifs in Valence Processing. Neuron, 100(2), 436–452. doi: 10.1016/j.neuron.2018.10.001 [DOI] [PMC free article] [PubMed] [Google Scholar]
- Vergara VM, Abrol A, & Calhoun VD (2019). An average sliding window correlation method for dynamic functional connectivity. Hum Brain Mapp, 40(7), 2089–2103. doi: 10.1002/hbm.24509 [DOI] [PMC free article] [PubMed] [Google Scholar]
- Vernet M, Quentin R, Chanes L, Mitsumasu A, & Valero-Cabre A (2014). Frontal eye field, where art thou? Anatomy, function, and non-invasive manipulation of frontal regions involved in eye movements and associated cognitive operations. Front Integr Neurosci, 8, 66. doi: 10.3389/fnint.2014.00066 [DOI] [PMC free article] [PubMed] [Google Scholar]
- Wager TD, Phan KL, Liberzon I, & Taylor SF (2003). Valence, gender, and lateralization of functional brain anatomy in emotion: a meta-analysis of findings from neuroimaging. Neuroimage, 19(3), 513–531. doi: 10.1016/s1053-8119(03)00078-8 [DOI] [PubMed] [Google Scholar]
- Weissman MM, Bland RC, Canino GJ, Faravelli C, Greenwald S, Hwu HG, … Yeh EK (1996). Cross-national epidemiology of major depression and bipolar disorder. JAMA, 276(4), 293–299. [PubMed] [Google Scholar]
- Weissman-Fogel I, Moayedi M, Taylor KS, Pope G, & Davis KD (2010). Cognitive and default-mode resting state networks: do male and female brains "rest" differently? Hum Brain Mapp, 31(11), 1713–1726. doi: 10.1002/hbm.20968 [DOI] [PMC free article] [PubMed] [Google Scholar]
- Wild B, Erb M, & Bartels M (2001). Are emotions contagious? Evoked emotions while viewing emotionally expressive faces: quality, quantity, time course and gender differences. Psychiatry Res, 102(2), 109–124. doi: 10.1016/s0165-1781(01)00225-6 [DOI] [PubMed] [Google Scholar]
- Wood JL, Heitmiller D, Andreasen NC, & Nopoulos P (2008). Morphology of the ventral frontal cortex: relationship to femininity and social cognition. Cereb Cortex, 18(3), 534–540. doi: 10.1093/cercor/bhm079 [DOI] [PubMed] [Google Scholar]
- Yaesoubi M, Miller RL, & Calhoun VD (2015). Mutually temporally independent connectivity patterns: a new framework to study the dynamics of brain connectivity at rest with application to explain group difference based on gender. Neuroimage, 107, 85–94. doi: 10.1016/j.neuroimage.2014.11.054 [DOI] [PMC free article] [PubMed] [Google Scholar]
- Yaesoubi M, Miller RL, & Calhoun VD (2017). Time-varying spectral power of resting-state fMRI networks reveal cross-frequency dependence in dynamic connectivity. PLoS One, 12(2), e0171647. doi: 10.1371/journal.pone.0171647 [DOI] [PMC free article] [PubMed] [Google Scholar]
- Yang Z, Craddock RC, Margulies DS, Yan CG, & Milham MP (2014). Common intrinsic connectivity states among posteromedial cortex subdivisions: Insights from analysis of temporal dynamics. Neuroimage, 93 Pt 1, 124–137. doi: 10.1016/j.neuroimage.2014.02.014 [DOI] [PMC free article] [PubMed] [Google Scholar]
- Yarkoni T, Poldrack RA, Nichols TE, Van Essen DC, & Wager TD (2011). Large-scale automated synthesis of human functional neuroimaging data. Nat Methods, 8(8), 665–670. doi: 10.1038/nmeth.1635 [DOI] [PMC free article] [PubMed] [Google Scholar]
- Zuo XN, Kelly C, Di Martino A, Mennes M, Margulies DS, Bangaru S, … Milham MP (2010). Growing together and growing apart: regional and sex differences in the lifespan developmental trajectories of functional homotopy. J Neurosci, 30(45), 15034–15043. doi: 10.1523/JNEUROSCI.2612-10.2010 [DOI] [PMC free article] [PubMed] [Google Scholar]
Associated Data
This section collects any data citations, data availability statements, or supplementary materials included in this article.