

Abstract
Introduction
Ataxia-Telangiectasia (A-T) is a multi-system disorder that may be associated with endocrine changes, oxidative stress in addition to inflammation. Studies suggest that selenium is a trace element related to protection against damage caused by oxidative stress.
Objective
To describe the plasma levels of selenium and erythrocyte glutathione peroxidase activity in A-T patients and to relate them to oxidative stress and lipid status biomarkers.
Methods
This is a cross-sectional and controlled study evaluating 22 A-T patients (age median, 12.2 years old) matched by gender and age with 18 healthy controls. We evaluated: nutritional status, food intake, plasma selenium levels, erythrocyte glutathione peroxidase activity, lipid status, inflammation and oxidative stress biomarkers.
Results
Adequate levels of selenium were observed in 24/36 (66.7%) in this evaluated population. There was no statistically significant difference between the groups in selenium levels [47.6 μg/L (43.2–57.0) vs 54.6 (45.2–62.6) μg/dL, p = 0.242]. Nine of A-T patients (41%) had selenium levels below the reference value. The A-T group presented higher levels of LDL-c, non-HDL-c, oxidized LDL, Apo B, Apo-B/Apo-A-I1, LDL-c/HDL-c ratio, malondialdehyde [3.8 µg/L vs 2.8 µg/L, p = 0.029] and lower Apo-A-I1/HDL-c and glutathione peroxidase activity [7300 U/L vs 8686 U/L, p = 0.005]. Selenium levels were influenced, in both groups, independently, by the concentrations of oxidized LDL, malonaldehyde and non-HDL-c. The oxidized LDL (AUC = 0.849) and ALT (AUC = 0.854) were the variables that showed the greatest discriminatory power between groups.
Conclusion
In conclusion, we observed the presence of selenium below the reference value in nearly 40% and low GPx activity in A-T patients. There was a significant, inverse and independent association between selenium concentrations and oxidative stress biomarkers. Those data reinforce the importance of assessing the nutritional status of selenium in those patients.
Keywords: Ataxia-telangiectasia, Primary immunodeficiency, Dyslipidemia, Oxidative stress, Cardiovascular risk, Selenium
Introduction
Selenium (Se) is an essential micronutrient for antioxidant defense that integrates an important part of selenoproteins [1]. The most well-known selenoprotein is Glutathione peroxidase (GPx), which protects cells from damage caused by free radicals such as reactive oxygen species (ROS) [2, 3]. Seleniumblocks the activation of the nuclear transcription factor NFkB, a sensitive regulator that modulates the production of inflammatory mediators and adhesion molecules [4].
The trace element also stands out for its participation in immunological competence, particularly in cell-mediated immunity, cognitive function, and protection against cardiovascular diseases (CVDs) [5, 6].
Selenium, essentially needed for the biosynthesis of selenoproteins, e.g.GPx, that are involved in antioxidative defense systems and lipid metabolism. However, the associations between serum Se concentrations and the risk of dyslipidemia are still controversial in the literature [2].
Some scientific evidence has shown that Se deficiency occasionally increases the concentrations of total cholesterol (TC) [6] and triglycerides (TG) [7], elevating the risk of heart disease (HD), such as atherosclerosis, up to three times [8].
Ataxia-telangiectasia (A-T) or Louis–Bar syndrome is a rare, neurodegenerative, autosomal recessive disease causing severe disability. Ataxia refers to poor coordination and telangiectasia to small, dilated blood vessels, both of which are hallmarks of the disease. Some have an increased number of respiratory tract infections (ear infections, sinusitis, bronchitis, and pneumonia) and according to the new classification of innate immunity errors (IEI), patients with A-T are included in group two of genetic syndromes with immunological involvement [9].
Besides that, A-T is a rare disease (OMIM 208,900) in which incidence ranges from 1: 40,000 to 1: 100,000, and it is caused by a mutation in the ATM gene (ataxia-telangiectasia mutated). The change induces difficulty in repairing ruptures of double-stranded DNA, increases ROS production, mitochondrial dysfunction, with concomitant oxidative stress and consequent cell apoptosis [10, 11]. DNA damage, combined with oxidative stress, can contribute to the pathogenesis of associated chronic diseases, including atherosclerosis [12, 13].
Due to advances in the care of patients, different studies reveal increasing survival rates, with ensuing concern about the possible appearance of further associated diseases such as cardiovascular [14, 15]. Dyslipidemia, a component of the metabolic syndrome, is one of the greatest risk factors with an impact on atherogenesis, which increases the risk of coronary failure two to three times [8]. To date, few studies evaluated the risk of atherosclerosis in patients with A-T [16, 17]. Especially in A-T patients there are no studies on the association of selenium and lipid status biomarkers.
The present study aims to describe the plasma levels of selenium and erythrocyte glutathione peroxidase activity in A-T patients and to relate them to oxidative stress and lipid status biomarkers.
Methods
This is a cross-sectional controlled study evaluating 22 A-T patients of both genders, between 3 and 27 years of age, who were diagnosed with probable A-T (clinical phenotype classical) according to the criteria of the European Society for Immunodeficiencies (ESID) [18, 19].
The control group was recruited from a Primary Health Care Service and composed of 18 healthy volunteers matched by age and gender.
The Research Ethics Committee from the Federal University of São Paulo and financed by The São Paulo Research Foundation—FAPESP no 2015/13308-9.
The demographic, clinical, and treatment data were obtained from the patients’ charts. The family history risk of atherosclerosis was assessed for patients and controls.
At the time of sample collection, none of the subjects had an acute infectious disease, nor had they been using corticosteroids for at least 3 months; one patient was using antifungal drug and five were using antibiotics.
Anthropometric assessment and food intake
The anthropometric assessment involved measurements of weight, height, mid-upper arm circumference (MUAC), and skinfold thickness (tricipital, subscapular, bicipital, and sacroiliac) as proposed by the World Health Organization (WHO) and Frisancho (1990) [20, 21]. The patients who were unable to stand upright had their weight measured in the wheelchair, on a specific scale for wheelchair-users (Micheletti-capacity 1100 lbs—serial: 2,161,058). Recumbent height was measured with the patient lying on a flat and firm surface, using an inextensible tape graduated in centimeters.
To assess the body mass index (BMI) and height for age (H/A) of children and adolescents, expressed as Z-scores, the WHO [22] criteria and the classification proposed by De Onis et al. were adopted [23]. For adults, the cut-off point of the WHO for BMI was used [20]. The sum of skinfold thickness and MUAC was used to estimate children’s body composition [24–26]. While for adults, the estimation of body composition was based on the sum of the four different skinfolds [27]. The body fat percentage was classified according to Deurenberg et al. and Lohman [25, 26].
The pubertal stage was evaluated according to Marshall and Tanner [28].
The assessment of food intake was performed using a 24 h dietary recall (R24hs), applied 3 times, with an interval of 15 days between them. The calculation of nutrients was performed using the Software Dietwin®, comparing the cases to the controls [29, 30].
Considering that food composition tables available in some software do not have complete data on Se content in food, these data were included manually based on the article by Ferreira et al. [31]. Only one of A-T patients had feeding tubes.
Biochemical assessment
After 8-h fasting, blood was collected by peripheral venipuncture to analyze plasma selenium, erythrocyte glutathione peroxidase activity, lipid profile, apolipoproteins A-1 and B (Apo A-1, Apo B), oxidized LDL (LDLox), malondialdehyde (MDA), ultra-sensitive C-reactive protein (us-CRP), adiponectin, insulin, glucose, aspartate aminotransferase (AST), alanine transaminase (ALT), and gamma-glutamyl transpeptidase (Gamma GT).
All analyzes were performed using standard methods and good practice in clinical analysis. For determination of plasma selenium levels, the method used was atomic absorption spectrophotometry by graphite oven, with a detection limit of 1.0 mcg/L and linearity of 400.0 µg/L. The coefficient of variance was 0.8%. us-CRP was determined using the turbidimetric-immunological method (Roche). The measurement range is 1.0–200 mg/L. The variation coefficient was 1.3%. GPx activity was determined by the method based on that of Paglia and Valentine. (RANDOX). The method is linear up to a concentration of 925 U/L. The sensitivity was 75 U/L and the coefficient of variance was 3.4%. The lipid peroxidation was determined by the TBARS method (thiobarbituric acid-reactive substances) which is based on the reaction of malondialdehyde (MDA), a compound formed by the oxidation of lipids, with thiobarbituric acid (TBA) and is given in MDA equivalents, according to Satoh [32].
For classification of selenium levels, the cut-off point ≤ 46 µg/L was adopted for inadequacy. Glutathione peroxidase activity values lower than 4171 U/L were considered inadequate.
The lipid profile, including triglyceride, total cholesterol and high-density lipoprotein cholesterol (HDL-c) was measured by enzymatic-colorimetric tests. Low-density lipoprotein cholesterol (LDL-c) and very-low-density lipoprotein cholesterol (VLDL-c) were calculated using the formula by Friedewald et al. [33].
For classification, the cut-off points suggested by the American Academy of Pediatrics [34] and the National Cholesterol Education Program (NCEP) [35] were adopted. The presence of dyslipidemia was considered when the TC > 170 mg/dL for children/adolescents and > 200 mg/dL for adults and/or LDL-c > 110 mg/dL for children/adolescents and > 129 mg/dL for adults and/or triglycerides > 100 mg/dL for children/adolescents and > 150 mg/dL for adults and/or HDL-c < 35 mg/dL for children/adolescents, < 40 mg/dL for women and < 50 mg/dL for men.
The non-HDL-c (NHDL-c) values were obtained by subtracting the HDL-c rates from the TC levels and classified according to Bogalusa [36] and NCEP. The following atherogenic indices were also calculated: total cholesterol/ HDL-c, Apo B/Apo A-1, LDL-c/Apo B, LDL-c/HDL-c [37], HDL-c/Apo A-1 [38].
Apo A-1 and Apo B were measured using kits of turbidimetric methods for human Apo A-1 and Apo B (Roche, Indianapolis, IN, USA) and oxidized LDL, (ELISA)PRO (Wuhan Fine Biological Technology Co, Wuhan, China).
Glycemia was measured by enzymatic reference method with hexokinase, while insulin was quantified by electrochemiluminescence. Using the fasting glucose and insulin values, the HOMA-IR (Homeostasis Model Assessment of Insulin Resistance) rate was calculated utilizing the following formula: HOMA-IR = fasting glucose (mmol/L) × fasting insulin (µU/mL)/22.5. HOMA-IR was considerably elevated when > 3.16 [39].
To evaluate cardiovascular risk we consider inflammatory, oxidative stress and lipid status biomarkers.
Statistical analysis
The SPSS 25.0 statistical package was used for statistical analysis. In the descriptive and bivariate analysis, categorical variables were presented in absolute and percentage numbers, and compared using the Chi-square test or Fisher’s exact test. Most continuous variables showed a non-parametric distribution and was decided to present them as medians and interquartile intervals and compare them using the Mann–Whitney test. The correlation between glutathione peroxidase activity and selenium levels was evaluated with Spearman test (rho).
The area under the ROC curve (AUC) along with the corresponding 95% confidence interval (CI). One ROC curve was reported to assess the discriminatory power between the variables studied which had a difference between groups in the univariate analysis. Lastly, a multi-ROC curve was generated for evaluated the discriminatory power of variable related to oxidative stress (glutathione peroxidase activity, malondialdehyde levels and group) and lipid biomarkers (oxidized LDL, Non-HDL cholesterol, Apo A-1/HDL-c, Apo B/Apo A-1 and group) in relation to selenium levels (≤ 46 µg/L e > 46 µg/L).
For multivariate analysis was used linear regression (ENTER method) with selenium (logarithm) as the dependent variable. The independent variables included in the model were those that had clinical relevance and those that showed a statistically significant difference in the bivariate analysis, excluding those in which collinearity was detected (correlation > 0.8). Thus, the model was built with group, age, us C-reactive protein, oxidized LDL, malondialdehyde, apoliprotein B/apoliprotein A-1, glutathione peroxidase activity and alanine aminotransferase.
A p-value less than 0.05 was considered statistically significant.
Results
The general characteristics of patients with A-T are shown in Table 1. Among the evaluated patients, male gender predominated 16 (72.7%). The median of current age, the onset of symptoms and the time since diagnosis were 12.2 years (8.5–20.9), 12.0 months (6.0–12.0) and 7.1 (4.4–13.1) years, respectively. At the time of evaluation, 12 (54.5%) and 5 (22.7%) patients were using intravenous immunoglobulin and prophylactic antibiotic therapy. Three A-T patients (13.6%) had pneumopathy.
Table 1.
Characterization of A-T patients
| Variable | N = 22 | |
|---|---|---|
| Age | Years | 12.2 (8.5–20.9)a |
| Gender | Male | 16 (72.7%)b |
| Onset of symptoms | Months | 12.0 (6.0–12.0)a |
| Disease duration (since diagnosis) | Years | 7.1 (4.4–13.1)a |
| Regular intravenous immunoglobulin | Yes | 12 (54.5%)b |
| Pulmonar associated disease | Yes | 3 (13.6%)b |
| Prophylactic antibiotic | Yes | 5 (22.7%)b |
| Oral multivitamins | Yes | 17 (77.3%)b |
| Family history of early cardiovascular disease | Yes | 14 (63.6%)b |
| Alanine aminotransferase | > 40 U/L | 5 (22.7%)b |
| AST/ALT | > 1 | 17 (77.3%)b |
AST/ALT aspartate aminotransferase/alanine aminotransferase
aMedian (IQ25-75). IQ—interquartile interval
bN (%)
In Table 2 shows there was no difference between the groups regarding age, gender, pubertal stage and body mass index. There was also no difference between groups regarding socioeconomic status and per capita income (data not shown). In turn, the A-T group had lower abdominal waist and lean body mass compared to the control group.
Table 2.
Comparison of the variables: demographic, anthropometric, lipid status biomarkers, selenium, glutathione peroxidase activity, malondialdehyde, C-reactive protein of A-T patients and controls
| Variables | A-T patients (n = 22) |
Controls (n = 18) |
P-value | |
|---|---|---|---|---|
| Age | Years | 12.2 (8.5–20.9) | 15.8 (9.8–22.8) | 0.615a |
| Gender | Male | 16 (72.7%) | 13 (72.2%) | 0.972b |
| Prepubertal | Yes | 6 (27.3%) | 3 (16.7%) | 0.506b |
| Body mass index (kg/m2) | Underweight | 9 (40.9%) | 2 (11.1%) | 0.146b |
| Normal | 11 (50.0%) | 14 (77.8%) | ||
| Overweight | 2 (9.1%) | 2 (11.1%) | ||
| Waist circumference | cm | 60.0 (53.0–64.0) | 68.8 (61.0–79.0) | 0.004a |
| Lean body mass | kg | 24.8 (20.2–29.8) | 41.8 (31.0–50.4) | 0.001a |
| Dyslipidemia | Yes | 14 (63.6%) | 11 (78.6%) | 0.467b |
| Lipid profile | High CT | 13 (59.1%) | 4 (28.6%) | 0.097b |
| High LDL-c | 12 (54.4%) | 1 (7.1%) | 0.005b | |
| Low HDL-c | 4 (18.2%) | 6 (42.8%) | 0.140b | |
| High triglycerides | 5 (22.7%) | 1 (7.1%) | 0.370b | |
| High non-HDL-c | 13 (59.1%) | 2 (14.3%) | 0.014b | |
| Glycemia |
Elevate (> 100 mg/dL) |
1 (4.5%) | 1 (7.1%) | 0.633b |
| HOMA-IR |
Elevate (> 3.16) |
6 (27.3%) | 2 (14.3%) | 0.441b |
| Selenium |
Adequate (> 46 μg/L) |
13 (59.1%) | 11 (78.6%) | 0.292b |
| Glutathione peroxidase |
Adequate (> 4171 U/L) |
20 (90.9%) | 11 (78.6%) | 0.357b |
| Malondialdehyde |
High (≥ 3.46 nmol/mL) |
16 (72.7%) | 5 (35.7%) | 0.041b |
| C-reactive protein |
High (> 3 mg/L) |
8 (36.4%) | 1 (7.1%) | 0.062b |
Laboratory variables in control group (N = 14)
Significance level of: aMann-Whitney test, Median (IQ25-75). bChi-square test, N (%)
CT, total cholesterol; LDL-c, low density lipoprotein cholesterol; HDL-c, high density lipoprotein cholesterol; NHDL-c, Non-HDL-c; HOMA-IR, homeostasis model assessment of insulin resistance
Adequate levels of selenium were observed in 24/36 (66.7%) in this evaluated population. There was no statistically significant difference between the groups in selenium levels, either in stratified (Adequate, > 46 μg/L: 59.1% vs 78.6%, p = 0.292) or continuous form [47.6 μg/L (43.2–57.0) vs 54.6 (45.2–62.6) μg/L, p = 0.242] (Table 2 and Table 3). The A-T group showed a higher percentage of inadequacy for LDL-c (54.4% vs 7.1%, p = 0.005), non-HDL-c (59.1% vs 14.3%, p = 0.014) and malondialdehyde serum levels (72.7% vs 35.7%, p = 0.041) (Table 2). More than 60% of A-T patients had dyslipidemia. There was no correlation between AFP concentrations and lipid status biomarkers (data not shown).
Table 3.
Comparison of biochemical variables of A-T patients and controls
| Variables | Units | A-T patients (n = 22) |
Controls (n = 18) |
P-value | ||
|---|---|---|---|---|---|---|
| Lipid status biomarkers | ||||||
| Total cholesterol | mg/dL | 188.5 (168.0–228.0) | 164.0 (124.0–172.0) | 0.005 | ||
| LDL-c | mg/dL | 124.4 (105.4–166.0) | 89.5 (67.0–105.6) | < 0.001 | ||
| Triglycerides | mg/dL | 90.5 (66.0–115.0) | 77.5 (63.0–94.0) | 0.231 | ||
| HDL-c | mg/dL | 47.5 (42.0–61.4) | 46.0 (35.0–56.0) | 0.549 | ||
| Non-HDL-c | mg/dL | 136.5 (120.0–182.0) | 108.0 (79.0–125.0) | 0.001 | ||
| VLDL-c | mg/dL | 18.1 (13.2–23.0) | 15.5 (12.6–18.8) | 0.231 | ||
| Remnant cholesterol | mg/dL | 18.2 (13.2–23.0) | 15.6 (12.6–18.8) | 0.221 | ||
| Oxidized LDL | mg/dL | 72.6 (42.6–137.0) | 25.8 (21.1–40.7) | < 0.001 | ||
| Apolipoprotein A-1 | mg/dL | 99.0 (87.0–117.0) | 122.0 (92.0–138.0) | 0.070 | ||
| Apoliprotein B | mg/dL | 109.5 (96.0–138.0) | 91.0 (78.0–101.0) | 0.002 | ||
| Apoliprotein B/Apoliprotein A-1 | 1.1 (0.7–1.5) | 0.7 (0.5–0.8) | 0.001 | |||
| Total cholesterol/HDL-c | 4.0 (3.0–5.0) | 3.0 (3.0–4.0) | 0.080 | |||
| LDL-c/Apoliprotein B | 1.1 (1.0–1.2) | 1.1 (0.9–1.1) | 0.549 | |||
| LDL-c/ HDL-c | 2.5 (2.0–4.0) | 2.0 (1.0–2.0) | 0.021 | |||
| Triglycerides/HDL-c | 2.0 (1.0–3.0) | 1.0 (1.0–3.0) | 0.279 | |||
| Apoliprotein A-1/HDL-c | 1.9 (1.8–2.1) | 2.5 (2.2–2.7) | 0.008 | |||
| Oxidative stress and inflammatory biomarkers | ||||||
| Glutathione peroxidase | U/L | 7300 (6683–8267) | 8686 (7967–9449) | 0.005 | ||
| Selenium | µg/L | 47.6 (43.2–57.0) | 54.6 (45.2–62.6) | 0.242 | ||
| Malondialdehyde | nmol/mL | 3.8 (3.0–4.0) | 2.8 (2.4–3.6) | 0.029 | ||
| C-reactive protein | mg/L | 1.0 (0.3–9.8) | 0.65 (0.3–1.6) | 0.116 | ||
| Adiponectin | mg/dL | 156.9 (125.5–234.6) | 180.4 (173.1–183.9) | 0.355 | ||
| Glucose metabolism biomarkers | ||||||
| Blood glucose | mg/dL | 85 (77.0–88.5) | 83.0 (77.2–90.0) | 0.810 | ||
| Insulin | uU/mL | 6.1 (2.5–11.6) | 7.4 (3.6–10.6) | 0.870 | ||
| HOMA-IR | 1.1 (0.4–3.4) | 1.2 (0.7–2.0) | 0.891 | |||
| Liver enzymes | ||||||
| Aspartate aminotransferase | U/L | 31.0 (25.0–47.0) | 17.0 (14.0–19.0) | < 0.001 | ||
| Alanine aminotransferase | U/L | 21.0 (13.0–32.0) | 9.5 (9.0–13.0) | < 0.001 | ||
| Gamma-glutamyl transpeptidase | U/L | 27.7 (14.3–66.7) | 14.6 (10.1–17.4) | 0.011 | ||
Laboratory variables in control group (N = 14)
Significance level of Mann–Whitney test, Median (IQ25-75)
LDL-c, low density lipoprotein cholesterol; HDL-c, high density lipoprotein cholesterol; VLDL-c, very low density lipoprotein cholesterol; HOMA-IR, homeostasis model assessment of insulin resistance
Table 3 compared the markers of the lipid profile, oxidative stress, inflammatory and serum levels of liver enzymes between the groups. The A-T group presented, in comparison to the control group, higher levels of LDL-c, non-HDL-c, oxidized LDL, Apo B, Apo B/Apo A-1, LDL-c/HDL-c ratio and lower Apo A-1/HDL-c. It was also observed that the A-T group had lower levels of glutathione peroxidase activity [7300 U/L (6683–8267) vs 8686 U/L (7967–9449), p = 0.005], higher malondialdehyde [3.8 µg/L (3.0–4.0) vs 2.8 µg/L (2.4–3.6), p = 0.029] and liver enzymes.
There was no statistically significant correlation between selenium levels and glutathione peroxidase activity in the whole group (rho = 0.161, p = 0.347), A-T group (rho = 0.048, p = 0.832) and control group (rho = − 0.011, p = 0.970).
As shown in the ROC curve (Fig. 1), oxidized LDL (AUC = 0.849, 95% CI 0.725–0.973) and ALT (AUC = 0.854, 95% CI 0.732–0.976) were the variables that showed the greatest discriminatory power between groups.
Fig. 1.

Discriminatory analysis using the ROC curve of the biochemical variables evaluated in A-T patients and the control group
Through linear regression that included in the model: group (A-T), age (years), ALT (U/L), C-reactive protein (mg/L), non-HDL-c (mg/dL), Apo B ratio/Apo A-1, malondialdehyde (nmol/L), glutathione peroxidase activity (U/L) and oxidized LDL (mg/dL), it was found that selenium levels were influenced, in both groups, independently only by the concentrations of oxidized LDL, malonaldehyde and non-HDL-c (Table 4).
Table 4.
Biochemical variables associated to selenium levels in A-T patients and controls (n = 36)
| Variables | B | P-value | Confidence interval 95% | ||
|---|---|---|---|---|---|
| Malondialdehyde (log) | nmol/L | − 0.583 | 0.001 | − 0.909 | − 0.258 |
| LDL-oxidized (log) | mg/dL | − 0.180 | 0.021 | − 0.331 | − 0.030 |
| Glutathione peroxidase (log) | U/L | − 0.166 | 0.175 | − 0.410 | 0.078 |
| Apo B/Apo A-1 | − 0.057 | 0.154 | − 0.138 | 0.023 | |
| Group | AT | − 0.035 | 0.499 | − 0.138 | 0.069 |
| Age | Years | − 0.002 | 0.420 | − 0.008 | 0.003 |
| Non-HDL-c | mg/dL | 0.002 | 0.003 | 0.001 | 0.003 |
| C-reactive protein (log) | mg/L | 0.006 | 0.833 | − 0.049 | 0.060 |
| Alanine aminotransferase (log) | U/L | 0.100 | 0.161 | − 0.043 | 0.243 |
R2 = 0.548
Dependent variable: selenium μg/L (log—logarithmic)
The area under the multi-ROC curve for variables related to oxidative stress and lipid biomarkers in relation to selenium levels was 0.736 (95% CI 0.559–0.913) and 0.753 (95% CI 0.570–0.937), which is an acceptable level of discrimination (Fig. 2a, b).
Fig. 2.
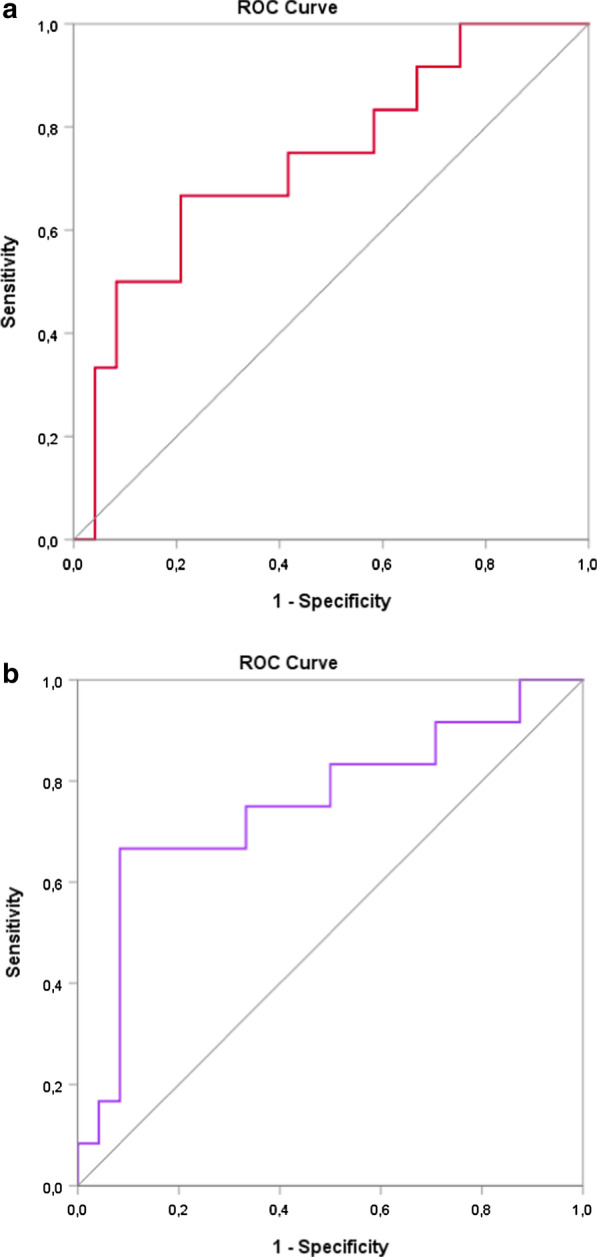
Discriminatory analysis using a multivariate ROC analysis of variables related to oxidative stress (a) and lipid status (b) with selenium levels (≤ 46 µg/L or > 46 µg/L)
A lower intake of energy, protein, carbohydrate was observed in A-T group, compared to control group. The intake of polyunsaturated, monounsaturated, trans fat and selenium was lower in A-T group (Table 5).
Table 5.
Comparison of the means of energy, macronutrients, and micronutrients intake in A-T patients and controls
| A-T patients N = 22 |
Controls N = 18 |
P-value | |
|---|---|---|---|
| Energy (Kcal) |
1522.4 (1233.8–1673.1) |
1744.1 (1431.0–2333.2) |
0.031 |
| Carbohydrate (g) |
211.1 (187.8–249.6) |
255.4 (218.4–354.3) |
0.029 |
| Protein (g) |
60.3 (51.2–68.2) |
76.8 (60.3–93.2) |
0.010 |
| Total fat (g) |
42.5 (37.2–47.3) |
44.1 (38.4–60.1) |
0.127 |
| Saturated fat (g) |
13.9 (10.8–16.7) |
17.1 (12.4–23.7) |
0.068 |
| Monounsaturated fat (g) |
10.3 (6.3–11.6) |
12.2 (11.2–15.4) |
0.007 |
| Polyunsaturated fat (g) |
5.6 (4.0–7.6) |
9.8 (6.6–13.5) |
0.001 |
| Trans fat (g) |
0.5 (0.3–0.7) |
0.9 (0.7–1.9) |
0.006 |
| Copper (mg) |
0.6 (0.5–0.8) |
0.6 (0.5–0.8) |
0.913 |
| Selenium (µg) |
56.1 (43.2–66.0) |
68.8 (63.0–80.1) |
0.016 |
| Zinc (mg) |
7.1 (5.9–8.9) |
6.0 (4.5–7.1) |
0.074 |
| Retinol (µg) |
249.5 (176.8–395.0) |
208.9 (150.5–247.2) |
0.772 |
| Ascorbic acid (mg) |
74.6 (57.3–100.7) |
57.6 (52.4–77.2) |
0.142 |
Significance level of Mann–Whitney test, Median (IQ25-75)
Discussion
The present study showed that selenium concentrations did not differ significantly between patients and controls. However, it must be pointed out that 41% of A-T patients had selenium concentrations below the reference value. MDA levels were higher and GPx activity lower in A-T patients compared to controls. Also A-T patients had an atherogenic lipid status.
To our knowledge, there are no current publications evaluating the association between selenium levels and GPx activity with lipid status biomarkers in A-T patients. In vitro study show that A-T cells are under a continuous oxidative stress and have an abnormal response to agents inducing this state [40]. Oxidative stress is a central mechanism in the pathogenesis of the disease, especially neurodegeneration [41] and other morbidities, such as liver disorders and dyslipidemias [16, 42].
An experimental study by Mercer et al. [43] demonstrated that ATM protein deficiency accelerates the atherosclerotic process via systemic effects (regulation of NF-κB expression) and on the vascular endothelium. The authors concluded that damage to mitochondrial DNA, increased production of free radicals and reduced oxidative phosphorylation, effects which are directly related to changes in lipid and glucose metabolism and present in A-T patients.
Squadrone et al. [44] evaluated the concentrations of trace elements, including selenium and the antioxidant enzymes, in 16 A-T patients and controls. They also found no differences in selenium levels, similarly to what we found in this study. In our study, GPx activity were lower in A-T patients; a finding not observed by Squadrone et al. The synthesis and activity of glutathione can be reduced when there is malnutrition, hyperglycemia, corticotherapy, skeletal muscle inactivity; situations frequently observed in A-T patients [45]. Some hypotheses may explain the higher MDA values and the lower GPx activity, pointing to an oxidative stress in our patients: (a) older age (median 12.2 years) (b) a significant change in liver enzymes, malnutrition, and impaired lean mass variables not mentioned in the study by Squadrone et al.
In this study A-T patients demonstrated an atherogenic profile, with emphasis on elevating NHDL-c and LDLox. LDL-c is easily susceptible to oxidation under conditions of oxidative stress, as confirmed in our study by the elevation of MDA (lipid peroxidation marker) and reduction of GPx activity in A-T patients; LDLox has some atherogenic characteristics. A recent metanalysis and systematic review described, based on observational studies, the association between LDLox concentrations and the development of atherosclerotic disease [46].
The findings of lower selenium intake in the A-T group combined with about 40% of serum levels below the reference value may complicate the neurodegeneration. Se is vital for the central nervous system and it is involved in various functions, such as motor performance, coordination, memory and cognition. The role of Se and selenoproteins in neurotransmission goes beyond their antioxidant properties and involves the regulation of inflammation. Furthermore, it plays a direct role in signaling by means of selenoprotein P and its interaction with 2 synaptic post receptors of Apolipoprotein (ApoER2) [47]. Future studies evaluating the role of selenium in neurodegeneration-related outcomes in A-T patients appear promising.
Regarding the association of selenium with total cholesterol and LDL-c, some studies show a direct association in the general population [48, 49], while others display a negative correlation [50, 51] or no association at all [52]. This inconsistency may be due to the sample size or even the lack of adjustment for confounding variables. In our study, we observed, after linear regression, that selenium levels were independent and inversely associated, in both groups, with concentrations of oxidized LDL, malonaldehyde and directly with non-HDL-c (Table 4).
An acceptable level of discrimination for variables related to oxidative stress and lipid status in relation to selenium levels emphasizes the importance of future studies assessing the impact of selenium supplementation on A-T patients.
In conclusion, we observed the presence of selenium below the reference value in nearly 40% and low GPx activity in A-T patients.
There was a significant, inverse and independent association between selenium concentrations and oxidative stress biomarkers. Those data reinforce the importance of assessing the nutritional status of selenium in those patients.
Acknowledgements
This paper is dedicated to the memory of Beatriz Tavares Costa-Carvalho.
Abbreviations
- AFP
Alpha-fetoprotein
- ALT
Alanine transaminase
- Apo B
Apolipoproteins B
- Apo-A1
Apolipoproteins A-1
- AST
Aspartate aminotransferase
- A-T
Ataxia-telangiectasia
- ATM
Ataxia-telangiectasia mutated
- BMI
Body mass index
- CVDs
Cardiovascular diseases
- FAPESP
São Paulo Research Foundation
- GGT
Gamma-glutamyl transpeptidase
- GPx
Glutathione peroxidase activity
- H/A
Height for age
- HD
Heart disease
- HDL-c
High-density lipoprotein cholesterol
- HOMA-IR
Homeostasis Model Assessment of Insulin Resistance
- IEI
Inborn errors of immunity
- IQ
Interqartile interval
- IVIG
Intravenous immunoglobulin
- LDL-c
Low-density lipoprotein cholesterol
- LDLox
Oxidized LDL
- MDA
Malondialdehyde
- MUAC
Mid-upper arm circumference
- NCEP
National Cholesterol Education Program
- NFkB
Nuclear transcription factor
- NHDL-c
Non-HDL-c
- ROS
Reactive oxygen species
- Se
Selenium
- TC
Total cholesterol
- TG
Triglycerides
- us-CRP
Ultra-sensitive C-reactive protein
- VLDL-c
Very-low-density lipoprotein cholesterol
Authors’ contributions
IGAA: collected, analyzed and interpreted data from patients A-T and the control group and was a major contributor in writing the manuscript. FISS: analyzed and interpreted data from patients A-T and the control group and contributed to the correction of the manuscript writing. FLAF: performed the analysis of laboratory tests and contributed to the correction of the manuscript writing. CSAL: analyzed and interpreted data from patients A-T and the control group and contributed to the correction of the manuscript writing. ROSS: analyzed and interpreted data from patients A-T and the control group and was a major contributor in writing the manuscript. All authors read and approved the final manuscript.
Funding
The study was financed by The São Paulo Research Foundation—FAPESP nº 2015/13308-9. The Foundation FAPESP did not influence in the design of the study and collection, analysis, and interpretation of data or the writing of the manuscript.
Availability of data and materials
The datasets used and/or analysed during the current study are available from the corresponding author on reasonable request.
Ethics approval and consent to participate
The study was approved by The Research Ethics Committee from the Federal University of São Paulo (CEP/UNIFESP—972.812 11/03/2015) and signed informed consents were obtained from all participants (or a responsible guardian in the case of children).
Consent for publication
Not applicable.
Competing interests
The authors declare that they have no competing interests.
Footnotes
Publisher's Note
Springer Nature remains neutral with regard to jurisdictional claims in published maps and institutional affiliations.
Contributor Information
Itana Gomes Alves Andrade, Email: itanaandrade@yahoo.com.br.
Fabíola Isabel Suano-Souza, Email: fsuano@gmail.com.
Fernando Luiz Affonso Fonseca, Email: profferfonseca@gmail.com.
Carolina Sanchez Aranda Lago, Email: carolaaranda@yahoo.com.br.
Roseli Oselka Saccardo Sarni, Email: roseli.sarni@fmabc.br.
References
- 1.Cardoso BR, Ganio K, Roberts BR. Expanding beyond ICP-MS to better understand selenium biochemistry. Metallomics. 2019;11(12):1974–1983. doi: 10.1039/c9mt00201d. [DOI] [PubMed] [Google Scholar]
- 2.Rayman MP. Selenium intake, status, and health: a complex relationship. Hormones. 2020;19:9–14. doi: 10.1007/s42000-019-00125-5. [DOI] [PMC free article] [PubMed] [Google Scholar]
- 3.Avery JC, Hoffmann PR. Selenium, selenoproteins, and immunity. Nutrients. 2018;10(9):1203. doi: 10.3390/nu10091203. [DOI] [PMC free article] [PubMed] [Google Scholar]
- 4.Lopes Junior E, Leite HP, Konstantyner T. Selenium and selenoproteins: from endothelial cytoprotection to clinical outcomes. Transl Res. 2019;208:85–104. doi: 10.1016/j.trsl.2019.01.004. [DOI] [PubMed] [Google Scholar]
- 5.Ju W, Ji M, Li X, Li Z, Wu G, Fu X, et al. Relationship between higher serum selenium level and adverse blood lipid profile. Clin Nutr. 2018;37(5):1512–1517. doi: 10.1016/j.clnu.2017.08.025. [DOI] [PubMed] [Google Scholar]
- 6.Benstoem C, Goetzenich A, Kraemer S, Borosch S, Manzanares W, Hardy G, et al. Selenium and its supplementation in cardiovascular disease–what do we know? Nutrients. 2015;7(5):3094–3118. doi: 10.3390/nu7053094. [DOI] [PMC free article] [PubMed] [Google Scholar]
- 7.Huang YQ, Shen G, Lo K, Huang JY, Liu L, Chen CL, et al. Association of circulating selenium concentration with dyslipidemia: results from the NHANES. J Trace Elem Med Biol. 2020;58:126438. doi: 10.1016/j.jtemb.2019.126438. [DOI] [PubMed] [Google Scholar]
- 8.Oliveira JED, Marchini JS. Ciências nutricionais. São Paulo: Sarvier; 1998. p. 403. [Google Scholar]
- 9.Bousfiha A, Jeddane L, Picard C, Al-Herz W, Ailal F, Chatila T, et al. Human Inborn Errors of immunity: 2019 update of the IUIS phenotypical classification. J Clin Immunol. 2020;40(1):66–81. doi: 10.1007/s10875-020-00758-x. [DOI] [PMC free article] [PubMed] [Google Scholar]
- 10.Pallardó FV, Lloret A, Lebel M, d'Ischia M, Cogger VC, Le Couteur DG, et al. Mitochondrial dysfunction in some oxidative stress-related genetic diseases: Ataxia-Telangiectasia, Down Syndrome, Fanconi Anaemia and Werner Syndrome. Biogerontology. 2010;11(4):401–419. doi: 10.1007/s10522-010-9269-4. [DOI] [PubMed] [Google Scholar]
- 11.Van Houten B, Woshner V, Santos JH. Role of mitochondrial DNA in toxic responses to oxidative stress. DNA Repair. 2006;5(2):145–152. doi: 10.1016/j.dnarep.2005.03.002. [DOI] [PubMed] [Google Scholar]
- 12.Malekmohammad K, Sewell RDE, Rafieian-Kopaei M. Antioxidants and atherosclerosis: mechanistic aspects. Biomolecules. 2019;9(8):301. doi: 10.3390/biom9080301. [DOI] [PMC free article] [PubMed] [Google Scholar]
- 13.Liguori I, Russo G, Curcio F, Bulli G, Aran L, Della-Morte D, et al. Oxidative stress, aging, and diseases. Clin Interv Aging. 2018;13:757–772. doi: 10.2147/CIA.S158513. [DOI] [PMC free article] [PubMed] [Google Scholar]
- 14.Swift M. Genetic aspects of ataxia-telangiectasia. Immunodefic Rev. 1990;2(1):67–81. [PubMed] [Google Scholar]
- 15.Klockgether T, Dichgans J. The genetic basis of hereditary ataxia. Prog Brain Res. 1997;114(1):569–576. doi: 10.1016/s0079-6123(08)63387-7. [DOI] [PubMed] [Google Scholar]
- 16.Andrade IGA, Costa-Carvalho BT, da Silva R, Hix S, Kochi C, Suano-Souza FI, Sarni ROS. Risk of atherosclerosis in patients with Ataxia telangiectasia. Ann Nutr Metab. 2015;66(4):196–201. doi: 10.1159/000430790. [DOI] [PubMed] [Google Scholar]
- 17.Chessa L, Ruggieri M, Polizzi A. Progress and prospects for treating ataxia telangiectasia. Expert Opin Orphan Drugs. 2019;7(5):233–251. doi: 10.1080/21678707.2019.1623022. [DOI] [Google Scholar]
- 18.European Society For Immunodeficiencies [homepage na Internet]. Diagnostic Criteria for Primary Immunodeficiencies. http://www.esid.org. Accessed 26 Oct 2018.
- 19.Rothblum-Oviatt C, Wright J, Lefton-Greif MA, McGrath-Morrow SA, Crawford TO, Lederman HM. Ataxia telangiectasia: a review. Orphanet J Rare Dis. 2016;11(1):159. doi: 10.1186/s13023-016-0543-7. [DOI] [PMC free article] [PubMed] [Google Scholar]
- 20.World Health Organization. Physical status: the use and interpretation of anthropometry: report of a WHO Expert Committee, vol 854. Geneva; 1995. p. 1–452 (Technical Report Series). [PubMed]
- 21.Frisancho AR. Anthropometric standards for the assessment of growth and nutritional status. Ann Arbor: The University of Michigan Press; 1990. p. 189. [Google Scholar]
- 22.World Health Organization (WHO). Growth reference data for 5–19 years. 2007. http://www.who.int/growthref/who2007_bmi_for_age/en/index.html.
- 23.De Onis M, Onyango AW, Borghi E, Siyam A, Nishida C, Siekmann J. Development of a WHO growth reference for school-aged children and adolescents. Bull World Health Organ. 2007;85(9):660–667. doi: 10.2471/blt.07.043497. [DOI] [PMC free article] [PubMed] [Google Scholar]
- 24.Slaughter MH, Lohman TG, Boileau RA, Horswill CA, Stillman RJ, Van Loan MD, et al. Skinfold equations for estimation of body fatness in children and youth. Hum Biol. 1988;60:709–723. [PubMed] [Google Scholar]
- 25.Deurenberg P, Pieters JJ, Hautuast JG. The assessment of the body fat percentage by skinfold thickness measurement in childhood young adolescent. Br J Nutr. 1990;63(2):293–303. doi: 10.1079/bjn19900116. [DOI] [PubMed] [Google Scholar]
- 26.Lohman TG. Advances in body composition assessment: current issues in exercises science. Illinois: Human Kinetic Publisher; 1992. [Google Scholar]
- 27.Durnin JV, Womersley J. Body fat assessed from total body density and its estimation from skinfold thickness: measurements on 481 men and women aged from 16 to 72 years. Br J Nutr. 1974;32(1):77–97. doi: 10.1079/bjn19740060. [DOI] [PubMed] [Google Scholar]
- 28.Marshall WA, Tanner JM. Variations in pattern of pubertal changes in girls and boys. Arch Dis Child. 1970;45(239):13–23. doi: 10.1136/adc.45.239.13. [DOI] [PMC free article] [PubMed] [Google Scholar]
- 29.Cavalcante AAM, Priore SE, Franceschini SCC. Food consumption studies: general methodological aspects and its use in the evaluation of children and adolescents aged. Rev Bras Saude Mater Infant. 2004;4(3):229–240. doi: 10.1590/S1519-38292004000300002. [DOI] [Google Scholar]
- 30.Bueno AL, Czepielewski MA. The 24 hours recall for the assessment of dietary calcium, phosphorus and vitamin D intakes in stunted children and adolescents. Rev Nutr Camp. 2010;23(1):65–73. doi: 10.1590/S1415-52732010000100008. [DOI] [Google Scholar]
- 31.Ferreira KS, Gomes JC, Bellato CR, Jordão CP. Concentrações de selênio em alimentos consumidos no Brasil. Rev Panam de Salud Pública. 2002;11(3):172–177. doi: 10.1590/S1020-49892002000300006. [DOI] [PubMed] [Google Scholar]
- 32.Satoh K. Serum lipid peroxide in cerebrovascular disorders determined by a new colorimetric method. Clin Chim Acta. 1978;90(1):37–43. doi: 10.1016/0009-8981(78)90081-5. [DOI] [PubMed] [Google Scholar]
- 33.Friedewald WT, Levy RI, Fredrickson DS. Estimation of the concentration of low-density lipoprotein cholesterol in plasma, without use of the preparative ultracentrifuge. Clin Chem. 1972;18(6):499–502. doi: 10.1093/clinchem/18.6.499. [DOI] [PubMed] [Google Scholar]
- 34.Daniels SR, Greer FR, Committee on Nutrition Lipid screening and cardiovascular health in childhood. Pediatrics. 2008;122(1):198–208. doi: 10.1542/peds.2008-1349. [DOI] [PubMed] [Google Scholar]
- 35.National Cholesterol Education Program (US) Expert Panel on Detection and Treatment of High Blood Cholesterol in Adults Third Report of the National Cholesterol Education Program (NCEP) Expert Panel on Detection, Evaluation and Treatment of High Blood Cholesterol in Adults (Adult Treatment Panel III) final report. Circulation. 2002;106(25):3143–3421. doi: 10.1161/circ.106.25.3143. [DOI] [PubMed] [Google Scholar]
- 36.Srinivasan SR, Frontini MG, Xu J, Berenson GS. Utility of childhood non-high-density lipoprotein cholesterol levels in predicting adult dyslipidemia and other cardiovascular risks: the Bogalusa Heart Study. Pediatrics. 2006;118(1):201–206. doi: 10.1542/peds.2005-1856. [DOI] [PubMed] [Google Scholar]
- 37.Elcarte R, Villa I, Sada J, Gasco M, Oyarzabal M, Sola A. Estúdio de Navarra PECNA Hiperlipidemias V. ¿Cuál es la mejor definición de hiperlipidemia en la edad infanto-juvenil? An Esp Pediatr. 1993;38(4):317–322. [PubMed] [Google Scholar]
- 38.Dasgupta S, Demirci FY, Dressen AS, Kao AH, Rhew EY, Goldman-Ramsey R, et al. Association analysis of PON2 genetic variants with paraoxonase activity and systemic lupus erythematosus. BMC Med Genet. 2011;12(7):1–9. doi: 10.1186/1471-2350-12-7. [DOI] [PMC free article] [PubMed] [Google Scholar]
- 39.Keskin M, Kurtoglu S, Kendirci M, Atabek ME, Yazici C. Homeostasis model assessment is more reliable than the fasting glucose/insulin ratio and quantitative insulin sensitivity check index for assessing insulin resistance among obese children and adolescents. Pediatrics. 2005;115(4):e500–e503. doi: 10.1542/peds.2004-1921. [DOI] [PubMed] [Google Scholar]
- 40.Watters DJ. Oxidative stress in ataxia telangiectasia. Redox Rep. 2003;8(1):23–29. doi: 10.1179/135100003125001206. [DOI] [PubMed] [Google Scholar]
- 41.Liu Z, Zhou T, Ziegler AC, Dimitrion P, Zuo L. Oxidative stress in neurodegenerative diseases: from molecular mechanisms to clinical applications. Oxid Med Cell Longev. 2017;2017:2525967. doi: 10.1155/2017/2525967. [DOI] [PMC free article] [PubMed] [Google Scholar]
- 42.Paulino TL, Rafael MN, Hix S, Shigueoka DC, Ajzen SA, Kochi C, et al. Is age a risk factor for liver disease and metabolic alterations in ataxia Telangiectasia patients? Orphanet J Rare Dis. 2017;12(1):136. doi: 10.1186/s13023-017-0689-y. [DOI] [PMC free article] [PubMed] [Google Scholar]
- 43.Mercer JR, Cheng KK, Figg N, Gorenne I, Mahmoudi M, Griffin J, et al. DNA damage links mitochondrial dysfunction to atherosclerosis and the metabolic syndrome. Circ Res. 2010;107(8):1021–1031. doi: 10.1161/CIRCRESAHA.110.218966. [DOI] [PMC free article] [PubMed] [Google Scholar]
- 44.Squadrone S, Brizio P, Mancini C, Pozzi E, Cavalieri S, Abete MC, Brusco A. Blood metal levels and related antioxidant enzyme activities in patients with ataxia telangiectasia. Neurobiol Dis. 2015;81:162–167. doi: 10.1016/j.nbd.2015.04.001. [DOI] [PubMed] [Google Scholar]
- 45.Kim SH, Johnson VJ, Shin TY, Sharma RP. Selenium attenuates lipopolysaccharide-induced oxidative stress responses through modulation of p38 MAPK and NF-kappaB signaling pathways. Exp Biol Med (Maywood) 2004;229(2):203–213. doi: 10.1177/153537020422900209. [DOI] [PubMed] [Google Scholar]
- 46.Gao S, Zhao D, Wang M, Zhao F, Han X, Qi Y, Liu J. Association between circulating oxidized LDL and atherosclerotic cardiovascular disease: a meta-analysis of observational studies. Can J Cardiol. 2017;33(12):1624–1632. doi: 10.1016/j.cjca.2017.07.015. [DOI] [PubMed] [Google Scholar]
- 47.Solovyev ND. Importance of selenium and selenoprotein for brain function: from antioxidant protection to neuronal signalling. J Inorg Biochem. 2015;153:1–12. doi: 10.1016/j.jinorgbio.2015.09.003. [DOI] [PubMed] [Google Scholar]
- 48.Liu A, Xu P, Gong C, Zhu Y, Zhang H, Nie W, et al. High serum concentration of selenium, but not calcium, cobalt, copper, iron, and magnesium, increased the risk of both hyperglycemia and dyslipidemia in adults: a health examination center based cross-sectional study. J Trace Elem Med Biol. 2020;59:126470. doi: 10.1016/j.jtemb.2020.126470. [DOI] [PubMed] [Google Scholar]
- 49.González-Estecha M, Palazón-Bru I, Bodas-Pinedo A, Trasobares E, Palazón-Bru A, Fuentes M, et al. Relationship between serum selenium, sociodemographic variables, other trace elements and lipid profile in an adult Spanish population. J Trace Elem Med Biol. 2017;43:93–105. doi: 10.1016/j.jtemb.2016.12.002. [DOI] [PubMed] [Google Scholar]
- 50.Rad EY, Falahi E, Saboori S, Asbaghi O, Birjandi M, Hesami S, et al. Effect of selenium supplementation on lipid profile levels: an updated systematic review and meta-analysis of randomized controlled clinical trials. Obes Med. 2019;15:100113. doi: 10.1016/j.obmed.2019.100113. [DOI] [Google Scholar]
- 51.Rayman MP, Stranges S, Griffin BA, Pastor-Barriuso R, Guallar E. Effect of supplementation with high selenium yeast on plasma lipids. Ann Inter Med. 2011;154(10):656–665. doi: 10.7326/0003-4819-154-10-201105170-00005. [DOI] [PubMed] [Google Scholar]
- 52.Rees K, Hartley L, Day C, Flowers N, Clarke A, Stranges S. Selenium supplementation for the primary prevention of cardiovascular disease. Cochrane Database Syst Rev. 2013;1:CD009671. doi: 10.1002/14651858.CD009671.pub2. [DOI] [PMC free article] [PubMed] [Google Scholar]
Associated Data
This section collects any data citations, data availability statements, or supplementary materials included in this article.
Data Availability Statement
The datasets used and/or analysed during the current study are available from the corresponding author on reasonable request.