

SUMMARY
The release of dopamine (DA) regulates rewarding behavior and motor actions through striatum-targeting efferents from ventral tegmental area (VTA) and substantia nigra pars compacta (SNc). Here, we map and functionally characterize axonal projections from oxytocin neurons in the hypothalamic paraventricular nucleus to midbrain DA regions. Electrophysiological recordings of DA neurons reveal that both the application of oxytocin and optogenetic stimulation of oxytocinergic terminals suffice to increase DA neuron activity in the VTA, but downregulate it in SNc. This biased modulation is mediated by oxytocin and vasopressin G protein-coupled receptors. Oxytocin release directly activates DA neurons and indirectly inhibits them through local GABA neurons, but the relative magnitudes of the two mechanisms differ in VTA and SNc. Oxytocin-modulated DA neurons give rise to canonical striatal projections. Since hypothalamic oxytocinergic projections also target the striatum, oxytocin is poised to bias the balance of DA tone through multiple sites in vertebrate reward circuits.
Keywords: Oxytocin, dopamine, VTA, SNc
INTRODUCTION
In the vertebrate basal ganglia, timed release of the neuromodulator dopamine (DA) supports complex, goal-directed actions (Bromberg-Martin et al., 2010; Schultz, 2007; Wise, 2004). The majority of midbrain neurons that produce DA reside in the ventral tegmental area (VTA) and substantia nigra pars compacta (SNc). The core projections of VTA DA neurons target ventral striatal (vStr) areas, subserving reward-based learning, while SNc DA neurons primarily target motor action-associated dorsal striatum (dStr). Genetically guided tracing experiments have facilitated the identification of input and output wiring of DA neurons in the VTA and SNc (Beier et al., 2015; Lerner et al., 2015; Watabe-Uchida et al., 2012). The results of functional experiments, including calcium imaging of DA terminals, further support the preferential links of VTA DA signaling to reward and SNc-derived DA tone to locomotion (Howe and Dombeck, 2016).
Oxytocin (Oxt) is synthesized and released by neurons of the hypothalamic paraventricular nucleus (PVN) and supraoptic nucleus (SON). This neuropeptide and hormone is linked to the reward system through its effects on social behaviors including social reward, social learning, pair bond formation, parenting, and mating (Gimpl and Fahrenholz, 2001; Love, 2014; Dölen et al., 2013; Marlin et al., 2015; Choe et al., 2015). Numerous studies demonstrate an indirect or downstream interaction of Oxt and DA signaling. A key example is Oxt release into the vStr, which promotes affiliative social behavior (Liu and Wang, 2003; Shahrokh et al., 2010; Young and Wang, 2004). However, the only current evidence for a direct Oxt regulation of DA neuron activity focuses on prolactin induction in the arcuate nucleus (Briffaud et al., 2015).
Prior results suggest the possibility that Oxt also acts in the midbrain. Behavioral studies show that activation of Oxt receptors (OxtRs) in the VTA is important for social reward (Song et al., 2016). Oxt in the VTA may generally influence reward-based behavior, since Oxt infusions there suppress sucrose intake (Mullis et al., 2013). Moreover, a recent trans-synaptic tracing analysis showed that Oxt neurons from the PVN project to VTA DA neurons (Beier et al., 2015), while another study demonstrated that Oxt could regulate the activity of a subset of unclassified VTA neurons (Tang et al., 2014). Therefore, Oxt may directly modulate VTA DA neurons. Whether Oxt projections also target SNc DA neurons has remained unexplored. One of the two brain regions enriched in Oxt somata, the PVN, sends monosynaptic projections to the SNc (Watabe-Uchida et al., 2012), where Oxt infusions reduce locomotor activity (Angioni et al., 2016). Despite experimental support for the existence of midbrain-targeting Oxt projections and behavioral effects of Oxt infusions, the functional impact of Oxt on the activity of DA neurons in either VTA or SNc has not been examined.
In the central nervous system, Oxt binds to a single GPCR (OxtR) primarily coupled to Gαq protein effectors, but at higher concentrations Oxt is able to recruit Gαi subunits (Busnelli et al., 2012). Binding to Gαq–coupled OxtR stimulates the phospholipase C pathway to enhance neuronal firing (Gimpl and Fahrenholz, 2001; Stoop, 2012). Oxt can also bind with lower affinity to the three vasopressin (Avp) receptors,V1aR, V1bR, and V2R (Tribollet et al., 1988). OxtR transcripts have been found in rodent VTA and SNc (Peris et al., 2016; Vaccari et al., 1998), while the evidence for AvpR expression in midbrain DA regions is conflicting (Dubois-Dauphin et al., 1996; Ostrowski et al., 1994, Insel et al., 1994, Tribollet et al., 1988). If these areas express both OxtR and AvpR, then the activation of either receptor by Oxt could result in a net increase in neuronal activity.
To dissect the mechanisms of oxytocinergic modulation of DA neurons in the VTA and SNc, we used a combination of anatomical, optogenetic, and electrophysiological approaches. Here we show that Oxt controls neuronal activity in midbrain DA regions through direct and polysynaptic effects. These effects are driven by Oxt release itself, which acts on several Oxt-sensing receptors including Oxt and Avp GPCRs. Our results place DA signaling under prominent control of a neuropeptide that is known to regulate social behavior and interact with reward signaling.
RESULTS
PVN Oxt projections directly target the VTA and SNc
To determine whether Oxt neurons project to midbrain DA regions, we unilaterally injected green retrobeads (GRB) into either the VTA or SNc of P25–30 mice expressing tdTomato under control of the Oxt promoter (Oxt i-Cre; Ai14) (Figure 1A–F). We validated the specificity of this line by imaging the overlap between tdTomato and Oxt immunofluorescent (IF) labeling in the PVN (695/732 tdTomato+ neurons were Oxt+, 3 mice) (Figure 1A). GRB+ cells were observed in the ipsilateral PVN, as well as in the striatum and lateral hypothalamus (Watabe-Uchida et al., 2012), but not in the SON (Figure 1D–E; Figure S1A). Similar numbers of PVN neurons were labeled following GRB injections targeting the VTA or the SNc (VTAtarget, 90.8±12.2 neurons/mouse; SNctarget, 108.0±12.5 neurons/mouse; p=0.548, Mann-Whitney test, n=5 mice/group) (Figure 1E–F). Approximately 20% of GRB+ neurons in the PVN were tdTomato+, providing evidence for a direct oxytocinergic PVN projection to midbrain DA regions (proportion tdTomato+/GRB+ in the VTA, 0.24±0.02; SNc, 0.24±0.02; p=0.691, Mann-Whitney test, n=5 mice/group) (Figure 1F). The proportion of Oxt neurons in these PVN-arising efferents is consistent with a recent trans-synaptic tracing analysis of PVN outputs (Beier et al., 2015).
Figure 1. Targeting and tracing Oxt projections to the VTA and SNc.

(A) Left: Confocal image of tdTomato (magenta) and immunofluorescent labeling (IF) for Oxt (green) in the PVN in Oxt i-Cre; Ai14 mice. Merge shows signal overlap. Right: Percentage of tdTomato+ neurons (magenta), Oxt+ by IF (green), and those co-localizing both signals (grey). n=797 neurons, 3 mice.
(B) Schematic of retrograde tracer experiments targeting VTA or SNc of Oxt i-Cre; Ai14 mice.
(C) Images of GRB injection sites in VTA/SNc of Oxt i-Cre; Ai14 mice. TH, tyrosine hydroxylase.
(D) Coronal brain section showing sparse GRB+ PVN cells after ipsilateral GRBVTA targeting. Red, tdTomato; green, GRB; blue, nucleic stain.
(E) Confocal images of the overlap between PVN tdTomato+ neurons (red) and GRB+ (green). Top, GRBVTA injection; bottom, GRBSNc injection. White solid circles mark double-labeled cells, white dashed circles, tdTomato−/GRB+ cells.
(F) Left: Counts of GRB+ PVN neurons. Right: Counts of GRB+/tdTomato+ cells. Circles, within mouse averages; n=5 mice/group, Mann-Whitney test, p>0.05.
(G) Confocal images of the overlap between PVN Oxt neurons (blue), GRB+ cells after VTA targeting (green), and RRB+ cells after SNc targeting (red). Green circles mark Oxt+/GRB+ cells, red circles mark Oxt+/RRB+ cells, and yellow circles, Oxt+/GRB+/RRB+ cells.
(H) Average count of retro-labeled PVN Oxt+ neurons projecting to VTA and SNc. Grey, Oxt+/GRB+; purple, Oxt+/RRB+; yellow, triple-labeled neurons. One-way ANOVA with Tukey post hoc tests, **p<0.001.
(I) Left: AAV9-DIO-eYFP expression in the PVN of Oxt i-Cre mice. Right: confocal image of eYFP+ neurons (green) and Oxt IF (magenta). Arrows point to double-labeled cells.
(J) Left: Oxytocinergic axons in midbrain DA regions. White dashed boxes mark locations of confocal images (right). Green, eYFP; magenta, TH IF.
(K) Oxytocinergic axon coverage in the VTA and SNc. n=3 mice, ** p<0.001 and *p<0.05, respectively, one-way ANOVA, post hoc test for linear trend. Error bars reflect SEM.
To evaluate whether the same set of Oxt PVN neurons project to both VTA and SNc, we injected both GRB and red retrobeads (RRB) separately into the VTA and SNc of wildtype mice (Figure S1B). After 7–9 days, we evaluated the overlap between RB+ cells and Oxt neurons in the PVN (Figure 1G–H; Figure S1B). Both GRB and RRB were found in PVN Oxt neurons, at similar proportions as for single-color RB labeling. However, few GRB+/RRB+ neurons overlapped with Oxt neurons, demonstrating that Oxt projections to the VTA and SNc are largely separate (25.75±4.77 Oxt+ neurons/mouse project to the VTA; 37.50±6.97 Oxt+ neurons/mouse project to the SNc; 2.25±0.73 Oxt+ neurons/mouse project to both regions, n=4 mice, one way ANOVA with Tukey post hoc tests, p<0.001) (Figure 1G–H).
For examining the projection of PVN Oxt neurons to midbrain DA regions, we relied on Oxt i-Cre mice injected with a Cre-dependent recombinant adeno-associated viral vector (AAV) expressing eYFP into the PVN (Figure 1I). Here, 452/491 eYFP+ neurons were labeled for Oxt IF (3 mice) (Figure 1I). In addition to the well-described projections to amygdala and striatum (Knobloch et al., 2012), we observed eYFP+ axons in both the VTA and SNc, as well as in the lateral hypothalamus (Figure 1J, Figure S1C–D). We observed a mediolateral linear trend in the density of virally transduced axons, with the peak of expression in dorsolateral SNc and the poorly defined reticular area along its border (eYFP+ axonal density, VTA, 553.9±86.4 mm/mm3; SNc, 783.7±92.8 mm/mm3; reticular SNc, 1515.9±231.9 mm/mm3, p <0.01, one way ANOVA and post hoc test for linear trend, 3 mice) (Figure 1J–K; Figure S1C–D). Thus, both retrograde and anterograde tracing results confirm that PVN oxytocinergic efferents directly project to the VTA and SNc.
Distribution of Oxt-sensing receptors in the VTA and SNc
To evaluate which neurons in DA regions are capable of responding to Oxt, we investigated Oxt-sensing receptor expression in the VTA and SNc. We analyzed tissue immunofluorescently double-labeled for OxtR and the canonical marker of DA neurons, tyrosine hydroxylase (TH) (Figure 2A). A ~2-fold greater proportion of TH+ somata co-localized with OxtR+ puncta in VTA versus the SNc (~55% of VTA TH+ cells were OxtR IF+, but only ~26% in the SNc, p<0.05, unpaired t-test) (Figure 2B). Significantly fewer OxtR puncta were observed following IF in tissue where OxtR was conditionally knocked out from DAT+ neurons, confirming the specificity of receptor labeling. We also used a previously characterized OxtR antibody to confirm expression in the VTA and SNc (Marlin et al., 2015) (Figure S2A–B).
Figure 2. Oxt-sensing receptor protein and transcript distribution in the VTA and SNc.
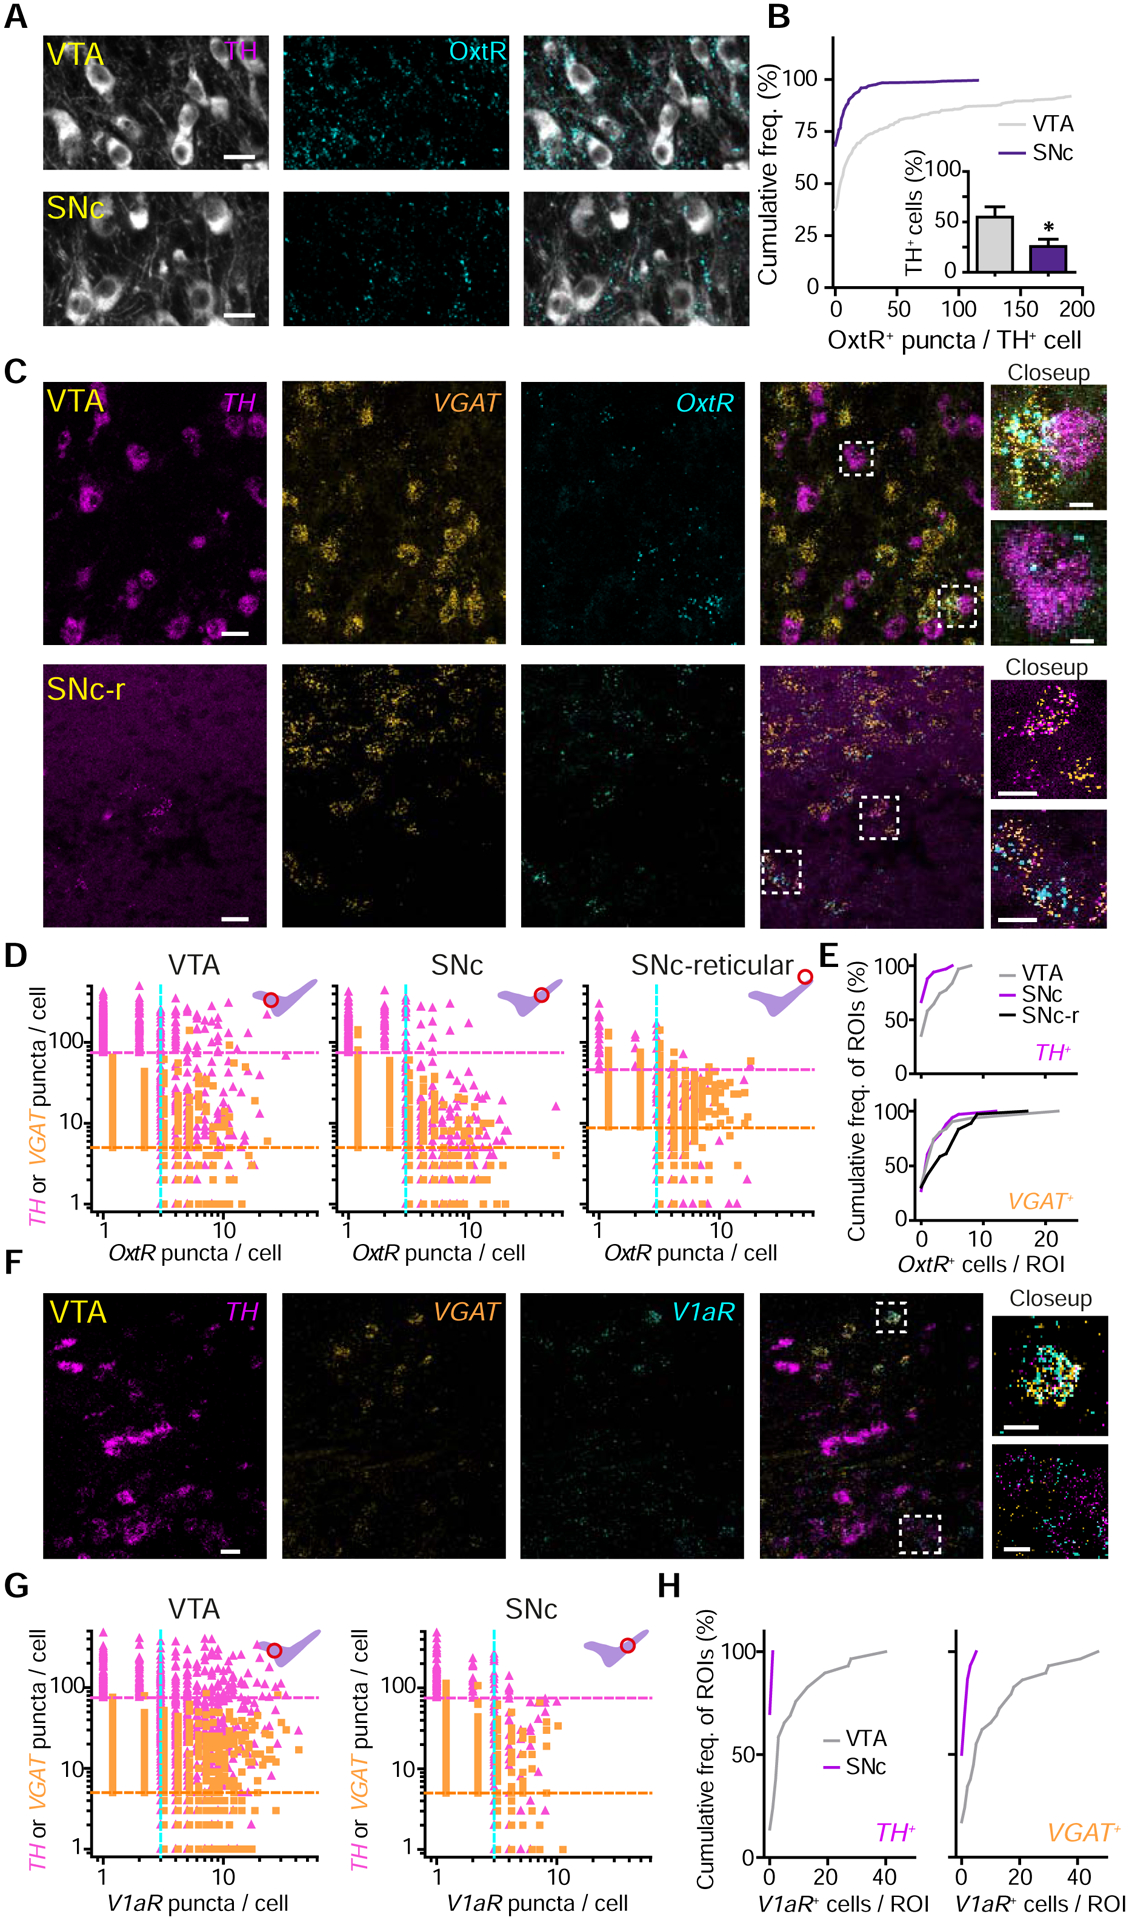
(A) Confocal images of TH (white) and OxtR IF (cyan) in VTA and SNc.
(B) Quantification of OxtR+ puncta co-localization with TH+ neurons. n=780 VTA TH+ neurons, 564 SNc TH+ neurons. Inset: proportion of neurons co-localized with OxtR+ puncta. n=6 sections, 2 mice; Unpaired t-test, p<0.05. Error bars reflect SEM.
(C) Fluorescence in situ hybridization (FISH) images in the VTA (top) and dorsolateral SNc reticular area (SNc-r, bottom). TH (magenta), vesicular GABA transporter (VGAT, orange), and OxtR (cyan).
(D) Quantitative analysis of TH, VGAT, and OxtR co-expression by FISH in the VTA (left), SNc (middle), and SNc-r area (right). The number of puncta per cell for either TH (pink triangles) or VGAT (orange squares) against OxtR (both). Magenta and orange lines mark the cutoffs used to classify a cell as TH+ or VGAT+; blue line, the cutoff for OxtR (n=3 mice).
(E) Cumulative frequency distribution of OxtR+ neurons in ROIs analyzed for TH+ cells (top) and VGAT+ cells (bottom).
(F) Same as (C), but for V1aR.
(G) Quantitative analysis of TH, VGAT, and V1aR co-expression by FISH in VTA (left) and SNc (right).
(H) Cumulative frequency distributions of V1aR+ neurons in ROIs analyzed for TH+ cells (left) and VGAT+ cells (right).
To refine and corroborate the results of IF assays, we carried out quantitative fluorescence in situ hybridization (FISH) assays for mRNA of OxtR and V1aR in the VTA and SNc. DA and GABA neurons were identified by labeling for TH and Slc32a1 (vesicular GABA transporter, VGAT) (Figure 2C and F). In the VTA, we observed co-localization of OxtR with both TH and VGAT probes (proportion of TH+ cells expressing OxtR, 6.86±2.81%; proportion of VGAT+ cells expressing OxtR, 8.38±0.46%, n=3 mice) (Figure 2D–E; Figure S2C). We observed a higher degree of co-localization of V1aR with TH and VGAT in the VTA (proportion of TH+ cells expressing V1aR, 25.70±8.97%; proportion of VGAT+ cells expressing V1aR, 29.77±6.02%) (Figure 2F–H; Figure S2D). Since a subset of Oxt neurons co-releases Avp in lactating rats (Mezey and Kiss, 1991), we evaluated whether neurons in reporter mice expressing Cre recombinase under Avp promoter (Avp i-Cre) are Oxt+. Despite the presence of V1aR in the VTA, we confirmed that <1% of PVN Oxt neurons (6/688 neurons, 2 mice) co-express Avp, consistent with a previous study (Knobloch et al., 2012) (Figure S2E–F).
In the SNc, few TH+ cells were positive for OxtR or V1aR (OxtR, 3.72±0.39%; V1aR, 3.03±1.14%); likewise, few VGAT+ cells co-localized with OxtR or V1aR (OxtR, 5.50±0.16%; V1aR, 1.75±0.53%) (Figure 2D–H). Unexpectedly, we identified dense OxtR+ puncta distributed in the reticular part of the SNc that co-localized with the VGAT+ cells (11.3±2.04%) (Figure 2C–E). These data support the notion that Oxt may regulate DA and GABA neurons in the VTA via OxtR and V1aR; furthermore, it may indirectly influence DA neurons in the SNc by modulating dorsolateral SNc reticular GABA neurons. This hypothesis is consistent with our observation that the greatest density of PVN oxytocinergic axons is in the most dorsolateral aspect of SNc (Figure 1J–K).
PVN Oxt neurons projecting to midbrain DA regions are parvocellular
Oxt neurons are classified into magnocellular and parvocellular subtypes, distinct in morphology, amount of Oxt production, and electrophysiological properties (Eliava et al., 2016; Luther and Tasker, 2000). Magnocellular Oxt neurons can be distinguished from parvocellular ones by a longer latency to spike in response to positive current injections and a transient outward rectification following relief from hyperpolarization (Eliava et al., 2016; Luther and Tasker, 2000). To determine the subtype that gives rise to these midbrain projections, we injected GRB into either the VTA or the SNc of Oxt i-Cre; Ai14 mice and recorded PVN Oxt neurons. PVN tdTomato+/GRB+ neurons in both GRBVTA and GRBSNc injected mice lacked this transient outward rectification and showed a short latency to spike. We found that they also had relatively small somata (Figure 3A and C). In contrast, Oxt+/GRB− neurons with large somata showed transient outward rectification and had longer latencies to action potential firing when depolarized (Figure 3B and C). We further compared soma area of Oxt+/GRB+ and Oxt+/GRB− neurons in confocal images from Figure 1, and found that Oxt+/GRB+ neurons have smaller somata (Oxt+/GRB+ neurons, 174.26±6.58 μm2; Oxt+/GRB− neurons, 215.12±2.32 μm2; p<0.0001, unpaired t-test, n=79 Oxt+/GRB+ neurons and 764 Oxt+/GRB− neurons from 2 GRBVTA and 2 GRBSNc injected mice) (Figure 3D). Together with prior reports of differences between magno- and parvocellular neurons (Eliava et al., 2016; Luther and Tasker, 2000), our data suggest that PVN Oxt neurons projecting to VTA/SNc are primarily parvocellular.
Figure 3. Parvocellular Oxt neurons of the PVN project to midbrain DA regions.
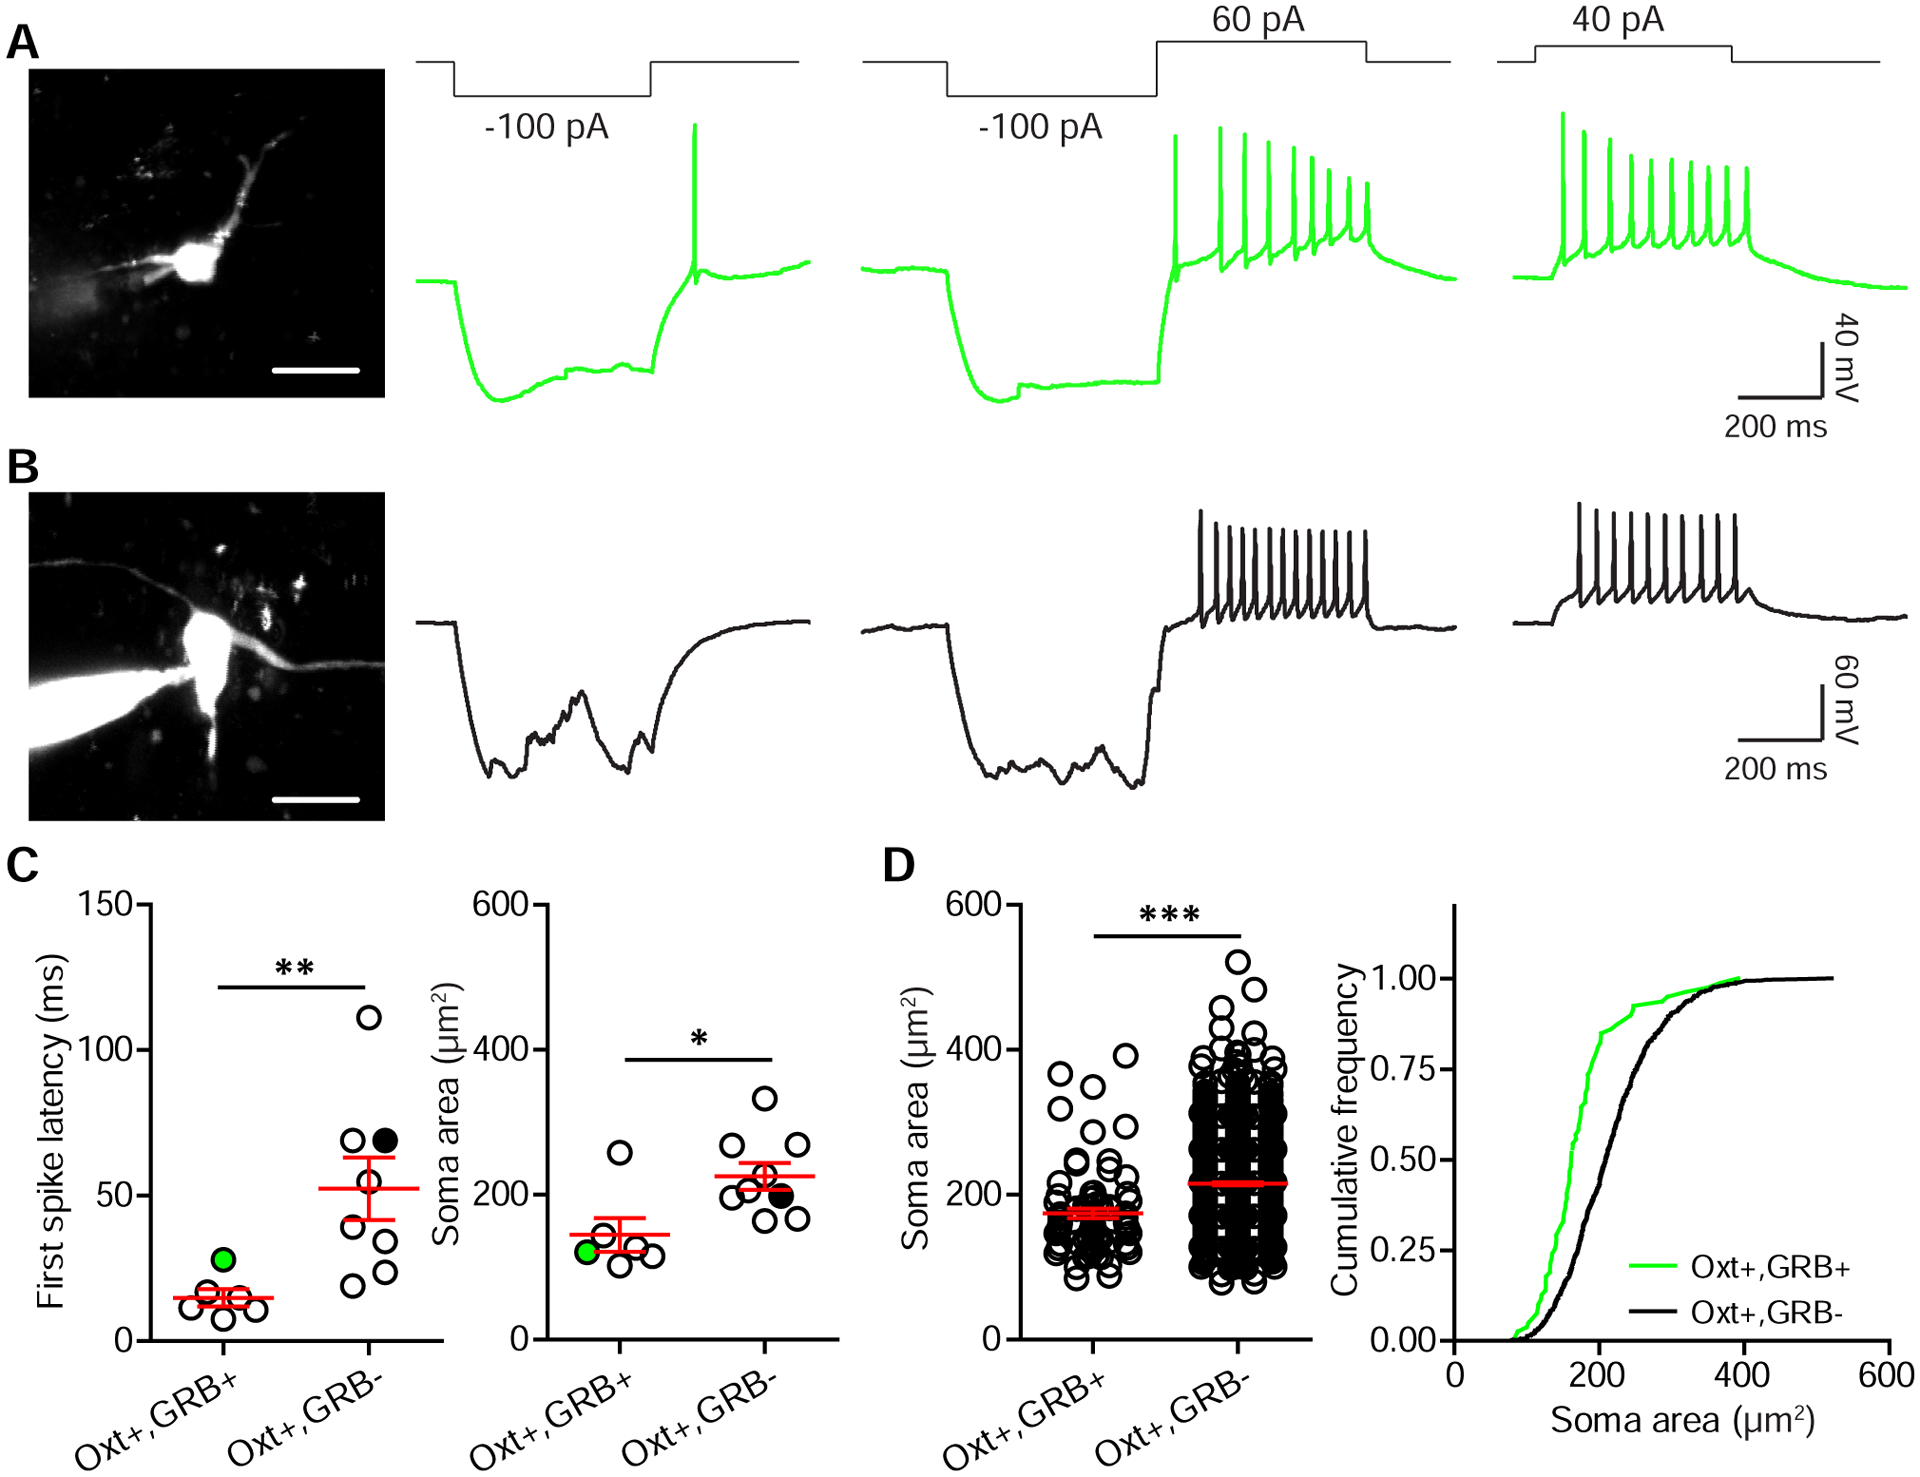
(A) Soma morphology and physiological response properties of an SNc-projecting PVN Oxt neuron, filled with Alexa Fluor 488 and imaged on a 2-photon laser-scanning microscope.
(B) Same as (A), but for a GRB− Oxt neuron.
(C) Left: Latency to first spike in response to a 40 pA current injection. Right: soma size. Green/ black circles mark neurons shown in (A) and (B). n=6 neurons for Oxt+/GRB+ group, 8 neurons for Oxt+/GRB− group, 5 mice (2 and 3 for RB VTA and SNc targeting), unpaired t-test, *p<0.05 and **p<0.01.
(D) Summary of PVN Oxt neuron soma size from retrograde tracing experiments. n=79 neurons for Oxt+/GRB+ group and 764 neurons for Oxt+/GRB− group from 4 mice (2 VTA-targeted and 2 SNc-targeted), unpaired t-test, ***p<0.001.
Opposing effects of Oxt on the activity of VTA and SNc DA neurons
To reveal the functional consequences of Oxt signaling for DA neurons, we recorded tdTomato+ neurons in slices prepared from DAT i-Cre; Ai14 mice (Figure S3A). DA neurons tended to be tonically active, with firing rates (FR) around 1–2 Hz and membrane potential “sag” in response to hyperpolarizing current injections (Guzman et al., 2009; Wanat et al., 2008) (Figure S3B–C). Consistent with the view that Oxt primarily acts at the Gαq-coupled receptors in the central neural system (Grinevich et al., 2016), VTA DA neurons increased FR in the presence of 1 μM bath-applied Oxt, recovering back to baseline following removal of the peptide (control, 0.70±0.16 Hz; Oxt, 0.94±0.18 Hz; washout, 0.71±0.18 Hz; p<0.05, one way ANOVA with Tukey post hoc tests, n=22 neurons, 15 mice) (Figure 4A and C). Oxt-responsive neurons were defined here and throughout as those exhibiting at least a 20% change from baseline activity level in response to Oxt application – for these neurons, Oxt-mediated enhancement in firing was approximately two-fold (210.5±22.0% of baseline activity) (Figure 4C). The observed effect on tonic activity in the presence of Oxt was accompanied by a modest decrement in afterhyperpolarization and action potential height (Figure S3D). To confirm that this modulation did not depend on the intracellular recording configuration, we recapitulated this observation using cell-attached recordings of DAT+ neurons (Figure S3E).
Figure 4. VTA and SNc DA neuron activity is differentially modulated by Oxt.
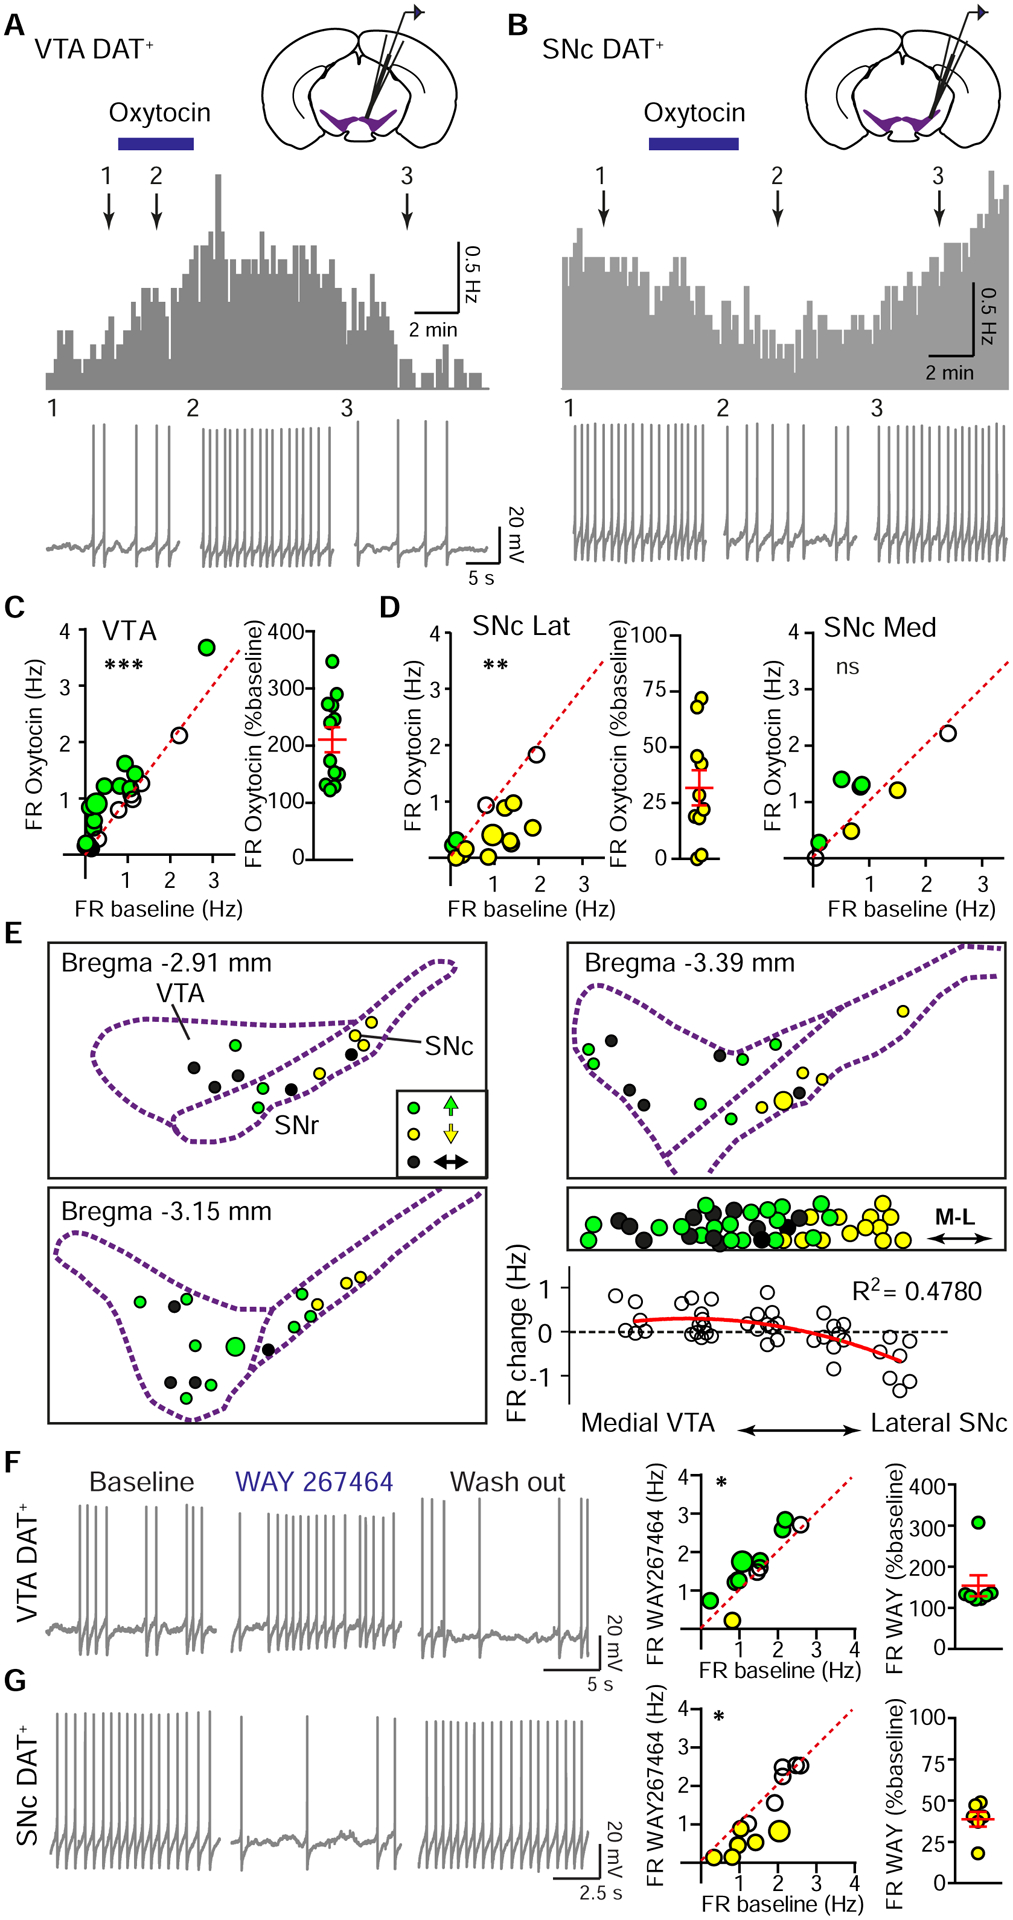
(A) Top: FR histogram (10 sec bins) from a spontaneously active VTA DAT+ neuron with bath application of 1 μM Oxt (blue bar). Bottom: Traces correspond to time points 1–3 above.
(B) Same as (A), but in the SNc.
(C) Left: Oxt-induced FR increase in VTA DA neurons. Green circles, Oxt-responsive neurons that increased activity. The larger circle marks neuron shown in (A). Paired t-test on full data set, ***p<0.001, n=22 neurons, 15 mice. Right: Normalized effect magnitudes for Oxt-responsive neurons.
(D) Left: Oxt-induced FR decrease in lateral SNc DA neurons. Yellow circles, Oxt-responsive neurons that decreased activity. The larger yellow circle marks neuron shown in (B). Paired t-test, **p<0.01, n=14 neurons, 12 mice. Middle: Normalized effect magnitudes for Oxt-responsive lateral SNc neurons that decreased activity with Oxt. Right: Medial SNc DAT+ neuronal population showed a mixed response to Oxt. Paired t-test, p=0.332, n=8 neurons, 8 mice.
(E) Spatial distribution of spontaneously active DA neurons, color-coded for significant FR responses to Oxt (defined in text). Green reflects increased FR; yellow, decreased FR; black, unchanged. Right, middle: Collapsing across rostro-caudal position reveals a mediolateral gradient in Oxt responsiveness. Larger green and yellow circles mark the location of neurons shown in (A) and (B). Right, bottom: Oxt-induced FR changes correlate with the mediolateral position of DA neurons (grouped by recording location). Red line, second order polynomial fit.
(F) Left: Traces from a VTA DA neuron during baseline, WAY267464 application, and washout. Middle: FR before and in WAY267464. Coloring as in (E). Larger circle marks the example neuron. Paired t-test, *p<0.05, n=12 neurons, 8 mice. Right: Normalized effect magnitudes for Oxt-responsive neurons that enhanced FR in WAY267464.
(G) Same as (F), but in the SNc. Paired t-test, *p<0.05, n=13 neurons, 8 mice.
In contrast, the FR of SNc DA neurons during Oxt application showed a more heterogeneous set of responses, correlated with the mediolateral positions of the neurons. Medial SNc DA neurons did not show a significant FR modulation in response to Oxt application (control, 0.87±0.29 Hz; Oxt, 1.02±0.27 Hz; washout, 0.80±0.30 Hz; one-way ANOVA, p=0.270, n=8 neurons, 8 mice) (Figure 4D). However, lateral SNc DA neurons reversibly decreased FR in the presence of Oxt (control, 0.91±0.18 Hz; Oxt, 0.49±0.14 Hz; washout, 0.91±0.22 Hz; p<0.05, one-way ANOVA with Tukey post hoc tests, n=14 neurons, 12 mice) (Figure 4B and D). In the lateral SNc, Oxt decreased the FR of Oxt-sensitive DAT+ neurons by ~70% (31.8±7.9% of baseline firing rate) (Figure 4D). For lateral SNc DA neurons recorded in cell-attached mode, spontaneous activity was also inhibited by Oxt (Figure S3F). Oxt narrowed the width and increased the height of SNc DA neuron action potentials (Figure S3D). Regardless of the anatomical distinction of VTA versus SNc, the lateral location of a DA neuron predicted a decrement in FR in response to Oxt, while a medial location was associated with an increase in FR (Figure 4E). This divergent neuromodulatory regulation of tonic activity was largely sex-invariant (VTA FR change: ♂ 0.23±0.10 Hz, ♀ 0.24±0.09 Hz, p=0.919, unpaired t-test, n=11 neurons/group; SNc FR change: ♂ −0.71±0.23 Hz, ♀ −0.25±0.12 Hz, p=0.101, unpaired t-test, n=12 and 10 neurons/group).
To validate the results of Oxt application experiments, we used a specific and selective OxtR agonist WAY267464 while recording VTA or lateral SNc DAT+ neurons. Just as for Oxt, bath-applied WAY267464 increased the FR of VTA DA neurons (control, 1.39±0.19 Hz; WAY267464, 1.61±0.23 Hz; p<0.05, paired t-test, n=12 neurons, 8 mice), and decreased the FR of lateral SNc DA neurons (control, 1.52±0.19 Hz; WAY267464, 1.26±0.28 Hz; p<0.05, paired t-test, n=13 neurons, 8 mice) (Figure 4F and G). These FR changes corresponded to a 153.7±25.7% enhancement for agonist-responsive DAT+ neurons in the VTA, and an over two-fold decrease in activity for SNc DAT+ neurons (38.7±4.5% of baseline FR).
Optogenetic stimulation of Oxt terminals differentially regulates VTA and SNc DA neurons
Next, we investigated whether endogenous Oxt release is sufficient to regulate the activity of midbrain DA neurons. To selectively control release, we relied on Oxt i-Cre mice injected with a Cre-dependent AAV expressing a fusion of ChR2 and either mCherry (ChR2-mCherry) or eYFP (ChR2-eYFP) into the PVN (Figure 5A). A single medial injection provided dense and specific coverage of PVN Oxt neurons: 712/839 ChR2+ neurons from 5 mice overlapped with Oxt IF (Figure 5A; Figure S4A–B). Virally labeled axons were observed in the VTA and SNc, corroborating anterograde mapping experiments. PVN ChR2+ neurons reliably responded to pulses of 470 nm light (Figure 5B). Since high frequency stimulation is required to induce Oxt release (Knobloch et al., 2012), to evoke axonal release of Oxt we used trains of 10 ms-long light pulses at 50 Hz delivered in 15 sec-long trains.
Figure 5. Optogenetic activation of oxytocinergic fibers leads to opposite activity changes in VTA and SNc DA neurons.

(A) Left: Schematic of viral transduction strategy using to express ChR2 in PVN Oxt neurons of Oxt i-Cre mice. Middle: ChR2-mCherry (red) expression confirmed with Oxt IF (white). Right: Confocal images of axonal mCherry signal in VTA (top) and SNc (bottom), in proximity of DA neurons (TH IF, blue).
(B) Current-clamp trace of an mCherry+ PVN neuron in response to 5-ms long 470 nm light pulses (10 Hz).
(C) Left: Current-clamp trace from a VTA DA neuron (DAn). Light stimulation of ChR2-expressing Oxt terminals in the VTA with 10-ms long light pulses delivered at 50 Hz (15 sec) reversibly increased FR. Middle: VTA DA neuron FR changes. Paired t-test on full data set, ***p<0.001, n=16 neurons, 12 mice. Green, DA neurons that enhanced their FR. Larger circle marks the neuron shown in left panel. Right: Normalized effect magnitudes for light-responsive neurons.
(D) Same as (C), but in the SNc. Yellow, light-sensitive neurons that decreased FR. Larger circle, neuron shown in left panel. Paired t-test, **p<0.01, n=16 neurons, 10 mice.
(E) Left: Schematic depicting the double-injection of GRB into striatum, and an AAV to express ChR2 in the PVN of Oxt i-Cre mice. Right: The majority of VTA DA neurons projecting to vStr increased activity in response to light, based on FR or membrane potential changes. n=11 neurons, 4 mice.
(F) Same as (E), but for the SNc and dStr. Right: The majority of SNc DA neurons projecting to dStr decreased activity in response to light. n=13 neurons, 3 mice.
(G) Top: Schematic of the experimental design. Left: VTA DA neuron FR changes in response to light stimulation before and during the application of OxtR antagonist (L368,899). n=6 neurons, 6 mice. Right: Same as in left panel, but for the SNc. n=9 neurons, 6 mice. *p<0.05, paired t-test, ##p<0.01, t-test vs. baseline.
(H) Left: FR changes in all VTA DA neurons in standard ACSF (n=16 neurons, 12 mice) and in the presence of blockers of fast synaptic transmission (CPP, NBQX, and SR95531, n=8 neurons, 6 mice). Right: As in left panel, but for the SNc (ACSF, n=16 neurons, 10 mice; with blockers, n=23 neurons, 17 mice). ns, p>0.05, unpaired t-test; ##p<0.01, t-test vs. baseline.
In this configuration, Cre recombinase expression is reserved for activating Oxt fibers and is not available for identifying DA neurons. To reliably target DA cells without fluorescence reporter expression, we first recorded 45 DAT+ neurons in the VTA and SNc of DAT i-Cre; Ai14 mice to set electrophysiological and morphological criteria for defining a DA neuron. Then, we evaluated these criteria in unlabeled VTA and SNc neurons in Oxt i-Cre mice, identified as DA+ based on their larger soma size, the presence of a sag potential, and their low tonic firing (Figure S3A–C), and validated with post hoc TH immunolabeling (Figure S4C). Others also report that DA neurons in mice can be identified based on their response properties and morphology (Ungless and Grace, 2012; Wanat et al., 2008).
Consistent with the results of bath application experiments, we observed an enhancement of FR in VTA DA neurons when optogenetically activating oxytocinergic axons (baseline, 1.19±0.18 Hz; light, 1.37±0.19 Hz; after, 1.13±0.19 Hz; p<0.01, one way ANOVA with Tukey post hoc tests, n=16 neurons, 12 mice) (Figure 5C), in contrast to a decrement in FR in lateral SNc DA neurons during light stimulation (baseline, 1.21±0.16 Hz; light, 0.90±0.19 Hz; after, 1.04±0.17 Hz; p<0.01, one way ANOVA with Tukey post hoc tests, n=16 neurons, 10 mice) (Figure 5D). For light-sensitive VTA DA neurons, defined above (20% FR modulation), stimulation increased FR to 132.8±4.7 % of baseline (Figure 5C); in the SNc, activity in responsive neurons decreased to 37.1±7.6 % of baseline (Figure 5D). For DA neurons lacking spontaneous firing, light stimulation elicited analogous opposing changes in resting membrane potential (Figure S4D–E). These Oxt-induced voltage changes are physiologically relevant, as small differences in membrane potential translate into relatively large FR changes for DA neurons (Figure S4F).
DA neurons provide the primary output of the VTA and SNc, respectively targeting the vStr to regulate reward and the dStr to modulate locomotion (Howe and Dombeck, 2016; Watabe-Uchida et al., 2012), but they also innervate multiple other regions (Beier et al., 2015; Walsh and Han, 2014). To determine which populations of DA neurons are modulated by Oxt, we combined GRB injections and viral transduction of ChR2. GRBs were injected into dStr or vStr of Oxt i-Cre mice transduced with AAV-ChR2-mCherry in the PVN, and we recorded GRB+ neurons from the VTA and SNc, with light stimulation as above (Figure 5E–F). Consistent with previous studies (Lammel et al., 2011; Watabe-Uchida et al., 2012), most GRB+ neurons observed in midbrain DA regions were located in the VTA following vStr injections, but in the SNc after dStr GRB targeting (Figure S4G). In response to light activation of Oxt fibers, GRB+ VTA DA neuron excitability increased, based on measurements of FR or membrane potential (6/11 neurons, 4 mice) (Figure 5E). On the other hand, most GRB+ SNc DA neurons showed reversible inhibition of activity (10/13 neurons, 3 mice) (Figure 5F). These results indicate that PVN Oxt projections are poised to shift the overall balance of DA tone from SNc to VTA-specific sources in downstream targets of DA neurons.
Oxt directly enhances the activity of VTA DA neurons
Optogenetic control of Oxt release enabled selection of DA neurons displaying specific modulatory responses for further dissection of the underlying mechanisms. In the VTA, light-evoked FR increases in DA neurons were abolished by the OxtR antagonist L368,899, used at concentrations that should block both OxtR and, to a lesser degree, V1aR (FR changeACSF, 0.26±0.05 Hz; FR changeL368,899, 0.01±0.06 Hz, p<0.05, paired t-test, n=6 neurons, 6 mice) (Figure 5G). Light-evoked changes in activity persisted in the presence of a cocktail of antagonists for glutamatergic and GABAergic receptors, supporting a direct, monosynaptic effect of Oxt release on VTA DA neurons (Figure 5H).
Oxt indirectly inhibits SNc DA neurons via local GABA neurons
Several lines of evidence suggest that in the SNc, rather than directly activating Oxt-sensing receptors on DA neurons, Oxt acts through distinct neural circuits or receptor mechanisms. First, we found few OxtRs in SNc DA neurons (Figure 2). Second, the observed inhibition of SNc DA neuron activity by Oxt is inconsistent with canonical Gαq–mediated effects found in other brain areas (Huber et al., 2005; Zheng et al., 2014). Finally, light-evoked inhibition of SNc DA neurons was longer lasting relative to the opposite valence modulation observed in the VTA (Figure S5C). Consistent with the possibility of multi-receptor mechanisms, OxtR antagonist alone was insufficient to block light-evoked inhibition of SNc DA neurons (FR changeACSF −0.27±0.04 Hz; FR changeL368,899 −0.40±0.08 Hz, p=0.166, paired t-test, n=9 neurons, 6 mice) (Figure 5G).
If Oxt-induced inhibition of SNc DA neurons is mediated by local circuits, it may require fast neurotransmission. To test this hypothesis, we carried out additional pharmacological dissection of light-evoked activity changes in stimulation-responsive DA neurons. Blocking fast neurotransmission with CPP, NBQX, and SR95531 did not abolish light-mediated inhibition of SNc DA neuron activity (Figure 5H). However, in the absence of fast transmission the inhibition became more transient, similar in timescale to the enhancement of tonic activity in the VTA (Figure S5A–C). With fast transmission blocked, light-evoked inhibition persisted in the presence of additional selective blockers for each of the following receptors individually: Oxt (L368,899, −0.33±0.09 Hz, p<0.01, t-test vs. baseline, n=7 neurons, 5 mice), V1a (SR49059, −0.32±0.06 Hz, p<0.01, n=6 neurons, 4 mice), and Drd2 (L741,626, −0.30±0.08 Hz, p<0.01, n=9 neurons, 7 mice) (Figure 6A). However, GABA(B)R antagonist (CGP54626) abolished light-driven inhibition of activity in SNc DA neurons (FR changecontrol, −0.31±0.05 Hz; FR changeCGP54626, −0.08±0.05 Hz, p<0.01, paired t-test; n=10 neurons, 9 mice). FR changeCGP54626 did not differ from baseline (p=0.122, t-test vs. baseline) (Figure 6A–B), raising the likelihood of a disynaptic effect via GABA neurons. To evaluate the role of GABARs in mediating oxytocinergic regulation of SNc DA neurons, we repeated these experiments with synaptic signaling intact. Light-evoked hyperpolarization of SNc DA neurons was diminished in the presence of GABA(A)R and GABA(B)R antagonists (membrane potential changecontrol, −2.46±0.37 mV; with blockers, −0.53±0.22 mV; p<0.01, paired t-test, n=9 neurons, 5 mice) (Figure 6C).
Figure 6. Optogenetic stimulation of Oxt terminals inhibits SNc DA neurons through diverse circuit and receptor mechanisms.
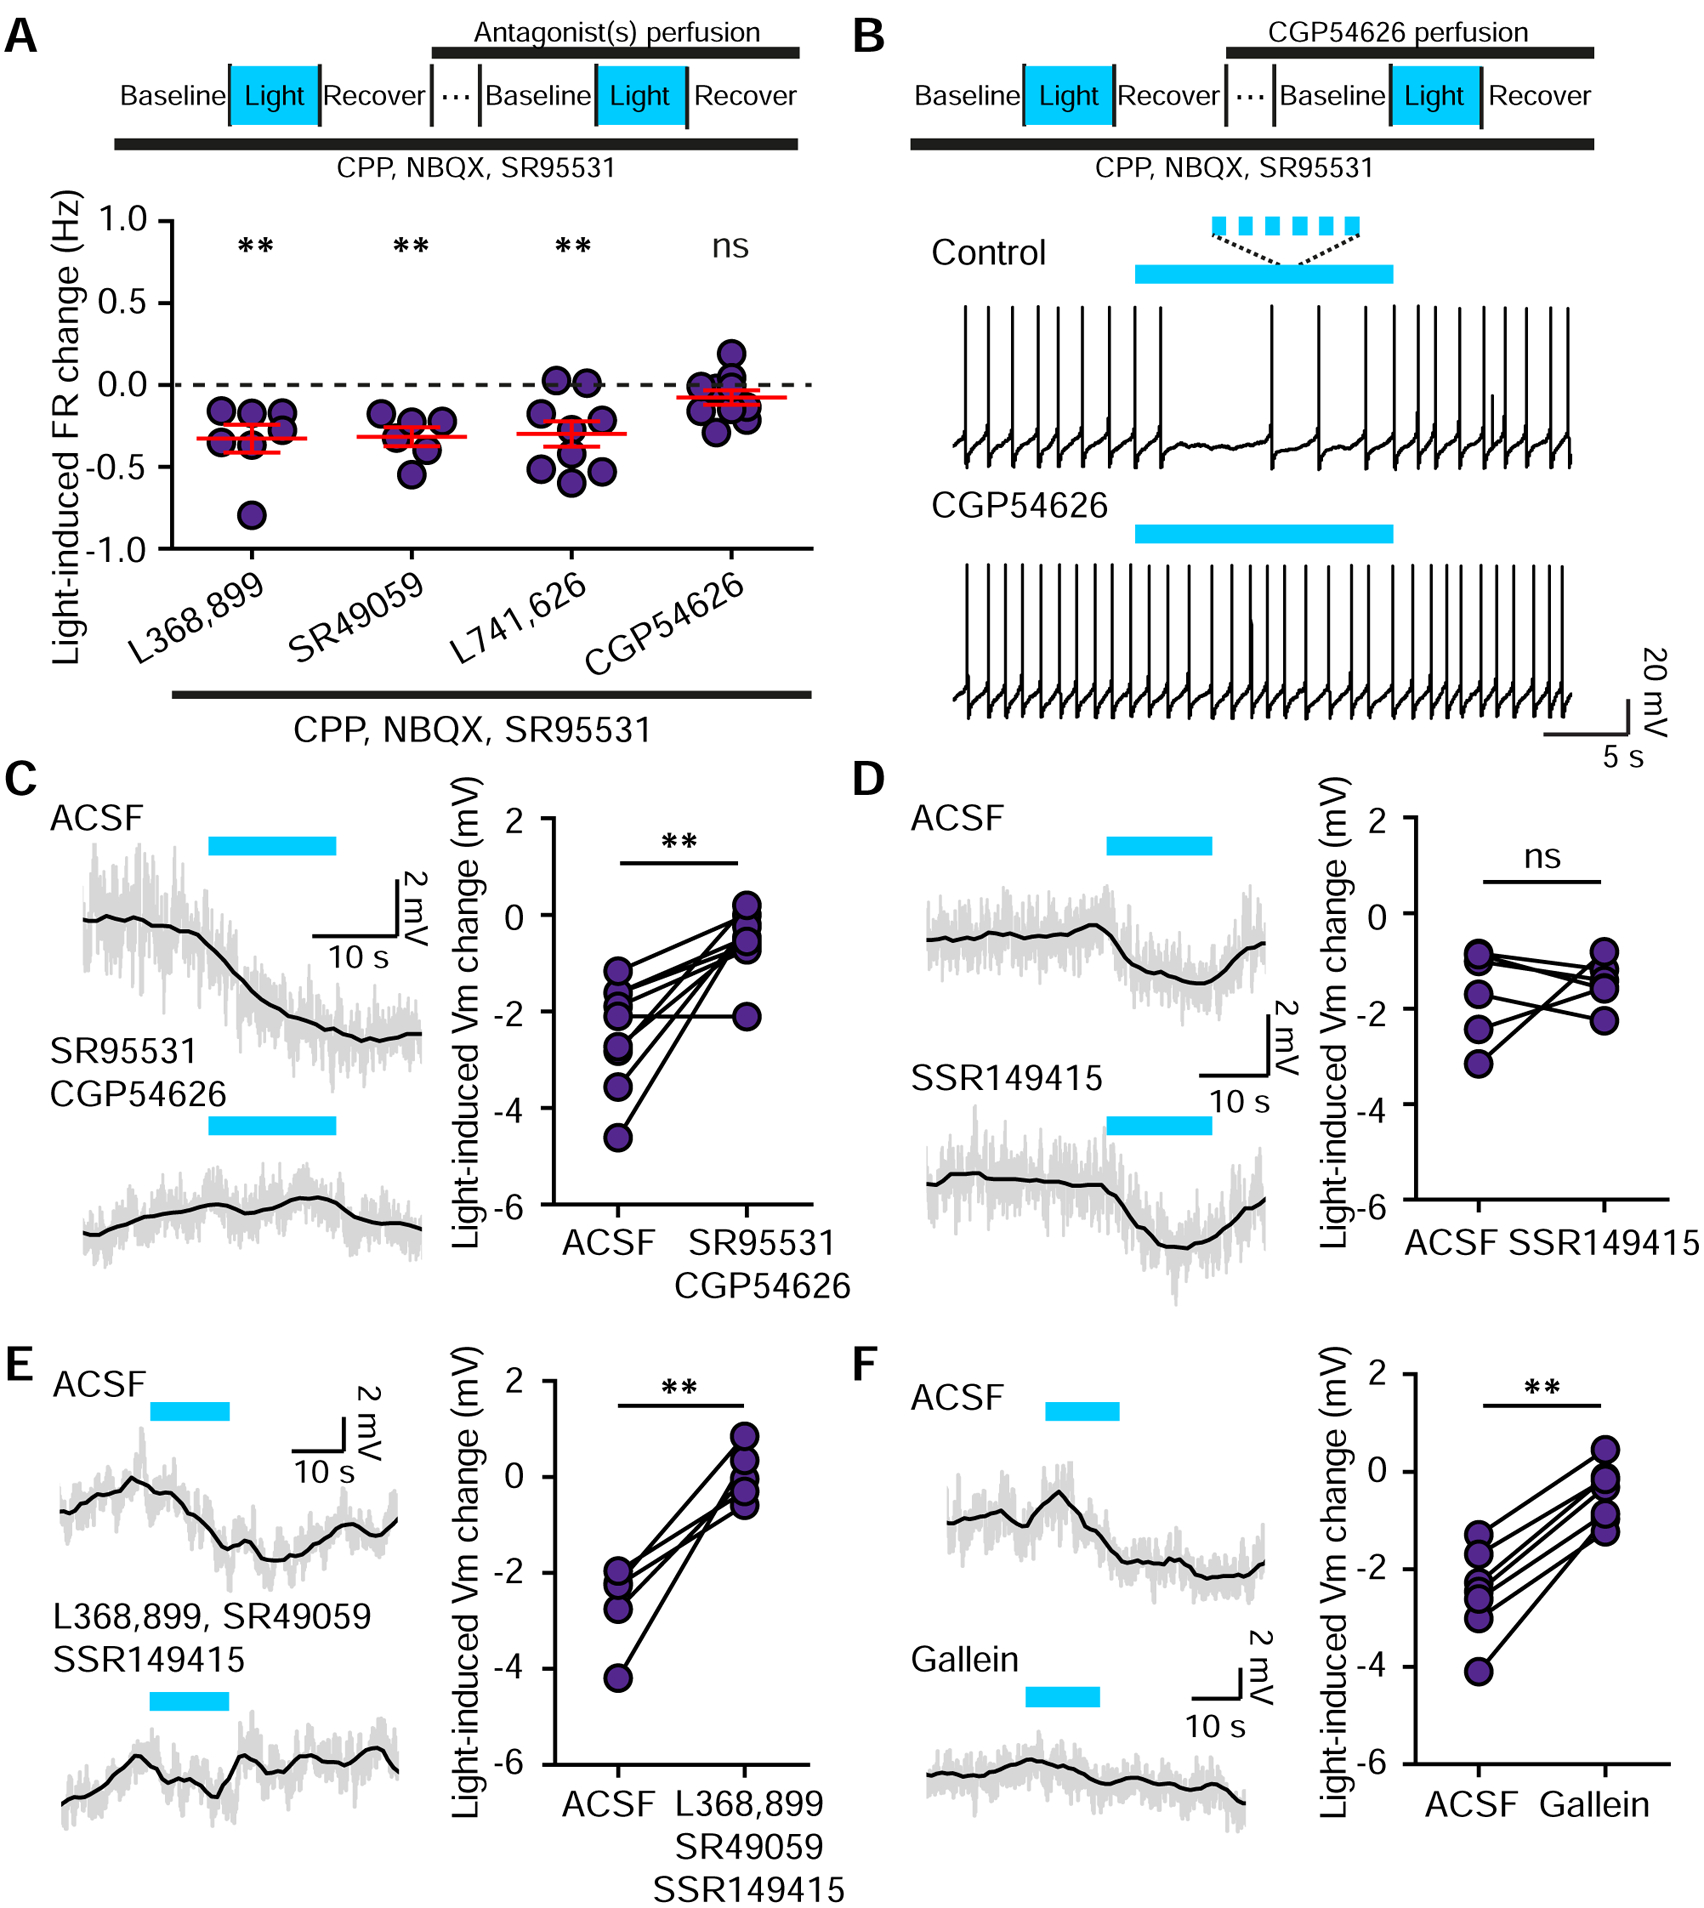
(A)Top: Schematic of the experimental design. Bottom: Lateral SNc DA neuron FR changes in response to light stimulation in the presence of blockers of fast synaptic transmission and antagonists for the following receptors OxtR (L368,899, n=7 neurons, 5 mice), V1aR (SR49059, n=6 neurons, 4 mice), Drd2R (L741,626, n=9 neurons, 7 mice), GABA(B)R (CGP54626, n=10 neurons, 9 mice). t-test vs. baseline, **p<0.01.
(B) Traces from one SNc DA neuron before and during the application of GABA(B)R antagonist CGP54626 combined with light stimulation.
(C) In ACSF, light-mediated hyperpolarization of SNc DA neurons is blocked by GABA(A)R and GABA(B)R antagonists. Grey line, raw data; black line, smoothed. Paired t-test, **p<0.01, n=9 neurons, 5 mice.
(D) Same as (C) but for the V1bR antagonist. Paired t-test, p=0.692, n=6 neurons, 3 mice.
(E) Light-induced hyperpolarization is fully blocked by a combination of OxtR, V1aR and V1bR antagonists (L368,899, SR49059, and SSR149415). Grey line, raw data; black line, smoothed. Paired t-test, **p<0.01, n=5 neurons, 4 mice.
(F) Same as (E) but for antagonist of G-protein βγ subunit-dependent signaling, gallein. Paired t-test, **p<0.01, n=7 neurons, 4 mice. Error bars reflect SEM.
We next sought to reveal the basis for oxytocinergic inhibition of SNc DA neuron activity using pharmacological blockers for GPCRs and signaling cascades. Since multiple Oxt-sensing receptors are expressed in the SNc (Skuse and Gallagher, 2009), we recorded SNc DA neurons in the presence of OxtR and AvpR (V1aR and V1bR) antagonists. Each blocker alone had no significant effect on Oxt-mediated inhibition of SNc DA neuronal activity (Figure 6A and D). Yet together, these antagonists sufficed to fully block the modulatory effect of Oxt (control membrane potential change, −2.67±0.45 mV; with blockers, 0.05±0.28 mV; p<0.01, paired t-test, n=5 neurons, 3 mice) (Figure 6E). Blocking Gβγ subunit-dependent signaling with gallein also prevented Oxt-driven effects, confirming a GPCR-based mechanism of SNc inhibition by Oxt (membrane potential changecontrol −2.49±0.41 mV; blockers, −0.45±0.26 mV; p<0.01, paired t-test, n=6 neurons, 4 mice) (Figure 6F).
Our previous experiments do not distinguish whether GABA-mediated inhibition stems from local interneurons or directly from Oxt projections. Although we did not observe light-evoked inhibitory currents (IPSCs) in DA neurons (not shown), we evaluated the possibility of GABA co-release from Oxt neurons. We measured the overlap between Oxt IF and tdTomato+ neurons in the PVN of Vgat i-Cre; tdTomato mice and found 0/341 double-labeled cells in 2 mice (Figure 7A). Therefore, Oxt neurons are unlikely to co-release GABA. Next, we confirmed the basis for disynaptic oxytocinergic modulation via local inhibitory interneurons by recording spontaneous IPSCs (sIPSC) in midbrain DA regions. For VTA DA neurons, light activation of Oxt fibers enhanced sIPSC frequency (baseline, 11.09±2.56 Hz; light, 16.59±4.87 Hz; p<0.05, paired t-test, n=6 neurons, 2 mice), but did not change their amplitude (baseline, 41.91±5.25 pA; light, 40.66±5.78 pA; p=0.691) (Figure 7B–C). This disynaptic inhibition was insufficient to override the direct, activity-enhancing modulation of VTA DA neurons by Oxt (Figure S5D). For SNc DA neurons, light activation of Oxt fibers also significantly increased sIPSC frequency and shortened inter-event intervals (baseline, 18.92±3.91 Hz; light, 21.66±4.46 Hz; p<0.05, paired t-test, n=6 neurons, 2 mice), without altering sIPSC amplitude (baseline, 32.55±5.47 pA; light, 31.75±5.55 pA; p=0.131) (Figure 7D–E). Direct bath application of Oxt also increased sIPSC frequency and shortened the inter-event intervals in both VTA and SNc DA neurons (VTA: baseline, 8.75±2.28 Hz; Oxt, 10.11±2.53 Hz; p<0.05, paired t-test, n=5 neurons, 4 mice; SNc: baseline, 12.78±7.94 Hz; Oxt, 13.45±7.99 Hz; p<0.05, paired t-test, n=5 neurons, 4 mice) (Figure 7F–G).
Figure 7. Optogenetic activation of oxytocinergic axons enhances the FR of VTA and SNc GABA neurons.
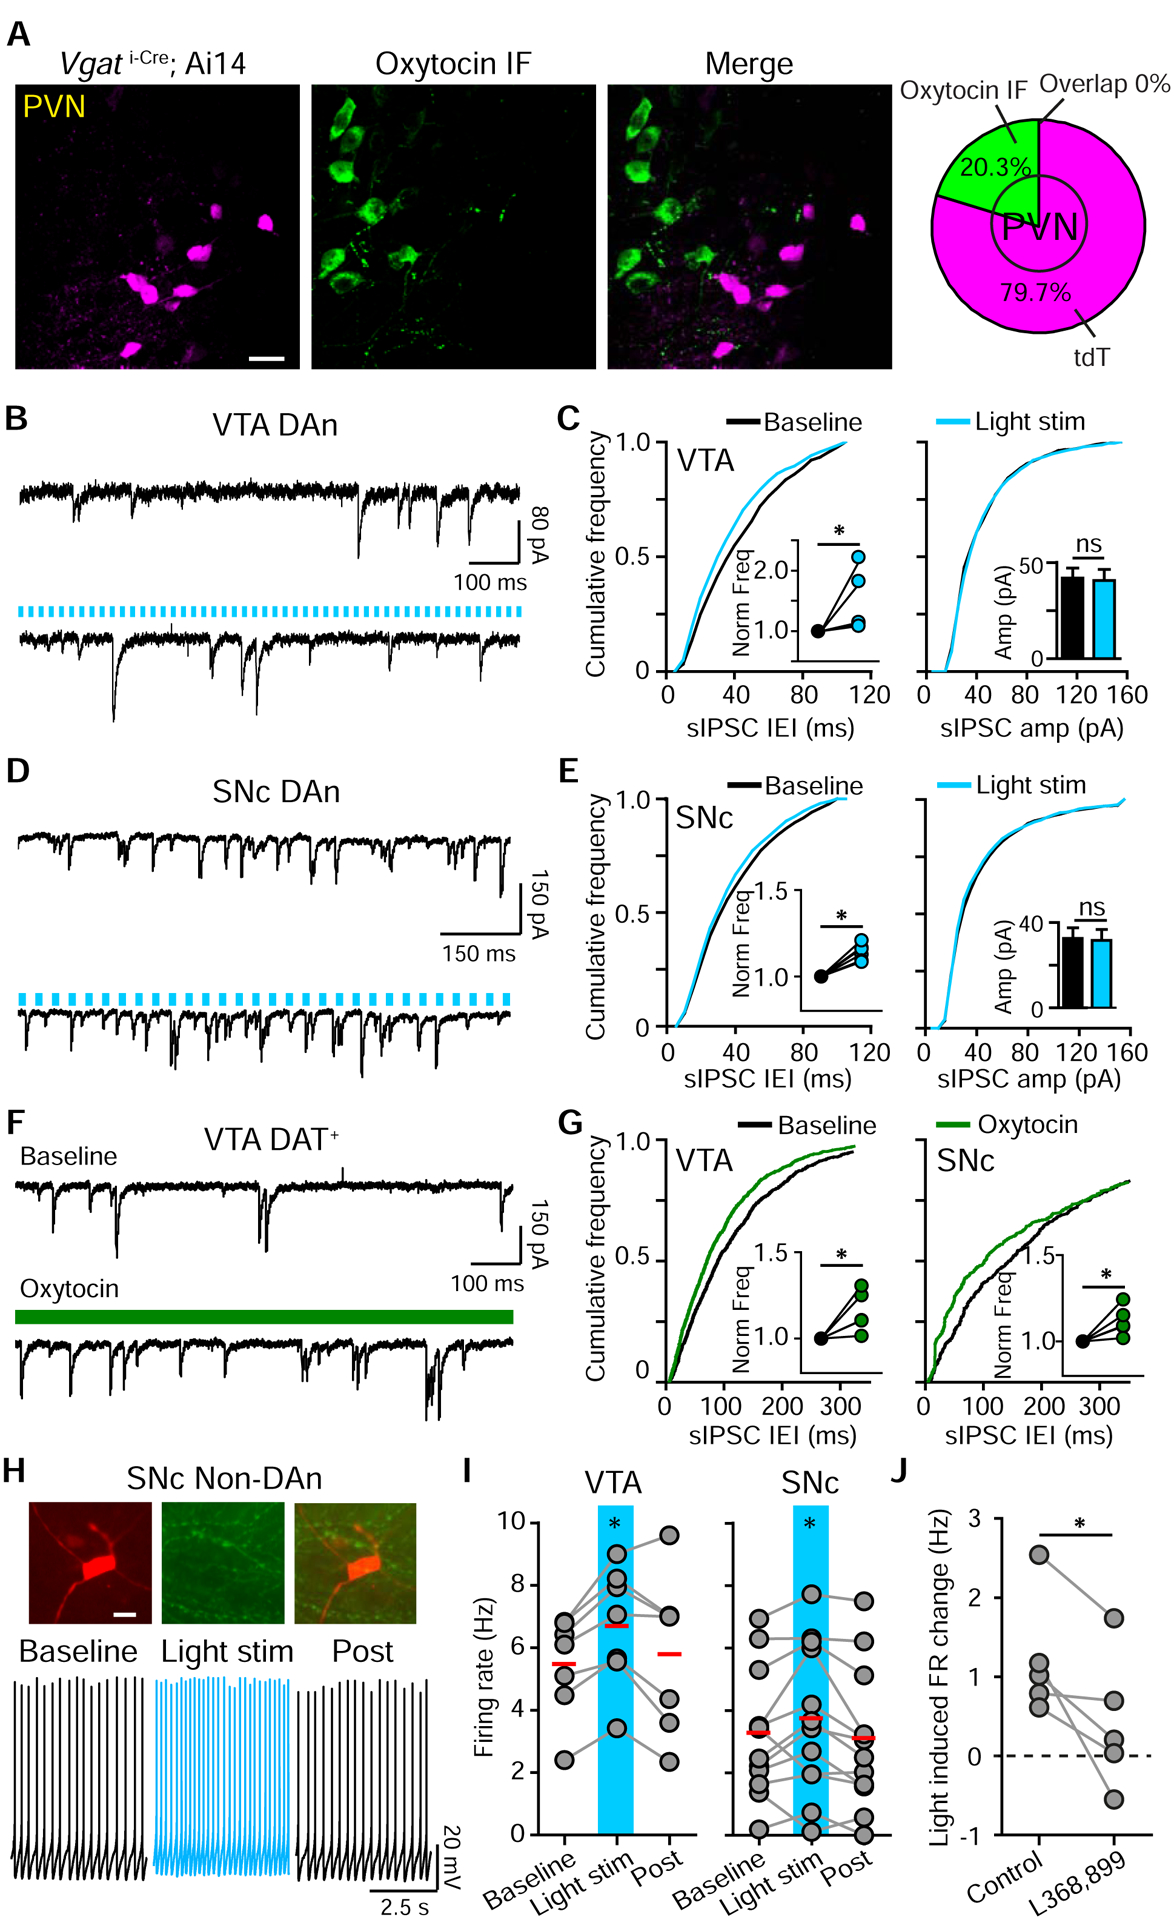
(A) Confocal image of VGAT-tdTomato reporter expression in the PVN (magenta) and Oxt IF (green). No signal overlap was observed (n=341 neurons, 2 mice).
(B) Traces from a VTA DA neuron showing spontaneous IPSCs (sIPSCs) before (top) and during (bottom) light stimulation (in CPP and NBQX).
(C) Light-evoked changes in sIPSC inter-event intervals (IEI) and frequency (left), with no change in sIPSC amplitude (right). Insets show normalized sIPSC frequency and amplitude. Paired t-test, *p<0.05, n=6 neurons, 2 mice.
(D) Same as (B), but in the SNc.
(E) Same as (C), but in the SNc.
(F) Traces from a VTA DA neuron showing sIPSCs before (top) and during (bottom) bath application of Oxt (in CPP and NBQX).
(G) Oxt decreases sIPSC IEI and increases sIPSC frequency in VTA (left) and SNc (right) DA neurons. Insets show normalized sIPSC frequency. Paired t-test, *p <0.05, n=5 neurons, 4 mice/group.
(H) Top: A TH− neuron in the SNc, filled with Alexa Fluor 594 (left), fixed and labeled with TH IF (middle). Bottom: Traces from an SNc TH− neuron in response to light stimulation of Oxt fibers.
(I) FR changes in VTA (left) and SNc (right) TH− neurons in response to light stimulation. One-way ANOVA (Tukey post hoc), *p< 0.05, n=7 VTA neurons, 4 mice, n=12 SNc neurons, 7 mice.
(J) In SNc TH− neurons, light stimulation-induced FR increase is diminished by OxtR antagonist L368,899. Paired t-test, * p<0.05, n=5 neurons, 5 mice.
Analogously, TH− neurons in the VTA and SNc, presumed to be GABA interneurons, showed an enhancement of FR in response to light stimulation (VTA: FRcontrol 5.45±0.61 Hz, light, 6.69±0.73 Hz, recovery, 5.85±0.91 Hz; p<0.05, one way ANOVA with Tukey post hoc tests, n=7 neurons, 4 mice. SNc: FRcontrol 3.24±0.59 Hz, light, 3.78±0.69 Hz, recovery, 3.05±0.65 Hz; p<0.05, one way ANOVA with Tukey post hoc tests, n=12 neurons, 7 mice) (Figure 7H–I). Light-induced FR changes were attenuated by OxtR antagonist (FR changecontrol, 1.23±0.34 Hz; with blocker, 0.42±0.38 Hz; p<0.05, paired t-test, n=5 neurons, 5 mice) (Figure 7J). Although Oxt has the capacity to act via Gi/o proteins to inhibit neuronal activity (Busnelli et al., 2012; Eliava et al., 2016; Stoop, 2012), our results support a model where Oxt activates multiple GPCRs to indirectly inhibit SNc DA neurons via GABA neurons. A similar dampening in the VTA is compensated by direct Oxt action on DA neurons, yielding an overall activity enhancement.
DISCUSSION
Behavioral and anatomical studies have suggested the possibility of oxytocinergic modulation of midbrain DA neurons, but knowledge of the circuits and the physiological consequences of this potential modulation have remained elusive. Here, we anatomically and functionally characterize hypothalamic oxytocinergic projections that regulate midbrain DA neuron activity, supporting a direct interaction between neurohypophyseal systems and DA circuits (Figure 8). This oxytocin source derives from parvocellular neurons of the PVN. In the VTA, Oxt directly increases the FR of most DA neurons. In the SNc, by contrast, oxytocin hyperpolarizes membrane potential, causing a net decrease in FR. The opposition of these net modulatory effects stems from differences in receptor expression and circuit connectivity. Oxytocin-sensing receptors are expressed on both DA and GABA neurons in the VTA. However, few oxytocin-sensing receptors are expressed on SNc DA neurons, unlike the population of nearby GABA cells.
Figure 8. Model of oxytocinergic regulation of VTA and SNc neurons.
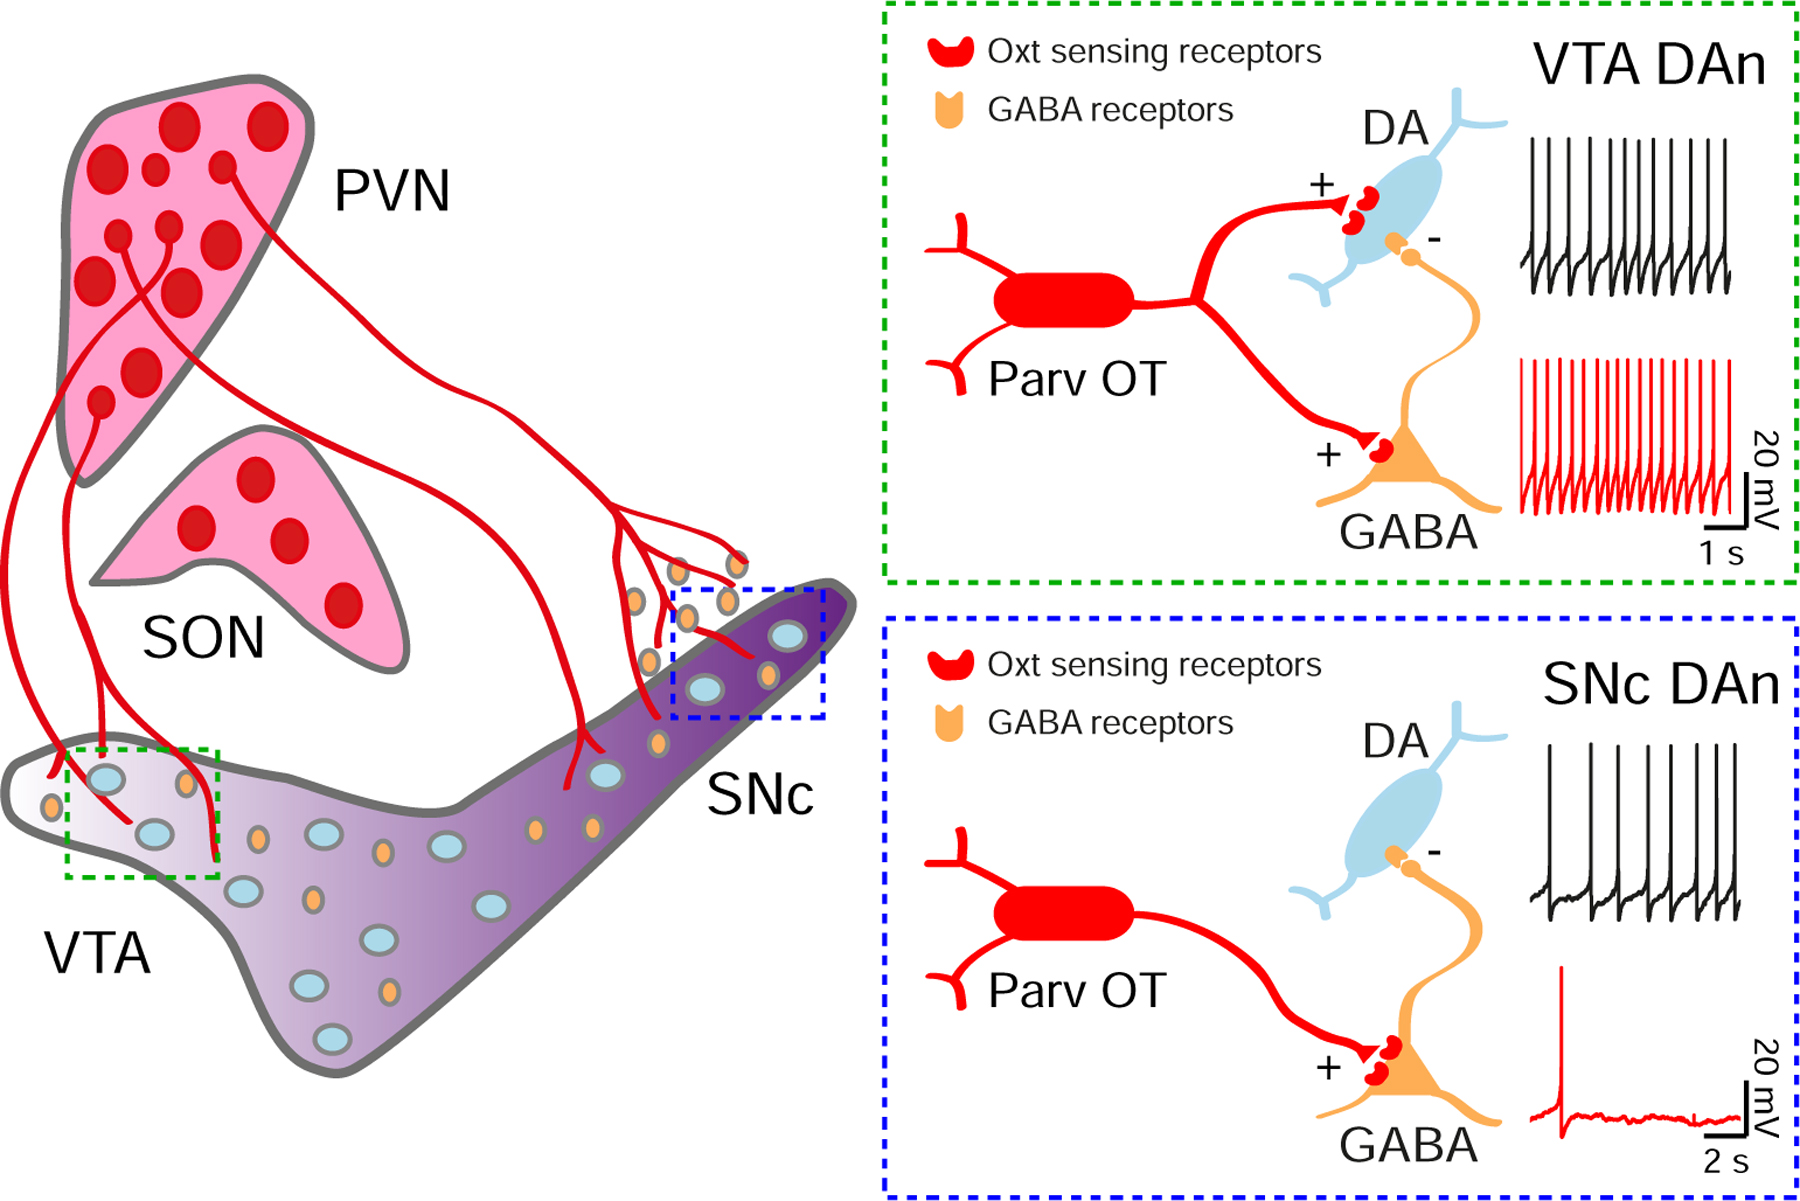
Parvocellular Oxt neurons (Parv OT) located in the PVN, but not the SON, directly project to the VTA and SNc. In the VTA, Oxt-sensing receptors are expressed on DA and GABA neurons. The net modulatory effect of Oxt release is an increase in VTA DA neuron activity. In the SNc, few Oxt-sensing receptors are expressed on DA neurons, while a population of nearby GABA cells strongly express them. The consequence of these differences is a net decrease of SNc DA neuron activity in response to Oxt.
This biased modulation, mediated by oxytocin-sensing receptor gradients and differences in circuit organization, demonstrates a mediolateral gradient of responsiveness to Oxt in midbrain DA regions. Other mediolateral cellular gradients are well established in this region. Lateral DA regions develop earlier than medial areas (Bayer et al., 1995), and they degenerate more quickly and intensely than VTA DA neurons during the clinical progression of Parkinson’s disease (PD) (Duke et al., 2007). Since PVN Oxt neurons are also vulnerable in PD (Purba et al., 1994), future studies are needed to explore the possibility that a loss of oxytocinergic dampening in the SNc contributes to DA neuron damage and the pathophysiology of PD.
Differences in expression patterns of receptors provide a simple mechanistic framework for mediating biased responses. The single OxtR shares high levels of sequence alignment with the three AvpRs (Mouillac et al., 1995). Compared to the activity of Oxt via OxtR, its effect on V1aR and V2R is about 1% of full activity (Manning et al., 2008; Tribollet et al., 1988). Still, Oxt action at V1aR can influence social communication and mediate peripheral analgesic effects (Qiu et al., 2014; Schorscher-Petcu et al., 2010). In addition, the activity of Oxt at V1bR is involved in the secretion of insulin and glucagon from the pancreatic beta cells and adrenocorticotropic hormone from the anterior pituitary (Fujiwara et al., 2007; Lee et al., 1995). Altogether, previous studies have shown that Oxt can act at AvpRs, with physiological consequences for the organism. However, it had remained unclear whether Oxt release exerts physiologically meaningful effects through central AvpRs. We relied on optogenetic stimulation of Avp-negative Oxt terminals and found that a small subset of light-evoked modulatory effects require AvpR antagonists for full blockade. So, despite the distinctions of nomenclature, the actions of Oxt and Avp are likely intertwined. In addition to Oxt acting on AvpRs in midbrain DA regions, Avp could also directly modulate these areas, since Avp neurons project to the VTA (Beier et al., 2015). Our retrograde labeling experiments indicate that only ~20% of VTA/SNc-targeting PVN neurons are Oxt+. Future studies are necessary to reveal the full scope of PVN peptides that could alter DA release and to identify local interactions of these molecules.
The biased oxytocinergic signaling that we observed is reminiscent of other subcortical systems modulated by neurohypophyseal peptides. The spatial separation of nearby neurons expressing OxtR and V1aR appears in other brain regions (Stoop, 2012; Veinante and Freund-Mercier, 1997). For example, oxytocin and vasopressin projections match local, segregated patterns of OxtR and V1aR expression in the central amygdala (Huber et al., 2005). However, our data suggest the sufficiency of Oxt release for physiological effects via multiple GPCRs, distributed in area-specific and cell class-specific ways. This distribution of neurohormone receptors in the VTA/SNc sets up midbrain DA regions to be controlled by either Oxt or Avp, or both. The close spatial proximity between oxytocin-sensing receptors in midbrain DA regions and Oxt+ axons of PVN neurons supports the likelihood of direct synaptic effects, as in the central amygdala (Knobloch et al., 2012). Yet, Oxt neurons are capable of dendritic release of oxytocin (Landgraf and Neumann, 2004; Ludwig et al., 2002) and can signal through microvolume diffusion (Fuxe et al., 2012), which could also contribute to the regulation of DA neuron activity in vivo.
Parvocellular Oxt neurons of the PVN give rise to substantial central projections, including those targeting limbic and brainstem regions (Eliava et al., 2016; Insel and Shapiro, 1992). The Oxt neurons we observe projecting to the VTA and SNc comprise largely separate groups. It remains to be determined whether they send additional projections outside the DA midbrain. Future studies are also needed to reveal the potential interactions between sex and Oxt control of reward circuitry, as neurohypophyseal systems have sex-specific functions (Crowley, 2015; Young and Wang, 2004), and magnocellular Oxt neurons prime labor induction and lactation (Gimpl and Fahrenholz, 2001; Insel and Shapiro, 1992). Our anatomical and physiological data on oxytocinergic regulation of midbrain DA systems support relative sex-invariance in structure and function. Thus, this neuromodulatory input may control ethologically significant behaviors shared by males and females. When could these behaviors manifest? In mice, OxtR expression changes over the course of the first several weeks of life (Mitre et al., 2016). We found that oxytocinergic regulation of DA neurons is consistent across several weeks of postnatal development (~P21–50). Future studies will determine when the critical functions of maternal circulating oxytocin (Mazzuca et al., 2011; Tyzio et al., 2006) are replaced by endogenously produced peptide.
In addition to delineating the circuits for direct oxytocinergic control over midbrain DA systems, our study highlights the likely importance of local GABA neurons near the SNc for the regulation of SNc DA neuron activity. The main, well-established GABAergic projection to the SNc originates in the substantia nigra pars reticulata (SNr). However, SNr neurons do not contain significant amounts of oxytocin-sensing receptors or Oxt axons. Instead, we found a high concentration of OxtR transcripts just dorsolateral to the SNc. While this reticular region is poorly defined anatomically, the GABAergic population that resides there may interact with DA neurons of the SNc (Hebb and Robertson, 2000). It has been previously shown that oxytocin application can directly activate a subset of neurons including those in the medial VTA via Gαq-coupled OxtRs (Tang et al., 2014), but our study details extensive oxytocin circuitry that biases the activity of VTA and SNc DA neurons in a region-specific and opposing manner. The present work represents the first observation that direct, evoked oxytocin release from Oxt+ axons modulates the activity of VTA and SNc DA neurons.
What is the function of oxytocinergic regulation of midbrain DA systems? Given the distributed projections of DA neurons, one compelling hypothesis is that oxytocin and DA signals cooperate to refine salient environmental cues. Indeed, studies suggest that oxytocin acts in the auditory cortex and olfactory bulb to improve the processing of salient sensory input (Marlin et al., 2015; Oettl et al., 2016). DA input from the VTA to the auditory cortex serves an analogous function (Bao et al., 2001; Lou et al., 2014). We find that optogenetic activation of midbrain Oxt fibers biases the activity of VTA and SNc DA neurons that send canonical ventral and dorsal projections. This modulation could regulate behavior by altering tonic activity of DA neurons and biasing striatal DA tone. Based on the known effects of striatal oxytocin on social interactions and pair-bonding behavior in the prairie vole and other rodents (Burkett et al., 2016; Dölen et al., 2013; Gao et al., 2016), one intriguing possibility is that oxytocin biases DA tone to enhance socially rewarding interactions at the expense of exploratory locomotion. Consistently, oxytocin microinjections into the VTA enhance the preference for social interactions (Song et al., 2016) and decrease locomotion when delivered into the SNc (Angioni et al., 2016). Our study delineates the circuit and receptor logic that supports direct oxytocin-mediated control of DA circuitry, adding a new motif to the complex picture of interactions between the basal ganglia and the neurohypophyseal systems that powerfully regulate social behaviors critical for species survival.
STAR METHODS: Structured, Transparent, Accessible Reporting
Contact for Reagent and Resource Sharing
Further information and requests for resources and reagents should be directed to and will be fulfilled by the corresponding author Yevgenia Kozorovitskiy (Yevgenia.Kozorovitskiy@northwestern.edu).
Experimental Model and Subject Details
Mouse strains and genotyping.
Animals were handled according to protocols approved by the Northwestern University Animal Care and Use Committee. Weanling and young adult male and female mice (postnatal days 21–50) were used in this study. Approximately equal numbers of males and females were used for every experiment. All mice were group-housed, with standard enrichment procedures, and littermates were randomly assigned to conditions. C57BL/6 mice used for breeding and backcrossing were acquired from Charles River (Wilmington, MA), and all other mouse lines were acquired from the Jackson Laboratory (Bell Harbor, ME). Four internal ribosomal entry site (IRES) Cre recombinase knock-in mouse lines were used in this study. B6.129S-Oxt tm1.1(cre)Dolsn/J mice (#024234), which express the enzyme Cre recombinase under control of the oxytocin promoter, are referred to as Oxt i-Cre (Shah et al., 2014); B6.SJL-Slc6a3 tm1.1(cre)Bkmn/J mice, which express Cre recombinase under control of the dopamine transporter promoter, are referred to as DAT i-Cre (Bäckman et al., 2006); B6.Cg-AVP tm1.1(cre)Hze mice (#023530), which express the enzyme Cre recombinase under control of the vasopressin promoter, are referred to as AVP i-Cre (Harris et al., 2014); Slc32a1 tm2(cre)Lowl mice (#016962), which express Cre recombinase under control of the VGAT transporter promoter, are referred to as Vgat i-Cre (Vong et al., 2011). Heterozygous Cre positive mice of both sexes were used in experiments. For a subset of experiments, Cre positive mice were crossed to a floxed tdTomato reporter strain (Ai14, Jackson Lab, #007914), or a floxed OxtR strain (B6.129(SJL)-Oxtr tm1.1Wsy/J, Jackson Lab, #008471) (Lee et al., 2008). All of the genotyping primers were based on standard protocols available on the Jackson Lab website.
Method Details
Stereotaxic intracranial injections and fiber optic implants.
Conditional expression of fluorescent proteins or ChR2 in Cre-containing neurons was achieved using recombinant adeno-associated viruses (rAAVs) encoding a double-floxed inverted open reading frame (DIO) of target genes. Mice were transduced with one of the following adeno-associated viruses (AAVs) acquired from the UPenn viral core (Philadelphia, PA): AAV9-EF1a-DIO-hChR2(H134R)-mCherry (1.24 × 10¹³ GC/ml), AAV9-EF1a-DIO-hChR2(H134R)-eYFP (3.55 × 10¹³ GC/ml), and AAV9-EF1a-DIO-eYFP (5.55 × 10¹³ GC/ml).
P25–30 mice were anesthetized with ketamine:xylazine (100:10 mg/kg b.w.), received ketoprofen for analgesia, and were placed on a small animal stereotaxic frame (David Kopf Instruments, Tujunga, CA). rAAVs or green/red retrobeads (50–100 nl for single color retrobead injections, 80 nl each for dual color retrobead injections; Lumafluor, Naples, FL) were delivered unilaterally through a pulled glass pipette at a rate of 100 nl/minute using an UltraMicroPump (World Precision Instruments, Sarasota, FL). Injection coordinates for rAAVs in the PVN were: 1.0 mm posterior to bregma, 0.2 mm lateral, 4.4 mm and 4.7 mm below the pia (0.4–0.5 μl/location); for retrobeads in the VTA, 2.7 mm posterior to bregma, 0.5 mm lateral, and 4.3 mm below the pia; for retrobeads in the SNc, 2.7 mm posterior to bregma, 1.2 mm lateral, and 4.2 mm below the pia; for retrobeads in the dorsal striatum, 1.5 mm anterior to bregma, 1.6 mm lateral, and 3.0 mm below the pia; and for retrobeads in the ventral striatum, 1.5 mm anterior to bregma, 1.6 mm lateral, and 4.4 mm below the pia. The pipette was held at the injection location for 15 min after retrobead injection and 5–10 min after virus injection. Coordinates were slightly adjusted based on mouse age and size. Mice recovered for 7–9 days following retrograde tracer injections and for over two weeks after rAAV injections.
Tissue processing, immunohistochemistry and imaging.
Mice were deeply anaesthetized with isoflurane and transcardially perfused with 4% paraformaldehyde (PFA) in 0.1 M phosphate buffered saline (PBS). Brains were post-fixed for 1–5 days and washed in PBS, prior to sectioning at 50–60 μm on a Vibratome (Leica Instruments, Nussloch, Germany). No immunoenhancement was used to increase the signal of virally transduced fluorescent proteins. Sections were pretreated in 0.2% Triton-X100 for an hour at RT, then blocked in 10% bovine serum albumin (BSA, Sigma-Aldrich, ST Louis, MO):PBS with 0.05% Triton-X100 for two hours at RT, and they were then incubated for 24–48 hours at 4°C with primary antibody solution in PBS with 0.2% Triton-X100. On the following day, tissue was rinsed in PBS, reacted with secondary antibody for 2 hours at RT, rinsed again, then mounted onto Superfrost Plus slides (ThermoFisher Scientific, Waltham, MA), dried and coverslipped under ProLong Gold antifade reagent with DAPI (Molecular Probes, Life Technologies, Carlsbad, CA) or under glycerol:TBS (3:1) with Hoechst 33342 (1:1000; ThermoFisher Scientific). For acute slices used in electrophysiology experiments, sections were fixed in 4% PFA overnight, washed in PBS, and processed for immunostaining as described above. Primary antibodies used in the study were rabbit anti-tyrosine hydroxylase (1:1000; AB152, Millipore, Billerica, MA), mouse anti-tyrosine hydroxylase (1:1000; AB129991, Abcam), rabbit anti-oxytocin (1:1000; T-4084, Peninsula Laboratories International, Inc., San Carlos, CA), and rabbit anti-oxytocin receptor (1:1000; AVR-013, Alomone Labs, Jerusalem, Israel). Alexa Fluor 488-, 594- and 647-conjugated secondary antibodies against rabbit or mouse (Thermo Fisher Scientific, Waltham, MA) were diluted 1:500. The protocol for the OxtR-2 antibody staining (a generous gift of R. Froemke) was based on published procedures (Mitre et al., 2016). Serum was purified by incubating it against OxtR knockout tissue in 1% bovine serum albumin. Brains were postfixed for 2 hours, transferred to 30% sucrose solution in PBS and stored at 4°C overnight. Then, brains were removed from sucrose solution, embedded in Tissue-Tek O.C.T. compound (VWR), stored overnight at −80°C, and sectioned on a cryostat at 18 μm thickness. Sections were rinsed in PBS, blocked for 2 hours in PBS with 0.2% Triton X-100 and 5% donkey serum, and incubated with OxtR-2 antibody serum at 1:250 dilution. For negative controls, blocking solution without antibody was applied. Following a 2 day-long incubation at 4°C in a humidified chamber, sections were rinsed 3 times in PBS and incubated for 2 hours in Alexa Fluor 647-conjugated goat anti-rabbit antibody (Thermo Fisher Scientific, 1:500). Whole sections were imaged with an Olympus VS120 slide scanning microscope (Olympus Scientific Solutions Americas, Waltham, MA). Confocal images were acquired with a Leica SP5 confocal microscope (Leica Microsystems). Depth-matched z-stacks of 1 μm-thick optical sections were analyzed in ImageJ (FIJI) (Schindelin et al., 2012).
Quantitative fluorescence in situ hybridization (FISH).
FISH was conducted following previously published procedures (Banghart et al., 2015). C57BL/6 mice were deeply anesthetized by inhalation of isoflurane and decapitated. Brains were quickly removed and frozen in tissue-freezing medium on a mixture of dry ice and ethanol for 5 – 15 minutes prior to storage at −80°C. Brains were subsequently cut on a cryostat (Leica CM1850) into 20 μm-thick sections, adhered to Superfrost Plus slides, and frozen at −80°C. Samples were fixed with 4% PFA in 0.1 M PBS at 4°C for 15 minutes, processed according to the manufacturer’s instructions in the RNAscope Fluorescent Multiplex Assay manual for fresh frozen tissue (Advanced Cell Diagnostics, Newark, CA), and coverslipped with ProLong Gold antifade reagent with DAPI (Molecular Probes). The following probes were used: oxytocin receptor (OxtR), vasopressin type 1a receptor (V1aR), tyrosine hydroxylase channel 2 (TH), and SLC32A1 channel 3 (VGAT). Probes were added to slides in combinations of OxtR/TH/VGAT or V1aR/TH/VGAT, and the Amp4-b fluorescent amplification reagent was used for all experiments. Sections were subsequently imaged on a Leica SP5 confocal microscope in four channels with a 40x objective lens at a zoom of 1.4 at a resolution of 512 × 512 pixels with 0.5 μm between adjacent z-sections. FISH fluorescent signals were averaged four times to minimize background noise. Images were taken across the entirety of the population of dopaminergic neurons in each brain section.
Image analysis.
Co-localization of oxytocinergic tdTomato+ cells with GRB+ cells and neurons immunoreactive against oxytocin was determined using confocal images of the PVN in 5–7 sections per brain. Co-localization of PVN oxytocin neurons with other cell types, including GABAergic neurons and vasopressin neurons, was quantified by immunostaining tissue from Vgat i-Cre; tdTomato and Avp i-Cre; tdTomato mice with anti-oxytocin antibody (2–3 mice for each condition). Images were collected and saved for manual counts by one independent blinded observer. The length of oxytocinergic axons in the VTA and SNc was quantified using confocal images of the VTA and SNc, 4 sections per mouse brain. Axonal length was measured in Z projected imaging using Simple Neurite Tracer in FIJI/ImageJ (Schindelin et al., 2012). To quantify OxtR expression in the VTA and SNc, confocal images of OxtR and TH immunolabeling were acquired under the same imaging parameters and analyzed with ImageJ and MATLAB. Three adjacent z-stack slices were combined, and TH signal was filtered with a 5 × 5 Gaussian filter and thresholded. Thresholds were determined by comparing the manual detection to automated detection for several images from the slice, and the same thresholds were used for the remaining images.
FISH images were analyzed using a custom MATLAB script utilizing imreadBF for file loading and a modified version of Fast 2D peak finder. Briefly, four adjacent z-stack slices were combined, for a total of ~2 μm of cells. In general, combining between 2 and 3 μm was optimal to ensure that differences in subcellular localization of RNA transcripts did not result in missed colocalization, while minimizing false positive colocalization driven by signal from a second cell at a different depth in a similar x-y position. All channels were thresholded to remove background signal. Watershed segmentation of the image was performed using the DAPI channel information to localize cell bodies. Puncta of FISH molecules were then counted within established cell boundaries; whether a cell was considered positive for a given marker was determined by setting a transcript-dependent threshold of the number of puncta. This threshold was determined by comparing the count of cells given from a manual count of cells to the histogram of puncta per cell given by the automated program for several images from the slice, and applying that threshold in the remaining images. These stringent parameters for co-localization and the challenges of quantifying low abundance receptor transcripts likely lead to underestimation of receptor-positive population sizes.
Acute slice preparation and electrophysiology.
Coronal brain slice preparation was modified from previously published procedures (Kozorovitskiy et al., 2012). Animals were deeply anesthetized by inhalation of isoflurane, followed by a transcardial perfusion with ice-cold, oxygenated artificial cerebrospinal fluid (ACSF) containing (in mM) 127 NaCl, 2.5 KCl, 25 NaHCO3, 1.25 NaH2PO4, 2.0 CaCl2, 1.0 MgCl2, and 25 glucose (osmolarity ~310 mOsm/L). After perfusion, the brain was rapidly removed, and immersed in ice-cold ACSF, equilibrated with 95%O2/5%CO2. Tissue was blocked and transferred to a slicing chamber containing ice-cold ACSF, supported by a small block of 4% agar. Bilateral 250 μm-thick slices were cut on a Leica VT1000s in a caudo-rostral direction and transferred into a holding chamber with ACSF, equilibrated with 95%O2/5%CO2. Slices were incubated at 34°C for ~30 minutes prior to electrophysiological recording.
Slices were transferred to a recording chamber perfused with oxygenated ACSF at a rate of 2–4 ml/min and ACSF was warmed to 30–34°C by passing it through a feedback-controlled in-line heater (TC-324C; Warner Instruments, Hamden, CT). Whole-cell and cell-attached recordings were obtained from neurons in the VTA and SNc visualized under infrared DODT contrast video microscopy using patch pipettes of ~2–5 MΩ resistance. Dopaminergic neurons were identified on the basis of tdTomato expression whenever possible, or on the basis of the combination of their electrophysiological and morphological properties (Ungless and Grace, 2012; Wanat et al., 2008). In addition, a large proportion of acute brain slices from Oxt i-Cre mice used for electrophysiological recording in optogenetic experiments were immersed in fixative and immunolabeled for tyrosine hydroxylase at the end of the experiment, in order to further validate neuronal identity assessed using electrophysiological and morphological parameters.
For recording spontaneous firing rate and membrane potential, the internal solution consisted of (in mM): 135 K-gluconate, 4 KCl, 10 HEPES, 10 Na-phosphocreatine, 4 MgATP, 0.4 Na2GTP, and 1 EGTA (pH 7.2, ~295 mOsm/L). For the recordings of spontaneous inhibitory postsynaptic currents (sIPSCs), neurons were held at −70 mV with high chloride internal solution consisting of (in mM): 100 CsCl, 35 CsF, 4 MgCl2, 10 HEPES, 10 Na-phosphocreatine, 4 MgATP, 0.4 Na2GTP, and 1 EGTA (pH 7.2, ~295 mOsm/L). Alexa Fluor 488 (10–20 μM) or 594 (10–20 μM) or Neurobiotin (0.1%, Neurobiotin 488 tracer, Vector Laboratories, Burlingame, CA) were added to the internal to visualize cell morphology and confirm cell identity and location. Recordings were made using 700B amplifiers (Axon Instruments, Union City, CA); data were sampled at 10 kHz and filtered at 3 kHz with a MATLAB-based acquisition script (MathWorks, Natick, MA). Series resistance, measured with a 5 mV hyperpolarizing pulse in voltage clamp, was under 20 MΩ and was left uncompensated.
To activate ChR2-expressing cell bodies or fibers of oxytocinergic neurons, 10 ms-long light pulses (470 nm, 50 Hz for 15 sec, 5–10 mW/mm2) were delivered at the recording site using whole-field illumination through a 60X water-immersion objective (Olympus, Tokyo, Japan) with a PE300 CoolLED illumination system (CoolLED Ltd., Andover, UK). Epifluorescence illumination was used sparingly to minimize ChR2 activation prior to recording and was never used with a GFP filter cube.
For data analysis of pharmacological flow-in experiments, the mean firing rate of each neuron was calculated every 10 seconds. Neuronal activity was classified as either enhanced or inhibited by oxytocin when the instantaneous firing rate change in response to oxytocin application was more than 20% above or below the baseline average instantaneous firing rate. Mean firing rates for baseline, oxytocin, and washout periods were calculated from traces recorded 2–3 minutes before oxytocin application, 3–10 minutes after oxytocin application, and 2–3 minutes following wash-out.
For ex vivo optogenetic experiments, each recorded neuron was first classified as being activated or inactivated by light stimulation. Instantaneous firing rate and resting membrane potential (bin size, 1 second) were compared before (15 sec) and after (20 sec) light stimulation. A threshold of 20% over baseline measurement was imposed to classify a neuron as light-responsive, and response duration was the time that neuronal firing rate was modulated by over 20% of baseline. Because a subset of dopaminergic neurons did not show spontaneous activity, even at near physiological temperatures, only resting potential changes were analyzed for these cells.
2-Photon laser scanning imaging.
We recorded RB-positive or negative oxytocinergic neurons in the PVN with potassium-based internal solution containing Alexa Fluor 488. After 15–20 min-long recording, cell morphology was visualized using Alexa Fluor 488 (10 – 20 μM) excited with 910 nm light. The beam of an 80 MHz Ti:Sapphire laser (Mai Tai eHP DS, Newport) was directed by a two-dimensional galvanometer scanning mirror system (HSA Galvo 8315K, Cambridge Technology). Fluorescence emission was collected by two PMTs above and below the sample (H10770P, Hamamatsu) after passing through a dichroic beam splitter (FF670-SDi01–26×38, Semrock) and a bandpass filter (FF02–520/28, Semrock). We used ScanImage 3.8 to control scanning parameters and image acquisition of 1.5 μm-thick z-stacks through each recorded neuron (Pologruto et al., 2003). Laser intensity was controlled by a Pockels cell and laser power at the sample plane was 10–15 mW. Area of the soma was measured on z-projections with FIJI/ImageJ (Schindelin et al., 2012).
Pharmacology.
Pharmacological agents, except SSR 149415 (Nelivaptan, 10 μM, Axon Medchem, Groningen, Netherlands), were acquired from Tocris (Bristol, UK) or Sigma-Aldrich (St. Louis, MO). Drugs were applied by bath perfusion: Oxt (1 μM), WAY 267464 (1 μM), L-368,899 hydrochloride (5 μM), L741,626 (10 μM), SR 49059 (5 μM), CGP54626 hydrochloride (10 μM), gallein (20 μM), SR 95531 hydrobromide (10 μM), NBQX (10 μM), and CPP (10 μM).
Quantification and Statistical Analysis
Offline analyses of electrophysiology were performed using MATLAB (Mathworks, Natick, MA) and Igor Pro (Wavemetrics, Portland, OR). All image analysis was carried out in ImageJ (FIJI, NIH) (Schindelin et al., 2012). Whenever possible, data were analyzed blind to condition. For N sizes, both the number of neurons recorded and the number of animals are provided. Sex and age were balanced across groups. Statistical analyses were done using GraphPad Prizm 5 software (GraphPad, LaJolla, CA). Group data are expressed as means ± SEM. For two group comparisons, statistical significance was determined by two-tailed paired or unpaired Student’s t-tests or non-parametric analogs, when assumptions for parametric testing were not satisfied. Normality was tested using D’Agostino and Pearson omnibus normality test. For multiple group comparisons, one-way analysis of variance (ANOVA) tests were used for normally distributed data, followed by post hoc analyses. For data that were not normally distributed, non-parametric tests for the appropriate group types were used instead, such as Mann-Whitney. p < 0.05 was considered statistically significant.
Supplementary Material
KEY RESOURCES TABLE
| REAGENT or RESOURCE | SOURCE | IDENTIFIER |
|---|---|---|
| Antibodies | ||
| Rabbit anti-tyrosine hydroxylase | Millipore | Cat#AB152; RRID:AB_390204 |
| Mouse anti-tyrosine hydroxylase | Abcam | Cat#AB129991; RRID:AB_11156128 |
| Rabbit anti-oxytocin | Peninsula Laboratories | Cat#T-4084; RRID:AB_518524 |
| Rabbit anti-oxytocin receptor | Alomone Labs | Cat#AVR-013; RRID:AB_2651123 |
| Goat anti-mouse Alexa 488/594/647 | Thermo Fisher Scientific | Cat#A-11029/11032/21236; RRID:AB_2534088/ AB_2534091/ AB_141725 |
| Goat anti-rabbit Alexa 488/594/647 | Thermo Fisher Scientific | Cat#A-11034/11037/21244; RRID:AB_2576217/ AB_2534095/ AB_2535812 |
| Rabbit anti-oxytocin receptor (OxtR-2) | Gift from R. Froemke | Marlin et al., 2015 Mitre et al., 2016 |
| Biological Samples | ||
| NA | ||
| Chemicals, Peptides, and Recombinant Proteins | ||
| Oxytocin | Tocris | Cat#1910; CAS 50–56-6 |
| L-368,899 hydrochloride | Tocris | Cat#2641; CAS 160312–62-9 |
| L741,626 | Tocris | Cat#1003; CAS 81226–60-0 |
| SR 49059 | Tocris | Cat#2310; CAS 150375–75-0 |
| CGP54626 hydrochloride | Tocris | Cat#1088; CAS 149184–21-4 |
| NBQX disodium salt | Tocris | Cat#1044; CAS 479347–86-9 |
| (RS)-CPP | Tocris | Cat#0173; CAS 100828–16-8 |
| SR95531 hydrobromide | Tocris | Cat#1262; CAS 104104–50-9 |
| Gallein | Tocris | Cat#3090; CAS 2103–64-2 |
| WAY 267464 dihydrochloride | Tocris | Cat#3933; CAS 1432043–31-6 |
| SSR149415 | Axon Medchem | Cat#CS-CM-00328; CAS 439687–69-1 |
| Neurobiotin 488 | Vector Laboratories | Cat#SP-1125 |
| Alexa Fluor 488 hydrazide | Thermo Fisher Scientific | Cat#A10436 |
| Alexa Fluor 594 hydrazide | Thermo Fisher Scientific | Cat#A10438 |
| Green retrobeads (GRB) | Lumafluor Inc. | Cat#G180 |
| Red retrobeads (RRB) | Lumafluor Inc. | Cat#R180 |
| Critical Commercial Assays | ||
| RNAscope Fluorescence Multiplex Assay | ACDBio | |
| RNAscope® Probe- Mm-Slc32a1-C3 | ACDBio | Cat#319191-C3 |
| RNAscope® Probe- Mm-Th-C2 | ACDBio | Cat#317621-C2 |
| RNAscope® Probe- Mm-Oxtr | ACDBio | Cat#412171 |
| RNAscope® Probe- Mm-Avpr1a | ACDBio | Cat#418061 |
| Deposited Data | ||
| NA | ||
| Experimental Models: Cell Lines | ||
| NA | ||
| Experimental Models: Organisms/Strains | ||
| Mouse: C57BL/6 | Charles River | Cat#000664; RRID:IMSR_JAX:000664 |
| Mouse: B6.129S-Oxttm1.1(cre)Dolsn/J | Jackson Laboratory | Cat#024234; RRID:IMSR_JAX:024234 |
| Mouse: B6.SJL-Slc6a3tm1.1(cre)Bkmn/J | Jackson Laboratory | Cat#006660; RRID: IMSR_JAX:006660 |
| Mouse: Slc32a1tm2(cre)Lowl | Jackson Laboratory | Cat#016962; RRID:IMSR_JAX:016962 |
| Mouse: B6.Cg-AVPtm1.1(cre)Hze | Jackson Laboratory | Cat#023530; RRID:IMSR_JAX:023530 |
| Mouse: B6.Cg-Gt(ROSA)26Sortm14(CAG-tdTomato)Hze/J | Jackson Laboratory | Cat#007914; RRID:IMSR_JAX:007914 |
| Mouse: B6.129(SJL)-Oxtrtm1.1Wsy/J | Jackson Laboratory | Cat#008471; RRID:IMSR_JAX:008471 |
| Recombinant DNA | ||
| NA | ||
| Sequence-Based Reagents | ||
| AAV9-EF1a-DIO-hChR2(H134R)-mCherry | UPenn viral core | CS0543–3CS |
| AAV9-EF1a-DIO-hChR2(H134R)-eYFP | UPenn viral core | CS0633–3CS |
| AAV9-EF1a-DIO-eYFP | UPenn viral core | CS0659–3CS |
| Software and Algorithms | ||
| GraphPad Prizm 5 | GraphPad | RRID:SCR_002798 |
| FIJI | Schindelin et al., 2012 | http://fiji.sc/#; RRID:SCR_002285 |
| MATLAB | MathWorks | RRID:SCR_001622 |
| Igor Pro | Wavemetrics | RRID:SCR_000325 |
| Other | ||
| Antibodies | ||
| Rabbit monoclonal anti-Snail | Cell Signaling Technology | Cat#3879S; RRID: AB_2255011 |
| Mouse monoclonal anti-Tubulin (clone DM1A) | Sigma-Aldrich | Cat#T9026; RRID: AB_477593 |
| Rabbit polyclonal anti-BMAL1 | This paper | N/A |
| Biological Samples | ||
| Healthy adult BA9 brain tissue | University of Maryland Brain & Tissue Bank; http://medschool.umaryland.edu/btbank/ | Cat#UMB1455 |
| Human hippocampal brain blocks | New York Brain Bank | http://nybb.hs.columbia.edu/ |
| Patient-derived xenografts (PDX) | Children’s Oncology Group Cell Culture and Xenograft Repository | http://cogcell.org/ |
| Chemicals, Peptides, and Recombinant Proteins | ||
| MK-2206 AKT inhibitor | Selleck Chemicals | S1078; CAS: 1032350–13-2 |
| SB-505124 | Sigma-Aldrich | S4696; CAS: 694433–59-5 (free base) |
| Picrotoxin | Sigma-Aldrich | P1675; CAS: 124–87-8 |
| Human TGF-β | R&D | 240-B; GenPept: P01137 |
| Activated S6K1 | Millipore | Cat#14–486 |
| GST-BMAL1 | Novus | Cat#H00000406-P01 |
| Critical Commercial Assays | ||
| EasyTag EXPRESS 35S Protein Labeling Kit | Perkin-Elmer | NEG772014MC |
| CaspaseGlo 3/7 | Promega | G8090 |
| TruSeq ChIP Sample Prep Kit | Illumina | IP-202–1012 |
| Deposited Data | ||
| Raw and analyzed data | This paper | GEO: GSE63473 |
| B-RAF RBD (apo) structure | This paper | PDB: 5J17 |
| Human reference genome NCBI build 37, GRCh37 | Genome Reference Consortium | http://www.ncbi.nlm.nih.gov/projects/genome/assembly/grc/human/ |
| Experimental Models: Cell Lines | ||
| Hamster: CHO cells | ATCC | CRL-11268 |
| D. melanogaster: Cell line S2: S2-DRSC | Laboratory of Norbert Perrimon | FlyBase: FBtc0000181 |
| Human: Passage 40 H9 ES cells | MSKCC stem cell core facility | N/A |
| Human: HUES 8 hESC line (NIH approval number NIHhESC-09–0021) | HSCI iPS Core | hES Cell Line: HUES-8 |
| Experimental Models: Organisms/Strains | ||
| Streptococcus pyogenes: M1 serotype strain: strain SF370; M1 GAS | ATCC | ATCC:700294 |
| C. elegans: Strain BC4011: srl-1(s2500) II; dpy-18(e364) III; unc-46(e177)rol-3(s1040) V.) V. | Caenorhabditis Genetics Center | WB Strain: BC4011; WormBase: WBVar00241916 |
| D. melanogaster: RNAi of Sxl: y[1] sc[*] v[1]; P{TRiP.HMS00609}attP2 | Bloomington Drosophila Stock Center | BDSC:34393; FlyBase: FBtp0064874 |
| S. cerevisiae: Strain background: W303 | ATCC | ATTC: 208353 |
| Mouse: R6/2: B6CBA-Tg(HDexon1)62Gpb/3J | The Jackson Laboratory | JAX: 006494 |
| Mouse: OXTRfl/fl: B6.129(SJL)-Oxtrtm1.1Wsy/J | The Jackson Laboratory | RRID: IMSR_JAX:008471 |
| Zebrafish: Tg(Shha:GFP)t10: t10Tg | Neumann and Nuesslein-Volhard, 2000 | ZFIN: ZDB-GENO-060207–1 |
| Arabidopsis: 35S::PIF4-YFP, BZR1-CFP | Wang et al., 2012 | N/A |
| Arabidopsis: JYB1021.2: pS24(AT5G58010)::cS24:GFP(-G):NOS #1 | NASC | NASC ID: N70450 |
| Recombinant DNA | ||
| pLVX-Tight-Puro (TetOn) | Clonetech | Cat#632162 |
| Plasmid: GFP-Nito | This paper | N/A |
| cDNA GH111110 | Drosophila Genomics Resource Center | DGRC:5666; FlyBase:FBcl0130415 |
| AAV2/1-hsyn-GCaMP6- WPRE | Chen et al., 2013 | N/A |
| Mouse raptor: pLKO mouse shRNA 1 raptor | Thoreen et al., 2009 | Addgene Plasmid #21339 |
| Sequence-Based Reagents | ||
| siRNA targeting sequence: PIP5K I alpha #1: ACACAGUACUCAGUUGAUA | This paper | N/A |
| Primers for XX, see Table SX | This paper | N/A |
| Primer: GFP/YFP/CFP Forward: GCACGACTTCTTCAAGTCCGCCATGCC | This paper | N/A |
| Morpholino: MO-pax2a GGTCTGCTTTGCAGTGAATATCCAT | Gene Tools | ZFIN: ZDB-MRPHLNO-061106–5 |
| ACTB (hs01060665_g1) | Life Technologies | Cat#4331182 |
| RNA sequence: hnRNPA1_ligand: UAGGGACUUAGGGUUCUCUCUAGGGACUUAGGGUUCUCUCUAGGGA | This paper | N/A |
| Software and Algorithms | ||
| Bowtie2 | Langmead and Salzberg, 2012 | http://bowtie-bio.sourceforge.net/bowtie2/index.shtml |
| Samtools | Li et al., 2009 | http://samtools.sourceforge.net/ |
| Other | ||
| Sequence data, analyses, and resources related to the ultra-deep sequencing of the AML31 tumor, relapse, and matched normal. | This paper | http://aml31.genome.wustl.edu |
| Resource website for the AML31 publication | This paper | https://github.com/chrisamiller/aml31SuppSite |
ACKNOWLEDGEMENTS
We thank Lindsey Butler for genotyping and colony management, Kozorovitskiy lab members for comments, and Dr. Robert Froemke for the OxtR-2 antibody. We thank the Northwestern University Biological Imaging Facility and Dr. Tiffany Schmidt for confocal microscope access, and the Transgenic and Targeted Mutagenesis Laboratory for cryorecovery of mouse lines. This work was supported by the Beckman Young Investigator Award, William and Bernice E. Bumpus Young Innovator Award, Rita Allen Foundation Scholar Award, NARSAD Young Investigator and P&S Fund Grant (all Y.K.). M.F.P. was supported by NIH T32 AG20506 and an Arnold O. Beckman Postdoctoral Fellowship.
Footnotes
Publisher's Disclaimer: This is a PDF file of an unedited manuscript that has been accepted for publication. As a service to our customers we are providing this early version of the manuscript. The manuscript will undergo copyediting, typesetting, and review of the resulting proof before it is published in its final form. Please note that during the production process errors may be discovered which could affect the content, and all legal disclaimers that apply to the journal pertain.
REFERENCES
- Angioni L, Cocco C, Ferri GL, Argiolas A, Melis MR, Sanna F (2016). Involvement of nigral oxytocin in locomotor activity: A behavioral, immunohistochemical and lesion study in male rats. Horm. Behav 83, 23–38. [DOI] [PubMed] [Google Scholar]
- Bäckman CM, Malik N, Zhang Y, Shan L, Grinberg A, Hoffer BJ, Westphal H, Tomac AC (2006). Characterization of a mouse strain expressing Cre recombinase from the 3’ untranslated region of the dopamine transporter locus. Genesis 44, 383–90. [DOI] [PubMed] [Google Scholar]
- Banghart MR, Neufeld SQ, Wong NC, Sabatini BL (2015). Enkephalin Disinhibits Mu Opioid Receptor-Rich Striatal Patches via Delta Opioid Receptors. Neuron 88, 1227–39. [DOI] [PMC free article] [PubMed] [Google Scholar]
- Bao S, Chan VT, Merzenich MM (2001). Cortical remodelling induced by activity of ventral tegmental dopamine neurons. Nature 412, 79–83. [DOI] [PubMed] [Google Scholar]
- Baskerville TA, Douglas AJ (2010). Dopamine and oxytocin interactions underlying behaviors: potential contributions to behavioral disorders. CNS Neurosci Ther 16, e92–123. [DOI] [PMC free article] [PubMed] [Google Scholar]
- Bayer SA, Wills KV, Triarhou LC, Thomas JD, Ghetti B (1995). Systematic differences in time of dopaminergic neuron origin between normal mice and homozygous weaver mutants. Exp. brain Res 105, 200–8. [DOI] [PubMed] [Google Scholar]
- Beier KT, Steinberg EE, DeLoach KE, Xie S, Miyamichi K, Schwarz L, Gao XJ, Kremer EJ, Malenka RC, Luo L (2015). Circuit Architecture of VTA Dopamine Neurons Revealed by Systematic Input-Output Mapping. Cell 162, 622–34. [DOI] [PMC free article] [PubMed] [Google Scholar]
- Briffaud V, Williams P, Courty J, Broberger C (2015). Excitation of tuberoinfundibular dopamine neurons by oxytocin: crosstalk in the control of lactation. J Neurosci 35, 4229–37. [DOI] [PMC free article] [PubMed] [Google Scholar]
- Bromberg-Martin ES, Matsumoto M, Hikosaka O (2010). Dopamine in motivational control: rewarding, aversive, and alerting. Neuron 68, 815–34. [DOI] [PMC free article] [PubMed] [Google Scholar]
- Burkett JP, Andari E, Johnson ZV, Curry DC, de Waal FBM, Young LJ (2016). Oxytocin-dependent consolation behavior in rodents. Science 351, 375–8. [DOI] [PMC free article] [PubMed] [Google Scholar]
- Busnelli M, Saulière A, Manning M, Bouvier M, Galés C, Chini B (2012). Functional selective oxytocin-derived agonists discriminate between individual G protein family subtypes. J. Biol. Chem 287, 3617–29. [DOI] [PMC free article] [PubMed] [Google Scholar]
- Crowley WR (2015). Neuroendocrine regulation of lactation and milk production. Compr. Physiol 5, 255–91. [DOI] [PubMed] [Google Scholar]
- Dölen G, Darvishzadeh A, Huang KW, Malenka RC (2013). Social reward requires coordinated activity of nucleus accumbens oxytocin and serotonin. Nature 501, 179–84. [DOI] [PMC free article] [PubMed] [Google Scholar]
- Dubois-Dauphin M, Barberis C, De Bilbao F (1996). Vasopressin receptors in the mouse (Mus musculus) brain: Sex-related expression in the medial preoptic area and hypothalamus. Brain Res. 743, 32–9. [DOI] [PubMed] [Google Scholar]
- Duke DC, Moran LB, Pearce RKB, Graeber MB (2007). The medial and lateral substantia nigra in Parkinson’s disease: mRNA profiles associated with higher brain tissue vulnerability. Neurogenetics 8, 83–94. [DOI] [PubMed] [Google Scholar]
- Eliava M, Melchior M, Knobloch-Bollmann HS, Wahis J, da Silva Gouveia M, Tang Y, Ciobanu AC, Triana del Rio R, Roth LC, Althammer F, et al. (2016). A New Population of Parvocellular Oxytocin Neurons Controlling Magnocellular Neuron Activity and Inflammatory Pain Processing. Neuron 89, 1291–304. [DOI] [PMC free article] [PubMed] [Google Scholar]
- Fujiwara Y, Hiroyama M, Sanbe A, Yamauchi J, Tsujimoto G, Tanoue A (2007). Mutual regulation of vasopressin- and oxytocin-induced glucagon secretion in V1b vasopressin receptor knockout mice. J. Endocrinol 192, 361–9. [DOI] [PubMed] [Google Scholar]
- Fuxe K, Borroto-Escuela DO, Romero-Fernandez W, Ciruela F, Manger P, Leo G, Díaz-Cabiale Z, Agnati LF (2012). On the role of volume transmission and receptor–receptor interactions in social behaviour: Focus on central catecholamine and oxytocin neurons. Brain Res. 1476, 119–31. [DOI] [PubMed] [Google Scholar]
- Gao S, Becker B, Luo L, Geng Y, Zhao W, Yin Y, Hu J, Gao Z, Gong Q, Hurlemann R, Yao D, Kendrick KM (2016). Oxytocin, the peptide that bonds the sexes also divides them. Proc. Natl. Acad. Sci 113, 7650–4. [DOI] [PMC free article] [PubMed] [Google Scholar]
- Gimpl G, Fahrenholz F (2001). The oxytocin receptor system: structure, function, and regulation. Physiol Rev 81, 629–83. [DOI] [PubMed] [Google Scholar]
- Grinevich V, Knobloch-Bollmann HS, Eliava M, Busnelli M, Chini B (2016). Assembling the Puzzle: Pathways of Oxytocin Signaling in the Brain. Biol. Psychiatry 79, 155–64. [DOI] [PubMed] [Google Scholar]
- Guzman JN, Sanchez-Padilla J, Chan CS, Surmeier DJ (2009). Robust pacemaking in substantia nigra dopaminergic neurons. J Neurosci 29, 11011–9. [DOI] [PMC free article] [PubMed] [Google Scholar]
- Harris JA, Hirokawa KE, Sorensen SA, Gu H, Mills M (2014). Anatomical characterization of Cre driver mice for neural circuit mapping and manipulation. Front Neural Circuits 8, 76. [DOI] [PMC free article] [PubMed] [Google Scholar]
- Hebb MO, Robertson HA (2000). Identification of a subpopulation of substantia nigra pars compacta gamma-aminobutyric acid neurons that is regulated by basal ganglia activity. J. Comp. Neurol 416, 30–44. [DOI] [PubMed] [Google Scholar]
- Howe MW, Dombeck DA (2016). Rapid signalling in distinct dopaminergic axons during locomotion and reward. Nature 535, 505–10. [DOI] [PMC free article] [PubMed] [Google Scholar]
- Huber D, Veinante P, Stoop R (2005). Vasopressin and oxytocin excite distinct neuronal populations in the central amygdala. Science 308, 245–8. [DOI] [PubMed] [Google Scholar]
- Insel TR, Shapiro LE (1992). Oxytocin receptors and maternal behavior. Ann. N. Y. Acad. Sci 652, 122–41. [DOI] [PubMed] [Google Scholar]
- Knobloch HS, Charlet A, Hoffmann LC, Eliava M, Khrulev S, Cetin AH, Osten P, Schwarz MK, Seeburg PH, Stoop R, Grinevich V (2012). Evoked axonal oxytocin release in the central amygdala attenuates fear response. Neuron 73, 553–66. [DOI] [PubMed] [Google Scholar]
- Kozorovitskiy Y, Saunders A, Johnson CA, Lowell BB, Sabatini BL (2012). Recurrent network activity drives striatal synaptogenesis. Nature 485, 646–50. [DOI] [PMC free article] [PubMed] [Google Scholar]
- Lammel S, Ion DI, Roeper J, Malenka RC (2011). Projection-specific modulation of dopamine neuron synapses by aversive and rewarding stimuli. Neuron 70, 855–62. [DOI] [PMC free article] [PubMed] [Google Scholar]
- Landgraf R, Neumann ID (2004). Vasopressin and oxytocin release within the brain: a dynamic concept of multiple and variable modes of neuropeptide communication. Front. Neuroendocrinol 25, 150–76. [DOI] [PubMed] [Google Scholar]
- Lee B, Yang C, Chen TH, al-Azawi N, Hsu WH (1995). Effect of AVP and oxytocin on insulin release: involvement of V1b receptors. Am J Physiol 269, E1095–100. [DOI] [PubMed] [Google Scholar]
- Lee H-J, Caldwell HK, Macbeth AH, Tolu SG, Young WS (2008). A conditional knockout mouse line of the oxytocin receptor. Endocrinology 149, 3256–63. [DOI] [PMC free article] [PubMed] [Google Scholar]
- Lerner TN, Shilyansky C, Davidson TJ, Evans KE, Beier KT, Zalocusky KA, Crow AK, Malenka RC, Luo L, Tomer R, Deisseroth K (2015). Intact-Brain Analyses Reveal Distinct Information Carried by SNc Dopamine Subcircuits. Cell 162, 635–47. [DOI] [PMC free article] [PubMed] [Google Scholar]
- Liu Y, Wang ZX (2003). Nucleus accumbens oxytocin and dopamine interact to regulate pair bond formation in female prairie voles. Neuroscience 121, 537–44. [DOI] [PubMed] [Google Scholar]
- Lou Y, Luo W, Zhang G, Tao C, Chen P, Zhou Y, Xiong Y (2014). Ventral tegmental area activation promotes firing precision and strength through circuit inhibition in the primary auditory cortex. Front. Neural Circuits 8, 25. [DOI] [PMC free article] [PubMed] [Google Scholar]
- Love TM (2014). Oxytocin, motivation and the role of dopamine. Pharmacol. Biochem. Behav 119, 49–60. [DOI] [PMC free article] [PubMed] [Google Scholar]
- Ludwig M, Sabatier N, Bull PM, Landgraf R, Dayanithi G, Leng G (2002). Intracellular calcium stores regulate activity-dependent neuropeptide release from dendrites. Nature 418, 85–9. [DOI] [PubMed] [Google Scholar]
- Luther JA, Tasker JG (2000). Voltage-gated currents distinguish parvocellular from magnocellular neurones in the rat hypothalamic paraventricular nucleus. J. Physiol. 523 Pt 1, 193–209. [DOI] [PMC free article] [PubMed] [Google Scholar]
- Manning M, Stoev S, Chini B, Durroux T, Mouillac B, Guillon G (2008). Peptide and non-peptide agonists and antagonists for the vasopressin and oxytocin V1a, V1b, V2 and OT receptors: research tools and potential therapeutic agents. Prog. Brain Res 170, 473–512. [DOI] [PubMed] [Google Scholar]
- Marlin BJ, Mitre M, D’Amour JA, Chao MV, Froemke RC (2015). Oxytocin enables maternal behaviour by balancing cortical inhibition. Nature 520, 499–504. [DOI] [PMC free article] [PubMed] [Google Scholar]
- Mazzuca M, Minlebaev M, Shakirzyanova A, Tyzio R, Taccola G, Janackova S, Gataullina S, Ben-Ari Y, Giniatullin R, Khazipov R (2011). Newborn Analgesia Mediated by Oxytocin during Delivery. Front. Cell. Neurosci 5, 3. [DOI] [PMC free article] [PubMed] [Google Scholar]
- Mezey E, Kiss JZ (1991). Coexpression of Vasopressin and Oxytocin in Hypothalamic Supraoptic Neurons of Lactating Rats. Endocrinology 129, 1814–20. [DOI] [PubMed] [Google Scholar]
- Mitre M, Marlin BJ, Schiavo JK, Morina E, Norden SE, Hackett TA, Aoki CJ, Chao MV, Froemke RC (2016). A Distributed Network for Social Cognition Enriched for Oxytocin Receptors. J. Neurosci 36, 2517–35. [DOI] [PMC free article] [PubMed] [Google Scholar]
- Mouillac B, Chini B, Balestre MN, Elands J, Trumpp-Kallmeyer S, Hoflack J, Hibert M, Jard S, Barberis C (1995). The binding site of neuropeptide vasopressin V1a receptor. Evidence for a major localization within transmembrane regions. J. Biol. Chem 270, 25771–7. [DOI] [PubMed] [Google Scholar]
- Mullis K, Kay K, Williams DL (2013). Oxytocin action in the ventral tegmental area affects sucrose intake. Brain Res. 1513, 85–91. [DOI] [PMC free article] [PubMed] [Google Scholar]
- Oettl L-L, Ravi N, Schneider M, Scheller MF, Schneider P, Mitre M, da Silva Gouveia M, Froemke RC, Chao MV, Young SW, Meyer-Lindenberg A, Grinevich V, Shusterman R, Kelsch W (2016). Oxytocin enhances social recognition by modulating cortical control of early olfactory processing. Neuron 90, 609–21. [DOI] [PMC free article] [PubMed] [Google Scholar]
- Ostrowski NL, Lolait SJ, Young WS (1994). Cellular localization of vasopressin V1a receptor messenger ribonucleic acid in adult male rat brain, pineal, and brain vasculature. Endocrinology 135, 1511–28. [DOI] [PubMed] [Google Scholar]
- Peris J, MacFadyen K, Smith JA, de Kloet AD, Wang L, Krause EG (2017). Oxytocin receptors are expressed on dopamine and glutamate neurons in the mouse ventral tegmental area that project to nucleus accumbens and other mesolimbic targets. J. Comp. Neurol 525, 1094–108. [DOI] [PMC free article] [PubMed] [Google Scholar]
- Pologruto TA, Sabatini BL, Svoboda K (2003). ScanImage: flexible software for operating laser scanning microscopes. Biomed. Eng. Online 2, 13. [DOI] [PMC free article] [PubMed] [Google Scholar]
- Purba JS, Hofman MA, Swaab DF (1994). Decreased number of oxytocin-immunoreactive neurons in the paraventricular nucleus of the hypothalamus in Parkinson’s disease. Neurology 44, 84–9. [DOI] [PubMed] [Google Scholar]
- Qiu F, Qiu C-Y, Cai H, Liu T-T, Qu Z-W, Yang Z, Li J-D, Zhou Q-Y, Hu W-P (2014). Oxytocin inhibits the activity of acid-sensing ion channels through the vasopressin, V1A receptor in primary sensory neurons. Br. J. Pharmacol 171, 3065–76. [DOI] [PMC free article] [PubMed] [Google Scholar]
- Schindelin J, Arganda-Carreras I, Frise E, Kaynig V, Longair M, Pietzsch T, Preibisch S, Rueden C, Saalfeld S, Schmid B, et al. (2012). Fiji: an open-source platform for biological-image analysis. Nat. Methods 9, 676–82. [DOI] [PMC free article] [PubMed] [Google Scholar]
- Schorscher-Petcu A, Sotocinal S, Ciura S, Dupré A, Ritchie J, Sorge RE, Crawley JN, Hu SB, Nishimori K, Young LJ, Tribollet E, Quirion R, Mogil JS (2010). Oxytocin-induced analgesia and scratching are mediated by the vasopressin-1A receptor in the mouse. J. Neurosci 30, 8274–84. [DOI] [PMC free article] [PubMed] [Google Scholar]
- Schultz W (2007). Behavioral dopamine signals. Trends Neurosci 30, 203–210. [DOI] [PubMed] [Google Scholar]
- Shah BP, Vong L, Olson DP, Koda S, Krashes MJ, Ye C, Yang Z, Fuller PM, Elmquist JK, Lowell BB (2014). MC4R-expressing glutamatergic neurons in the paraventricular hypothalamus regulate feeding and are synaptically connected to the parabrachial nucleus. Proc. Natl. Acad. Sci 111, 13193–8. [DOI] [PMC free article] [PubMed] [Google Scholar]
- Shahrokh DK, Zhang TY, Diorio J, Gratton A, Meaney MJ (2010). Oxytocin-dopamine interactions mediate variations in maternal behavior in the rat. Endocrinology 151, 2276–86. [DOI] [PMC free article] [PubMed] [Google Scholar]
- Skuse DH, Gallagher L (2009). Dopaminergic-neuropeptide interactions in the social brain. Trends Cogn Sci 13, 27–35. [DOI] [PubMed] [Google Scholar]
- Song Z, Borland JM, Larkin TE, O’Malley M, Albers HE (2016). Activation of oxytocin receptors, but not arginine-vasopressin (AVP) receptors, in the ventral tegmental area of male Syrian hamsters is essential for the reward-like properties of social interactions. Psychoneuroendocrinology 74, 164–72. [DOI] [PMC free article] [PubMed] [Google Scholar]
- Stoop R (2012). Neuromodulation by Oxytocin and Vasopressin. Neuron 76, 142–59. [DOI] [PubMed] [Google Scholar]
- Tang Y, Chen Z, Tao H, Li C, Zhang X, Tang A, Liu Y (2014). Oxytocin activation of neurons in ventral tegmental area and interfascicular nucleus of mouse midbrain. Neuropharmacology 77, 277–84. [DOI] [PubMed] [Google Scholar]
- Tribollet E, Barberis C, Jard S, Dubois-Dauphin M, Dreifuss JJ (1988). Localization and pharmacological characterization of high affinity binding sites for vasopressin and oxytocin in the rat brain by light microscopic autoradiography. Brain Res. 442, 105–18. [DOI] [PubMed] [Google Scholar]
- Tyzio R, Cossart R, Khalilov I, Minlebaev M, Hübner CA, Represa A, Ben-Ari Y, Khazipov R (2006). Maternal oxytocin triggers a transient inhibitory switch in GABA signaling in the fetal brain during delivery. Science 314, 1788–92. [DOI] [PubMed] [Google Scholar]
- Ungless MA, Grace AA (2012). Are you or aren’t you? Challenges associated with physiologically identifying dopamine neurons. Trends Neurosci. 35, 422–30. [DOI] [PMC free article] [PubMed] [Google Scholar]
- Vaccari C, Lolait SJ, Ostrowski NL (1998). Comparative Distribution of Vasopressin V1b and Oxytocin Receptor Messenger Ribonucleic Acids in Brain. Endocrinology 139, 5015–33. [DOI] [PubMed] [Google Scholar]
- Veinante P, Freund-Mercier MJ (1997). Distribution of oxytocin- and vasopressin-binding sites in the rat extended amygdala: a histoautoradiographic study. J. Comp. Neurol 383, 305–25. [PubMed] [Google Scholar]
- Vong L, Ye C, Yang Z, Choi B, Chua S, Lowell BB (2011). Leptin Action on GABAergic Neurons Prevents Obesity and Reduces Inhibitory Tone to POMC Neurons. Neuron 71, 142–54. [DOI] [PMC free article] [PubMed] [Google Scholar]
- Walsh JJ, Han MH (2014). The heterogeneity of ventral tegmental area neurons: Projection functions in a mood-related context. Neuroscience 282, 101–8. [DOI] [PMC free article] [PubMed] [Google Scholar]
- Wanat MJ, Hopf FW, Stuber GD, Phillips PEM, Bonci A (2008). Corticotropin-releasing factor increases mouse ventral tegmental area dopamine neuron firing through a protein kinase C-dependent enhancement of I h. J. Physiol 586, 2157–70. [DOI] [PMC free article] [PubMed] [Google Scholar]
- Watabe-Uchida M, Zhu L, Ogawa SK, Vamanrao A, Uchida N (2012). Whole-brain mapping of direct inputs to midbrain dopamine neurons. Neuron 74, 858–73. [DOI] [PubMed] [Google Scholar]
- Wise RA (2004). Dopamine, learning and motivation. Nat Rev Neurosci 5, 483–94. [DOI] [PubMed] [Google Scholar]
- Young L, Wang Z (2004). The neurobiology of pair bonding. Nat Neurosci 7, 1048–54. [DOI] [PubMed] [Google Scholar]
- Zheng JJ, Li SJ, Zhang XD, Miao WY, Zhang D, Yao H, Yu X (2014). Oxytocin mediates early experience-dependent cross-modal plasticity in the sensory cortices. Nat Neurosci 17, 391–9. [DOI] [PubMed] [Google Scholar]
Associated Data
This section collects any data citations, data availability statements, or supplementary materials included in this article.