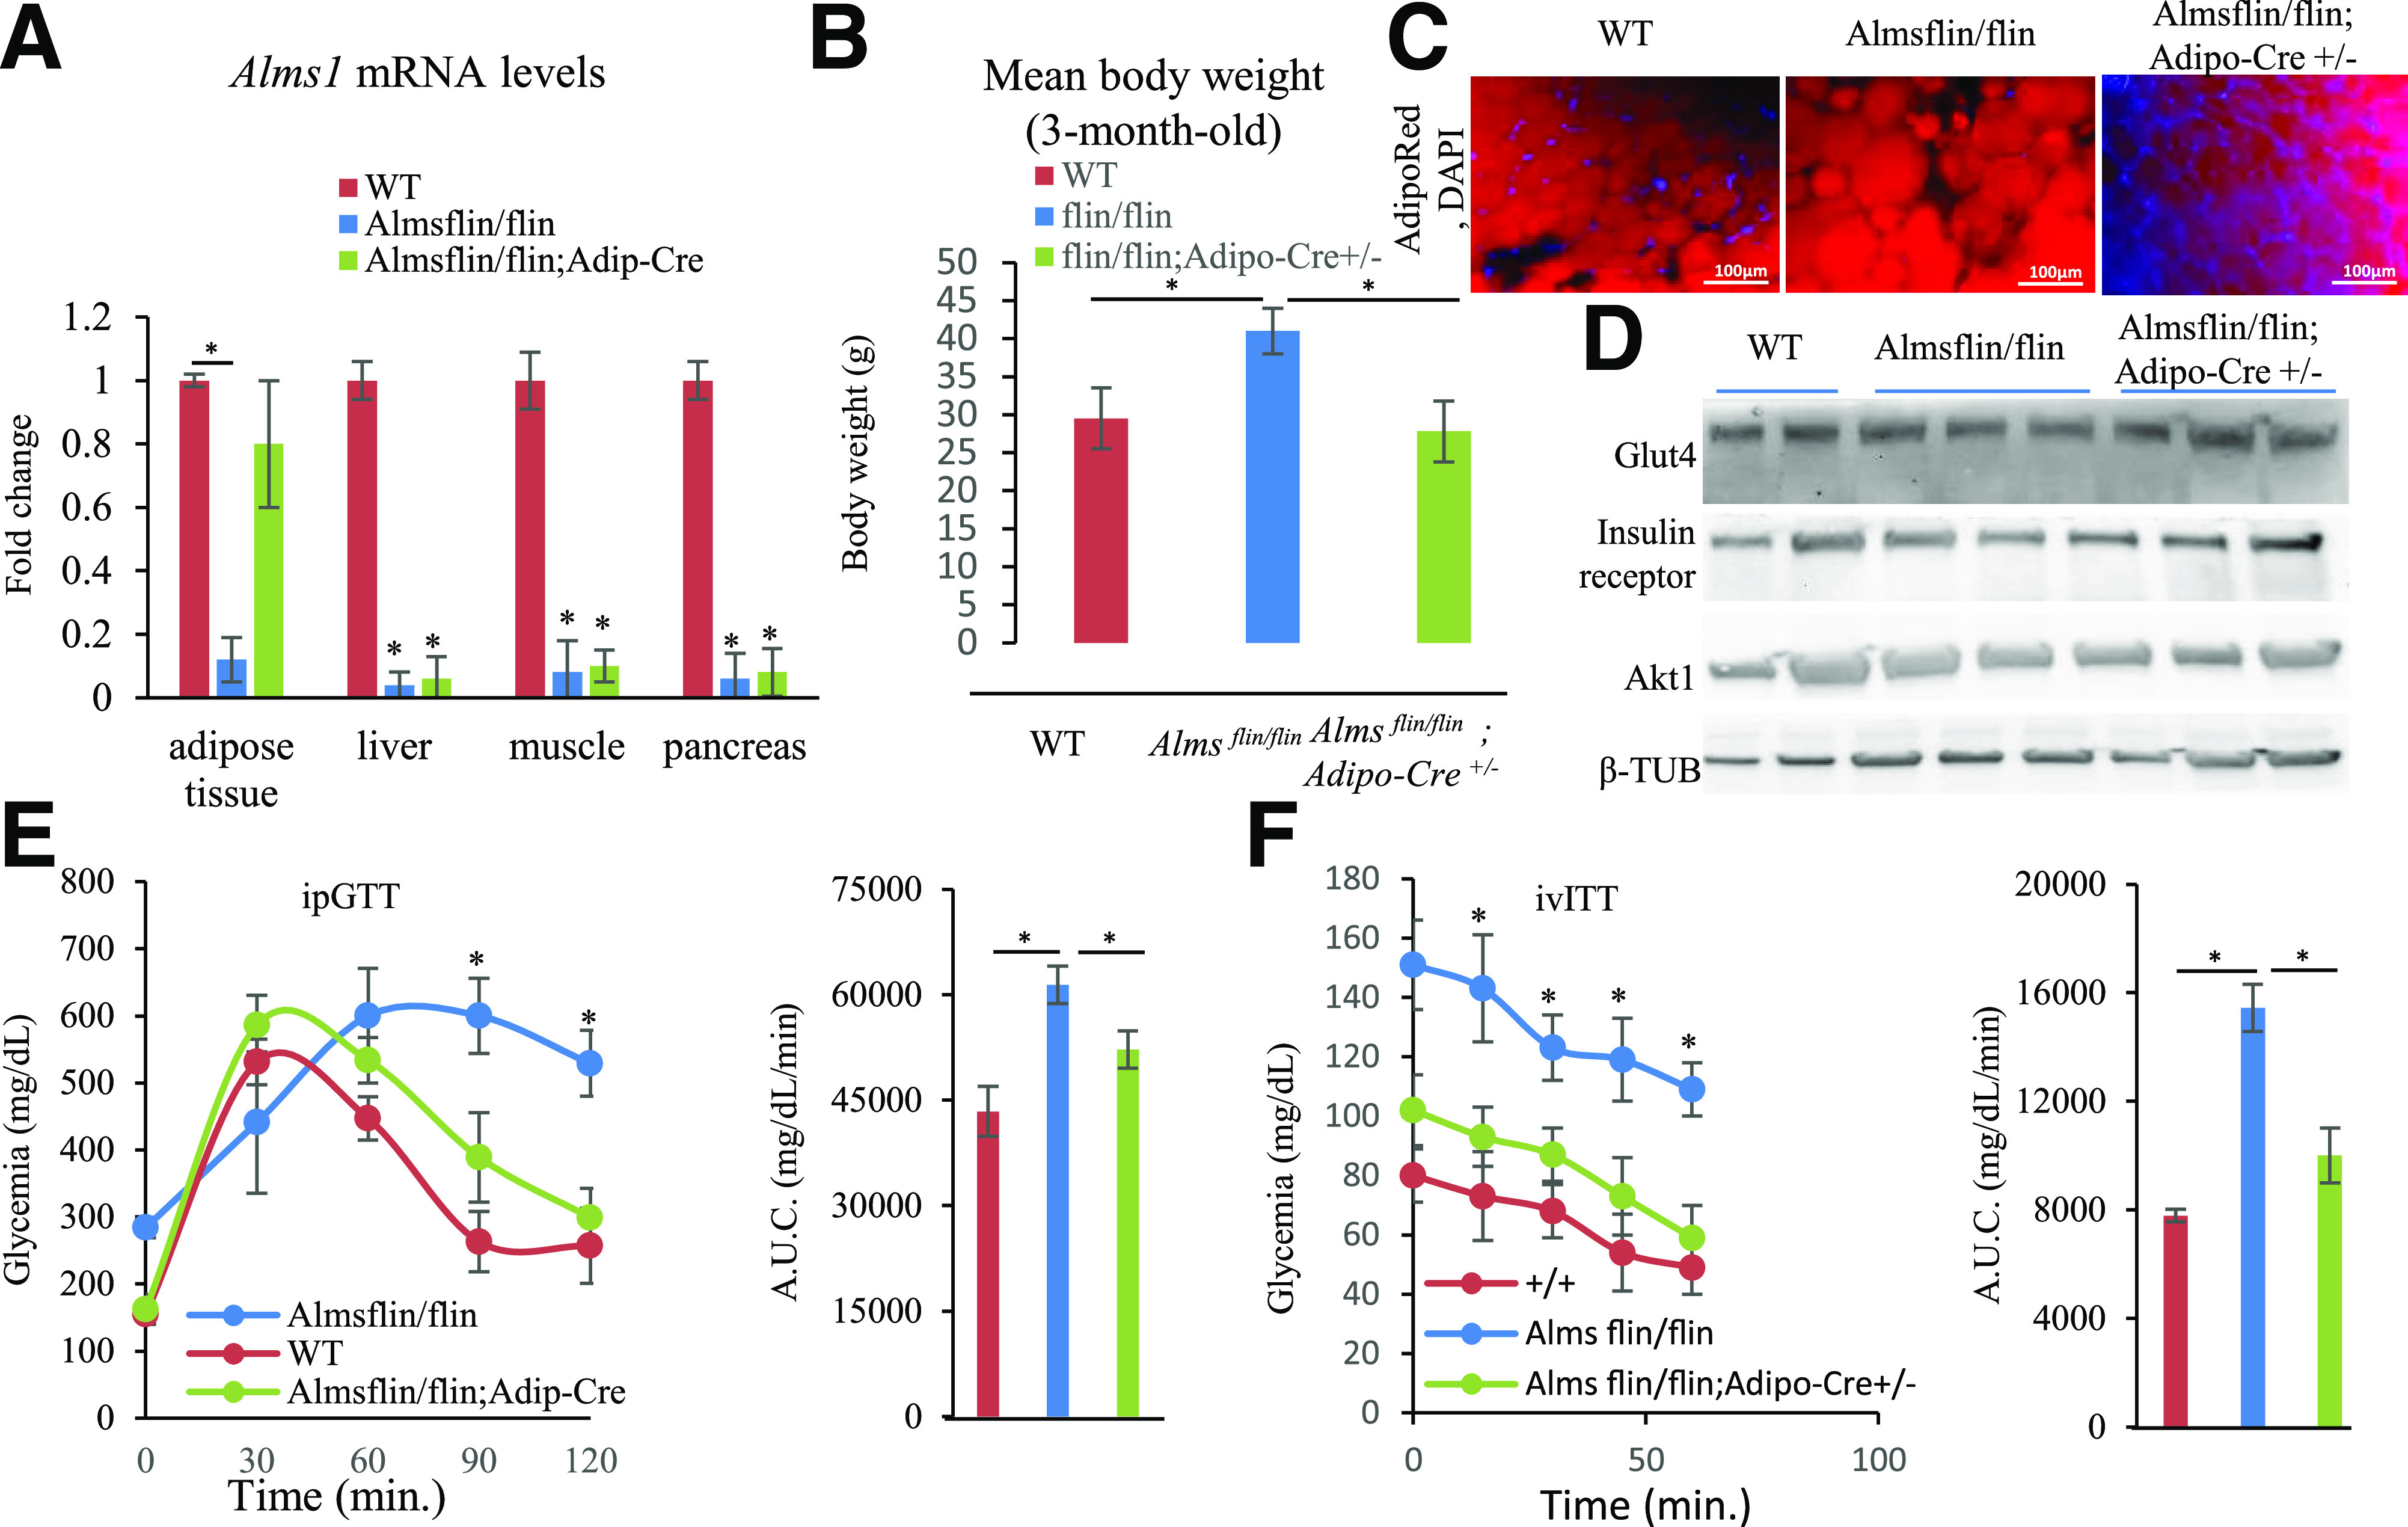
Figure 4.

Metabolic characterization of Almsflin/flin and Almsflin/flin; Adipo-Cre+/− mice. A: Fold change in Alms1 expression levels measured by real-time PCR in the indicated tissues for the given genotypes. Gapdh as reference gene. n = 5 per group with significance set at *P < 0.01. B: Mean body weight from 3-month-old male mice on chow diet. n = 8 per group with significance set at *P < 0.05. C: Visceral AT from 3-month-old male mice stained with AdipoRed. D: Immunodetection of GLUT4, insulin receptor, AKT serine/threonine kinase 1 (AKT1), and β-tubulin (β-tubulin) in 3-month-old visceral AT (25 μg total protein loaded per lane). E: Intraperitoneal GTT (ipGTT) and corresponding histogram showing AUC P < 0.005 from 3-month-old male mice. F: Intravenous ITT (ivITT) and corresponding histogram showing AUC P < 0.001 from 3-month-old male mice. β-TUB, β-tubulin; WT, wild type.
