Abstract
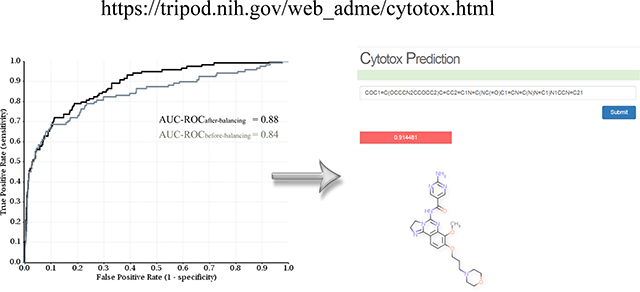
Cytotoxicity is a critical property in determining the fate of a small molecule in the drug discovery pipeline. Cytotoxic compounds are identified and triaged in both target-based and cell-based phenotypic approaches due to their off-target toxicity or on-target and on-mechanism toxicity for oncology and neurodegenerative targets. It is critical that chemical-induced cytotoxicity be reliably predicted before drug candidates advance to the late stage of development, or more ideally, before compounds are synthesized. In this study, we assessed the cell-based cytotoxicity of nearly 10,000 compounds in NCATS annotated libraries against four ‘normal’ cell lines (HEK 293, NIH 3T3, CRL-7250 and HaCat) using CellTiter-Glo (CTG) technology and constructed highly predictive models to estimate cytotoxicity from chemical structures. There are 5,241 non-redundant compounds having unambiguous activities in the four different cell lines, among which 11.8% compounds exhibited cytotoxicity in two or more cell lines and are thus labelled cytotoxic. The support vector classification (SVC) models trained with 80% randomly selected molecules achieved the area under the receiver operating characteristic curve (AUC-ROC) of 0.88 on average for the remaining 20% compounds in the test sets in 10 repeating experiments. Application of under-sampling rebalancing method further improved the averaged AUC-ROC to 0.90. Analysis of structural features shared by cytotoxic compounds may offer medicinal chemists heuristic design ideas to eliminate undesirable cytotoxicity. The profiling of cytotoxicity of drug-like molecules with annotated primary mechanism of action (MOA) will inform on the roles played by different targets or pathways in cellular viability. The predictive models for cytotoxicity (accessible at https://tripod.nih.gov/web_adme/cytotox.html) provide the scientific community a fast yet reliable way to prioritize molecules with little or no cytotoxicity for downstream development.
Keywords: Cytotoxicity, prediction, support vector machine, multiple cell lines, mechanism of action
Graphical Abstract
1. Introduction:
Small molecule drug discovery strives for small molecules that achieve desirable physiological benefits, through modulation of the function of biological targets. In order to identify promising small molecules for pharmaceutical use, both target-based biochemical assays and cell-based phenotypic assays are widely practiced in drug discovery. Target-based drug discovery is hypothesis-driven, stemming from a specific biological hypothesis that modification of activity of a specific target or targets will provide therapeutic control of a disease.1 However, drug molecules and their metabolites that are designed to interact with a particular target or targets tend to interact with other proteins, DNA or RNA molecules and interfere with their functions, which may result in unwanted cell stress or death. Therefore, cytotoxicity is an important endpoint to evaluate undesirable off-target effects of a candidate chemotype in target-based drug discovery.
Due to our limited knowledge of complicated biological systems and diseases, hypothesis-driven target-based approaches often fail to achieve the expected efficacy.2 On the other hand, phenotypic assays are capable of identifying small molecules possessing therapeutically relevant molecular mechanism of action (MMOA),3 and phenotypic-based drug discovery has experienced a resurgence recently.4 In a recent survey on which approach provides better starting point for drug discovery, phenotypic approaches contributed more first-in-class small molecule drugs than target-based screenings.5 Cell viability assays are one of the most frequently used phenotypic assays in drug discovery.6 Dysregulated cell death is associated with many human diseases, including cancer, neurodegeneration, and stroke,7 and so small molecules that can modulate cell viability are promising candidates for the potential therapeutics of cancer (cell killing) and neurodegenerative disorders (cell rescue). Similarly, cell-based viability assays have been used as suitable substitute methods for animal experiments in toxicological testing, in order to reduce the numbers of animal used.8 Therefore, cell viability screening could serve as the primary assay to identify compounds that kill cancer cells or exogenous pathogens including bacteria, fungi and parasites, or serve as counter assay to exclude compounds with undesirable cytotoxicity, helping to determine the fate of the compounds in the pipeline of drug discovery and development.
Cell viability assays broadly fall into two categories: assays that directly detect bona fide cell death with vital dyes and assays that measure surrogate viability biomarkers, including mitochondrial activity, cellular metabolism, or the activity of enzymes associated with viability of cells.7 The major challenges in cell viability assays are two-fold: 1) different cell lines may respond to the same chemicals with different sensitivity, and there is no single cell line that is representative or conclusive in cell viability assays; and 2) cell death is a dynamic process, while the cell viability assay is more or less a static snapshot.9 In chemical-induced cytotoxicity assays, some chemicals elicit rapid cytotoxicity by modulating fast-responding targets, such as ion channels, while some are slow-responding by interfering with cell cycle pathways.10 Currently available prediction models for cytotoxicity are mostly based on small training datasets,11, 12 or public HTS datasets compiled from multiple laboratories under different assay conditions.13, 14 In this study, we analyzed the chemical-induced cytotoxicity of a large collection of pharmaceutical compounds using the same assay conditions, and the availability of this dataset will enrich the community with robust, high-quality data. Additionally, we attempted to alleviate the above-mentioned challenges by incorporating multiple cell lines and extending the incubation time to 48 hours.
Support vector machine (SVM) is a supervised machine learning algorithm capable of deciphering subtle patterns in noisy and complex datasets.15 Being one of the most popular nonlinear modeling methods, SVM has been successfully applied in construction of quantitative structure-activity relationships (QSAR) models to predict physicochemical and ADMET (absorption, distribution, metabolism, excretion, and toxicity) properties in drug discovery research.16–18 In this study, SVM classification models were built on the basis of the customized atom typing descriptors to identify cytotoxic compounds from their chemical structures.
2. Material and Methods:
2.1. Cytotoxicity assays:
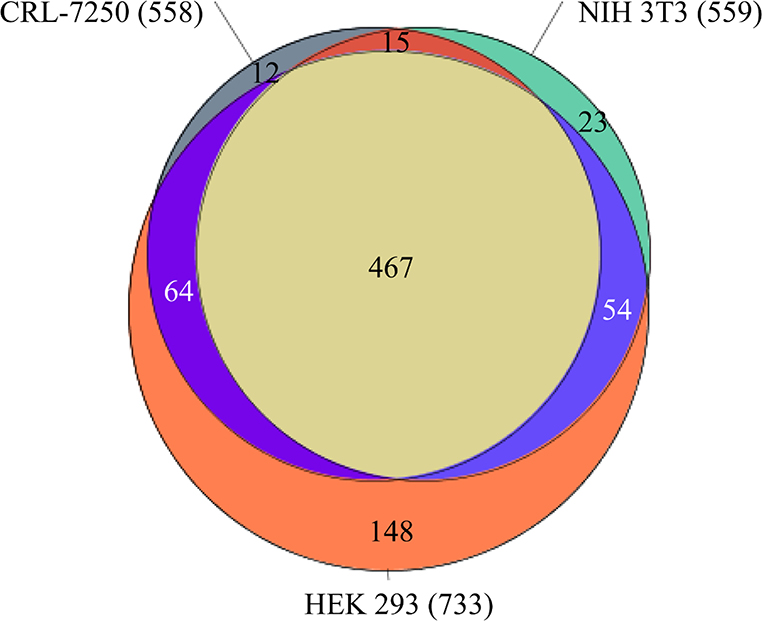
Chemical-induced cytotoxicity was experimentally determined by using the CellTiter-Glo (CTG) technology on four different cell lines HEK 293, NIH 3T3, CRL-7250 and HaCat, among which HEK 293, NIH 3T3, and HaCat cell lines are immortalized, as reported previously.19 Nearly 10,000 compounds in the NCATS annotated libraries were incubated for 48 hours with the cells at 37°, before the CTG was dispensed. Each compound was tested at 7 concentrations, ranging from 0.78 nM to 46 μM, in a quantitative high throughput screening (qHTS) format. High quality active and inactive compounds were identified according to their curve classes and measured AC50 values.19 There are 5,241 non-redundant compounds exhibiting unambiguous activities, either inactive or active with AC50 < 10 μM, in all four assays of different cell lines (Table S1). Three cell lines displayed similar hit rates of around 11%, whereas cell line HEK 298 demonstrated a higher sensitivity, with a hit rate of 14% (Table 1). Figure 1 depicts the overlapping of the cytotoxic compounds among three cell lines, CRL-7250, NIH 3T3, and HEK 298. A large fraction of the tested compounds exhibited cytotoxicity in all three cell lines, representing nearly 84% of toxic compounds in CRL-7250 and NIH 3T3 cell lines, or over 63% of the hits against HEK 298 cell line. There were only 12 compounds showing cytotoxicity on the CRL-7250 cell line alone, and 23 compounds were found to be NIH 3T3 specific. On the contrary, as many as 148 compounds exhibited cytotoxicity on the most sensitive HEK 298 cell line (Figure 1).
Table 1.
Summary of the count of the high quality hits and the hit rates of cell-based viability assays against four normal cell lines.
| Cell line | ||||
|---|---|---|---|---|
| CRL-7250 | NIH 3T3 | HEK 298 | HaCat | |
| Cytotoxic compounds | 558 | 559 | 733 | 570 |
| Hit rate | 10.6 | 10.7 | 14.0 | 10.9 |
Figure 1.
Venn diagram depicting the overlapping of three datasets – Compounds detected cytotoxic on HEK 293 (totaled 733 and colored in orange), CRL-7250 (totaled 558 and colored in gray), and NIH 3T3 (totaled 559 and colored in green) cell lines. There are 467 compounds were detected cytotoxic in all three cell lines.
2.2. Dataset:
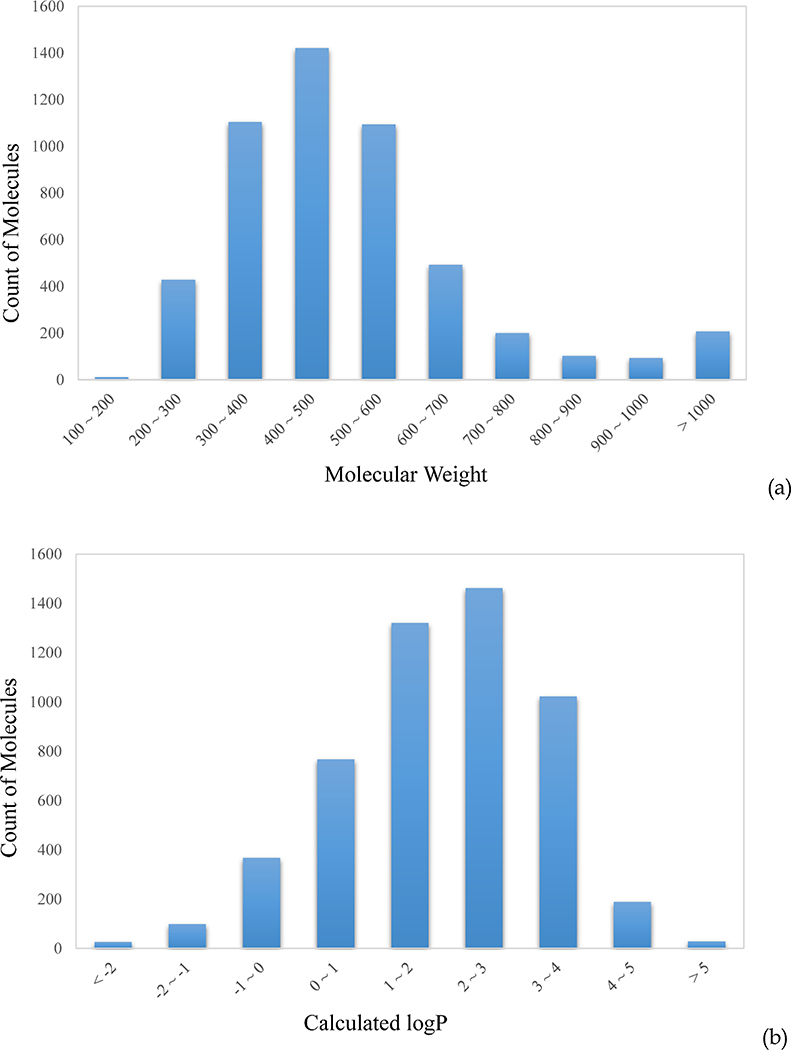
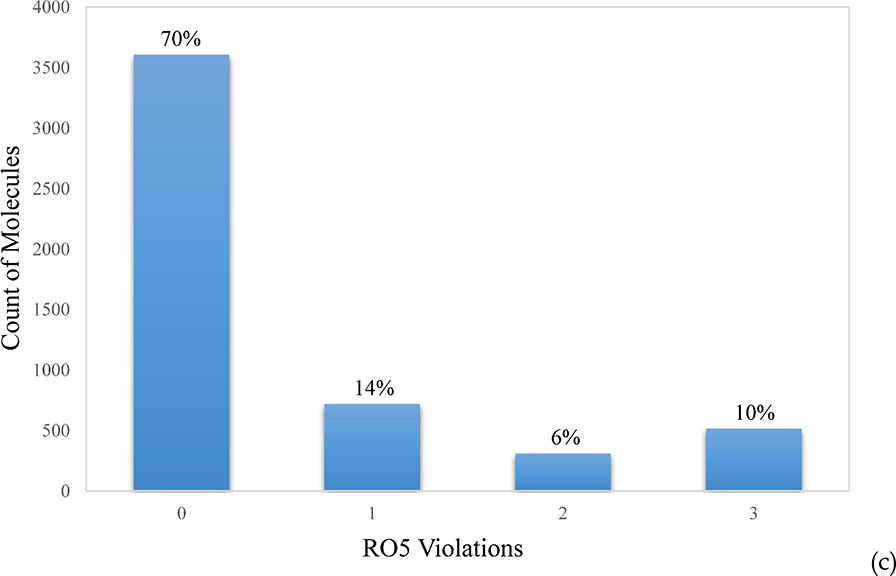
The 5,241 pharmaceutical compounds with annotated MOA are composed of three libraries; NPC (the NCATS Pharmaceutical Collection), NPACT (the NCATS Pharmacologically Active Chemical Toolbox), and MIPE (Mechanism Interrogation Plate), which include a collection of marketed drugs in the US, Europe and Japan, pharmaceutically active agents, and molecular probes.19 The distributions of molecular weight (MW) and calculated logP reflect a typical collection of drug-like molecules, with MW peaking at 400 ~ 500, and logP at 2 ~ 3 (Figure 2a and 2b). The majority (84%) of the dataset violates less than one of Lipinski’s Rule of Five (RO5), thus is considered drug-like (Figure 2c). The high MW compounds are mostly natural products and their derivatives, which compose the bulk of RO5 violators.
Figure 2.
Distributions of (a) molecular weight (MW), (b) calculated logP, and (c) Lipinski’s rule-of-five (RO5) violations for the 5,241 mechanically annotated drug molecules tested.
3. Theory and Calculations:
3.1. Molecular descriptors:
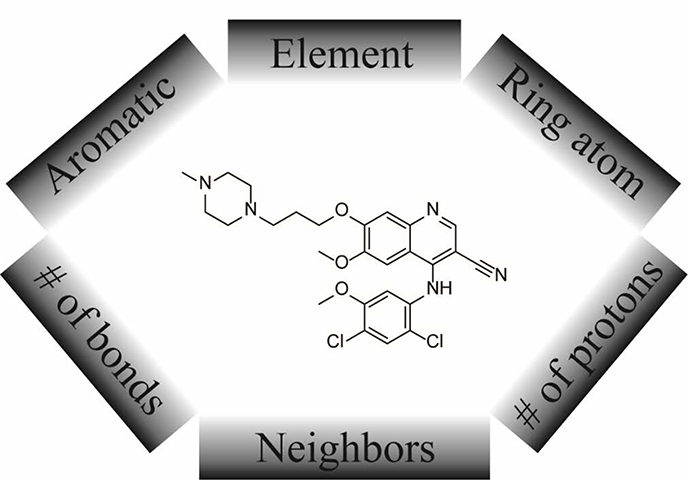
The molecular descriptors employed in this study to construct the QSAR models are customized atom types derived from an atom type casting tree.17 Each atom in a molecule was assigned an atom type according to its individual chemical property and the neighboring chemical environment, such as its aromaticity, the counts of attached protons and chemical bonds, etc. (Figure 3). In the case of conjugated system, the chemical environment is determined by the atoms up to four chemical bonds away. The structure of the tree was optimized recursively, in terms of where to further split a branch and where to merge existing branches, in order to achieve the best predictive performance in log P regression.17 The optimized molecular descriptors consist of 221 atom types and 41 correction factors, introduced to depict the whole-molecule properties, such as flexibility of the molecule, fraction of sp2 hybrid atoms in a molecule, etc.17
Figure 3.
Key factors determine the assignment of an atom type.
3.2. Support vector machine (SVM):
SVM is an elegant supervised machine learning algorithm, which is one of the few algorithms that explicitly address how to minimize the generalization errors.15 The classification application υ-SVC, proposed by Schölkopf et al.20 and implemented by Chang and Lin in LIB-SVM,21 was adopted in this study. The parameterization of υ, and the non-linearity parameter in the kernel function of a Gaussian Radial Basis Function (RBF), γ, was accomplished on a grid-based search to minimize the mean standard error (MSE) of 5-fold cross-validation (CV) on the training data.
4. Results and discussion:
4.1. Performance of the SVC models:
As mentioned above, different cell lines displayed different sensitivities in response to the same compounds in the cytotoxicity assays. In this study, a compound exhibiting cytotoxicity in more than two cell lines was assigned as “positive”, and as a result, 620 of 5,241 compounds were labelled as cytotoxic or positive, representing a hit rate of 11.8%. When the model was trained with 80% randomly selected compounds, the SVC model produced a high area under the ROC curve of 0.88 in predicting the remaining 20% compounds in the test set, under the optimized parameter set of υ = 0.25, and γ = 0.25.
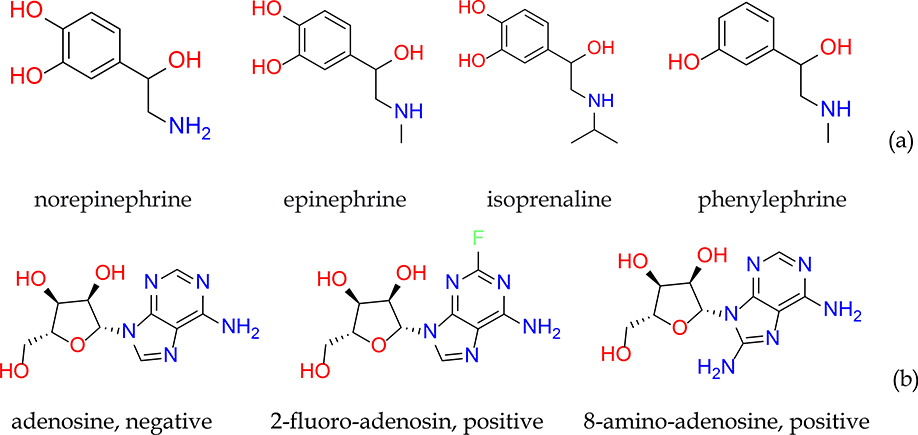
Although the whole dataset contains more than 5,000 unique compounds, the minority class has only 620 molecules in this skewed dataset, which may be inadequate to train a robust model, due to the heavily underrepresented chemical space of minority class compared to that of majority class. In addition, existence of any structurally-similar analogues makes the scenario even worse. For example, there are multiple analogues of epinephrine in the dataset (Figure 4a), which are all reported as non-cytotoxic, while the two close analogues of adenosine are cytotoxic, but adenosine itself is not (Figure 4b). In the case of random splitting of training and test sets, there is a chance that these structurally similar compounds all appear in the training set, or even worse, in the test set. In order to investigate the impact of data splitting on the performance of classifiers, random splitting of training and test sets were repeated ten times, and the models were rebuilt, and predictions made. In comparison, a second data splitting strategy was adopted where the compounds were first clustered according to their structure similarity using a feature-class fingerprints FCFP4, as molecular descriptors, and data splitting were carried out at the cluster level. The singletons were combined into one cluster. Both data splitting methods produced similar AUC-ROC, sensitivity, specificity, and accuracy on average, with splitting on clusters winning marginally (Table 2). However, random splitting generated significantly higher variations among the 10 different experiments, with standard deviation (STD) of AUC-ROC doubled that of cluster splitting. Therefore, extra caution should be taken on reporting predictive performance of a classifier when the dataset is severely imbalanced, since the results might heavily rely on the way of data splitting. It is a good practice to record the averaged performance over multiple experiments or clustering the dataset before splitting.
Figure 4.
Structures of (a) epinephrine drugs (norepinephrine, epinephrine, isoprenaline, phenylephrine) and (b) adenosine derivatives (adenosine, 2-fluoro-adenosin, 8-amino-adenosine).
Table 2.
Comparison of 10 independent experiments between randomly splitting training / test sets and splitting under the guidance of structure similarities on AUC-ROC, sensitivity, specificity, and accuracy, together with the average scores and standard deviation (STD).
| Random Splitting | Splitting On Clusters | |||||||
|---|---|---|---|---|---|---|---|---|
| AUC-ROC | Sensitivity | Specificity | Accuracy | AUC-ROC | Sensitivity | Specificity | Accuracy | |
| 0.907 | 0.847 | 0.831 | 0.833 | 0.895 | 0.755 | 0.879 | 0.867 | |
| 0.888 | 0.765 | 0.889 | 0.875 | 0.909 | 0.832 | 0.868 | 0.863 | |
| 0.873 | 0.831 | 0.813 | 0.815 | 0.877 | 0.743 | 0.917 | 0.894 | |
| 0.836 | 0.686 | 0.900 | 0.875 | 0.885 | 0.759 | 0.872 | 0.860 | |
| 0.916 | 0.821 | 0.890 | 0.882 | 0.881 | 0.775 | 0.879 | 0.868 | |
| 0.853 | 0.764 | 0.864 | 0.852 | 0.873 | 0.742 | 0.896 | 0.877 | |
| 0.884 | 0.790 | 0.857 | 0.849 | 0.890 | 0.813 | 0.825 | 0.823 | |
| 0.875 | 0.745 | 0.890 | 0.871 | 0.891 | 0.795 | 0.851 | 0.845 | |
| 0.899 | 0.800 | 0.874 | 0.865 | 0.881 | 0.771 | 0.883 | 0.870 | |
| 0.878 | 0.804 | 0.843 | 0.839 | 0.897 | 0.823 | 0.856 | 0.852 | |
| Average | 0.881 | 0.785 | 0.865 | 0.856 | 0.888 | 0.781 | 0.872 | 0.862 |
| STD | 0.024 | 0.047 | 0.029 | 0.022 | 0.010 | 0.031 | 0.024 | 0.018 |
4.2. Rebalancing the skewed datasets:
An imbalanced dataset, which is common for biological experiments, is a long-existing challenge in machine learning. A minority class might be overwhelmed by noise from the large quantity of majority class samples. To mitigate imbalanced training sets, a one-sided selection algorithm was proposed to remove less reliable samples from the majority class.22 In this study, the dataset was heavily skewed toward negative samples, yet these negative samples are as informative as those positives; therefore, an under-sampling rebalancing method, instead of one-sided selection, was utilized in order to enhance the predictive performance. The majority class (non-cytotoxic or negative samples) in the training set was randomly split to 7 subsets, and each subset was combined with the whole minority class to compose 7 nearly balanced training sets. The 7 SVC models were built based on the six training sets with the optimized parameters, and the consensus of the 7 predictions was reported as the probabilities of being positive for the compounds in the test set.
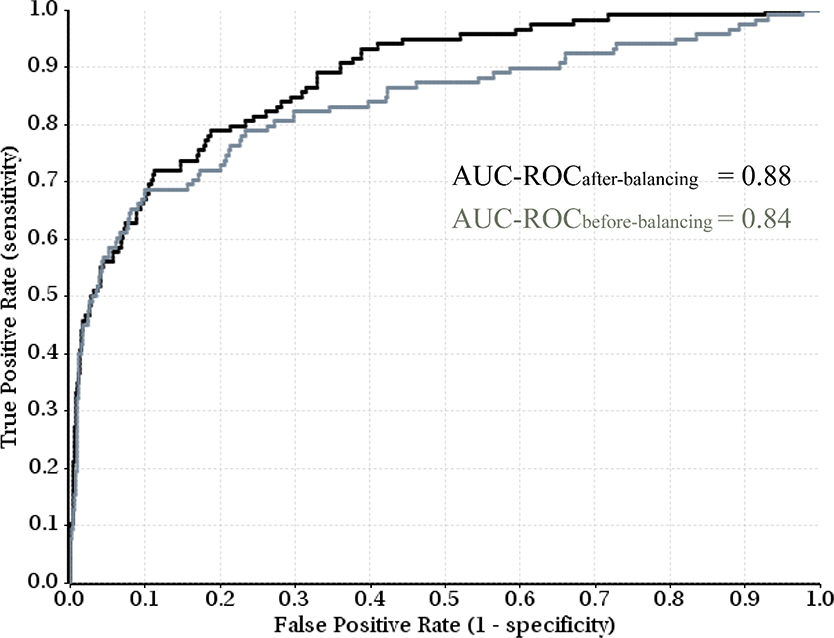
As seen in Table 3, rebalancing using under-sampling consensus method improved the predictive performance in each of the 10 experiments when the training and test sets were randomly split, and the averaged AUC-ROC increased from 0.88 to 0.90, while the standard deviation decreased from 0.024 to 0.018. The largest improvement was observed in the two worst cases without rebalancing, experiment 4 and 6. For the experiments split on clusters, the results were mixed; 7 of 10 experiments achieved different extent of improvement on the AUC-ROC values, while 3 experiments were marginally deteriorated. The averaged AUC-ROC was slightly better, but the variation increased significantly. The results suggest that random splitting of an imbalanced dataset into training and test sets benefits more from under-sampling consensus rebalancing technology than splitting on clusters, and poorly performed models benefit more from rebalancing (Figure 5).
Table 3.
Comparison of the predictive performance of the models before and after rebalancing using under-sampling consensus method, as measured by AUC-ROC values, for the 10 random splitting experiments and splitting on clusters.
| Random Splitting | Splitting On Clusters | |||||
|---|---|---|---|---|---|---|
| Original | Rebalanced | Improved | Original | Rebalanced | Improved | |
| 0.907 | 0.916 | Y | 0.895 | 0.906 | Y | |
| 0.888 | 0.909 | Y | 0.909 | 0.922 | Y | |
| 0.873 | 0.912 | Y | 0.877 | 0.891 | Y | |
| 0.836 | 0.882 | Y | 0.885 | 0.894 | Y | |
| 0.916 | 0.937 | Y | 0.881 | 0.894 | Y | |
| 0.853 | 0.892 | Y | 0.873 | 0.871 | N | |
| 0.884 | 0.893 | Y | 0.890 | 0.884 | N | |
| 0.875 | 0.884 | Y | 0.891 | 0.902 | Y | |
| 0.899 | 0.910 | Y | 0.881 | 0.885 | Y | |
| 0.878 | 0.886 | Y | 0.897 | 0.892 | N | |
| Average | 0.881 | 0.902 | Y | 0.888 | 0.894 | Y |
| STD | 0.024 | 0.018 | Y | 0.010 | 0.014 | N |
Figure 5.
The receiver operating characteristic (ROC) curves of random splitting Experiment 4 in Table 3, showing the improved predictive performance, as measured by the area under the curve (AUC), through rebalancing technology.
4.3. Interpretation of the models:
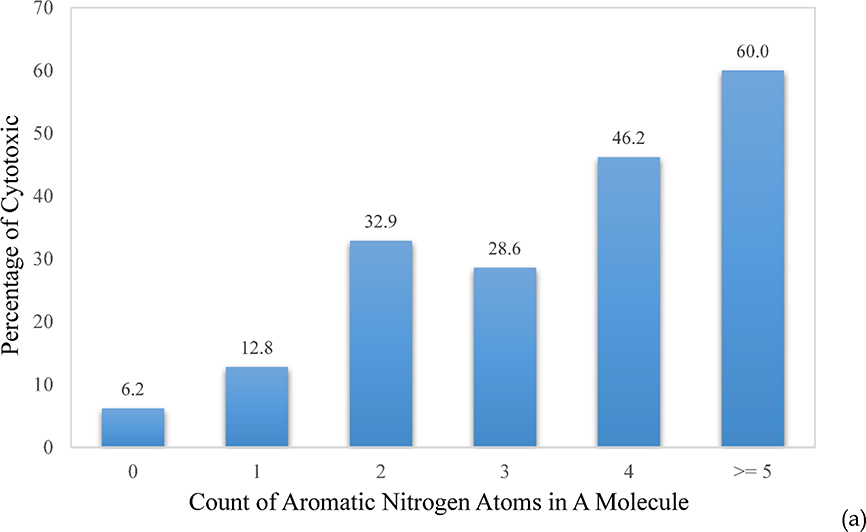
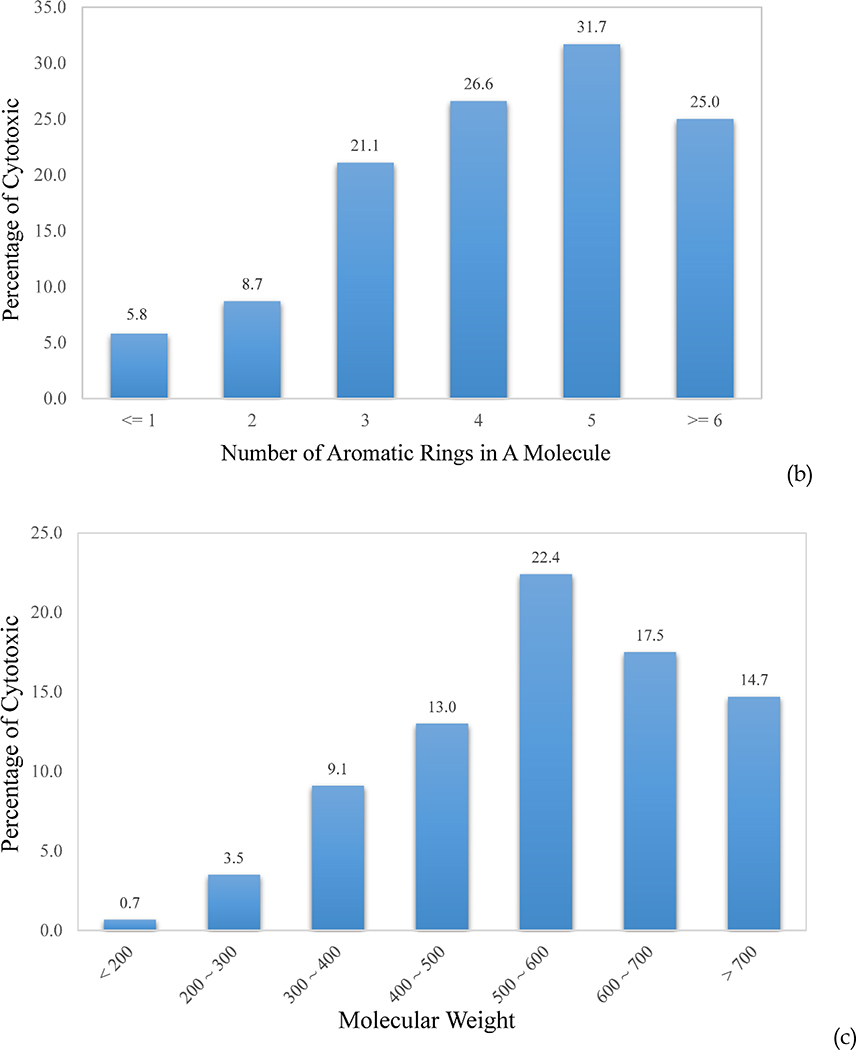
One of the advantages of using atom types as molecular descriptors is that the models are not only predictive, but also make chemical sense. Feature analysis of SVC models could then decipher which atom types contribute the most toward discrimination between cytotoxic and non-toxic compounds. The atom types and correction factors of top discriminating power are the count of aromatic nitrogen (N) atoms, the count of aromatic rings, and ln(MW). A molecule without any aromatic N atom has only a 6.2% probability of being cytotoxic, while the possibility increases dramatically to 60%, which is more than 5-fold higher than the hit rate of 11.8%, when a molecule contains more than 5 aromatic N atoms (Figure 6a). Aromatic N is the major component in hetero-aromatic rings, such as adenine, which carries four aromatic N atoms (Figure 4b), pyridine, pyrimidine, and quinoline. Introduction of these N-containing hetero-aromatic rings might bring about beneficial effects on molecular and physicochemical properties,23 yet it might also accompany with an increased risk of cytotoxicity, according to the dataset in this study. Another clear trend observed in the dataset was that the more aromatic rings a molecule had, the more likely the molecule became cytotoxic (Figure 6b). At >6 aromatic rings, the decreased cytotoxicity is probably due to the poor cellular permeability of those molecules. The same trend can be seen in molecular weight, which showed increased cytotoxicity with increased molecular weight, followed by a sharp decrease above 600 Dalton, most likely due to the similar reasons (Figure 6c). It is worth emphasizing that machine learning is data driven. The observed trends and correlations are limited to the datasets on which the models are based, and should not be extrapolated to causality, since all data are biased to certain extent. This is especially true for imbalanced data.
Figure 6.
The upward trend of the cytotoxic probability with the increment of (a) the count of aromatic N, (b) the count of aromatic rings in a molecule, and (c) the molecular weight (MW).
4.4. Primary MOA of cytotoxic drugs:
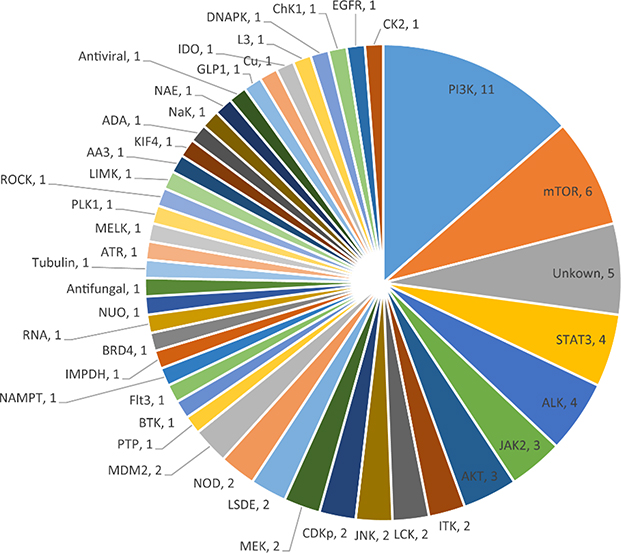
In order to take advantage of mechanism annotation of the libraries, we analyzed the distribution of primary targets associated with the cytotoxic compounds. Oncology is one of the largest therapeutic areas in pharmaceutical industry, in terms of research and development (R&D) investments as well as new chemical entity (NCE) output,24 with kinases as the primary anti-tumor target. The dataset in this study well reflects this trend. Initial anticancer approaches aim to modulate essential functions to kill cancer cells, resulting in on-target or on-mechanism toxicity in normal cells.25 Many protein kinases bear essential functions, including PI3K and AKT involved in AKT-PI3K signal transduction pathway, mammalian target of rapamycin (mTOR), and Janus kinase (JAS) which phosphorylates the key transcription factor STAT3. These essential proteins, which are most frequently targeted (Figure 7), play a critical role in cellular processes such as cell growth and apoptosis,25 and could be considered anti-targets in drug discovery, especially for the projects targeting protein kinases.
Figure 7.
The pie chart displaying the frequencies of protein targets which were associated with the cytotoxic compounds in the test set and annotated as primary mechanism of action (MOA), where the frequencies are labeled with the corresponding primary MOAs.
5. Conclusion.
Early awareness of cytotoxic compounds in the drug discovery pipeline will potentially improve the efficiency and productivity of drug discovery process. We have profiled cell viability of a large collection of mechanistically annotated pharmaceutical compounds against four normal cell lines (HEK 293, NIH 3T3, CRL-7250 and HaCat). Highly predictive models have been constructed in 10 repeating experiments, with the averaged AUC-ROC reaching 0.88 for compounds in the test set. The enhancement of model performance was observed consistently in every experiment when under-sampling consensus technology was applied to rebalance the heavily skewed training sets, and the averaged AUC was improved to 0.90. The results generated in this study constitute a valuable easy-to-use resource for the scientific community to estimate cytotoxicity of drug candidates at different stages of drug discovery and development, and resources can then be reallocated to more promising candidates with no or little cytotoxicity. The predictive models may be used as suitable alternative for animal toxicological tests in pre-clinical research and development.
Supplementary Material
Acknowledgement:
This research was supported in part by the Intramural/Extramural research program of the NCATS, NIH.
Footnotes
Conflicts of Interest: The authors declare no conflicts of interest.
References:
- 1.Swinney DC Phenotypic vs. target-based drug discovery for first-in-class medicines. Clin Pharmacol Ther 2013, 93, 299–301. [DOI] [PubMed] [Google Scholar]
- 2.Sams-Dodd F Target-based drug discovery: is something wrong? Drug Discov Today 2005, 10, 139–47. [DOI] [PubMed] [Google Scholar]
- 3.Moffat JG; Rudolph J; Bailey D Phenotypic screening in cancer drug discovery - past, present and future. Nat Rev Drug Discov 2014, 13, 588–602. [DOI] [PubMed] [Google Scholar]
- 4.Coussens NP; Braisted JC; Peryea T; Sittampalam GS; Simeonov A; Hall MD Small-Molecule Screens: A Gateway to Cancer Therapeutic Agents with Case Studies of Food and Drug Administration-Approved Drugs. Pharmacol Rev 2017, 69, 479–496. [DOI] [PMC free article] [PubMed] [Google Scholar]
- 5.Swinney DC; Anthony J How were new medicines discovered? Nat Rev Drug Discov 2011, 10, 507–19. [DOI] [PubMed] [Google Scholar]
- 6.Zheng W; Thorne N; McKew JC Phenotypic screens as a renewed approach for drug discovery. Drug Discov Today 2013, 18, 1067–73. [DOI] [PMC free article] [PubMed] [Google Scholar]
- 7.Kepp O; Galluzzi L; Lipinski M; Yuan J; Kroemer G Cell death assays for drug discovery. Nat Rev Drug Discov 2011, 10, 221–37. [DOI] [PubMed] [Google Scholar]
- 8.Botham PA Acute systemic toxicity--prospects for tiered testing strategies. Toxicol In Vitro 2004, 18, 227–30. [DOI] [PubMed] [Google Scholar]
- 9.Mizushima N; Yoshimori T; Levine B Methods in mammalian autophagy research. Cell 2010, 140, 313–26. [DOI] [PMC free article] [PubMed] [Google Scholar]
- 10.Hsieh JH; Huang R; Lin JA; Sedykh A; Zhao J; Tice RR; Paules RS; Xia M; Auerbach SS Real-time cell toxicity profiling of Tox21 10K compounds reveals cytotoxicity dependent toxicity pathway linkage. PLoS One 2017, 12, e0177902. [DOI] [PMC free article] [PubMed] [Google Scholar]
- 11.Kahraman EN; Sacan MT Predicting Cytotoxicity and Enzymatic Activity of Diverse Chemicals Using Goldfish Scale Tissue and Topminnow Hepatoma Cell Line-based Data. Mol Inform 2019. [DOI] [PubMed] [Google Scholar]
- 12.Moon H; Cong M Predictive models of cytotoxicity as mediated by exposure to chemicals or drugs. SAR QSAR Environ Res 2016, 27, 455–68. [DOI] [PubMed] [Google Scholar]
- 13.Molnar L; Keseru GM; Papp A; Lorincz Z; Ambrus G; Darvas F A neural network based classification scheme for cytotoxicity predictions:Validation on 30,000 compounds. Bioorg Med Chem Lett 2006, 16, 1037–9. [DOI] [PubMed] [Google Scholar]
- 14.Svensson F; Norinder U; Bender A Modelling compound cytotoxicity using conformal prediction and PubChem HTS data. Toxicol Res (Camb) 2017, 6, 73–80. [DOI] [PMC free article] [PubMed] [Google Scholar]
- 15.Noble WS What is a support vector machine? Nat Biotechnol 2006, 24, 1565–7. [DOI] [PubMed] [Google Scholar]
- 16.Sun H; Huang R; Xia M; Shahane S; Southall N; Wang Y Prediction of hERG Liability - Using SVM Classification, Bootstrapping and Jackknifing. Mol Inform 2017, 36. [DOI] [PMC free article] [PubMed] [Google Scholar]
- 17.Sun H A Practical Guide to Rational Drug Design. Elsevier: Cambridge, 2016. [Google Scholar]
- 18.Ferreira LLG; Andricopulo AD ADMET modeling approaches in drug discovery. Drug Discov Today 2019, 24, 1157–1165. [DOI] [PubMed] [Google Scholar]
- 19.Lee OW; Austin SM; Gamma MR; Cheff DM; Lee TD; Wilson KM; Johnson JM; Travers JC; Braisted JC; Guha R; Klumpp-Thomas C; Shen M; Hall MD Cytotoxic Profiling of Annotated and Diverse Chemical Libraries Using Quantitative High-Throughput Screening. bioRxiv 2019. [DOI] [PMC free article] [PubMed] [Google Scholar]
- 20.Scholkopf B; Smola AJ; Williams R Shrinking the tube: A new support vector regression algorithm. MIT Press: Cambridge, MA, 1999; Vol. 11. [Google Scholar]
- 21.Chang C-C; Lin C-J LIBSVM : a library for support vector machines, 2001. [Google Scholar]
- 22.Kubat M; Matwin S In Addressing the Curse of Imbalanced Training Sets: One-Sided Selection, Proc. Int’l Conf. Machine Learning, 1997; 1997; pp 179–186. [Google Scholar]
- 23.Pennington LD; Moustakas DT The Necessary Nitrogen Atom: A Versatile High-Impact Design Element for Multiparameter Optimization. J Med Chem 2017, 60, 3552–3579. [DOI] [PubMed] [Google Scholar]
- 24.Kinch MS An analysis of FDA-approved drugs for oncology. Drug Discov Today 2014, 19, 1831–5. [DOI] [PubMed] [Google Scholar]
- 25.Kamb A; Wee S; Lengauer C Why is cancer drug discovery so difficult? Nat Rev Drug Discov 2007, 6, 115–20. [DOI] [PubMed] [Google Scholar]
Associated Data
This section collects any data citations, data availability statements, or supplementary materials included in this article.


