

Abstract
Background:
More rapid fluid removal during hemodialysis is associated with adverse cardiovascular outcomes and longer dialysis recovery times. The effect of ultrafiltration (UF) profiling, independent of concomitant sodium profiling, on markers of intradialytic hemodynamics and other outcomes has been inadequately studied.
Methods:
Four-phase, blinded crossover trial. Participants (UF rates >10 mL/h/kg) were assigned in random order to receive hemodialysis with UF profiling (constantly declining UF rate, intervention) vs. hemodialysis with conventional UF (control). Each 3-week 9-treatment period was followed by a 1-week 3-treatment washout period. Participants crossed into each study arm twice (2 phases/arm); 18 treatments per treatment type. The primary outcomes were intradialytic hypotension, pre- to post-dialysis troponin T change, and change from baseline in left ventricular global longitudinal strain. Other outcomes included intradialytic symptoms and blood volume measured-plasma refill (post-dialysis volume status measure), among others. Each participant served as their own control.
Results:
On average, the 34 randomized patients (mean age 56 years, 24% female, mean dialysis vintage 6.3 years) had UF rates >10 mL/h/kg in 56% of treatments during the screening period. All but 2 patients completed the 15-week study (prolonged hospitalization, kidney transplant). There was no significant difference in intradialytic hypotension, troponin T change, or left ventricular strain between hemodialysis with UF profiling and conventional UF. With UF profiling, participants had significantly lower odds of light-headedness and plasma refill compared to hemodialysis with conventional UF.
Conclusions:
UF profiling did not reduce the odds of treatment-related cardiac stress but did reduce the odds of light-headedness and post-dialysis hypervolemia.
Trial Registration:
Clinicaltrials.gov identifier: NCT03301740 (registered October 4, 2017)
Keywords: hemodialysis, cardiovascular, ultrafiltration, hypotension, clinical trial, echocardiogram, blood pressure, symptoms
INTRODUCTION
Individuals receiving maintenance hemodialysis have exceedingly high rates of cardiovascular complications with such events accounting for nearly 50% of all deaths.[1] Prior observational research has demonstrated associations between aspects of the hemodialysis treatment and cardiovascular morbidity and mortality. Higher rates of fluid removal (ultrafiltration, UF), driven by larger interdialytic weight gains and/or shorter treatment times, are associated with higher rates of hospitalizations, mortality, and intermediate outcomes such as intradialytic hypotension and longer post-dialysis recovery times.[2–6] Intradialytic functional imaging studies of the heart, liver, brain, and kidneys have shown hemodialysis-induced end-organ ischemia with more aggressive UF,[7–12] providing a potential mechanistic explanation for the observed UF rate and outcome associations.
Reducing UF rate-related intradialytic complications has the potential to improve both cardiovascular and patient-reported outcomes, but, to date, safe and effective strategies that do not require lengthening the dialysis treatment have not been identified. Clinical trials of blood volume monitor-guided UF, controlled manually and by biofeedback, (vs. constant UF rates) have yielded mixed results regarding prevention of hypotension.[13–19] Sodium profiling, the practice of varying intradialytic dialysate sodium concentration to maximize oncotic pressure, has been shown to promote hemodynamic stability.[20] However, such benefit often comes at the expense of sodium loading and its untoward consequences of enhanced thirst, extracellular volume expansion, and hypertension.[20–22] As such, sodium profiling is typically avoided unless sodium balance can be achieved and post-dialysis hypernatremia avoided. Alternatively, UF profiling, the practice of varying UF rates to maximize fluid removal during periods of greatest intravascular fullness and oncotic pressure, does not alter sodium balance. Existing data suggest that UF profiling may improve hemodynamics and reduce symptoms,[23] but data are sparse, and no prior studies have investigated the impact of UF profiling on markers of cardiac ischemia such as troponin and intradialytic myocardial stunning.[23–25]
To begin addressing this evidence gap, we conducted a randomized crossover trial investigating whether hemodialysis with UF profiling (constantly declining UF rate) reduces markers of hemodialysis-related cardiovascular stress and patient-reported symptoms compared to hemodialysis with a constant UF rate.
METHODS
Overview
We performed a randomized, single blind, crossover trial of hemodialysis with UF profiling (constantly declining UF rate, intervention) vs. hemodialysis with a constant UF rate (control) among individuals receiving outpatient maintenance hemodialysis. We recruited participants from two dialysis clinics affiliated with the University of North Carolina at Chapel Hill. Recruitment occurred in March and July 2018, and the study was completed in December 2018. The study protocol was approved by the University of North Carolina at Chapel Hill Institutional Review Board (#17–1057), and all study procedures were conducted in accordance with the Helsinki Declaration (registered on clinicaltrials.gov: NCT03301740). We reported our findings consistent with the Consolidated Standards of Reporting Trials 2010 statement: extension to randomized crossover trials.[26]
Study population
All adults receiving maintenance hemodialysis at the participating clinics were screened for eligibility. Individuals aged 18 to 85 years-old with UF rates >10 mL/h/kg in >30% of treatments during the 4-week screening period who had received in-center hemodialysis for at least 90 days were eligible to participate. Exclusion criteria included unstable angina; New York Heart Association class IV heart failure; >1 hospitalization, bloodstream infection, or non-adherence to hemodialysis (>2 unexplained absences) during the screening period; and anticipated kidney transplant or modality change within 6 months (Supplemental Table S1).
Study design
The detailed study design has been previously reported.[27] In brief, we performed a 4-phase crossover trial in which participants were successively alternated between fluid removal strategies with intervening washout periods (Figure 1). Treatment order (i.e. starting with UF profiling vs. conventional UF) was randomized. Patient eligibility was assessed in a 4-week screening period, followed by a 6-week baseline period (laboratory testing, medication review, history and physical). Then, participants were randomized to hemodialysis with UF profiling vs. hemodialysis with a constant UF rate for a 9-treatment phase, followed by a 3-treatment washout period. Participants then crossed over to the other study arm for a 9-treatment phase and 3-treatment washout period. The same sequence was then repeated such that each patient underwent 2 phases of UF-profiled hemodialysis (18 treatments total), 2 phases of hemodialysis with conventional UF (18 treatments total), and 3 washout periods (9 treatments total). Randomization of the treatment sequence (i.e. beginning study treatments with UF profiling vs. conventional UF) was performed by computer-generated random numbers. Study participants, investigators, cardiac sonographers, and analysts were blind to study treatment type. Dialysis clinic personnel and treating nephrologists were not blinded.
Figure 1.
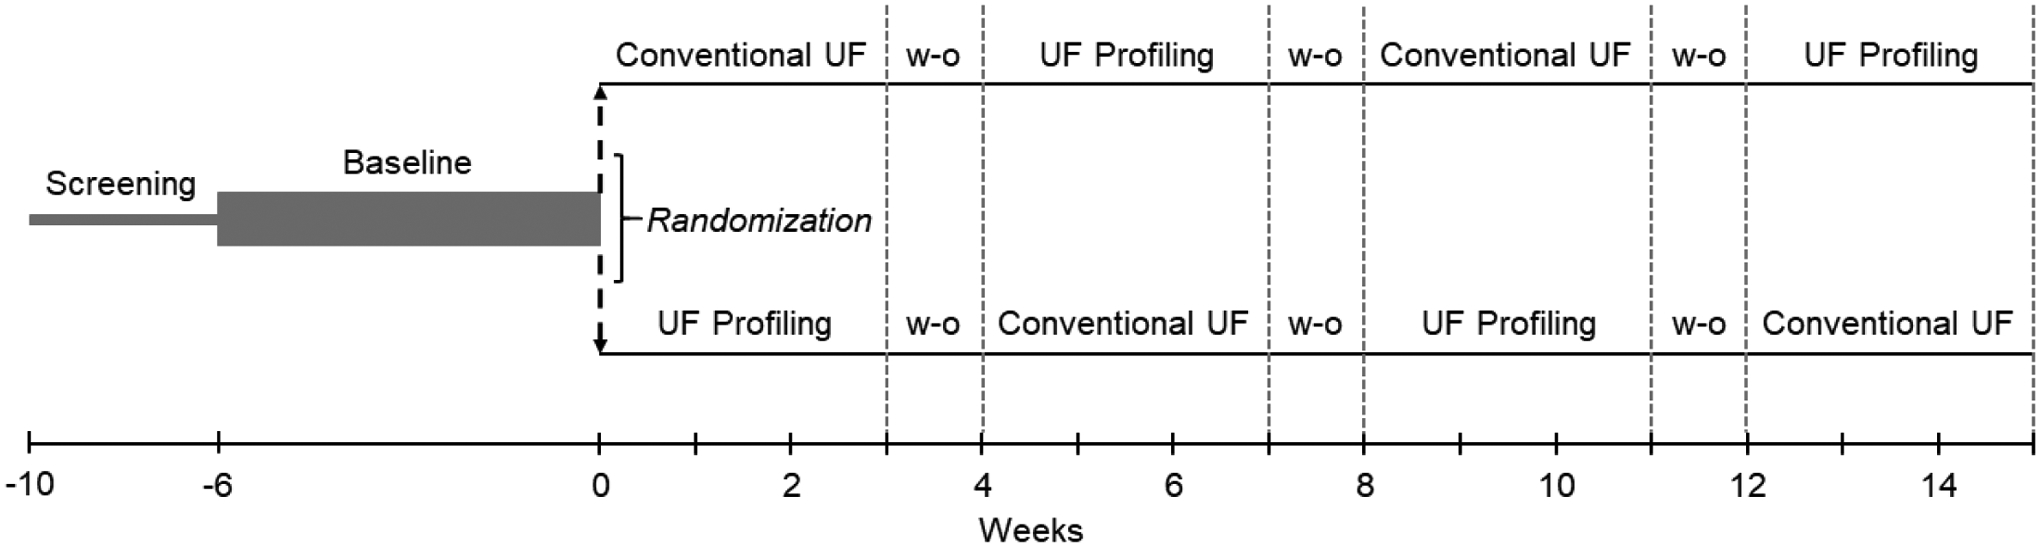
Study design.
Study eligibility was determined in a 4-week screening period which was followed by a 6-week baseline data collection period. Participants were then randomized to either hemodialysis with profiled UF or hemodialysis with conventional UF for their first 9-treatment study period, followed by a 3-treatment washout period. Participants then crossed over to the other study arm for a 9-treatment phase and 3-treatment washout period. The same sequence was then repeated such that each patient underwent 2 phases of hemodialysis with UF profiling (18 treatments total), 2 phases of hemodialysis with conventional UF (18 treatments total), and 3 washout periods (9 treatments total).
Abbreviations: UF, ultrafiltration; w-o, washout.
Ultrafiltration interventions and washout treatments
The study intervention was hemodialysis with UF profiling (profile 2 on the Fresenius 2008T machine), fluid removal with a constantly down-sloping pattern in which UF begins at a rate 40% higher than the baseline rate and ends at 60% of the baseline rate. The control was hemodialysis with conventional UF, fluid removal with a constant rate. Study washout treatments were the same as control (standard hemodialysis prescription with a constant UF rate).
Hemodialysis prescription
All participants were dialyzed on Fresenius 2008T machines with high-flux dialyzers, a dialysate temperature of 37°C, and a dialysate sodium concentration of 137 mmol/L (the clinic-standardized dialysate sodium concentration in both participating clinics). Hemodialysis treatment parameters such as dialysate composition (except for sodium concentration, which was fixed), estimated dry weight, and treatment time were those prescribed by the treating nephrologist. Intradialytic hemodynamic instability was managed per routine clinical protocols with UF rate reduction, UF termination, saline administration, etc. In cases of UF termination, upon return of hemodynamic stability, UF profile 2 was resumed for participants in the UF-profiled arm, and UF at a constant rate was resumed for participants in the conventional UF arm.
Study outcomes
The primary study outcomes were intradialytic hypotension (nadir systolic blood pressure (BP) <90 mmHg), two related troponin T metrics (pre- to post-dialysis troponin T change (ng/mL) and pre- to post-dialysis troponin T rise ≥10%), and change from baseline in left ventricular global longitudinal strain (GLS, %). We selected these outcomes because they are surrogates for hemodialysis treatment-related cardiac stress. Left ventricular GLS is a transthoracic echocardiography (TTE) parameter that expresses myocardial deformation as a percentage and is a measure of systolic function (normal range: −16 to −22% with less negative numbers reflecting greater systolic function impairment) (Supplemental Figure S1).[28] GLS is less load-dependent than other measures of left ventricular systolic function and is sensitive to small changes in contractility. Secondary outcomes included nadir intradialytic systolic BP (mmHg), systolic BP change (mmHg), failed target weight achievement (post-dialysis weight >1 kg above or below estimated dry weight), change from baseline in left ventricular GLS ≥2.5%, change from baseline in early mitral inflow velocity/mitral annular early diastolic velocity (E/e’, a Doppler echocardiography index of left ventricular diastolic function and filling pressure), patient acceptance (willingness to adopt UF type), patient-reported intradialytic symptoms (cramping, nausea, vomiting, light-headedness, palpitations, chest pain, shortness of breath, thirst, headache, itching, restless legs, and tingling measured with 5-point severity Likert scales), and patient-reported time to recovery (hours), among others. The exploratory outcome was blood volume monitor-measured plasma refill (hematocrit fall by ≥0.5% from the termination of UF to the end of treatment),[29] a post-dialysis volume status measure.
Data collection
Baseline data, including medical history and laboratory values, were obtained from the electronic health record. Hemodialysis treatment data, including intradialytic BPs, pre- and post-dialysis weights, UF volume, and intradialytic interventions were abstracted from the electronic health record. Blood pressure was machine-measured pre- and post-dialysis and every 15 minutes during all treatments. Troponin T was measured before and after hemodialysis during 4 end-of-phase study treatments (2 per study arm) and analyzed using a fifth-generation assay (Mayo Medical Laboratories, Rochester, MN). Echocardiography was performed by two experienced sonographers on a Samsung HM70A cardiac ultrasound machine (Seoul, South Korea) during the baseline period on a non-dialysis day and 30 minutes before the end of 2 study treatments (1 per study arm). The latter timing was selected to capture “peak intradialytic stress.”[7, 8] Baseline left ventricular ejection fraction was determined using the biplane Simpson’s rule from apical 4-chamber and 2-chamber images of the heart. Two-dimensional speckle-tracking echocardiography-derived GLS was used to quantify left ventricular systolic function, and left ventricular diastolic function was characterized as E/e’, measured by pulsed wave and tissue Doppler. Images were analyzed offline by an experienced, blinded cardiologist using TomTec software (TomTec Corporation, Chicago, IL). Plasma refill was measured with a Crit-Line Monitor (Fresenius Medical Care North America, Waltham, MA).
Sample size
We based the sample size on power calculations for the primary study outcomes. We estimated a sample size of 30 participants would provide power of 80% to show a 31% absolute difference in the binary endpoint of intradialytic hypotension occurrence, assuming an event rate of 20%, a ≥0.07 ng/mL pre- to post-dialysis troponin T change difference (S.D. 0.1)[30], and a 2.2% difference from baseline in GLS (S.D. 3)[31].
Statistical analyses
All statistical analyses were performed using SAS version 9.4 (SAS Institute Inc., Cary, NC). Baseline characteristics are presented as count (%) for categorical variables and mean ± standard deviation or median [quartile 1, quartile 3] for continuous variables. Each study participant served as their own control. We estimated odds ratios (OR) and 95% confidence intervals (CI) for binary outcomes (e.g. intradialytic hypotension (present vs. absent) and symptoms (none or mild vs. moderate, severe, or very severe)) using repeated measures logistic regression models. We estimated β-coefficients and 95% CIs for non-TTE continuous outcomes (e.g. pre- to post-dialysis troponin T change and nadir systolic BP) using repeated measures linear regression models. For all models, the binary treatment indicator (UF profiling vs. conventional UF) was treated as a fixed effect predictor, and each participant was assigned a random intercept term. We used Wilcoxon signed rank tests to compare the median differences of continuous TTE endpoints (e.g. GLS change) between UF profiling and conventional UF. All analyses were based on the intention-to-treat principle. Results were considered statistically significant if the 95% CI of the OR did not span the value of 1.0, or the 95% CI of the β-coefficient or estimated median difference did not span the value of 0.0.
RESULTS
Cohort formation
A total of 186 individuals were screened, and 139 were excluded (Figure 2). Of the 47 individuals meeting selection criteria, 34 (72%) agreed to participate. During baseline, the mean delivered UF rate was 10.3 ± 3.7 mL/h/kg and, on average, 55 ± 21% of participant baseline treatments had delivered UF rates >10 mL/h/kg. All 34 individuals who entered the baseline period were randomized, 18 to the arm that received UF profiling first and 16 to the arm that received conventional UF first. In the first treatment sequence (UF profiling, conventional UF, UF profiling, conventional UF), 1 participant dropped out in phase 2 (conventional UF) due to kidney transplant, and 1 participant dropped out in phase 4 (conventional UF) due to a prolonged hospitalization. As the phase 2 dropout did not complete a full phase of each treatment type, this individual was excluded from analyses. For the phase 4 dropout, data from this individual’s phases 1 (UF profiling) and 2 (conventional UF) were included. There were no dropouts in the second randomization order (conventional UF, UF profiling, conventional UF, UF profiling). A total of 33 individuals and 1,149 hemodialysis treatments were included in the analyses.
Figure 2.
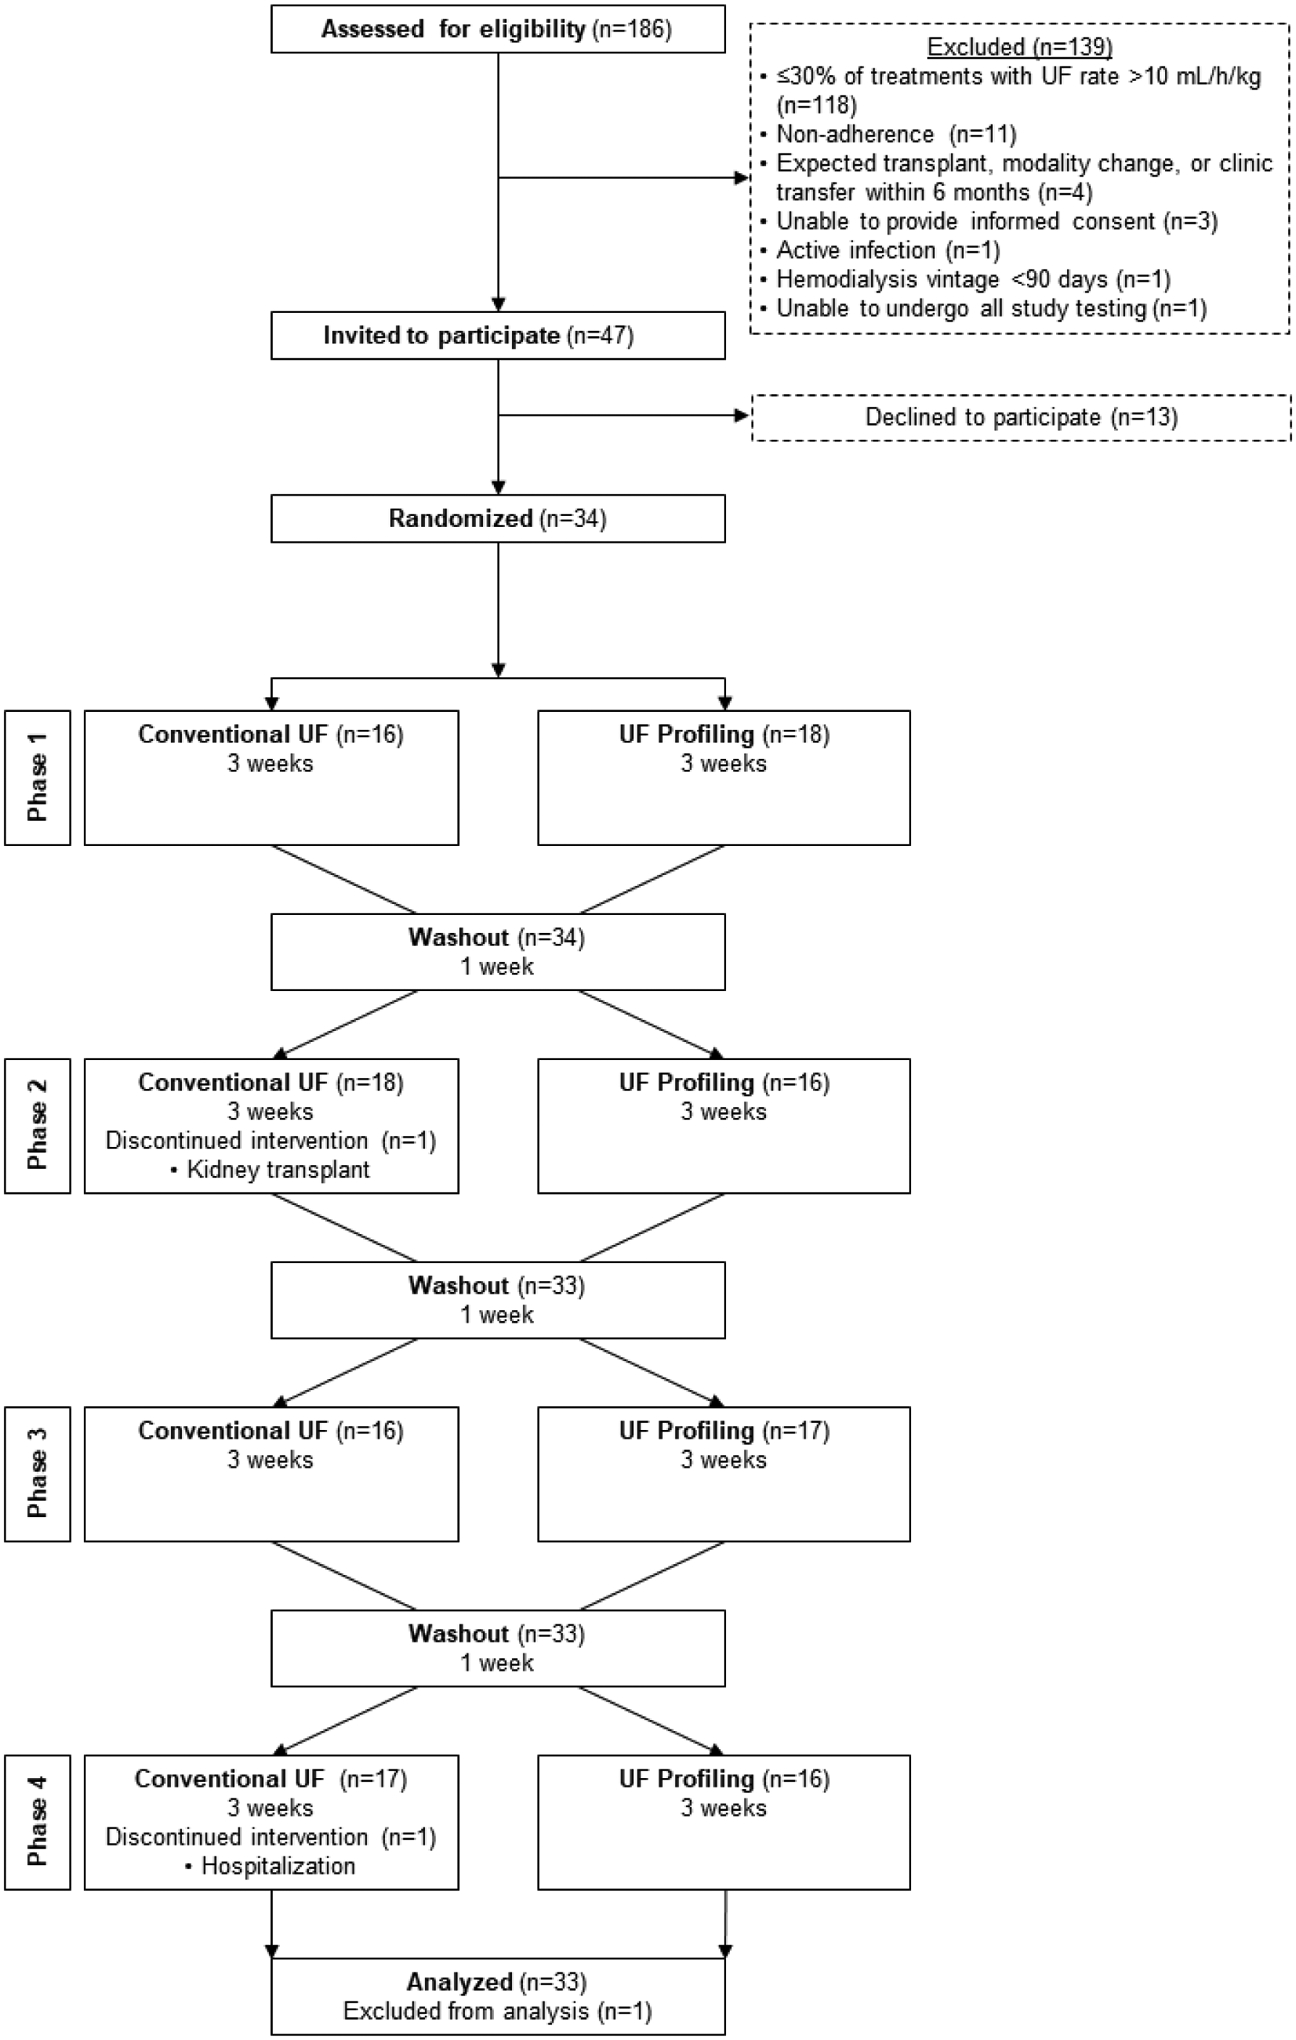
Participant flow diagram.
Abbreviations: UF, ultrafiltration.
Participant characteristics
Table 1 displays participant baseline characteristics. Participants had an average age of 56 ± 15 years, 8 (24%) were women, 22 (65%) were Black, 11 (32%) were Hispanic, and the most common cause of dialysis-dependent kidney failure was hypertension (12, 35%). Of the 34 randomized participants, 17 (50%) had diabetes, 30 (88%) had hypertension, and the mean baseline left ventricular GLS was −15.5 ± 3.3%. In regard to hemodialysis treatments, 5 (15%) participants dialyzed via a catheter, the mean delivered treatment time was 220 ± 27 minutes, and 13 ± 15% of baseline treatments were complicated by intradialytic hypotension. During the final baseline week, 6 (18%) participants reported itching and restless legs, 5 (15%) cramping and thirst, and 3 (9%) light-headedness. The average recovery time was 4.5 ± 6.5 hours.
Table 1.
Baseline patient characteristics (N=34).a
| Characteristic | Value |
|---|---|
| Age (years) | 56 ± 15 |
| Female | 8 (24) |
| Black race | 22 (65) |
| Hispanic | 11 (32) |
| Dialysis vintage (years) | 6.3 ± 5.0; 5.6 [2.0, 9.2] |
| Hospitalizations (%)b | 2 (6) |
| History of kidney transplant | 2 (6) |
| ESKD cause | |
| Diabetes | 9 (27) |
| Hypertension | 12 (35) |
| Glomerular disease | 4 (11) |
| Other | 9 (27) |
| Comorbid medical conditions | |
| Diabetes | 17 (50) |
| Congestive heart failure | 14 (41) |
| Coronary artery disease | 11 (32) |
| Hypertension | 30 (88) |
| Cancer | 3 (9) |
| TTE characteristicsc | |
| LV global longitudinal strain (%)c | −15.5 ± 3.3; −15.9 [−17.6, −12.3] n=32d |
| LV ejection fraction (%) | 52.8 ± 6.9; 53.0 [49.1, 57.0] n=32d |
| E/e’ | 11.6 ± 4.6; 10.2 [8.8, 14.8] n=32d |
| Blood pressure medications | |
| Beta blocker | 23 (68) |
| Calcium channel blocker | 15 (44) |
| RAAS inhibitor | 16 (47) |
| Diuretic | 8 (24) |
| Other anti-hypertensive medication | 7 (21) |
| Midodrine | 2 (6) |
| Vascular access type | |
| Fistula | 24 (70) |
| Graft | 5 (15) |
| Catheter | 5 (15) |
| Hemodialysis treatment | |
| Delivered treatment time (minutes) | 220 ± 27 |
| Pre-HD systolic BP (mmHg) | 150 ± 27 |
| Prescribed target weight (kilograms) | 69 ± 14 |
| UF volume (liters) | 2.7 ± 1.8 |
| Intradialytic hypotension (%)e | 13 ± 15 |
| Delivered UF rate (mL/h/kg) | 10.3 ± 3.7 |
| Symptomsf | |
| Cramping | 5 (15) |
| Nausea or upset stomach | 1 (3) |
| Vomiting | 0 |
| Dizziness or light-headedness | 3 (9) |
| Racing heart or heart palpitations | 1 (3) |
| Chest pain | 0 |
| Shortness of breath | 1 (3) |
| Thirst or dry mouth | 5 (15) |
| Headache | 2 (6) |
| Itching | 6 (18) |
| Restless legs or difficulty keeping legs still | 6 (18) |
| Tingling or feeling of pins and needles | 2 (6) |
| Time to recovery after hemodialysis (hours) | 4.5 ± 6.5 |
Values presented as n (%), mean ± standard deviation, and median [quartile 1, quartile 3].
Percentage of patients with a hospitalization during the baseline period. No patients had more than 1 hospitalization during this period.
LV global longitudinal strain is a measure of left ventricular systolic function. Normal range is −16 to −19% with less negative numbers reflecting greater impairment.[28]
Two baseline TTEs were of poor quality due to technical difficulty obtaining the examinations.
Percentage of baseline treatments with a nadir systolic BP <90 mmHg.
(+) symptom defined as patient-reported symptom to the level of moderate, severe or very severe.
Abbreviations: BP, blood pressure; E/e’, early mitral inflow velocity/mitral annular early diastolic velocity; ESKD, end-stage kidney disease; HD, hemodialysis; LV, left ventricular; RAAS, renin angiotensin-aldosterone system; TTE, transthoracic echocardiography; UF, ultrafiltration.
Primary outcomes
Table 2 and Supplemental Table S2 display study results. The overall rate of intradialytic hypotension was 14.3% (164 of 1149 treatments). There was no significant difference in intradialytic hypotension between hemodialysis with UF profiling and conventional UF (OR [95% CI]: 1.2 [0.8, 1.7] for UF profiling vs. conventional UF). There was no significant difference in pre- to post-dialysis troponin T change (ng/mL) between the treatment arms (mean [95% CI]: 12.3 [4.4, 20.2] ng/mL for UF profiling and 11.3 [3.4, 19.2] ng/mL for conventional UF) (mixed model β-coefficient [95% CI]: −2.8 [−6.9, 1.4] for UF profiling vs. conventional UF). Similarly, there was no significant difference in pre- to post-dialysis troponin T rise ≥10% between UF profiling and conventional UF (OR [95% CI]: 0.5 [0.2, 1.3] for UF profiling vs. conventional UF). Finally, there was no significant change in left ventricular GLS from baseline to peak hemodialysis stress between the study arms (mean [95% CI]: 0.9 [−0.1, 1.8] % for UF profiling and 1.3 [0.1, 2.4] % for conventional UF) (estimated median difference [95% CI]: −0.8 [−2.0, 0.5] for UF profiling vs. conventional UF) (Figure 3).
Table 2.
Comparison of binary study outcomes for UF profiling and conventional UF treatment conditions.
| Outcome | Definition | Odds ratio (95% CI) |
|---|---|---|
| BP and cardiovascular outcomes | ||
| Intradialytic hypotensiona | Nadir systolic BP <90 mmHg | 1.2 (0.8, 1.7) |
| Troponin T risea | [(Post-HD - pre-HD troponin T) / pre-HD troponin T] ≥10% | 0.5 (0.2, 1.3) |
| Left ventricular GLS change | (Peak intradialytic stress GLS - baseline GLS) ≥2.5% | 0.8 (0.1, 4.4) |
| Volume-related outcomes | ||
| Plasma refillb | Hematocrit decrease by ≥0.5% | 0.2 (0.1, 0.9) |
| Target weight achievement | Post-HD weight <1 kg above or below prescribed target weight | 1.0 (0.7. 1.3) |
| Symptom outcomes | ||
| Cramping | Cramping during last 3 HD treatments ≥moderate severity | 0.9 (0.4, 2.1) |
| Nausea | Nausea or upset stomach during last 3 HD treatments ≥moderate severity | 0.7 (0.2, 2.2) |
| Vomiting | Vomiting or throwing up during last 3 HD treatments ≥moderate severity | 1.0 (0.1, 16.0) |
| Light-headedness | Dizziness or light-headedness during last 3 HD treatments ≥moderate severity | 0.2 (0.1, 0.9) |
| Racing heart | Racing heart or heart palpitations during last 3 HD treatments ≥moderate severity | 3.1 (0.3, 32.4) |
| Chest pain | Chest pain during last 3 HD treatments ≥moderate severity | 1.0 (0.2, 6.0) |
| Shortness of breath | Shortness of breath during last 3 HD treatments ≥moderate severity | 1.3 (0.3, 6.5) |
| Thirst | Thirst or dry mouth during last 3 HD treatments ≥moderate severity | 0.6 (0.3, 1.2) |
| Headache | Headache during last 3 HD treatments ≥moderate severity | 0.9 (0.4, 2.3) |
| Itching | Itching during last 3 HD treatments ≥moderate severity | 2.8 (1.2, 6.6) |
| Restless legs | Restless legs or difficulty keeping legs still during last 3 HD treatments ≥moderate severity | 1.2 (0.5, 2.6) |
| Tingling | Tingling or feeling of pins and needles during last 3 HD treatments ≥moderate severity | 0.6 (0.2, 2.4) |
| Time to recovery after HD | Response to question, “How long did it take you to recover after your last 3 HD treatments?” >12 hours | 1.1 (0.7, 1.8) |
| Other | ||
| Patient acceptance | Affirmative response to question, “If recommended by your kidney doctor, would you be willing to adopt the HD prescription you have received for the last 9 treatments?” | NRc |
Primary study outcome. All other listed outcomes were secondary or exploratory outcomes.
Plasma refill was measured by Crit-Line Monitors (Fresenius Medical Care North America, Waltham, MA). In treatments with plasma refill measurements, the UF time was set to 10 minutes shorter than the prescribed treatment run-time, and hematocrit values were measured at the time of UF termination and at the end of treatment. Plasma refill was deemed present if the hematocrit decreased by ≥0.5% from the termination of UF to the end of treatment.
Low event rate (non-acceptance=3 vs. acceptance=131) precludes accurate estimation of odds ratio (95% CI).
Abbreviations: BP, blood pressure; CI, confidence interval; GLS, global longitudinal strain; HD, hemodialysis; NR, not reported; UF, ultrafiltration.
Figure 3.

Change in left ventricular systolic and diastolic function from baseline to peak intradialytic stress with UF profiling vs. conventional UF.
Comparison of change in left ventricular GLS (%) and E/e’ from baseline to peak intradialytic stress with hemodialysis with UF profiling compared to hemodialysis with conventional UF. A greater positive change from 0 for left ventricular GLS indicates greater left ventricular systolic function impairment with dialysis. A greater positive change from 0 for E/e’ indicates greater left ventricular diastolic function impairment with dialysis. Baseline TTEs were performed on a non-dialysis day. Intradialytic TTEs were performed 30 minutes before the end of hemodialysis during a hemodialysis treatment following the 72-hour break.
Abbreviations: E/e’, early mitral inflow velocity/mitral annular early diastolic velocity; GLS, global longitudinal strain; LV, left ventricular; UF, ultrafiltration.
Secondary and exploratory outcomes
With UF profiling, participants had significantly lower odds of plasma refill (i.e. less post-dialysis hypervolemia) (OR [95% CI]: 0.2 [0.05, 0.9]) and the patient-reported symptom of light-headedness (OR [95% CI]: 0.2 [0.06, 0.9]) compared to conventional UF. With UF profiling, patients also had significantly higher odds of patient-reported itching (2.8 [1.2, 6.6]) compared to conventional UF. There was no significant difference in other secondary and exploratory outcomes between arms. Additionally, 0 participants had serious adverse events during the study, and 5 participants had adverse events (2 with UF profiling and 5 with conventional UF; Supplemental Table S3). Finally, there were a total of 81 fluid boluses (defined as normal saline ≥500 mL) administered during study treatments among 25 unique patients. Of the 81 boluses, 39 (48%) occurred during conventional UF and 42 (52%) occurred during UF profiling.
DISCUSSION
In this pilot randomized crossover study, we found that hemodialysis with UF profiling (constantly declining UF rate) did not reduce the rate of hypotension, occurrence of pre- to post-dialysis troponin T rise, or the degree of dialysis-associated left ventricular strain compared to hemodialysis with conventional UF. Ultrafiltration profiling did result in lower odds of post-dialysis plasma refill and intradialytic light-headedness compared to conventional UF. Taken together, the plasma refill and light-headedness findings may suggest a role for UF profiling in improving post-dialysis volume status, but these findings are modest and should be interpreted with caution given the lack of objective measures of volume status.
There have been relatively few prior investigations of UF profiling independent of sodium profiling as a strategy to mitigate hemodialysis-induced hemodynamic stress. A recent randomized crossover trial of blood volume-monitoring-guided UF biofeedback (machine-adjusted UF rate in response to real-time relative blood volume) found no difference in the rate of symptomatic hypotension, cardiac troponins, or dialysis recovery time between the intervention and standard UF.[14] However, such biofeedback-based approaches are dependent on the accuracy of relative blood volume monitoring and are not widely available. Prior trials of automated UF profiling, a setting on most hemodialysis machines, and hemodynamics yielded mixed results and were of limited sample sizes (8–53 patients) and conducted over a decade ago.[23–25] Moreover, none of these studies examined the effect of UF profiling on other cardiac ischemic markers such as troponin T and intradialytic myocardial stunning.
In our pilot trial, we found no difference in markers of cardiac ischemia (nadir intradialytic systolic BP, troponin T, and left ventricular strain) between hemodialysis treatments with UF profiling and those with conventional UF. While the GLS change (%) was not significantly different between UF paradigms, there was a trend toward lesser strain with UF profiling. Similarly, the OR for troponin T rise was potent (0.5) but the 95% CI crossed 1.0 (0.2, 1.3), suggestive of an association obscured by lack of power. One explanation for these findings may relate to our selection of a relatively low UF rate threshold for study inclusion (>10 mL/h/kg). Participants’ mean baseline UF rate was near this threshold, 10.3 ± 3.7 mL/h/kg. While observational data have shown significant associations between UF rates ≥10 mL/h/kg and higher mortality risk, such associations were relatively modest compared to those observed with UF rates >13 mL/h/kg,[2] the threshold specified in dialysis care quality programs.[32] Additionally, we performed intradialytic TTEs 30 minutes prior to the end of two study hemodialysis treatments (one each with UF profiling and conventional UF), coincident with peak intradialytic stress timing as demonstrated in prior studies.[7, 8] It is plausible that the timing of peak intradialytic stress from UF profiling may coincide with the maximum UF rate and thus occur earlier in treatment. It is also possible that we missed an effect by evaluating only 2 treatments. Finally, we studied UF profile 2 on the Fresenius 2008T machine, a profile that begins with a UF rate 40% higher than the baseline UF rate. For a 70 kg person with a 3.25-hour treatment and 3 kg interdialytic weight gain, the initial UF rate would exceed 18 mL/h/kg. While the timing of this profile’s maximum UF rate use is coincident with peak intravascular hydration and oncotic pressure, this high of a UF rate may be disadvantageous. Study of UF profiles that utilize lower peak UF rates and/or different patterns of fluid removal are areas for future inquiry.
While findings from our primary outcomes were negative, we did observe significantly lower odds of blood volume measured-plasma refill and patient-reported intradialytic light-headedness with UF profiling compared to conventional UF, suggesting that UF profiling may improve post-dialysis extracellular volume status. However, there was no difference in post-dialysis target weight achievement. Blood volume-measured plasma refill is an indirect measure of extracellular volume status, and our lack of objective measures prevents unqualified conclusions about the effect of UF profiling on post-dialysis volume status or other volume-related outcomes. Additional study of UF profiling to mitigate post-dialysis hypervolemia may be warranted.
Strengths of our trial include blinding of investigators and use of standard hemodialysis treatment prescriptions (with the exception of UF paradigm) and clinical protocols, rendering trial conditions similar to those of routine practice. Limitations beyond the aforementioned UF rate threshold selection criteria, intradialytic TTE timing, and lack of objective volume status measures, bear acknowledgement. We considered delivered UF rate (vs. prescribed UF rate) for participant selection. Delivered UF rates reflect the speed of fluid removal that occurred in a dialysis treatment whereas prescribed UF rates reflect the intended speed of fluid removal based on observed interdialytic weight gain, prescribed treatment time, and prescribed target weight. In cases of hemodynamic instability, delivered UF rates are often lower than prescribed UF rates due to intradialytic interventions such as UF termination or fluid administration. As such, delivered UF rates may not adequately capture UF rate-induced physiologic stress. Second, our findings should not be generalized to patients who fall outside of our study selection criteria, such as incident hemodialysis patients and patients with advanced heart and liver disease. Related, compared to the broader U.S. in-center hemodialysis population,[1] there was relative under-representation of women and individuals of White race and over-representation of individuals of Black race and Hispanic ethnicity in our study. Third, we used a UF rate threshold of 10 mL/h/kg for study inclusion rather than a higher threshold (e.g. 13 mL/h/kg) based on observational data showing an association between UF rates >10 (vs. ≤10) mL/h/kg and higher mortality,[2] and contemporary UF rate trends in the U.S.[33] It is plausible that UF profiling may have different effects on hemodynamics when higher UF rate thresholds are used. Fourth, dialysis clinic personnel and treating nephrologists were aware of the study arm assignment. Therefore, we cannot exclude the possibility that treatment decisions (i.e. UF volume adjustment) were influenced by study arm. Importantly, patients, investigators, cardiac sonographers, and data analysts were blinded. Fifth, this was a small pilot study and may have been underpowered as evidenced by potent ORs that were non-significant (e.g. GLS and Troponin T rise). Finally, we considered numerous secondary and exploratory outcomes and cannot rule out the possibility of type I error.
Our study findings do not support hemodialysis with UF profiling (constantly declining UF rate) as a routine strategy to mitigate risk from higher UF rates. However, we did not find evidence of UF profiling-related harm, and the strategy was well-accepted by participants. As such, UF profiling remains a reasonable volume management strategy to consider, particularly among individuals at high risk for intradialytic myocardial injury or with evidence of post-dialysis hypervolemia.
Supplementary Material
ACKNOWLEDGEMENTS
The authors would like to thank the personnel of the participating dialysis clinics for their clinical expertise, assistance with study execution, and overall enthusiasm for the study. The authors thank Melissa Caughey and Matthew Johnson for performance of study echocardiograms. The authors thank the patient participants for their enthusiasm and willingness to take part in all study activities. Study data were collected and managed using REDCap (Research Electronic Data Capture) electronic data capture tools hosted at University of North Carolina at Chapel Hill. REDCap is a secure, web-based application designed to support data capture for research studies, providing 1) an intuitive interface for validated data entry; 2) audit trails for tracking data manipulation and export procedures; 3) automated export procedures for seamless data downloads to common statistical packages; and 4) procedures for importing data from external sources.
Funding: JEF and this study are supported by grant K23 DK109401 awarded by the National Institute of Diabetes and Digestive and Kidney Diseases of the National Institutes of Health. The funder had no role in study design; data collection, analysis, and interpretation; or manuscript writing.
Footnotes
Publisher's Disclaimer: This Author Accepted Manuscript is a PDF file of an unedited peer-reviewed manuscript that has been accepted for publication but has not been copyedited or corrected. The official version of record that is published in the journal is kept up to date and so may therefore differ from this version.
The results of this study were presented in abstract form at the American Society of Nephrology Kidney Week Meeting in Washington, D.C. in November 2019.
Conflicts of interest/Competing interests: In the last 3 years, JEF has received speaking honoraria from American Renal Associates, the American Society of Nephrology, Dialysis Clinic, Inc., the National Kidney Foundation, and multiple universities. JEF is on the medical advisory board of NxStage Medical, Inc. and has received consulting fees from Fresenius Medical Care, North America, and AstraZeneca. In the last 3 years, MMA has received investigator-initiated research funding from the Renal Research Institute, a subsidiary of Fresenius Medical Care, North America, and honoraria from the International Society of Nephrology. The remaining authors have no competing interests.
Ethics approval: This study was approved by the University of North Carolina at Chapel Hill Institutional Review Board (#17–1057).
Consent to participate: Written informed consent was obtained from all participants.
Consent for publication: Not applicable.
Availability of data and material: The datasets generated during the presented study are not immediately publicly available due to University of North Carolina at Chapel Hill data sharing policies. However, the data can be made available to interested parties upon execution of appropriate data use agreements.
Code availability: Available upon request.
REFERENCES
- 1.Saran R, Robinson B, Abbott KC, et al. US Renal Data System 2018 Annual Data Report: Epidemiology of Kidney Disease in the United States. Am J Kidney Dis. 2019;73(3 Suppl 1):A7–A8. [DOI] [PMC free article] [PubMed] [Google Scholar]
- 2.Assimon MM, Wenger JB, Wang L, Flythe JE. Ultrafiltration Rate and Mortality in Maintenance Hemodialysis Patients. Am J Kidney Dis. 2016;68(6):911–22. doi: 10.1053/j.ajkd.2016.06.020. [DOI] [PMC free article] [PubMed] [Google Scholar]
- 3.Flythe JE, Kimmel SE, Brunelli SM. Rapid fluid removal during dialysis is associated with cardiovascular morbidity and mortality. Kidney Int. 2011;79(2):250–7. [DOI] [PMC free article] [PubMed] [Google Scholar]
- 4.Saran R, Bragg-Gresham JL, Levin NW, Twardowski ZJ, Wizemann V, Saito A, et al. Longer treatment time and slower ultrafiltration in hemodialysis: associations with reduced mortality in the DOPPS. Kidney Int. 2006;69(7):1222–8. [DOI] [PubMed] [Google Scholar]
- 5.Movilli E, Gaggia P, Zubani R, Camerini C, Vizzardi V, Parrinello G, et al. Association between high ultrafiltration rates and mortality in uraemic patients on regular haemodialysis. A 5-year prospective observational multicentre study. Nephrol Dial Transplant. 2007;22(12):3547–52. [DOI] [PubMed] [Google Scholar]
- 6.Hussein WF, Arramreddy R, Sun SJ, Reiterman M, Schiller B. Higher Ultrafiltration Rate Is Associated with Longer Dialysis Recovery Time in Patients Undergoing Conventional Hemodialysis. Am J Nephrol. 2017;46(1):3–10. doi: 10.1159/000476076. [DOI] [PubMed] [Google Scholar]
- 7.Burton JO, Jefferies HJ, Selby NM, McIntyre CW. Hemodialysis-induced cardiac injury: determinants and associated outcomes. Clin J Am Soc Nephrol. 2009;4(5):914–20. [DOI] [PMC free article] [PubMed] [Google Scholar]
- 8.Burton JO, Jefferies HJ, Selby NM, McIntyre CW. Hemodialysis-induced repetitive myocardial injury results in global and segmental reduction in systolic cardiac function. Clin J Am Soc Nephrol. 2009;4(12):1925–31. [DOI] [PMC free article] [PubMed] [Google Scholar]
- 9.Lee YJ, Okuda Y, Sy J, Lee YK, Obi Y, Cho S, et al. Ultrafiltration Rate, Residual Kidney Function, and Survival Among Patients Treated With Reduced-Frequency Hemodialysis. Am J Kidney Dis. 2020;75(3):342–50. doi: 10.1053/j.ajkd.2019.08.019. [DOI] [PMC free article] [PubMed] [Google Scholar]
- 10.MacEwen C, Watkinson P, Tarassenko L, Pugh C. Cerebral ischemia during hemodialysis-finding the signal in the noise. Semin Dial. 2018;31(3):199–203. doi: 10.1111/sdi.12679. [DOI] [PubMed] [Google Scholar]
- 11.Seong EY, Zheng Y, Winkelmayer WC, Montez-Rath ME, Chang TI. The Relationship between Intradialytic Hypotension and Hospitalized Mesenteric Ischemia: A Case-Control Study. Clin J Am Soc Nephrol. 2018;13(10):1517–25. doi: 10.2215/CJN.13891217. [DOI] [PMC free article] [PubMed] [Google Scholar]
- 12.Marants R, Qirjazi E, Grant CJ, Lee TY, McIntyre CW. Renal Perfusion during Hemodialysis: Intradialytic Blood Flow Decline and Effects of Dialysate Cooling. J Am Soc Nephrol. 2019;30(6):1086–95. doi: 10.1681/ASN.2018121194. [DOI] [PMC free article] [PubMed] [Google Scholar]
- 13.Reddan DN, Szczech LA, Hasselblad V, Lowrie EG, Lindsay RM, Himmelfarb J, et al. Intradialytic blood volume monitoring in ambulatory hemodialysis patients: a randomized trial. J Am Soc Nephrol. 2005;16(7):2162–9. [DOI] [PubMed] [Google Scholar]
- 14.Leung KCW, Quinn RR, Ravani P, Duff H, MacRae JM. Randomized Crossover Trial of Blood Volume Monitoring-Guided Ultrafiltration Biofeedback to Reduce Intradialytic Hypotensive Episodes with Hemodialysis. Clin J Am Soc Nephrol. 2017;12(11):1831–40. doi: 10.2215/CJN.01030117. [DOI] [PMC free article] [PubMed] [Google Scholar]
- 15.Ronco C, Brendolan A, Milan M, Rodeghiero MP, Zanella M, La Greca G. Impact of biofeedback-induced cardiovascular stability on hemodialysis tolerance and efficiency. Kidney Int. 2000;58(2):800–8. doi: 10.1046/j.1523-1755.2000.00229.x. [DOI] [PubMed] [Google Scholar]
- 16.Basile C, Giordano R, Vernaglione L, Montanaro A, De Maio P, De Padova F, et al. Efficacy and safety of haemodialysis treatment with the Hemocontrol biofeedback system: a prospective medium-term study. Nephrol Dial Transplant. 2001;16(2):328–34. doi: 10.1093/ndt/16.2.328. [DOI] [PubMed] [Google Scholar]
- 17.Santoro A, Mancini E, Basile C, Amoroso L, Di Giulio S, Usberti M, et al. Blood volume controlled hemodialysis in hypotension-prone patients: a randomized, multicenter controlled trial. Kidney Int. 2002;62(3):1034–45. doi: 10.1046/j.1523-1755.2002.00511.x. [DOI] [PubMed] [Google Scholar]
- 18.Bégin V, Déziel C, Madore F. Biofeedback regulation of ultrafiltration and dialysate conductivity for the prevention of hypotension during hemodialysis. ASAIO J. 2002;48(3):312–5. doi: 10.1097/00002480-200205000-00018. [DOI] [PubMed] [Google Scholar]
- 19.Gabrielli D, Krystal B, Katzarski K, Youssef M, Hachache T, Lopot F, et al. Improved intradialytic stability during haemodialysis with blood volume-controlled ultrafiltration. J Nephrol. 2009;22(2):232–40. [PubMed] [Google Scholar]
- 20.Sang GL, Kovithavongs C, Ulan R, Kjellstrand CM. Sodium ramping in hemodialysis: a study of beneficial and adverse effects. Am J Kidney Dis. 1997;29(5):669–77. [DOI] [PubMed] [Google Scholar]
- 21.Oliver MJ, Edwards LJ, Churchill DN. Impact of sodium and ultrafiltration profiling on hemodialysis-related symptoms. J Am Soc Nephrol. 2001;12(1):151–6. [DOI] [PubMed] [Google Scholar]
- 22.Song JH, Lee SW, Suh CK, Kim MJ. Time-averaged concentration of dialysate sodium relates with sodium load and interdialytic weight gain during sodium-profiling hemodialysis. Am J Kidney Dis. 2002;40(2):291–301. [DOI] [PubMed] [Google Scholar]
- 23.Donauer J, Kölblin D, Bek M, Krause A, Böhler J. Ultrafiltration profiling and measurement of relative blood volume as strategies to reduce hemodialysis-related side effects. Am J Kidney Dis. 2000;36(1):115–23. [DOI] [PubMed] [Google Scholar]
- 24.Straver B, De Vries PM, Donker AJ, ter Wee PM. The effect of profiled hemodialysis on intradialytic hemodynamics when a proper sodium balance is applied. Blood Purif. 2002;20(4):364–9. [DOI] [PubMed] [Google Scholar]
- 25.Zhou YL, Liu HL, Duan XF, Yao Y, Sun Y, Liu Q. Impact of sodium and ultrafiltration profiling on haemodialysis-related hypotension. Nephrol Dial Transplant. 2006;21(11):3231–7. [DOI] [PubMed] [Google Scholar]
- 26.Dwan K, Li T, Altman DG, Elbourne D. CONSORT 2010 statement: extension to randomised crossover trials. BMJ. 2019;366:l4378. doi: 10.1136/bmj.l4378. [DOI] [PMC free article] [PubMed] [Google Scholar]
- 27.Tugman MJ, Narendra JH, Li Q, Wang Y, Hinderliter AL, Brunelli SM, et al. Ultrafiltration-profiled hemodialysis to reduce dialysis-related cardiovascular stress: Study protocol for a randomized controlled trial. Contemp Clin Trials Commun. 2019;15:100415. doi: 10.1016/j.conctc.2019.100415. [DOI] [PMC free article] [PubMed] [Google Scholar]
- 28.Douglas PS, Carabello BA, Lang RM, Lopez L, Pellikka PA, Picard MH, et al. 2019 ACC/AHA/ASE Key Data Elements and Definitions for Transthoracic Echocardiography: A Report of the American College of Cardiology/American Heart Association Task Force on Clinical Data Standards (Writing Committee to Develop Cardiovascular Endpoints Data Standards) and the American Society of Echocardiography. J Am Coll Cardiol. 2019;74(3):403–69. doi: 10.1016/j.jacc.2019.02.027. [DOI] [PubMed] [Google Scholar]
- 29.Fresenius Medical Care Renal Technologies: Crit-Line Training Guide. (2017). Available at: https://fmcna.com/content/dam/fmcna/live/support/documents/fluid-management/crit-line-iii/Critline%20III%20Training%20Guide.pdf. Accessed August 17, 2020.
- 30.Khan NA, Hemmelgarn BR, Tonelli M, Thompson CR, Levin A. Prognostic value of troponin T and I among asymptomatic patients with end-stage renal disease: a meta-analysis. Circulation. 2005;112(20):3088–96. [DOI] [PubMed] [Google Scholar]
- 31.Kramann R, Erpenbeck J, Schneider RK, Röhl AB, Hein M, Brandenburg VM, et al. Speckle tracking echocardiography detects uremic cardiomyopathy early and predicts cardiovascular mortality in ESRD. J Am Soc Nephrol. 2014;25(10):2351–65. [DOI] [PMC free article] [PubMed] [Google Scholar]
- 32.Centers for Medicare and Medicaid Services: End-Stage Renal Disease Quality Improvement Program Summary: Payment Years 2019 – 2024. (2018). Available at: https://www.cms.gov/Medicare/Quality-Initiatives-Patient-Assessment-Instruments/ESRDQIP/Downloads/ESRD-QIP-Summary-Payment-Years-2019-2024.pdf. Accessed July 16, 2020. [Google Scholar]
- 33.Weinhandl E: Better Management of Volume with Intensive Hemodialysis. (2019). Available at: http://advancingdialysis.org/better-management-of-volume-with-intensive-hemodialysis/ Accessed. [Google Scholar]
Associated Data
This section collects any data citations, data availability statements, or supplementary materials included in this article.