

Abstract
UBXN7 is a cofactor protein that provides a scaffold for both CRL3KEAP1 and CRL2VHL ubiquitin ligase complexes involved in the regulation of the NRF2 and HIF-1α protein levels respectively. NRF2 and HIF-1α are surveillance transcription factors that orchestrate the cellular response to oxidative stress (NRF2) or to hypoxia (HIF-1α). Since mitochondria are the main oxygen sensors as well as the principal producers of ROS, it can be presumed that they may be able to modulate the activity of CRL3KEAP1 and CRL2VHL complexes in response to stress. We have uncovered a new mechanism of such regulation that involves the UBXN7 cofactor protein and its regulation by mitochondrial MUL1 E3 ubiquitin ligase. High level of UBXN7 leads to HIF-1α accumulation, whereas low level of UBXN7 correlates with an increase in NRF2 protein. The reciprocal regulation of HIF-1α and NRF2 by UBXN7 is coordinated under conditions of oxidative stress or hypoxia. In addition, this molecular mechanism leads to different metabolic states; high level of UBXN7 and accumulation of HIF-1α support glycolysis, whereas inactivation of UBXN7 and activation of NRF2 confer increased OXPHOS. We describe a new mechanism by which MUL1 E3 ubiquitin ligase modulates the UBXN7 cofactor protein level and provides a reciprocal regulation of CRL3KEAP1 and CRL2VHL ubiquitin ligase complexes. Furthermore, we delineate how this regulation is reflected in NRF2 and HIF-1α accumulation and determines the metabolic state as well as the adaptive response to mitochondrial stress.
Keywords: MUL1, UBXN7, glycolysis, oxidative stress, NRF2, HIF-1α
1. INTRODUCTION
Nuclear factor erythroid 2 like-2 (NRF2) and hypoxia-inducible factor (HIF-1α), are part of a surveillance network that responds to oxidative stress or low oxygen levels respectively [1, 2]. Although both NRF2 and HIF-1α are distinct transcription factors, they can also work collaboratively and may perform overlapping tasks [3]. Once activated, they carry out their normal function by regulating the transcription of hundreds of target genes [4, 5]. In order to be available for rapid recruitment, they are continuously synthesized and removed through specific Lysine 48 (K48)-ubiquitination and proteasomal degradation [6, 7]. The ubiquitination of NFR2 is regulated by the CRL3KEAP1 whereas HIF-1α is controlled by the CRL2VHL complex [8, 9]. These multi-protein ubiquitin ligase complexes are similar both in composition and function. They are made up of a number of unique polypeptides as well as several common proteins that are present in both complexes (Figure 1A). The relationship between CRL3KEAP1 and CRL2VHL complexes suggests that NRF2 and HIF-1α might be regulated in a coordinated manner, with cross-talk, and potential competition for the common subunits. UBXN7 is a cofactor protein and the scaffold for the assembly of both CRL3KEAP1 and CRL2VHL complexes [10, 11]. UBXN7 belongs to a diverse family of UBX (ubiquitin-regulatory X) domain-containing proteins. They are characterized by a ubiquitin regulatory X (UBX) domain at their C-terminus that interacts with AAA+ATPase p97 protein [12]. In addition, UBXN7 has a ubiquitin-associated (UBA) domain at its N-terminus that interacts with ubiquitinated NRF2 or HIF-1α, and a ubiquitin interaction motif (UIM) that interacts with the neddylated form of CUL2 or CUL3 [10, 11, 13]. UBXN7 protein level is regulated by the mitochondrial MUL1 E3 ubiquitin ligase during conditions of mitochondrial stress and inactivation of MUL1 leads to accumulation of both UBXN7 and HIF-1α proteins [14]. Whether MUL1, through its UBXN7 substrate, is involved in the coordinate regulation of NRF2 in response to mitochondrial stress is unknown. MUL1 ligase is anchored in the outer mitochondrial membrane with a long intermembrane domain (IMD) that acts as a sensor of mitochondrial stress [15]. MUL1 function has been implicated in multiple biological processes including mitochondrial dynamics, mitophagy, cell death, innate immune response, and regulation of metabolism [16–24]. The protein level of MUL1 as well as its ligase activity are directly modulated by mitochondrial stress and this is reflected on the protein level by its UBXN7 substrate [14]. Our data show that accumulation of UBXN7 leads to increased HIF-1α without affecting the NRF2 protein level. In contrast, inactivation of UBXN7 reduces HIF-1α and increases NRF2 protein level. We also uncovered a reciprocal correlation between the NRF2 and HIF-1α protein levels and activity during conditions of oxidative stress or hypoxia. In addition, UBXN7 by regulating NRF2 and HIF-1α levels, acts as a metabolic switch between increased OXPHOS (low UBXN7, high NRF2) and increased glycolysis (high UBXN7, high HIF-1α).
Figure 1. UBXN7 protein level differentially regulate the transcription factors NRF2 and HIF-1α.

A. Schematic diagram of the CRL3KEAP1 and the CRL2VHL complexes, illustrating all their respective proteins. The four proteins (UBXN7, p97, E2, and RBX1) that are shared between the two complexes are depicted in different shade of blue. B. Whole cell extracts were prepared from HEK293 WT, HEK293 MUL1(−/−), and HEK293 UBXN7(−/−) cells. The expression of NRF2, HIF-1α UBXN7 and MUL1 was monitored by Western blot analysis. β-actin antibody was used to verify equal loading on each lane. C. Densitometric analysis of the protein expression levels from (B) normalized against β-actin. Results are shown as means ± S.D. of three independent experiments. *p<0.009, #p<0.002 versus HEK293 WT. D. Quantitative real-time PCR analysis of NRF2 and HIF-1α in HEK293 WT, HEK293 MUL1(−/−), and HEK293 UBXN7(−/−) cells. β-actin was used as a control, while EIF3D served as a normalizer. Results are shown as means ± S.D. of three independent experiments.
In summary, we describe a new molecular pathway that mediates the concomitant regulation of both NRF2 and HIF-1α transcription factors in response to mitochondrial stress. This pathway involves the UBXN7 cofactor and its regulation by mitochondrial MUL1 ligase. Deregulation of this pathway leads to the dysfunction of the CRL3KEAP1 and CRL2VHL complexes, increased cellular stress and a switch in the metabolic state.
2. MATERIALS AND METHODS
2.1. Cell Culture and Chemicals
Cell lines:
HEK293 UBXN7(−/−) cell line was generated in our lab as previously described [14]. Briefly, to ablate UBXN7 expression, the target sequence TCTGTGTTGTTGTTCGGCGGCGG in the exon 1 was selected using the CRISPOR program (http://crispor.tefor.net) and cloned into the BbsI restriction enzyme site of the pSpCas9(BB)-2A-GFP (PX458) vector (Addgene) as previously described [25]. The resulting vector and an empty PX458 vector were transfected into HEK293 cells and 48 hours later, single GFP-positive cells were sorted into 96 well plates using a BD FACS ARIA II sorter. Clones were expanded and tested for lack of UBXN7 protein expression. Genomic DNA was isolated for PCR amplification of the region surrounding exon 1 and sequenced to confirm the presence of a deletion that disrupts UBXN7 protein expression. Several HEK293 UBXN7(−/−) clones were tested to verify reproducibility and lack of any off-target effects. HEK293 T-REx Flp-In and HEK293 MUL1(−/−) cells previously described in [26], were kindly provided by Dr. Janos Steffen and Dr. Carla Koehler (Department of Biological Chemistry, David Geffen School of Medicine, Los Angeles, CA). Cell cultures were grown in DMEM supplemented with 10% FBS 2 mM L-glutamine, 1 mM sodium pyruvate, 50 units/ml penicillin, and 50 μg/ml streptomycin.
Chemicals and reagents:
MG132 and H2O2 were purchased from SIGMA, Dimethyl fumarate (DMF) and sodium arsenite from Fisher Scientific. MitoSOX™ Red Mitochondrial Superoxide Indicator from Thermo Fisher Scientific. AnnexinV from BD Biosciences.
Chemical Treatments:
Cells were treated with increasing concentrations of H2O2 (100, 200, 400, and 600 μM) for 8 hours, to induce varying degrees of oxidative stress. Sodium arsenite (NaAsO2) was used at 10, 20, and 80 μM concentrations for 4 hours. DMF was dissolved in DMSO and used at 40, 60 and 80 μM for 8 hours. MG132 was used at 5 μM for 6 hours.
2.2. SDS-PAGE and Western blot analysis
Untreated cells as well as cells treated with H2O2, MG132, DMF, and arsenite were lysed using a Triton X-100 based lysis buffer (1% Triton X-100, 10% glycerol, 150 mM NaCl, 20 mM Tris pH 7.5, 2 mM EDTA) in the presence of protease inhibitors tablets (Thermo Fisher Scientific). Approximately 40 μg of whole cell extract was resuspended in SDS sample buffer, boiled for 5 minutes and the proteins resolved by SDS-PAGE. They were then transferred onto PVDF membranes (Genesee) using a semi-dry cell transfer blot (Bio-Rad) and placed in 4% nonfat dry milk in TBST buffer (25 mM Tris-HCl pH 8.0, 125 mM NaCl, 0.1% Tween 20) to block nonspecific binding of the membrane. The membranes were incubated with the indicated primary antibodies: MUL1 and UBXN7 rabbit polyclonal antibodies are homegrown and used at 1:5,000 dilution, HIF-1α (Bioss Antibodies, 1:2,000), NRF2 (Novus Biologicals 1:1000), KEAP1 (Bioss 1:1,000), HO-1 (Bioss 1:2000), P62 (ProteinTech 1:2,000), p97 (Santa Cruz Biotechnology, 1:5,000), tubulin (Santa Cruz Biotechnology, 1:2,000), histone H3 (Santa Cruz Biotechnology, 1:500), RBX1 (Aviva Systems Biology, 1:500), CUL3 (Cell Signaling Technology 1:500), GLUT1 (NovusBio, 1:1000), β-actin (Santa Cruz Biotechnology, 1:3,000). Secondary peroxidase-conjugated goat anti-rabbit or goat anti-mouse antibodies (Jackson ImmunoResearch) were used at 1:10,000 dilution; the membrane was visualized by enhanced chemiluminescence (ECL) (Thermo Fisher Scientific).
2.3. Quantitative real-time PCR
Total RNA was isolated from HEK293 WT, HEK293 UBXN7(−/−) and HEK293 MUL1(−/−) cells using the RNAeasy Mini Kit (Qiagen). First-strand cDNA was generated using the QuantiTect Reverse Transcription Kit according to the manufacturer’s protocol (Qiagen). Briefly, 500 ng of RNA was reverse transcribed in a 20 μl volume and after heat-inactivation diluted with 80 μl of water. For the qRT-PCR, 2 μl of the diluted RT reaction was used in a final volume of 10 μl. qRT-PCR was carried out with the Rotor-Gene SYBR Green PCR Kit using the following QuantiTect primers: EIF3D and β-actin (Qiagen). The HIF-1α primers used were: 5’-GATACCAACAGTAACCAACCT-Forward, 5’-CTCTTTTGGCAAGCATCCTG-Reverse and the NRF2 primers were: 5’-CCAGCAGGACATGGATTTGA-Forward, 5’-TTGGGAATGTGGGCAACCTG-Reverse. The qPCR reactions were run in a Rotor-Gene Q instrument for 40 cycles (95°C for 7 seconds, 60°C for 20 seconds and 72°C for 10 seconds) after an initial denaturation step of 5 minutes. All reactions were performed in triplicates. Cycle threshold (Ct) values were obtained using a fixed threshold setting and values were normalized with the EIF3D Ct data. Data were analyzed with the 2−ΔΔCt Livak method to determine changes in gene expression, while β-actin served as a control.
2.4. Flow Cytometry (Annexin V and MitoSOX)
For apoptosis measurement a fraction of the cell samples (1×10⁵) control as well as under various treatments was used; Cells were resuspended in 1x binding buffer (10 mM Hepes pH 7.4, 140 mM NaCl, 2.5 mM CaCl2), and AnnexinV-PE was added for 20 minutes at room temperature in the dark. Cells were then analyzed by flow cytometry using a Cytoflex S (Beckman Coulter). Another fraction of equal number of cells (1×10⁶) was used to detect superoxide and reactive oxygen species (ROS) production, using MitoSOX superoxide indicator following protocol as previously described [27, 28]. Briefly, cells were washed in cPBS (PBS with the addition of 0.5 mM of CaCl2, 0.5 mM MgCl2, and 0.1% Glucose). Cells were resuspended in 100μL of cPBS containing 1 μM of MitoSOX-Red and incubated at 37°C for 30 minutes followed by a final wash and flow cytometric analysis [29, 30].
2.5. Subcellular fractionation
HEK293 UBXN7(−/−) and HEK293 WT cells untreated and H2O2 treated, were grown in 100 mm dishes. When the cells reached 95% confluence, they were detached using trypsin-EDTA (Invitrogen), washed twice with ice-cold PBS and processed for fractionation using a commercially available Nuclear and Cytoplasmic Extraction Kit (Thermo Fisher Scientific) according to the manufacturer’s instructions. The fractions were analyzed by SDS-PAGE and Western blot using NRF2, tubulin, and histone H3 specific antibodies.
2.6. Hypoxic induction on HEK293 wild-type and HEK293 UBXN7(−/−)
Cells were cultured in complete DMEM media overnight and replaced with L-15 Medium (Leibovitz) before placing them inside a hypoxia chamber (STEMCELL Technologies) using a gaseous mixture of 1% O2, 5% CO2 and 94% N2 for various time periods.
Control cells were cultured under normoxic conditions (5% CO2) at 37°C. Cells were harvested and washed with phosphate buffer saline, total cell lysates were processed for SDS-PAGE and Western blot analysis to monitor the expression of NRF2, HIF-1α, UBXN7, HO-1, and GLUT1 proteins.
2.7. Mitochondrial stress assay
Mitochondrial stress assay was performed using an XFe24 Extracellular Flux Analyzer (Agilent) following the workflow provided by the manufacturer’s instructions. Briefly, for Oxygen Consumption Rate (OCR) and Extracellular Acidification Rate (ECAR) measurements, HEK293 UBXN7(−/−), HEK293 MUL1(−/−) and HEK293 WT cells were seeded in triplicates on poly-D-lysine coated XF24 microplates at a density of 70,000 cells per well in assay medium (XF DMEM medium pH 7.4 supplemented with 10 mM glucose, 2 mM glutamine, 1 mM pyruvate), followed by incubation at 37°C in a non-CO2 incubator for 60 minutes. Three baseline measurements were recorded (3-2-3 mix/measurement cycle) before the injection of the following compounds: Oligomycin in port A (56 μl) at 1.5 μM, FCCP in port B (62 μl) at 1.5 μM, and Rotenone/Antimycin in port C (69 μl) at 0.5 μM. Data analysis was performed using Cell Mito Stress Test Report Generators software.
2.8. Real-Time ATP rate assay
For ATP production rate assay an Agilent Seahorse XF Real-Time ATP Rate Assay Kit was used and HEK293 WT, HEK293 UBXN7(−/−), as well as HEK293 MUL1(−/−) cells were plated as described above and ATP measurements were recorded followed by Oligomycin injection in port A (56 μl) at 1.5 μM final concentration, and Rotenone/Antimycin injection in port B (62 μl) at 0.5 μM final concentration. Data analysis was performed using Report Generators software for Real-Time ATP Rate Assay.
2.9. Glycolytic rate assay
For the Glycolytic rate assay Seahorse XF Glycolytic Rate Assay kit was used. Rotenone/Antimycin at 0.5 μM each was used in port A and the glycolysis inhibitor, 2-deoxy-D-glucose (2-DG), was subsequently injected in port B (62 μl) at a concentration of 50 μM. To asses glycolysis, three measurements were recorded after the addition of each compound. As a negative control, three wells with no cells were used both in the OCR and ECAR analysis. Data analysis was performed using Report Generators software for the Glycolytic Rate Assay.
2.10. Statistical analysis
All quantitative data are expressed as mean ± S.D. or ± SEM of three or four independent experiments. Following Western blot analysis, the optical densities of blot bands were determined using ImageJ software. Protein/β-actin ratios were obtained from the densitometry data, and the differences among groups were analyzed by one tailed Student’s t test. A value of p < 0.05 was considered significant. All Seahorse data were analyzed using Report Generators software that automatically calculates and reports the assay parameters of the Agilent Seahorse XFe24 (Agilent) specific for each assay (Cell Mito Stress, ATP rate and Glycolysis assay).
3. RESULTS
3.1. UBXN7 protein levels regulate NRF2 and HIF-1α transcription factors.
We have previously shown that MUL1 inactivation results in high levels of UBXN7 protein with concomitant accumulation and activation of HIF-1α transcription factor [14]. UBXN7 is part of the CRL2VHL complex that is responsible for HIF-1α ubiquitination and degradation [10]. In addition, UBXN7 is part of the CRL3KEAP1 complex which regulates NRF2 protein levels [11]. Figure 1A is a schematic diagram of the various proteins representing the CRL3KEAP1 and CRL2VHL ligase complexes. We used HEK293 MUL1(−/−) cells, which express high levels of UBXN7, and we also generated HEK293 UBXN7(−/−) cells using CRISPR-Cas9 as described in Methods. Figure 1B shows the protein level of NRF2 and HIF-1α in the presence or absence of MUL1 or UBXN7. HEK293 MUL1(−/−) cells have high levels of UBXN7 and HIF-1α but there is no detectable change in NRF2 level compared to HEK293 WT cells that remains very low. In contrast, HEK293 UBXN7(−/−) cells have a significant increase of NRF2 but lower levels of HIF-1α protein when compared to HEK293 WT cells (Figure 1C). These results suggest that UBXN7 protein levels, as regulated by MUL1, provide a reciprocal regulation in NRF2 and HIF-1α protein accumulation. To verify that the observed regulation of NRF2 and HIF-1α is at the post-translational level (that involves the CRL3KEAP1 and CRL2VHL complexes), the mRNA levels of NRF2 and HIF-1α in the different cell lines was monitored using qRT-PCR. Figure 1D shows no significant change is observed in the mRNA levels of NRF2 or HIF-1α in all three cell lines, suggesting that the main regulation is post-transcriptional and in accord with previous studies [11, 14].
3.2. The role of UBXN7 in the cellular response to oxidative stress.
HEK293 WT and HEK293 UBXN7(−/−) cells were treated with increasing concentrations of H2O2 to induce varying degrees of oxidative stress. The protein levels of NRF2, HIF-1α, UBXN7 and MUL1 were monitored by Western blot analysis. Furthermore, the oxidative stress sustained by the cells, under the various conditions, and the degree of apoptosis in the cell population was also investigated. HEK293 WT cells show a robust induction of NRF2 under low concentration of H2O2 that reaches a plateau at 100 μM. Under the same conditions, UBXN7 shows a progressive decrease with rising H2O2 concentration. In the absence of UBXN7 expression (HEK293 UBXN7(−/−) cells), NRF2 is high in control untreated cells and there is no modulation by H2O2 treatment (Figures 2A and 2B). There is little regulation of HIF-1α protein by H2O2 treatment in HEK293 WT cells; HIF-1α levels are lower in HEK293 UBXN7(−/−) cells and decrease further at higher H2O2 concentrations. In the absence of UBXN7, higher levels of reactive oxygen species (ROS) are seen when compared to HEK293 WT cells both under normal conditions (control) as well as following H2O2 treatment (Figure 2C). Additionally, HEK293 UBXN7(−/−) cells are more sensitive to oxidative stress-induced apoptosis (Figure 2D). These data suggest that the mechanism of activation of NRF2 after H2O2 stress is related to a dose-dependent decrease in UBXN7 protein levels. In the absence of UBXN7 protein, cells have more NRF2, under normal conditions, but the regulation of NRF2 by oxidative stress is lost. This situation leads to the production of higher amounts of ROS in HEK293 UBXN7(−/−) cells and they also experience more apoptosis following H2O2 treatment.
Figure 2. Regulation of NRF2 and HIF-1α during oxidative stress and the role of UBXN7.
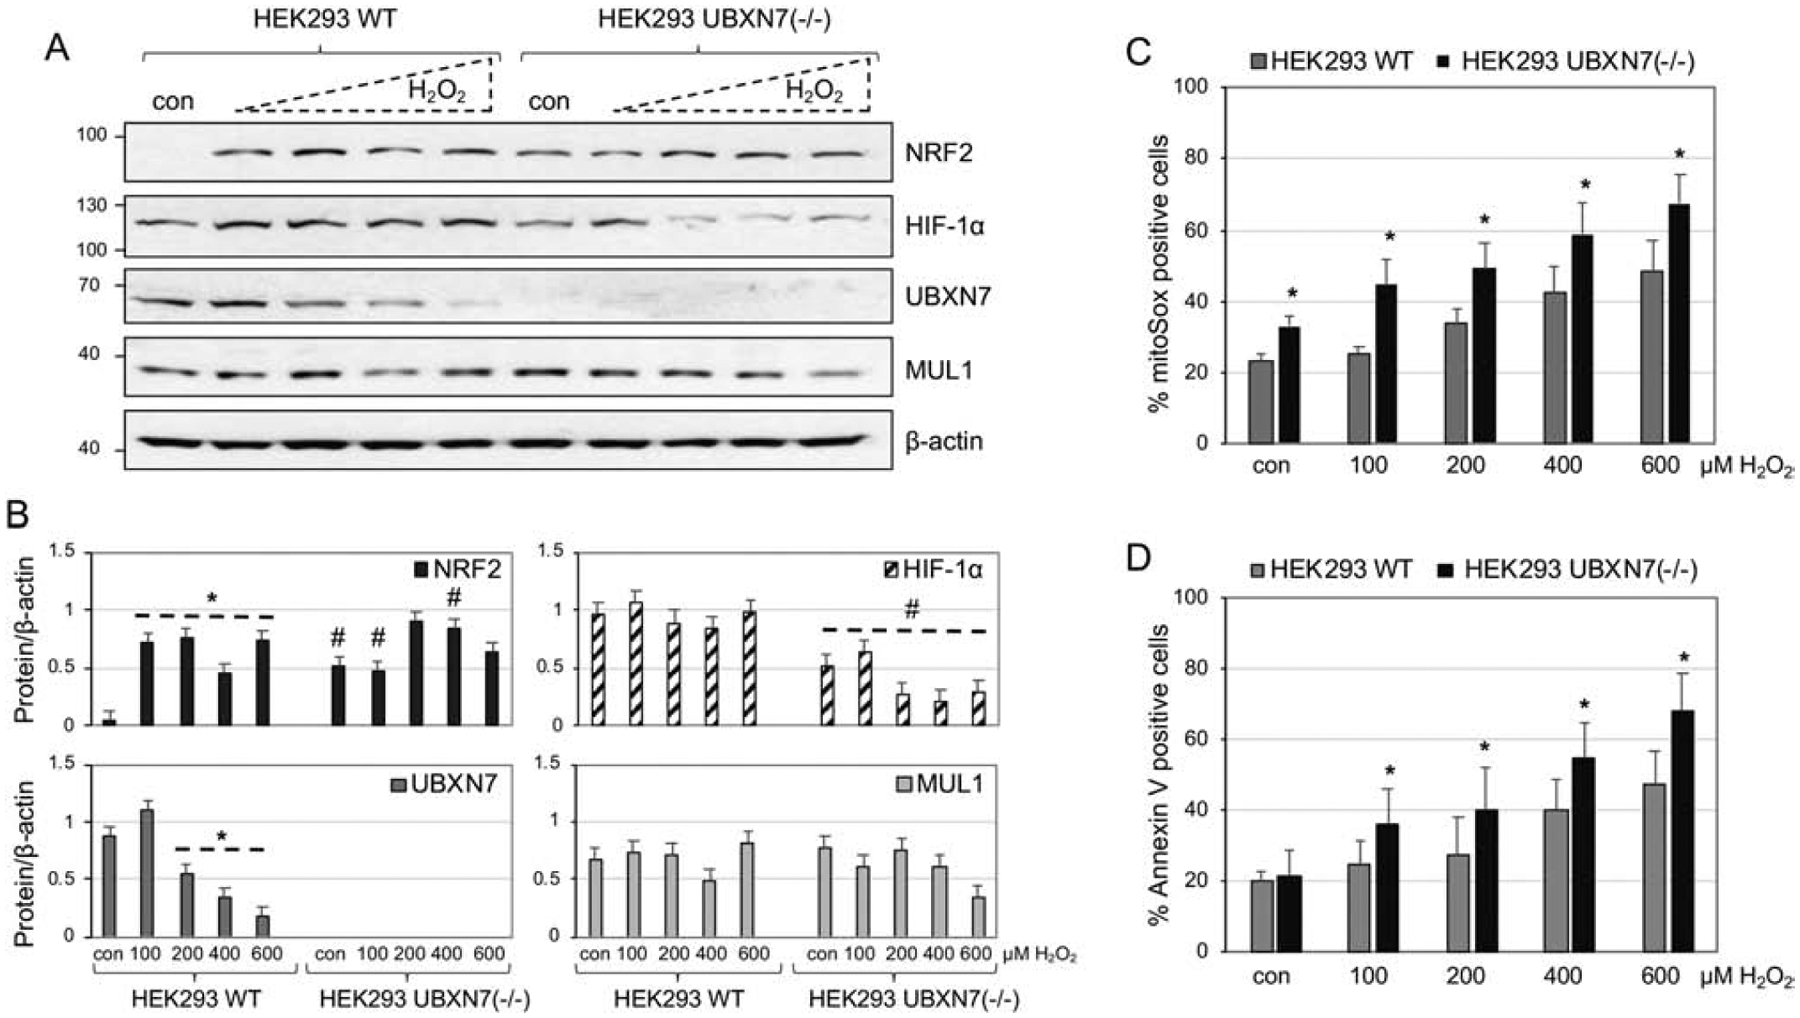
A. HEK293 WT and HEK293 UBXN7(−/−) cells were treated with increasing concentrations of H2O2 for 8 hours. Whole cell extracts were prepared and the expression of NRF2, HIF-1α UBXN7 and MUL1 protein was monitored by Western blot analysis. β-actin antibody was used to verify equal loading on each lane. B. Densitometric analysis of the protein expression of (A) normalized against β-actin. Results are shown as means ± S.D. of four independent experiments. *p<0.004 versus WT con; #p<0.03 versus con or the respective H2O2 treatments of HEK293 WT. C. The amount of ROS was monitored using MitoSOX and flow cytometry. Results shown as means ± S.D. of four independent experiments. *p<0.03 versus HEK293 WT con. D. The degree of apoptosis was measured using Annexin V staining and flow cytometry. Results shown as means ± S.D. of four independent experiments. *p<0.04 versus HEK293 WT control cells.
3.3. Absence of UBXN7 activates NRF2 without affecting the components of the CRL3KEAP1 complex.
In order to investigate if the higher level of NRF2 that is present in the HEK293 UBXN7(−/−) cells is functional, the subcellular localization of the protein was monitored. Nuclear and cytosolic fractions were prepared and the subcellular localization of NRF2 protein was monitored by Western blot analysis. In addition, oxidative stress was induced to some of the cells by treating them with H2O2. Figure 3A and 3B show that the absence of UBXN7, under normal conditions, causes substantial increase of NRF2 protein in both the cytoplasmic and nuclear fractions when compared to HEK293 WT cells. Oxidative stress induces NRF2 and increases its accumulation in the nuclear fraction in HEK293 WT cells, whereas the same conditions have no detectable effect on the HEK293 UBXN7(−/−) cells. While the absence of UBXN7 increases the basal level of NRF2 under normal conditions, the regulation of this protein by oxidative stress is lost. Activation of NRF2 in HEK293 UBXN7(−/−) cells was verified by monitoring the expression of two known transcriptional targets, heme oxygenase-1 (HO-1), an antioxidant and cytoprotective enzyme, and ubiquitin-binding protein p62, an autophagosome cargo protein [31, 32]. Figures 3C and 3D show a substantial increase in the expression of both, HO-1 and p62 proteins in HEK293 UBXN7(−/−) compared to HEK293 WT cells. This induction correlates with the increased NRF2 protein level and it is not affected by MG132, suggesting that the proteasome is not involved in their regulation. Furthermore, the protein levels of various components of the CRL3KEAP1 complex was monitored in the presence or absence of MG132. Figure 3C shows that there is no significant difference in the protein levels of the various CRL3KEAP1 complex components in the absence of UBXN7. Some of these proteins are also part of the CRL2VHL ubiquitin ligase complex as shown in Figure 1A.
Figure 3. Activation of NRF2 in HEK293 UBXN7 (−/−) cells and regulation of the various components of the CRL3KEAP1 complex.

A. Subcellular localization of NRF2 was monitored in the cytosolic and nuclear fractions of HEK293 WT and HEK293 UBXN7(−/−) cells. Tubulin and histone H3 antibodies were used to exclude cross-contamination between the cytosolic and nuclear fractions. B. Graph shows the protein levels of NRF2 in the cytosolic and nuclear fraction, normalized against tubulin or histone H3, respectively. Results shown as means ± S.D. of three independent experiments. *p<0.0004 versus WT fractions, #p<0.008 versus WT cytoplasmic fraction. C. Expression of NRF2, HO-1, p62, UBXN7, KEAP1, p97, CUL3, and RBX1 proteins in HEK293 WT and HEK293 UBXN7(−/−) cells in the presence or absence of MG132. β-actin antibody was used to verify equal loading on each lane. D. Densitometric analysis of NRF2, HO-1 and p62 protein expression from (C) normalized against β-actin. Results are shown as means ± S.D. of four independent experiments. *p<0.003 versus HEK293 WT cells.
3.4. UBXN7 regulation of NRF2 and HIF-1α proteins during hypoxia.
We investigated whether hypoxia, as the main activator of HIF-1α, also regulates NRF2 and the potential role of UBXN7 protein in this process. HEK293 WT and HEK293 UBXN7(−/−) cells were placed in a hypoxia chamber and exposed to 1% O2 and 5% CO2 for various time periods up to 18 hours, as previously described [14]. Whole cell extracts were prepared and the expression of NRF2, HO-1, HIF-1α, GLUT1 and UBXN7 was monitored by Western blot analysis. Figure 4A shows that in HEK293 WT cells there is an increase in HIF-1α during the first 6 hours of hypoxia but is gradually reduced at 9, 12, and 18 hours. NRF2 protein levels remain very low during the first 6 hours of hypoxia but increase at 9, 12, and 18 hour time points (Figures 4A and 4B). UBXN7 mirrors the expression levels of HIF-1α protein throughout hypoxia and inversely correlates with the NRF2 protein levels (Figure 4A). HEK293 UBXN7(−/−) cells have a higher basal level of NRF2 compared to HEK293 WT that remains elevated throughout hypoxia (Figure 4A, and 4B). HIF-1α protein level in HEK293 UBXN7(−/−) is lower than in HEK293 WT cells and remains the same during hypoxia (Figure 4A, and 4C). To further verify that the regulation of NRF2 and HIF-1α proteins under these conditions is functional we monitored the expression of two specific target genes: the HO-1 target of NRF2 and the GLUT1 target of HIF-1α [31, 33]. HO-1 expression closely reflects the expression of NRF2 both in the HEK293 WT as well as in HEK293 UBXN7(−/−) cells during hypoxia (Figure 4A, and 4B). In HEK293 WT cells there is a delayed response in the activation of GLUT1 protein following HIF-1α induction by hypoxia and in HEK293 UBXN7(−/−) GLUT1 expression is barely detectable throughout hypoxia (Figure 4A, and 4C).
Figure 4. UBXN7 regulation of NRF2 and HIF-1α during hypoxia.

A. Whole cell lysates were prepared from HEK293 WT and HEK293 UBXN7(−/−) cells under hypoxia for various time periods and the expression of NRF2, HIF-1α UBXN7, HO-1, and GLUT1 proteins was monitored by Western blot analysis. B. Densitometric analysis of NRF2 and HO-1 protein expression from (A) normalized against β-actin. Results shown as means ± S.D. of three independent experiments. *p<0.03 versus control, ns: not significant. C. Densitometric analysis of HIF-1α and GLUT1 protein expression from (A) normalized against β-actin. Results shown as means ± S.D. of three independent experiments. *p<0.04 versus control, ns: not significant.
There is some small variability in the expression of both NRF2 and HIF-1α proteins in HEK293 UBXN7(−/−) during hypoxia but it is not statistically significant (Figure 4B, and 4C). This is clearly reflected in the expression of their target proteins HO-1 and GLUT1 (Figure 4B, and 4C). The results of these experiments suggest that the UBXN7 cofactor protein is very important in the physiological expression pattern of both NRF2 and HIF-1α during hypoxia as well as in the proposed reciprocal regulation of these two proteins.
3.5. UBXN7 affects the DMF-induced activation of NRF2.
We further investigated whether the function of CRL3KEAP1 and CRL2VHL complexes is solely affected by the UBXN7 protein level. HEK293 WT and HEK293 UBXN7(−/−) cells were treated with increasing concentrations dimethyl fumarate (DMF), the methyl ester of fumaric acid. DMF is a known activator of NRF2 that modifies KEAP1’s cysteine residues and inhibits its function [34, 35]. Figures 5A and 5B show a robust increase in the NRF2 protein level with increasing concentration of DMF in HEK293 WT cells. The same treatment did not affect the expression of HIF-1α, UBXN7, MUL1, or KEAP1 proteins. Basal level of NRF2 in HEK293 UBXN7(−/−) cells is higher than in HEK293 WT cells. DMF treatment increases the NRF2 protein level in both HEK293 UBXN7(−/−) and HEK293 WT cells in a similar manner. The level of HIF-1α in absence of UBXN7 is lower compared to HEK293 WT cells and it is not regulated by DMF; while MUL1 and KEAP1 protein levels remain unchanged in both HEK293 WT and HEK293 UBXN7(−/−). We also used HEK293 MUL1(−/−) cells that express high levels of UBXN7 and HIF-1α. Figures 5C and 5D show that the absence of MUL1 protein leads to a dramatic suppression of NRF2 and its induction by DMF treatment. The HIF-1α protein level slightly deceases with DMF treatment, especially at the high concentration of 80 μM. UBXN7 and KEAP1 protein levels remain unchanged in both HEK293 WT and HEK293 MUL1(−/−). These results strongly suggest that high levels of UBXN7 protein suppress the activation of NRF2 by DMF. We also used a different NRF2 activator, the tert-butylhydroquinone (TBHQ) in similar experiments. These results also closely follow the ones obtained with DMF (results not shown).
Figure 5.
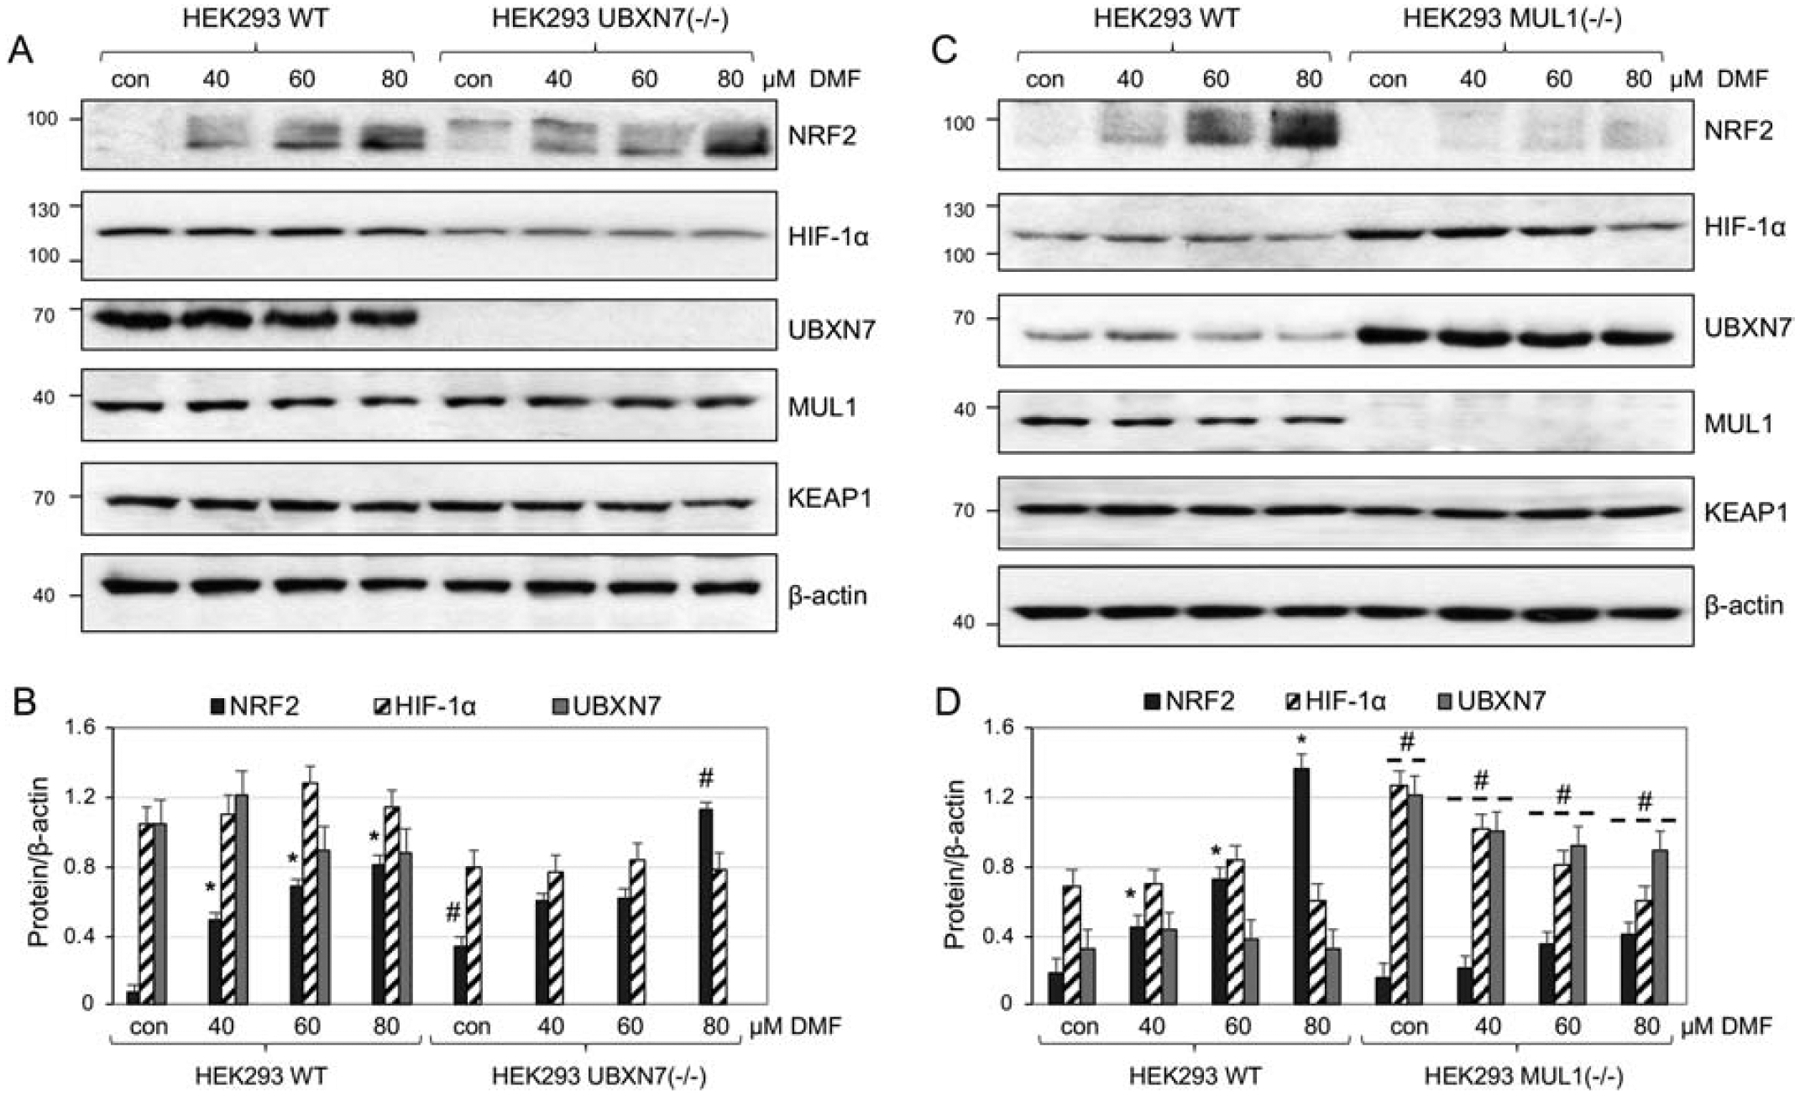
NRF2 activation by DMF and the role of UBXN7 A. Expression of NRF2, HIF-1α, UBXN7, MUL1, and KEAP1 protein in HEK293 WT, and HEK293 UBXN7(−/−) cells treated with DMF. β-actin antibody was used to verify equal loading on each lane. B. Densitometric analysis of the protein expression from (A) normalized against β-actin. Results are shown as means ± S.D. of three independent experiments. *p<0.003 versus HEK293 WT con; #p<0.002 versus con or the respective DMF treatments of HEK293 WT. C. Western blot analysis of the NRF2, HIF-1α, UBXN7, MUL1, and KEAP1 protein expression in HEK293 WT, and HEK293 MUL1(−/−) cells treated with increasing concentration of DMF for 8 hours. β-actin antibody was used to verify equal loading on each lane. D. Densitometric analysis of the protein expression from (C) normalized against β-actin. Results are shown as means ± S.D. of three independent experiments. *p<0.004 versus HEK293 WT con; #p<0.009 versus con or the respective DMF treatments of HEK293 WT.
3.6. Role of UBXN7 in the activation of NRF2 by sodium arsenite.
Sodium arsenite (NaAsO2) is known to cause robust activation of NRF2 by inhibiting the CUL3-RBX1 interaction, as well as impairing the NRF2 degradation by autophagy [36, 37]. Additionally, sodium arsenite can activate HIF-1α via a transcriptional mechanism [38]. We investigated the potential involvement of UBXN7 protein in the process of NRF2 and HIF-1α activation by sodium arsenite. HEK293 WT, HEK293 UBXN7(−/−), and HEK293 MUL1(−/−) cells were treated with different concentrations of sodium arsenite and the expression of NRF2, HIF-1α, UBXN7 and MUL1 proteins were monitored by Western blot analysis. Figures 6A and 6B show that in HEK293 WT and HEK293 UBXN7(−/−) cells, sodium arsenite treatment at 10 or 20 μM causes a significant induction of NRF2 protein that is not observed at a higher (80 μM) concentration. The same conditions failed to show any regulation of HIF-1α in HEK293 WT and HEK293 UBXN7(−/−) cells. There was also a gradual increase in the level of MUL1 protein with increasing concentrations of sodium arsenite and a corresponding decrease of UBXN7 in HEK293 WT cells. This is in accordance with our previous studies that established UBXN7 as a substrate of MUL1 E3 ubiquitin ligase [14]. HEK293 MUL1(−/−) cells show little induction of NRF2 by sodium arsenite, while HIF-1α and UBXN7 protein levels, although higher compared to the HEK293 WT cells, decrease with increasing concentrations of the drug. Figure 6C is a graphical representation of the corresponding NRF2 and HIF-1α trends in protein levels in the three cell lines treated with various concentration of sodium arsenite. These results suggest the regulation of NRF2 by sodium arsenite requires the presence of a sufficient amount of UBXN7 protein. In addition, sodium arsenite treatment modulates the level of MUL1 and UBXN7 proteins. Furthermore, we monitored reactive oxygen species (ROS) production using MitoSOX in the three cell populations treated with sodium arsenite (Figure 6D). There is no difference in MitoSOX positive cells between HEK293 WT and HEK293 UBXN7(−/−) cells, which express robust levels of NRF2. HEK293 MUL1(−/−), which show minimal induction of NRF2, have significant highest ROS production.
Figure 6. NRF2 activation by NaAsO2 is affected by the UBXN7 protein level.

A. HEK293 WT, HEK293 UBXN7(−/−), and HEK293 MUL1(−/−) cells were treated with increasing concentration of NaAsO2 for 4 hours. The expression of NRF2, HIF-1α UBXN7 and MUL1 proteins was monitored in whole cell extracts by Western blot analysis. β-actin antibody was used to verify equal loading on each lane. B. Densitometric analysis of protein expression from (A) normalized against β-actin. Results are shown as means ± S.D. of three independent experiments. *p<0.008 versus HEK293 WT con; #p<0.006 versus con or the respective NaAsO2 treatments of HEK293 WT cells.
C. Line graph representing the trend of NRF2 and HIF-1α protein level following NaAsO2 treatment from (A). D. The amount of ROS was measured using MitoSOX and flow cytometry. Results shown as means ± S.D. of three independent experiments. *p<0.01 versus HEK293 WT con.
3.7. UBXN7 protein levels drive mitochondrial respiration, ATP production, and determine the metabolic state.
The mitochondrial respiration assay was performed on the three HEK293 cell lines using the Seahorse XFe24 analyzer. Figure 7A is a trace of the oxygen consumption rate (OCR) of HEK293 WT, HEK293 UBXN7(−/−), and HEK293 MUL1(−/−) cells treated with the specific inhibitors (oligomycin, FCCP and Rot/AA). Quantification of the results shows a significant increase in the basal and maximal respiration, as well as ATP production in HEK293 UBXN7(−/−) compared to HEK293 WT cells, whereas the values for the HEK293 MUL1(−/−) are significantly lower than that of the HEK293 WT cells (Figure 7B).
Figure 7. Mitochondrial respiration, ATP, and glycolysis rates in HEK293 MUL1(−/−) and HEK293 UBXN7(−/−) cells.

A. Mitochondrial respiration in HEK293 WT, HEK293 UBXN7(−/−) and HEK293 MUL1(−/−) cells was monitored using the Mitochondrial Stress Test. Oxygen consumption rate (OCR) was measured using the Seahorse XFe24 Extracellular Flux Analyzer. Trace shows representative data from one of three experiments. Results are expressed as mean ±SEM. *p<0.01, # p<0.01 versus HEK293 WT. B. Quantification of the mitochondrial respiration data for basal respiration, maximal respiration, ATP production and spare respiratory capacity obtained from three independent experiments. *p<0.01, # p<0.01 versus HEK293 WT. C. The ATP production rate in HEK293 WT, HEK293 UBXN7(−/−), and HEK293 MUL1(−/−) cells was measured using the real-time ATP Rate Assay. Mitochondrial and glycolytic ATP production was also determined. Data from three separate experiments are presented as means ±SEM. *p<0.05 versus HEK293 WT mitoATP, #p<0.05 versus HEK293 WT glycoATP. D. The Glycolytic Rate Assay was used to measure glycolysis as well as compensatory glycolysis of HEK293 WT, HEK293 UBXN7(−/−), and HEK293 MUL1(−/−) cells. The Glycolytic Proton Efflux Rate (glycoPER) was converted from OCR and ECAR data through Seahorse XFe24 Glycolytic Rate Assay Report. Data from three separate experiments are presented as means ±SEM. *p<0.04 versus HEK293 WT.
The ATP Rate assay was used to monitor mitochondrial respiration and glycolysis as previously described [14]. Mitochondrial ATP (Mito-ATP) production is higher in HEK293 UBXN7(−/−) and HEK293 WT cells in comparison to HEK293 MUL1(−/−). ATP produced by glycolysis (Glyco-ATP) is lower in HEK293 UBXN7(−/−) and HEK293 WT in comparison to HEK293 MUL1(−/−), which is higher, indicating a shift from OXPHOS to glycolysis (Figure 7C). Figure 7D shows the Glycolytic Proton Efflux Rate (glycoPER) results converted from OCR and extracellular acidification rate (ECAR) data. There is no change in basal glycolysis rate in HEK293 UBXN7(−/−) compared to HEK293 WT cells. In contrast, the basal and compensatory glycolysis are significantly higher in HEK293 MUL1(−/−) compared to HEK293 WT cells in accordance with previous studies [14]. All these data suggest that inactivation of UBXN7 causes increased OXPHOS whereas accumulation of UBXN7 protein, as seen in the HEK293 MUL1(−/−), leads to glycolysis.
4. DISCUSSION
NRF2 and HIF-1α are distinct stress surveillance factors and master regulators of transcription. NRF2 is activated in response to oxidative stress whereas HIF-1α is activated through hypoxia. Both transcription factors, under normal conditions, are continuously synthesized and degraded to allow for their rapid recruitment in response to changing conditions [6, 7]. The primary mechanism of NRF2 and HIF-1α regulation depends on the activity of CRL3KEAP1 and CRL2VHL complexes, respectively. These complexes are strikingly similar and share a number of common subunits. In addition, both complexes are designed to specifically ubiquitinate their substrate (NRF2 or HIF-1α) which are then targeted for proteasomal degradation [8, 9, 39]. The relationship between CRL3KEAP1 and CRL2VHL complexes suggests that NRF2 and HIF-1α may be regulated in a coordinated manner under conditions of oxidative stress or hypoxia [40, 41]. The coordinated regulation of CRL3KEAP1 and CRL2VHL complexes may be initiated in the mitochondria since mitochondria are the main source of ROS as well as sensors of O2 [42]. Our studies have uncovered such a mechanism that involves UBXN7 and its regulation by mitochondrial MUL1 E3 ubiquitin ligase [14]. MUL1 is anchored on the outer mitochondrial membrane (OMM) and conveys mitochondrial stress through specific ubiquitination of cytoplasmic or mitochondrial associated substrates [16, 17, 43]. In addition, MUL1 protein levels are regulated through the action of mitochondrial serine protease Omi/HtrA2 [44]. Omi/HtrA2 is a protease present in the mitochondrial intermembrane space (IMS) and is involved in protein quality control [45–47]. UBXN7 cofactor has a unique function and acts as a scaffold for both CRL3KEAP1 and CRL2VHL complexes [8, 9, 11, 48]. Our previous studies have shown that inactivation of MUL1 leads to accumulation of UBXN7 with a concomitant increase in HIF-1α protein levels and activity [14]. Under the same conditions, the basal protein level of NRF2 remains unchanged. Here, we show that inactivation of UBXN7 leads to downregulation of HIF-1α and a significant accumulation of NRF2 protein. We investigated this phenomenon under conditions of oxidative stress using HEK293 WT as well as HEK293 UBXN7(−/−) cells. In wild type HEK293 cells there is an inverse correlation between the protein levels of UBXN7 and NRF2 over a wide range of H2O2 treatments. In the absence of UBXN7 protein, cells have higher levels of NRF2 under normal conditions but their regulation by H2O2 is lost. As expected, HIF-1α protein levels are low in the absence of UBXN7. The build-up of NRF2 protein in absence of UBXN7 is functional and leads to increased accumulation of NRF2 protein in the nucleus with concomitant activation of its targets HO-1 and p62. We investigated how this cross-talk between the two complexes is affected by UBXN7 during conditions of hypoxia. Previous studies have suggested that although HIF-1α is predominantly induced by hypoxia, NRF2 can also be co-induced under the same conditions [49]. In addition, sustained hypoxia is known to lead to the production of ROS, since the shutdown of mitochondrial electron transport chain causes incomplete reduction of oxygen and the formation of oxygen radicals [50]. HEK293 WT cells show the characteristic induction of HIF-1α protein levels following 3–9 hours of hypoxia which then decrease after 12 and 18 hours. In our experiments we detect upregulation of NRF2 at later times (after 12 and 18 hours) in cells undergoing hypoxia, suggesting that NRF2 activation is a late event in this process, and occurs when HIF-1α level has faded to a minimum. Under the same conditions, UBXN7 protein levels are also regulated by hypoxia and mirror those of HIF-1α. In hypoxic HEK293 UBXN7(−/−) cells, NRF2 is expressed at higher levels than in control cells, but its regulation under these conditions is lost. Moreover, the high levels of NRF2 prevent the activation and the regulation of HIF-1α in HEK293 UBXN7(−/−). The modulation of NRF2 and HIF-1α proteins during hypoxia is functional and it is reflected in the expression of HO-1 and GLUT1 target genes. To further explore how different levels of UBXN7 affect the normal function of the CRL3KEAP1 complex, we treated the three different cell lines with DMF, a known activator of NRF2 [35]. DMF was able to activate NRF2 in HEK293 UBXN7(−/−) cells but in HEK293 MUL1(−/−) cells, which overexpress UBXN7, the drug had no effect on the expression of NRF2. This is an important finding since DMF has been shown in preclinical studies to have great potential for treating numerous types of human cancer [51]. In addition, DMF is approved for the treatment of relapsing-remitting multiple sclerosis (RRMS) and it is currently in clinical trials for treatment of systemic sclerosis (SS) [52]. We expanded our studies and tested the effect of UBXN7 protein levels on sodium arsenite (NaAsO2)-induced activation of NRF2. Sodium arsenite treatment is an approved and standard therapy for patients with acute promyelocytic leukemia (APL) [53]. The absence of UBXN7 did not affect the robust induction of NRF2 seen after sodium arsenite treatment but it broadens the response of the cells to different drug concentration. Here once again, the HEK293 MUL1(−/−) cells, with robust level of UBXN7 protein, show little induction of NRF2 after sodium arsenite treatment. In all these experiments there was a reverse correlation between the NRF2 and HIF-1α protein levels. Our data suggest that monitoring UBXN7 protein levels in tumors before treatment with DMF or sodium arsenite can be useful, since it can predict the effectiveness of the treatment. In addition, several other drugs used in cancer treatment modulate the HIF-1α levels by targeting components of the CRL2VHL complex [54]. The success of these treatments could also be affected by the UBXN7 protein level in the tumors. UBXN7 protein levels vary in different human tumors (Cilenti et al, unpublished data) and it is overexpressed in squamous cell carcinoma (SCC) of the lung due to a chromosomal 3q26–29 amplification that occurs in up to 70% of lung SCCs [55]. The UBXN7 gene is located within this chromosomal region and its amplification leads to high levels of UBXN7 protein in these tumors [12, 55, 56]. The physiological regulation of NRF2 and HIF-1α by the MUL1/UBXN7 axis could be bypassed by mutations targeting the VHL subunit that affect the CRL2VHL complex or mutations in KEAP1 protein that disturb the CRL3KEAP1 complex. Such mutations have been detected in several cancer studies [9, 57, 58]. In addition, NRF2 and HIF-1α can be directly regulated by non-canonical mechanisms such as phosphorylation, complex-independent degradation, or other posttranslational modifications apart from ubiquitination [59–63]. Our previous studies have shown that UBXN7 accumulation leads to activation of HIF-1α and favors glycolysis [14]. We investigated if the absence of UBXN7 that favors the accumulation and activation of NRF2 has a different effect on the metabolic cell state. Our data show that inactivation of UBXN7 leads to a significant increase in OXPHOS over glycolysis. Therefore, UBXN7 protein levels can modulate the metabolic state of the cells with high levels leading to glycolysis and low levels to increased OXPHOS. The aerobic glycolysis induced by high UBXN7 and HIF-1α protein levels is reminiscent to the Warburg effect, a hallmark of numerous cancers [64, 65].
In summary, we have uncovered a mitochondrial pathway that involves UBXN7 and its regulation by MUL1 ligase (Figure 8). This pathway affects the CRL3KEAP1 and CRL2VHL function and provides an inverse regulation of NRF2 and HIF-1α protein levels. Of course, we cannot exclude the possibility that other as yet unidentified proteins are also involved and contribute to this new pathway. The mechanism of this regulation remains speculative but could involve the interaction of UBXN7 scaffold with core components in the assembly of the two ligase complexes. The absence of UBXN7 cofactor/scaffold protein could potentially lead to the collapse and inactivation of the CRL3KEAP1 ligase complex resulting in the accumulation of NRF2. It is more difficult to understand how high levels of UBXN7 protein inhibits the function of CRLVHL complex that regulates HIF-1α. It is possible that high levels of the UBXN7 protein, without a concomitant increase of the other core components, might lead to the partial assembly of multiple CRL2VHL complexes that are inactive and unable to function properly to regulate HIF-1α. The biological significance of the inverse regulation of NRF2 and HIF-1α protein as well as their coordinated signaling during oxidative stress or hypoxia is unclear. Coordinated signaling of NRF2 and HIF-1α has been found in induced pluripotent stem cells (iPSC) reprogramming where ROS activates NRF2 which later promotes HIF-1α activation and a metabolic shift to glycolysis [66, 67]. Dysregulation of MUL1-UBXN7 axis can lead to a maladaptive response to mitochondrial stress, metabolic reprogramming, and potentially play a role in the development and/or progression of human cancer.
Figure 8. Schematic diagram of a proposed pathway that provides a reciprocal regulation of NRF2 and HIF-1α proteins.

Reactive oxygen species (ROS) actives MUL1 ubiquitin ligase which in turn ubiquitinates UBXN7 protein and targets it for degradation. UBXN7 downregulation leads to activation of NRF2 and a decrease in HIF-1α levels. This is accompanied by the activation of the oxidative response and raise in OXPHOS. MUL1 inactivation, or downregulation during hypoxia, leads to accumulation of the UBXN7 protein. This is followed by the activation of HIF-1α without affecting the NRF2 protein, followed by the initiation of the hypoxic response and the switch of the metabolism to glycolysis.
Highlights.
CRL3KEAP1 and CRL2VHL ubiquitin ligase complexes provide a reciprocal regulation of NRF2 and HIF-1α proteins.
UBXN7 cofactor protein level regulates the activity of CRL3KEAP1 and CRL2VHL complexes.
NRF2 and HIF-1α protein regulation by oxidative stress or hypoxia is mediated by UBXN7.
The reciprocal regulation of NRF2 and HIF-1α proteins by UBXN7 is associated with distinct metabolic states.
ACKNOWLEDGEMENTS
We thank the members of the Zervos’ laboratory for comments and suggestions. We are grateful to Dr. Janos Steffen and Dr. Carla Koehler (Department of Biological Chemistry, David Geffen School of Medicine, Los Angeles, CA) for the HEK293 MUL1(−/−) cells.
This study was supported by the NIH RO1HL132511 grant (to A.S.Z. and R.L.).
Footnotes
Publisher's Disclaimer: This is a PDF file of an unedited manuscript that has been accepted for publication. As a service to our customers we are providing this early version of the manuscript. The manuscript will undergo copyediting, typesetting, and review of the resulting proof before it is published in its final form. Please note that during the production process errors may be discovered which could affect the content, and all legal disclaimers that apply to the journal pertain.
Declaration of interests
The authors declare that they have no known competing financial interests or personal relationships that could have appeared to influence the work reported in this paper.
All authors have reviewed the final manuscript.
REFERENCES
- [1].Majmundar AJ, Wong WJ, Simon MC, Hypoxia-inducible factors and the response to hypoxic stress, Mol Cell 40(2) (2010) 294–309. [DOI] [PMC free article] [PubMed] [Google Scholar]
- [2].Tebay LE, Robertson H, Durant ST, Vitale SR, Penning TM, Dinkova-Kostova AT, Hayes JD, Mechanisms of activation of the transcription factor Nrf2 by redox stressors, nutrient cues, and energy status and the pathways through which it attenuates degenerative disease, Free Radic Biol Med 88(Pt B) (2015) 108–146. [DOI] [PMC free article] [PubMed] [Google Scholar]
- [3].Toth RK, Warfel NA, Strange Bedfellows: Nuclear Factor, Erythroid 2-Like 2 (Nrf2) and Hypoxia-Inducible Factor 1 (HIF-1) in Tumor Hypoxia, Antioxidants (Basel) 6(2) (2017). [DOI] [PMC free article] [PubMed] [Google Scholar]
- [4].Dengler VL, Galbraith M, Espinosa JM, Transcriptional regulation by hypoxia inducible factors, Crit Rev Biochem Mol Biol 49(1) (2014) 1–15. [DOI] [PMC free article] [PubMed] [Google Scholar]
- [5].Tonelli C, Chio IIC, Tuveson DA, Transcriptional Regulation by Nrf2, Antioxid Redox Signal 29(17) (2018) 1727–1745. [DOI] [PMC free article] [PubMed] [Google Scholar]
- [6].Li R, Jia Z, Zhu H, Regulation of Nrf2 Signaling, React Oxyg Species (Apex) 8(24) (2019) 312–322. [PMC free article] [PubMed] [Google Scholar]
- [7].Bedessem B, Stephanou A, Role of compartmentalization on HiF-1alpha degradation dynamics during changing oxygen conditions: a computational approach, PLoS One 9(10) (2014) e110495. [DOI] [PMC free article] [PubMed] [Google Scholar]
- [8].Canning P, Sorrell FJ, Bullock AN, Structural basis of Keap1 interactions with Nrf2, Free Radic Biol Med 88(Pt B) (2015) 101–107. [DOI] [PMC free article] [PubMed] [Google Scholar]
- [9].Cardote TAF, Gadd MS, Ciulli A, Crystal Structure of the Cul2-Rbx1-EloBC-VHL Ubiquitin Ligase Complex, Structure 25(6) (2017) 901–911 e3. [DOI] [PMC free article] [PubMed] [Google Scholar]
- [10].Bandau S, Knebel A, Gage ZO, Wood NT, Alexandru G, UBXN7 docks on neddylated cullin complexes using its UIM motif and causes HIF1alpha accumulation, BMC Biol 10 (2012) 36. [DOI] [PMC free article] [PubMed] [Google Scholar]
- [11].Tao S, Liu P, Luo G, Rojo de la Vega M, Chen H, Wu T, Tillotson J, Chapman E, Zhang DD, p97 Negatively Regulates NRF2 by Extracting Ubiquitylated NRF2 from the KEAP1-CUL3 E3 Complex, Mol Cell Biol 37(8) (2017). [DOI] [PMC free article] [PubMed] [Google Scholar]
- [12].Rezvani K, UBXD Proteins: A Family of Proteins with Diverse Functions in Cancer, Int J Mol Sci 17(10) (2016). [DOI] [PMC free article] [PubMed] [Google Scholar]
- [13].Alexandru G, Graumann J, Smith GT, Kolawa NJ, Fang R, Deshaies RJ, UBXD7 binds multiple ubiquitin ligases and implicates p97 in HIF1alpha turnover, Cell 134(5) (2008) 804–16. [DOI] [PMC free article] [PubMed] [Google Scholar]
- [14].Cilenti L, Di Gregorio J, Ambivero CT, Andl T, Liao R, Zervos AS, Mitochondrial MUL1 E3 ubiquitin ligase regulates Hypoxia Inducible Factor (HIF-1alpha) and metabolic reprogramming by modulating the UBXN7 cofactor protein, Sci Rep 10(1) (2020) 1609. [DOI] [PMC free article] [PubMed] [Google Scholar]
- [15].Peng J, Ren KD, Yang J, Luo XJ, Mitochondrial E3 ubiquitin ligase 1: A key enzyme in regulation of mitochondrial dynamics and functions, Mitochondrion 28 (2016) 49–53. [DOI] [PubMed] [Google Scholar]
- [16].Li W, Bengtson MH, Ulbrich A, Matsuda A, Reddy VA, Orth A, Chanda SK, Batalov S, Joazeiro CA, Genome-wide and functional annotation of human E3 ubiquitin ligases identifies MULAN, a mitochondrial E3 that regulates the organelle’s dynamics and signaling, PloS one 3(1) (2008) e1487. [DOI] [PMC free article] [PubMed] [Google Scholar]
- [17].Zhang B, Huang J, Li HL, Liu T, Wang YY, Waterman P, Mao AP, Xu LG, Zhai Z, Liu D, Marrack P, Shu HB, GIDE is a mitochondrial E3 ubiquitin ligase that induces apoptosis and slows growth, Cell research 18(9) (2008) 900–10. [DOI] [PMC free article] [PubMed] [Google Scholar]
- [18].Braschi E, Zunino R, McBride HM, MAPL is a new mitochondrial SUMO E3 ligase that regulates mitochondrial fission, EMBO reports 10(7) (2009) 748–54. [DOI] [PMC free article] [PubMed] [Google Scholar]
- [19].Prudent J, Zunino R, Sugiura A, Mattie S, Shore GC, McBride HM, MAPL SUMOylation of Drp1 Stabilizes an ER/Mitochondrial Platform Required for Cell Death, Mol Cell 59(6) (2015) 941–55. [DOI] [PubMed] [Google Scholar]
- [20].Jenkins K, Khoo JJ, Sadler A, Piganis R, Wang D, Borg NA, Hjerrild K, Gould J, Thomas BJ, Nagley P, Hertzog PJ, Mansell A, Mitochondrially localised MUL1 is a novel modulator of antiviral signaling, Immunology and cell biology 91(4) (2013) 321–30. [DOI] [PubMed] [Google Scholar]
- [21].Kim SY, Kim HJ, Byeon HK, Kim DH, Kim CH, FOXO3 induces ubiquitylation of AKT through MUL1 regulation, Oncotarget 8(66) (2017) 110474–110489. [DOI] [PMC free article] [PubMed] [Google Scholar]
- [22].Kim SY, Kim HJ, Kim HJ, Kim DH, Han JH, Byeon HK, Lee K, Kim CH, HSPA5 negatively regulates lysosomal activity through ubiquitination of MUL1 in head and neck cancer, Autophagy 14(3) (2018) 385–403. [DOI] [PMC free article] [PubMed] [Google Scholar]
- [23].Yun J, Puri R, Yang H, Lizzio MA, Wu C, Sheng ZH, Guo M, MUL1 acts in parallel to the PINK1/parkin pathway in regulating mitofusin and compensates for loss of PINK1/parkin, Elife 3 (2014) e01958. [DOI] [PMC free article] [PubMed] [Google Scholar]
- [24].Jung JH, Bae S, Lee JY, Woo SR, Cha HJ, Yoon Y, Suh KS, Lee SJ, Park IC, Jin YW, Lee KH, An S, Lee JH, E3 ubiquitin ligase Hades negatively regulates the exonuclear function of p53, Cell death and differentiation 18(12) (2011) 1865–75. [DOI] [PMC free article] [PubMed] [Google Scholar]
- [25].Ran FA, Hsu PD, Wright J, Agarwala V, Scott DA, Zhang F, Genome engineering using the CRISPR-Cas9 system, Nat Protoc 8(11) (2013) 2281–2308. [DOI] [PMC free article] [PubMed] [Google Scholar]
- [26].Steffen J, Vashisht AA, Wan J, Jen JC, Claypool SM, Wohlschlegel JA, Koehler CM, Rapid degradation of mutant SLC25A46 by the ubiquitin-proteasome system results in MFN1/2-mediated hyperfusion of mitochondria, Mol Biol Cell 28(5) (2017) 600–612. [DOI] [PMC free article] [PubMed] [Google Scholar]
- [27].Mukhopadhyay P, Rajesh M, Hasko G, Hawkins BJ, Madesh M, Pacher P, Simultaneous detection of apoptosis and mitochondrial superoxide production in live cells by flow cytometry and confocal microscopy, Nat Protoc 2(9) (2007) 2295–301. [DOI] [PMC free article] [PubMed] [Google Scholar]
- [28].Kauffman ME, Kauffman MK, Traore K, Zhu H, Trush MA, Jia Z, Li YR, MitoSOX-Based Flow Cytometry for Detecting Mitochondrial ROS, React Oxyg Species (Apex) 2(5) (2016) 361–370. [DOI] [PMC free article] [PubMed] [Google Scholar]
- [29].Cilenti L, Soundarapandian MM, Kyriazis GA, Stratico V, Singh S, Gupta S, Bonventre JV, Alnemri ES, Zervos AS, Regulation of HAX-1 anti-apoptotic protein by Omi/HtrA2 protease during cell death, The Journal of biological chemistry 279(48) (2004) 50295–301. [DOI] [PubMed] [Google Scholar]
- [30].Cilenti L, Kyriazis GA, Soundarapandian MM, Stratico V, Yerkes A, Park KM, Sheridan AM, Alnemri ES, Bonventre JV, Zervos AS, Omi/HtrA2 protease mediates cisplatin-induced cell death in renal cells, American journal of physiology. Renal physiology 288(2) (2005) F371–9. [DOI] [PubMed] [Google Scholar]
- [31].Surh YJ, Kundu JK, Li MH, Na HK, Cha YN, Role of Nrf2-mediated heme oxygenase-1 upregulation in adaptive survival response to nitrosative stress, Arch Pharm Res 32(8) (2009) 1163–76. [DOI] [PubMed] [Google Scholar]
- [32].Hayashi K, Dan K, Goto F, Tshuchihashi N, Nomura Y, Fujioka M, Kanzaki S, Ogawa K, The autophagy pathway maintained signaling crosstalk with the Keap1-Nrf2 system through p62 in auditory cells under oxidative stress, Cell Signal 27(2) (2015) 382–93. [DOI] [PubMed] [Google Scholar]
- [33].Hayashi M, Sakata M, Takeda T, Yamamoto T, Okamoto Y, Sawada K, Kimura A, Minekawa R, Tahara M, Tasaka K, Murata Y, Induction of glucose transporter 1 expression through hypoxia-inducible factor 1alpha under hypoxic conditions in trophoblast-derived cells, J Endocrinol 183(1) (2004) 145–54. [DOI] [PubMed] [Google Scholar]
- [34].Robledinos-Anton N, Fernandez-Gines R, Manda G, Cuadrado A, Activators and Inhibitors of NRF2: A Review of Their Potential for Clinical Development, Oxid Med Cell Longev 2019 (2019) 9372182. [DOI] [PMC free article] [PubMed] [Google Scholar]
- [35].Ahuja M, Ammal Kaidery N, Yang L, Calingasan N, Smirnova N, Gaisin A, Gaisina IN, Gazaryan I, Hushpulian DM, Kaddour-Djebbar I, Bollag WB, Morgan JC, Ratan RR, Starkov AA, Beal MF, Thomas B, Distinct Nrf2 Signaling Mechanisms of Fumaric Acid Esters and Their Role in Neuroprotection against 1-Methyl-4-Phenyl-1,2,3,6-Tetrahydropyridine-Induced Experimental Parkinson’s-Like Disease, J Neurosci 36(23) (2016) 6332–51. [DOI] [PMC free article] [PubMed] [Google Scholar]
- [36].Komatsu M, Kurokawa H, Waguri S, Taguchi K, Kobayashi A, Ichimura Y, Sou YS, Ueno I, Sakamoto A, Tong KI, Kim M, Nishito Y, Iemura S, Natsume T, Ueno T, Kominami E, Motohashi H, Tanaka K, Yamamoto M, The selective autophagy substrate p62 activates the stress responsive transcription factor Nrf2 through inactivation of Keap1, Nat Cell Biol 12(3) (2010) 213–23. [DOI] [PubMed] [Google Scholar]
- [37].Jiang T, Harder B, Rojo de la Vega M, Wong PK, Chapman E, Zhang DD, p62 links autophagy and Nrf2 signaling, Free Radic Biol Med 88(Pt B) (2015) 199–204. [DOI] [PMC free article] [PubMed] [Google Scholar]
- [38].Al Taleb Z, Petry A, Chi TF, Mennerich D, Gorlach A, Dimova EY, Kietzmann T, Differential transcriptional regulation of hypoxia-inducible factor-1alpha by arsenite under normoxia and hypoxia: involvement of Nrf2, J Mol Med (Berl) 94(10) (2016) 1153–1166. [DOI] [PMC free article] [PubMed] [Google Scholar]
- [39].Maxwell PH, Wiesener MS, Chang GW, Clifford SC, Vaux EC, Cockman ME, Wykoff CC, Pugh CW, Maher ER, Ratcliffe PJ, The tumour suppressor protein VHL targets hypoxia-inducible factors for oxygen-dependent proteolysis, Nature 399(6733) (1999) 271–5. [DOI] [PubMed] [Google Scholar]
- [40].Mathew T, Sarada SKS, Intonation of Nrf2 and Hif1-alpha pathway by curcumin prophylaxis: A potential strategy to augment survival signaling under hypoxia, Respir Physiol Neurobiol 258 (2018) 12–24. [DOI] [PubMed] [Google Scholar]
- [41].Malec V, Gottschald OR, Li S, Rose F, Seeger W, Hanze J, HIF-1 alpha signaling is augmented during intermittent hypoxia by induction of the Nrf2 pathway in NOX1-expressing adenocarcinoma A549 cells, Free Radic Biol Med 48(12) (2010) 1626–35. [DOI] [PubMed] [Google Scholar]
- [42].Waypa GB, Schumacker PT, Roles of HIF1 and HIF2 in pulmonary hypertension: it all depends on the context, Eur Respir J 54(6) (2019). [DOI] [PubMed] [Google Scholar]
- [43].Ambivero CT, Cilenti L, Zervos AS, ATF4 interacts with Abro1/KIAA0157 scaffold protein and participates in a cytoprotective pathway, Biochimica et biophysica acta (2012). [DOI] [PubMed] [Google Scholar]
- [44].Cilenti L, Ambivero CT, Ward N, Alnemri ES, Germain D, Zervos AS, Inactivation of Omi/HtrA2 protease leads to the deregulation of mitochondrial Mulan E3 ubiquitin ligase and increased mitophagy, Biochim Biophys Acta 1843(7) (2014) 1295–307. [DOI] [PubMed] [Google Scholar]
- [45].Faccio L, Fusco C, Chen A, Martinotti S, Bonventre JV, Zervos AS, Characterization of a novel human serine protease that has extensive homology to bacterial heat shock endoprotease HtrA and is regulated by kidney ischemia, The Journal of biological chemistry 275(4) (2000) 2581–8. [DOI] [PubMed] [Google Scholar]
- [46].Dagda RK, Chu CT, Mitochondrial quality control: insights on how Parkinson’s disease related genes PINK1, parkin, and Omi/HtrA2 interact to maintain mitochondrial homeostasis, Journal of bioenergetics and biomembranes 41(6) (2009) 473–9. [DOI] [PMC free article] [PubMed] [Google Scholar]
- [47].Bottinger L, Becker T, Protein quality control in the intermembrane space of mitochondria, J Mol Biol 424(5) (2012) 225–6. [DOI] [PubMed] [Google Scholar]
- [48].Cai W, Yang H, The structure and regulation of Cullin 2 based E3 ubiquitin ligases and their biological functions, Cell Div 11 (2016) 7. [DOI] [PMC free article] [PubMed] [Google Scholar]
- [49].Kolamunne RT, Dias IH, Vernallis AB, Grant MM, Griffiths HR, Nrf2 activation supports cell survival during hypoxia and hypoxia/reoxygenation in cardiomyoblasts; the roles of reactive oxygen and nitrogen species, Redox Biol 1 (2013) 418–26. [DOI] [PMC free article] [PubMed] [Google Scholar]
- [50].Zhao RZ, Jiang S, Zhang L, Yu ZB, Mitochondrial electron transport chain, ROS generation and uncoupling (Review), Int J Mol Med 44(1) (2019) 3–15. [DOI] [PMC free article] [PubMed] [Google Scholar]
- [51].Saidu NEB, Kavian N, Leroy K, Jacob C, Nicco C, Batteux F, Alexandre J, Dimethyl fumarate, a two-edged drug: Current status and future directions, Med Res Rev 39(5) (2019) 1923–1952. [DOI] [PubMed] [Google Scholar]
- [52].Toyama T, Looney AP, Baker BM, Stawski L, Haines P, Simms R, Szymaniak AD, Varelas X, Trojanowska M, Therapeutic Targeting of TAZ and YAP by Dimethyl Fumarate in Systemic Sclerosis Fibrosis, J Invest Dermatol 138(1) (2018) 78–88. [DOI] [PMC free article] [PubMed] [Google Scholar]
- [53].Nishimoto S, Suzuki T, Koike S, Yuan B, Takagi N, Ogasawara Y, Nrf2 activation ameliorates cytotoxic effects of arsenic trioxide in acute promyelocytic leukemia cells through increased glutathione levels and arsenic efflux from cells, Toxicol Appl Pharmacol 305 (2016) 161–168. [DOI] [PubMed] [Google Scholar]
- [54].Zhao Y, Sun Y, Cullin-RING Ligases as attractive anti-cancer targets, Curr Pharm Des 19(18) (2013) 3215–25. [DOI] [PMC free article] [PubMed] [Google Scholar]
- [55].Wang J, Qian J, Hoeksema MD, Zou Y, Espinosa AV, Rahman SM, Zhang B, Massion PP, Integrative genomics analysis identifies candidate drivers at 3q26–29 amplicon in squamous cell carcinoma of the lung, Clin Cancer Res 19(20) (2013) 5580–90. [DOI] [PMC free article] [PubMed] [Google Scholar]
- [56].Haines DS, p97-containing complexes in proliferation control and cancer: emerging culprits or guilt by association?, Genes Cancer 1(7) (2010) 753–763. [DOI] [PMC free article] [PubMed] [Google Scholar]
- [57].Taguchi K, Yamamoto M, The KEAP1-NRF2 System in Cancer, Front Oncol 7 (2017) 85. [DOI] [PMC free article] [PubMed] [Google Scholar]
- [58].Cloer EW, Goldfarb D, Schrank TP, Weissman BE, Major MB, NRF2 Activation in Cancer: From DNA to Protein, Cancer Res 79(5) (2019) 889–898. [DOI] [PMC free article] [PubMed] [Google Scholar]
- [59].Mennerich D, Dimova EY, Kietzmann T, Direct phosphorylation events involved in HIF-alpha regulation: the role of GSK-3beta, Hypoxia (Auckl) 2 (2014) 35–45. [DOI] [PMC free article] [PubMed] [Google Scholar]
- [60].Bryan HK, Olayanju A, Goldring CE, Park BK, The Nrf2 cell defence pathway: Keap1-dependent and -independent mechanisms of regulation, Biochem Pharmacol 85(6) (2013) 705–17. [DOI] [PubMed] [Google Scholar]
- [61].Doe MR, Ascano JM, Kaur M, Cole MD, Myc posttranscriptionally induces HIF1 protein and target gene expression in normal and cancer cells, Cancer Res 72(4) (2012) 949–57. [DOI] [PMC free article] [PubMed] [Google Scholar]
- [62].Guo H, Xu J, Zheng Q, He J, Zhou W, Wang K, Huang X, Fan Q, Ma J, Cheng J, Mei W, Xing R, Cai R, NRF2 SUMOylation promotes de novo serine synthesis and maintains HCC tumorigenesis, Cancer Lett 466 (2019) 39–48. [DOI] [PubMed] [Google Scholar]
- [63].Cuadrado A, Structural and functional characterization of Nrf2 degradation by glycogen synthase kinase 3/beta-TrCP, Free Radic Biol Med 88(Pt B) (2015) 147–157. [DOI] [PubMed] [Google Scholar]
- [64].Courtnay R, Ngo DC, Malik N, Ververis K, Tortorella SM, Karagiannis TC, Cancer metabolism and the Warburg effect: the role of HIF-1 and PI3K, Mol Biol Rep 42(4) (2015) 841–51. [DOI] [PubMed] [Google Scholar]
- [65].Nagao A, Kobayashi M, Koyasu S, Chow CCT, Harada H, HIF-1-Dependent Reprogramming of Glucose Metabolic Pathway of Cancer Cells and Its Therapeutic Significance, Int J Mol Sci 20(2) (2019). [DOI] [PMC free article] [PubMed] [Google Scholar]
- [66].Miska J, Lee-Chang C, Rashidi A, Muroski ME, Chang AL, Lopez-Rosas A, Zhang P, Panek WK, Cordero A, Han Y, Ahmed AU, Chandel NS, Lesniak MS, HIF-1alpha Is a Metabolic Switch between Glycolytic-Driven Migration and Oxidative Phosphorylation-Driven Immunosuppression of Tregs in Glioblastoma, Cell Rep 27(1) (2019) 226–237 e4. [DOI] [PMC free article] [PubMed] [Google Scholar]
- [67].Hawkins KE, Joy S, Delhove JM, Kotiadis VN, Fernandez E, Fitzpatrick LM, Whiteford JR, King PJ, Bolanos JP, Duchen MR, Waddington SN, McKay TR, NRF2 Orchestrates the Metabolic Shift during Induced Pluripotent Stem Cell Reprogramming, Cell Rep 14(8) (2016) 1883–91. [DOI] [PMC free article] [PubMed] [Google Scholar]