

Abstract
With increasing population, rapid urbanization, and increased migration to cities, the local impacts of increasing transportation and industrial-related air pollution are of growing concern worldwide. Elevated air pollution concentrations near these types of sources have been linked to adverse health effects including acute and chronic respiratory and cardiovascular diseases. Mobile monitoring has proven to be a useful technique to characterize spatial variability of air pollution in urban areas and pollution concentration gradients from specific sources. A study was conducted in the Kansas City, Kansas (USA) metropolitan area using mobile monitoring to characterize the spatial variability and gradients of air pollutants to identify the contribution of multiple sources on community-level air quality in a complex urban environment. Measurements focused on nitrogen dioxide (NO2), black carbon (BC), and ultrafine particulate matter (UFP). Mobile monitoring showed that median concentrations of these pollutants ranged by up to a factor of three between the communities, with individual measurements ranging over an order of magnitude within the community. Evaluating these air quality measurements with wind direction data highlighted the influence of specific and combinations of air pollution sources on these elevated concentrations, which can provide valuable information to environmental and public health officials in prioritizing and implementing cost-effect air quality management strategies to reduce exposures for urban populations.
Keywords: Near-source, Rail yard, Traffic, Particulate matter, Ultrafine PM, Black carbon, NO2, Mobile monitoring
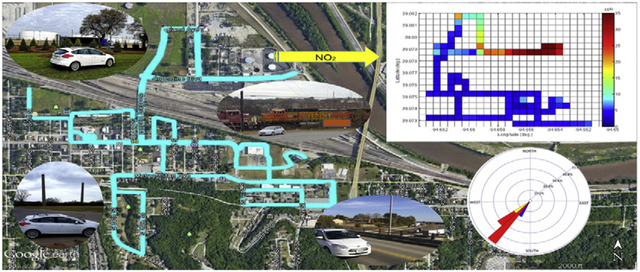
Graphical Abstract
1. Introduction
Air quality regulations and improved pollution control techniques have been effective in reducing air pollution levels; however rapid urban migration has resulted in increasing numbers of people living, working, and attending school near air pollution sources such as major roads, railyards, freight distribution centers, and industry. People’s exposure to air pollution has been associated with an increased risk for numerous health problems including higher rates of asthma onset and aggravation; cardiovascular disease; impaired lung development in children; pre-term and low-birthweight infants; childhood leukemia; and premature death (see HEI, 2010; HEI, 2018). Additional health studies have indicated that populations who live, work or attend school near major transportation facilities face an increased risk for adverse public health effects (e.g., Health Effects Institute, 2010). Children, elderly, people with preexisting cardiopulmonary disease, and people of low socioeconomic status have been identified as having even higher risks for health impacts from air pollution.
In many urban areas, transportation-related facilities represent a complex collection of air pollution sources that can be difficult to characterize. For example, rail yards typically contain complex emission sources on-site as well as support nearby freight movement activities and industries with separate air pollution emissions (Brantley et al., 2019). Air quality measurement studies show that air pollution concentrations can be highly elevated near these large transportation sources, with concentrations of many pollutants emitted by motor vehicles and other transportation sources significantly elevated within the first 200–300 m from the source compared to background levels (Steffens et al., 2017; Karner et al., 2010; Baldauf et al., 2008; Zhou and Levy, 2007; Zhu et al., 2002). Although the extent of elevated air pollutant concentrations can be a relatively small distance, a large portion of the population can live near these facilities and be exposed to high air pollution concentrations. For example, in 2013 in the United States, more than 15 million housing units were estimated to be located within 100 m of a major transportation source such as highways, railroads, and airports (Census Bureau, 2007).
To identify the potential for adverse health effects from exposures to air pollution and identify potential effective strategies to reduce emissions from the sources contributing to high pollution levels, characterizing the attribution of different sources in a complex urban environment can be critical. Mobile monitoring has been used to provide spatially-resolved data on air pollution emissions and ambient air impacts from local sources and within communities (e.g., Hagler et al., 2010; Deshmukh et al., 2019; Baldauf et al., 2009; Baldauf et al., 2016). In this study, mobile monitoring provided high spatial-resolution air pollution concentration data to assess the contribution of transportation and industrial emissions on air quality in neighboring communities. Combining the spatial and temporal air pollution measurements collected by mobile monitoring with meteorological data for the region provided one of the first studies using mobile monitoring to characterize the location and range of air pollution impacts from a variety of local sources impacting community air quality. The results from this study highlight the effectiveness of mobile monitoring to identify air pollution impacts and estimate population exposure differences, which can be used by environmental and public health officials to mitigate air pollution health concerns and implement air pollution control strategies.
2. Experimental methods
2.1. Study design
Mobile monitoring was conducted in the Kansas City, Kansas (USA) metropolitan area as part of the Kansas City Transportation and Local-Scale Air Quality Study (KC-TRAQS; Kimbrough et al., 2019). This study focused on assessing air quality in the neighborhoods of Turner, Argentine, and Armourdale in southeast Kansas City, Kansas as shown in Fig. 1. As described in Kimbrough et al. (2019), these neighborhoods are surrounded by a complex mixture of transportation and industrial air pollution sources including a large railyard, another smaller railyard, two major interstate highways, light industries, and numerous commercial distribution facilities. Two mobile monitoring intensive studies were conducted from October 10, 2017 to November 14, 2017 (Fall season) and from February 19, 2018 to March 18, 2018 (Winter season). Mobile monitoring routes were designed to provide spatially-resolved pollutant concentration measurements in and around the three communities as well as six fixed measurement sites in the area as described by Kimbrough et al. (2019).
Fig. 1.
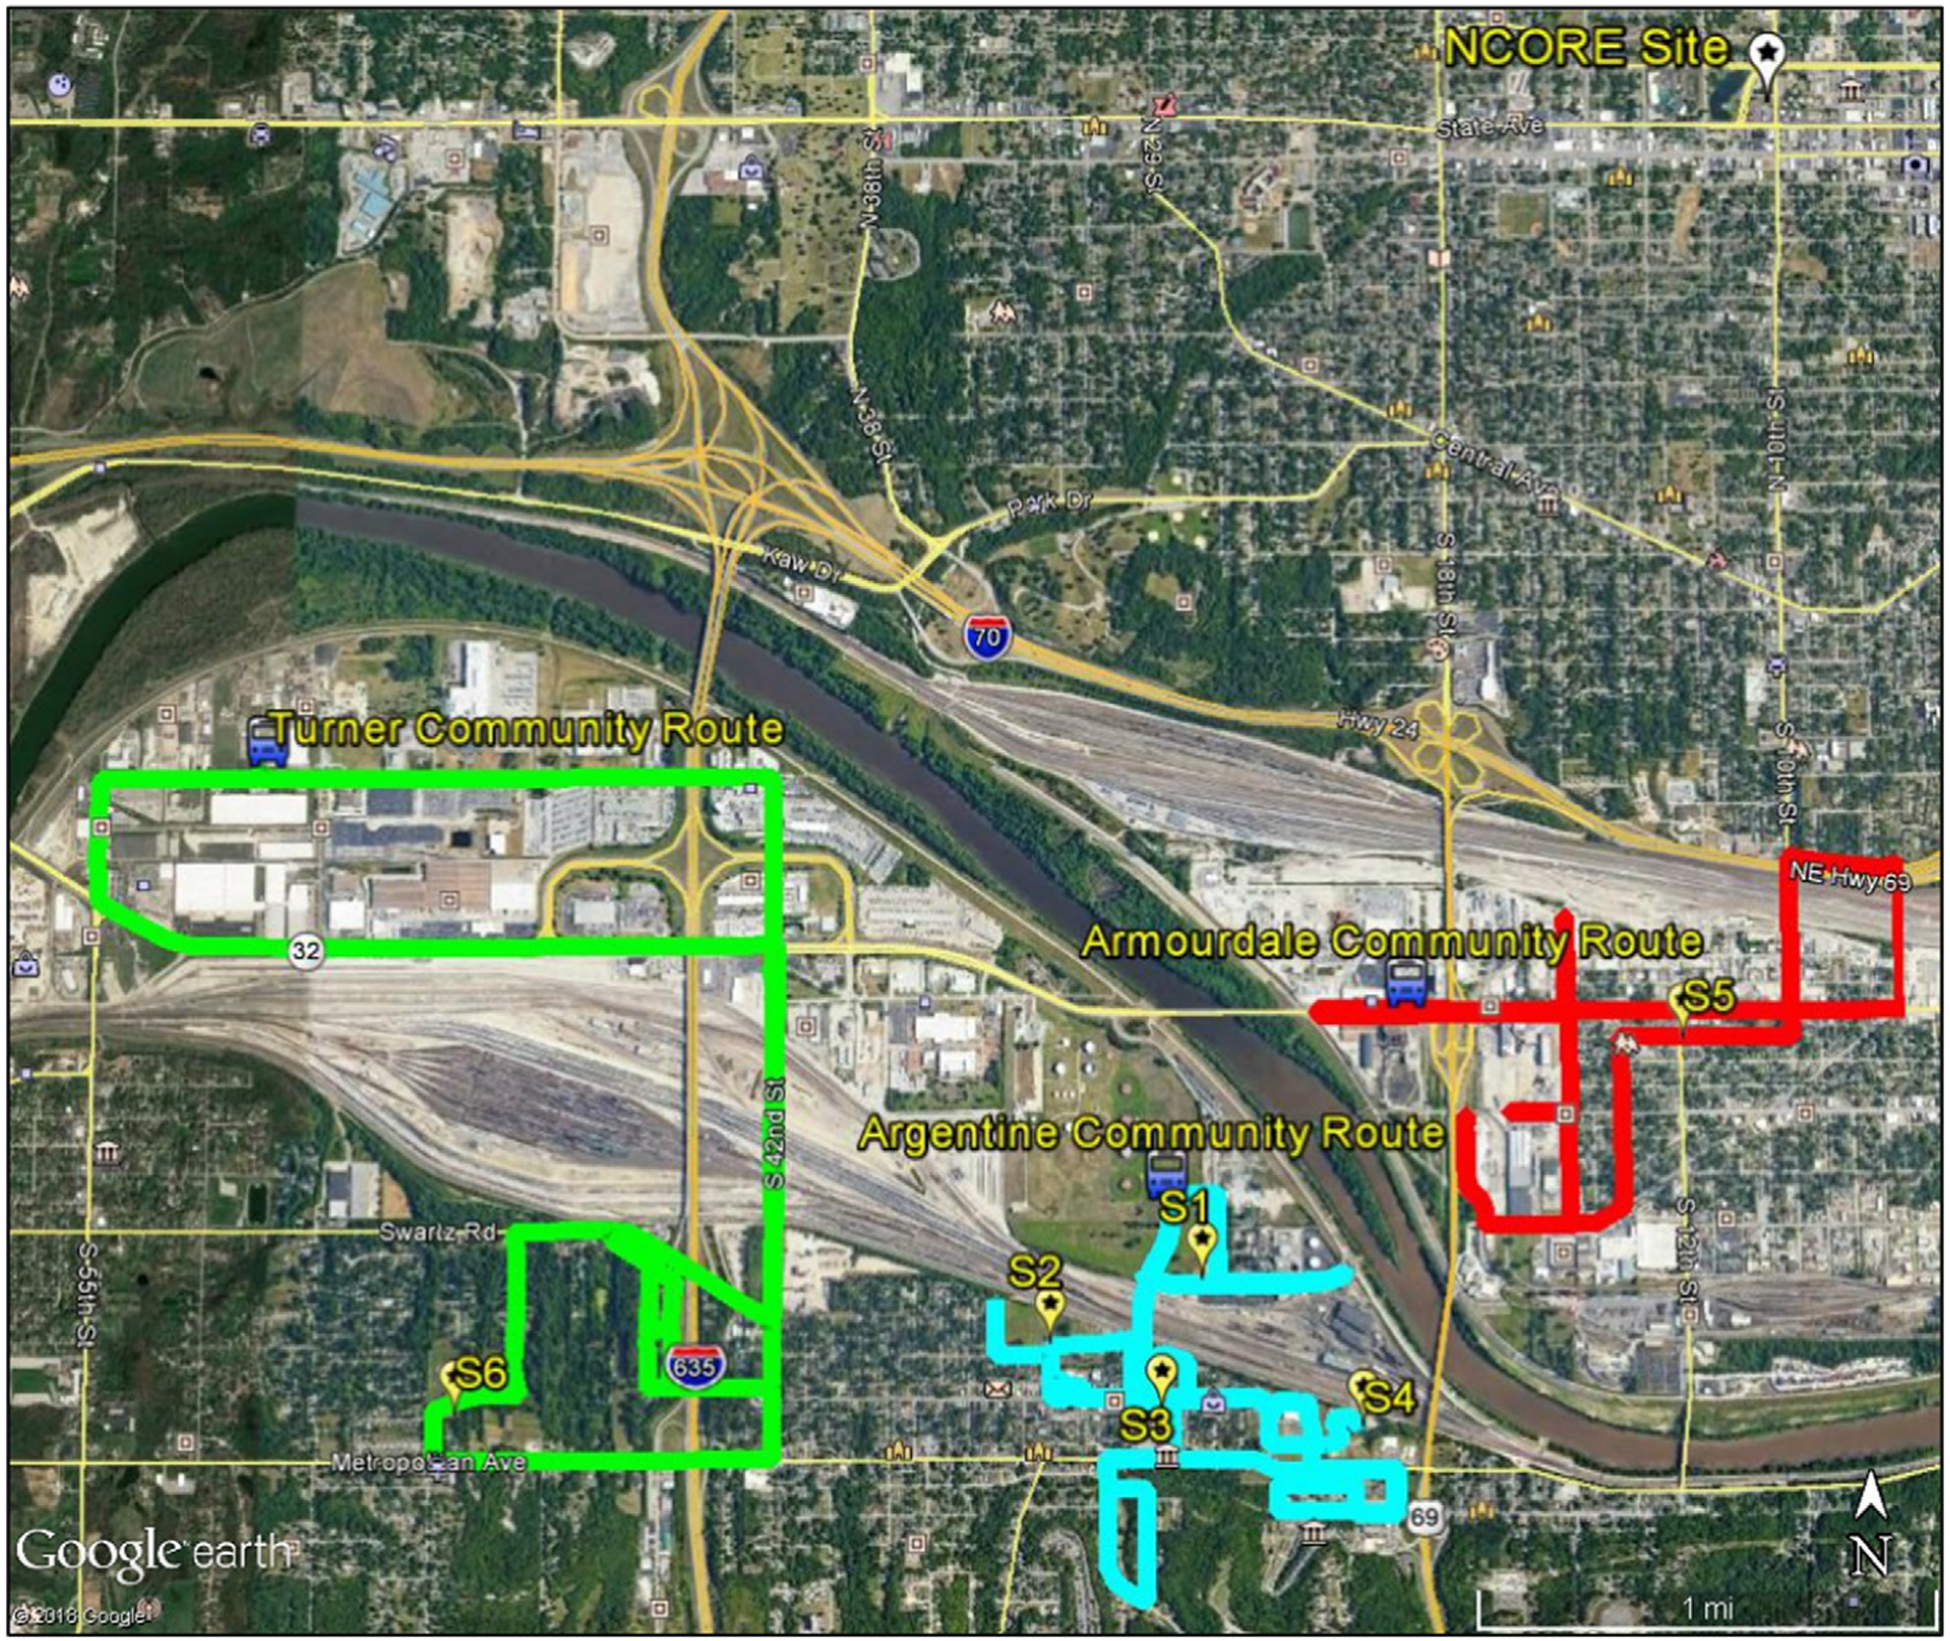
Study area with the mobile monitoring routes for Turner (green), Argentine (blue) and Armourdale (red) communities. Yellow markers (S1 through S6) show locations for the KC-TRAQS fixed measurement sites along the mobile monitoring routes. The white marker (top right corner) shows the location of the JFK National Core (NCore) Monitoring Site.
2.2. Mobile monitoring routes
The moble monitoring routes shown in Fig. 1 were designed to evaluate air quality variability within each community, as well as the impact from air pollution sources in the area. The Turner community route (shown in green) included three primary emission sources: a highway (I-635) supporting approximately 100,000 vehicles per day traversing north-south through the community, a railyard traversing east-west on the north side of the community, and numerous large commercial distribution centers north of the railyard. In addition to I-635, Kansas Avenue is a major arterial road traversing east-west between the railyard and the distribution centers supporting approximately 40,000 vehicles per day including a large portion of heavy-duty trucks operating at the commercial distribution centers.
The Argentine community route (shown in blue) included measurements to the north and south of the railyard. In addition to the railyard operations, a train maintenance facility was located near this community route on the eastern side of the railyard. The remainder of the route provided spatial measurements within the community, located in the river valley and extending into the bluffs bordering the south of the community and the river valley.
The Armourdale community route (shown in red) was located northeast of the major railyard and to the south of a major highway (I-70) supporting approximately 150,000 vehicles per day. A smaller railyard was located to the south of I-70, providing a northern border for the community. To the west of the community, several industries were located along the Kansas River that included ground-level and elevated stack emission releases.
Table 1 lists the sampling data and characteristics for each of these mobile monitoring routes. As shown, each route was sampled for multiple days, with a larger frequency of measurements in the Argentine community in order to better evaluate emission impacts from the railyard and maintenance facility. Even though fewer days were sampled in the other communities, a large number of 1-second average data measurements were collected in all communities. In addition to the routes in the communities, measurements were collected at the JFK National Core (NCore) monitoring station approximately 5 km northeast of the study area with the mobile vehicles parked next to the station. Three days of sampling were conducted for quality assurance purposes and to estimate urban background concentrations for the study area. Not all days were sampled at the NCore site, so daily background levels were not determined each day using the mobile monitoring platform.
Table 1.
Mobile monitoring routes.
| Route | No. of sampling days | No. of sampling points | Community/site characteristics |
|---|---|---|---|
| Turner | 12 | 190,505 | Major railyard borders to the north with many large distrbution centers further to the north of this railyard; major interstate runs through community to the north and south |
| Argentine | 16 | 294,938 | Major railyard with a train maintenance facility borders to the north; Residential and light industrial land use adjacent to rail yard |
| Armourdale | 5 | 116,429 | Small railyard borders to the north with a major highway adjacent to this railyard further north; industrial area borders to the west; Community park, residential, and other light industry within the neighborhood |
| JFK NCore Site | 3 | 13,331 | Urban core multi-pollutant monitoring station part of NCore Monitoring Network designed to measure urban-scale air quality |
2.3. Mobile monitoring methods
Air quality measurements were collected using an all-electric vehicle (EV) equipped with real-time location [using a global positioning system (GPS)], black carbon (BC), ultrafine particulate matter number count (UFP), nitrogen dioxide (NO2), and carbon dioxide (CO2) instruments as described in Table 2. The EV was driven while measuring air quality along one of the routes each day during the study. The EV, shown in Fig. 2, was designed to host an on-board battery pack capable of charging via solar power utilizing two 100 W solar panels mounted on the roof of the car. The on-board solar powered battery pack provides 6–10 h of continuous run-time for the instruments listed in Table 2. The EV platform ensured that there was no self-contamination while conducting mobile measurements. For each day, the EV drove approximately 15 to 20 continuous laps along the community route chosen for that day. All air quality instruments used in the mobile monitoring campaign measured at 1-second sampling intervals, resulting in a spatial resolution of approximately 9 m at typical residential road driving speeds of 30 km/h and 20 m at arterial road driving speeds of 70 km/h. Hagler et al. (2010) described the vehicle set up and sampling methods used in the mobile monitoring platform. Calibration of the instruments, including zero and span checks, occurred each day prior to sampling. The instruments used in this study represent research-grade, real-time monitoring equipment.
Table 2.
Mobile monitoring instrumentation.
| Measurement platform | Measurement parameter | Sampling approach | Instrument make/model | Sample type and frequency |
|---|---|---|---|---|
| EV | CO2 | Non-dispersive infrared (NDIR) gas analyzer | LiCOR/Model 820 | Continuous, 1-second averages |
| NO2 | Cavity Attenuated Phase Shift (CAPS) | Aerodyne Research, Inc./CAPS NO2 Monitor | ||
| Particle number concentration (size range 5.6–560 nm, 32 channels) | Engine Exhaust Particle Sizer | TSI, Inc./Model 3090 | ||
| Longitude and Latitude | GPS | Crescent R100/Hemisphere GPS | ||
| Video | Webcam | Logitech | ||
| BC | Single-channel Aethalometer | Magee Scientific/AE-42 | ||
| SUV | NO2, nitric oxide (NO) | CAPS | Aerodyne Research, Inc./CAPS NO2 Monitor | Continuous, 1-second averages |
| Particle number concentration (size range 5.6–560 nm, 32 channels) | Engine Exhaust Particle Sizer | TSI, Inc./Model 3090 | ||
| BC | Micro-Aethalometer | Magee Scientific/AE-51 | ||
| CO2 | NDIR | LiCOR/Model 820 | ||
| Video | Webcam | Logitech |
Fig. 2.

EV mobile monitoring sampling platform equipped with NO2, BC, UFP, and CO2 analyzers along with GPS and video.
In addition to the mobile monitoring EV, a sport utility vehicle (SUV) was parked at a designated spot along each route for the duration of the sampling day for continuous air quality measurements, including CO2, nitric oxide (NO), NO2, BC, and UFP at 1-second time intervals as listed in Table 2. Batteries located within the vehicle powered these samplers, so the vehicle’s engine could be turned off during all sampling periods. These stationary data measurements provided information on the temporal variability of the pollutant concentrations for the duration of the mobile measurements conducted by the EV. At the end of each sampling day, the SUV and the EV were parked together to conduct co-located air monitoring for a minimum of 30 min for an additional quality assurance assessment. Comparison of the collocated EV and SUV measurements did not indicate any potential instrument malfunction or bias.
3. Results & discussion
3.1. Community air pollution variability
Mobile monitoring provided data on the air quality levels, trends and spatial variability within and between the communities of interest in the Kansas City, Kansas metropolitan area. For this evaluation, only the ambient data for NO2, BC, and UFP combined from both intensive campaigns are reported. Additional seasonal and pollutant evaluations will be conducted in future analyses. Fig. 3 compares the distribution of measurements for NO2, BC, and UFP, respectively for the mobile monitoring measurements collected in each community over the entire study period. Fig. 3 also includes the distribution of measurements collected separately at the JFK NCore site. Evaluation of the measurements from the NCore site show much less variability in background concentrations occurred in this region, so a majority of the differences and wide range in air pollution concentrations within the three communities resulted from local emission sources rather than changes in regional, background air quality. However, mobile monitoring did not occur at all locations on the same days, so background concentrations did vary. Thus, comparisons of air quality between the communities can only be semi-quantitative, whereas comparisons of air quality variability within each community can be quantified.
Fig. 3.
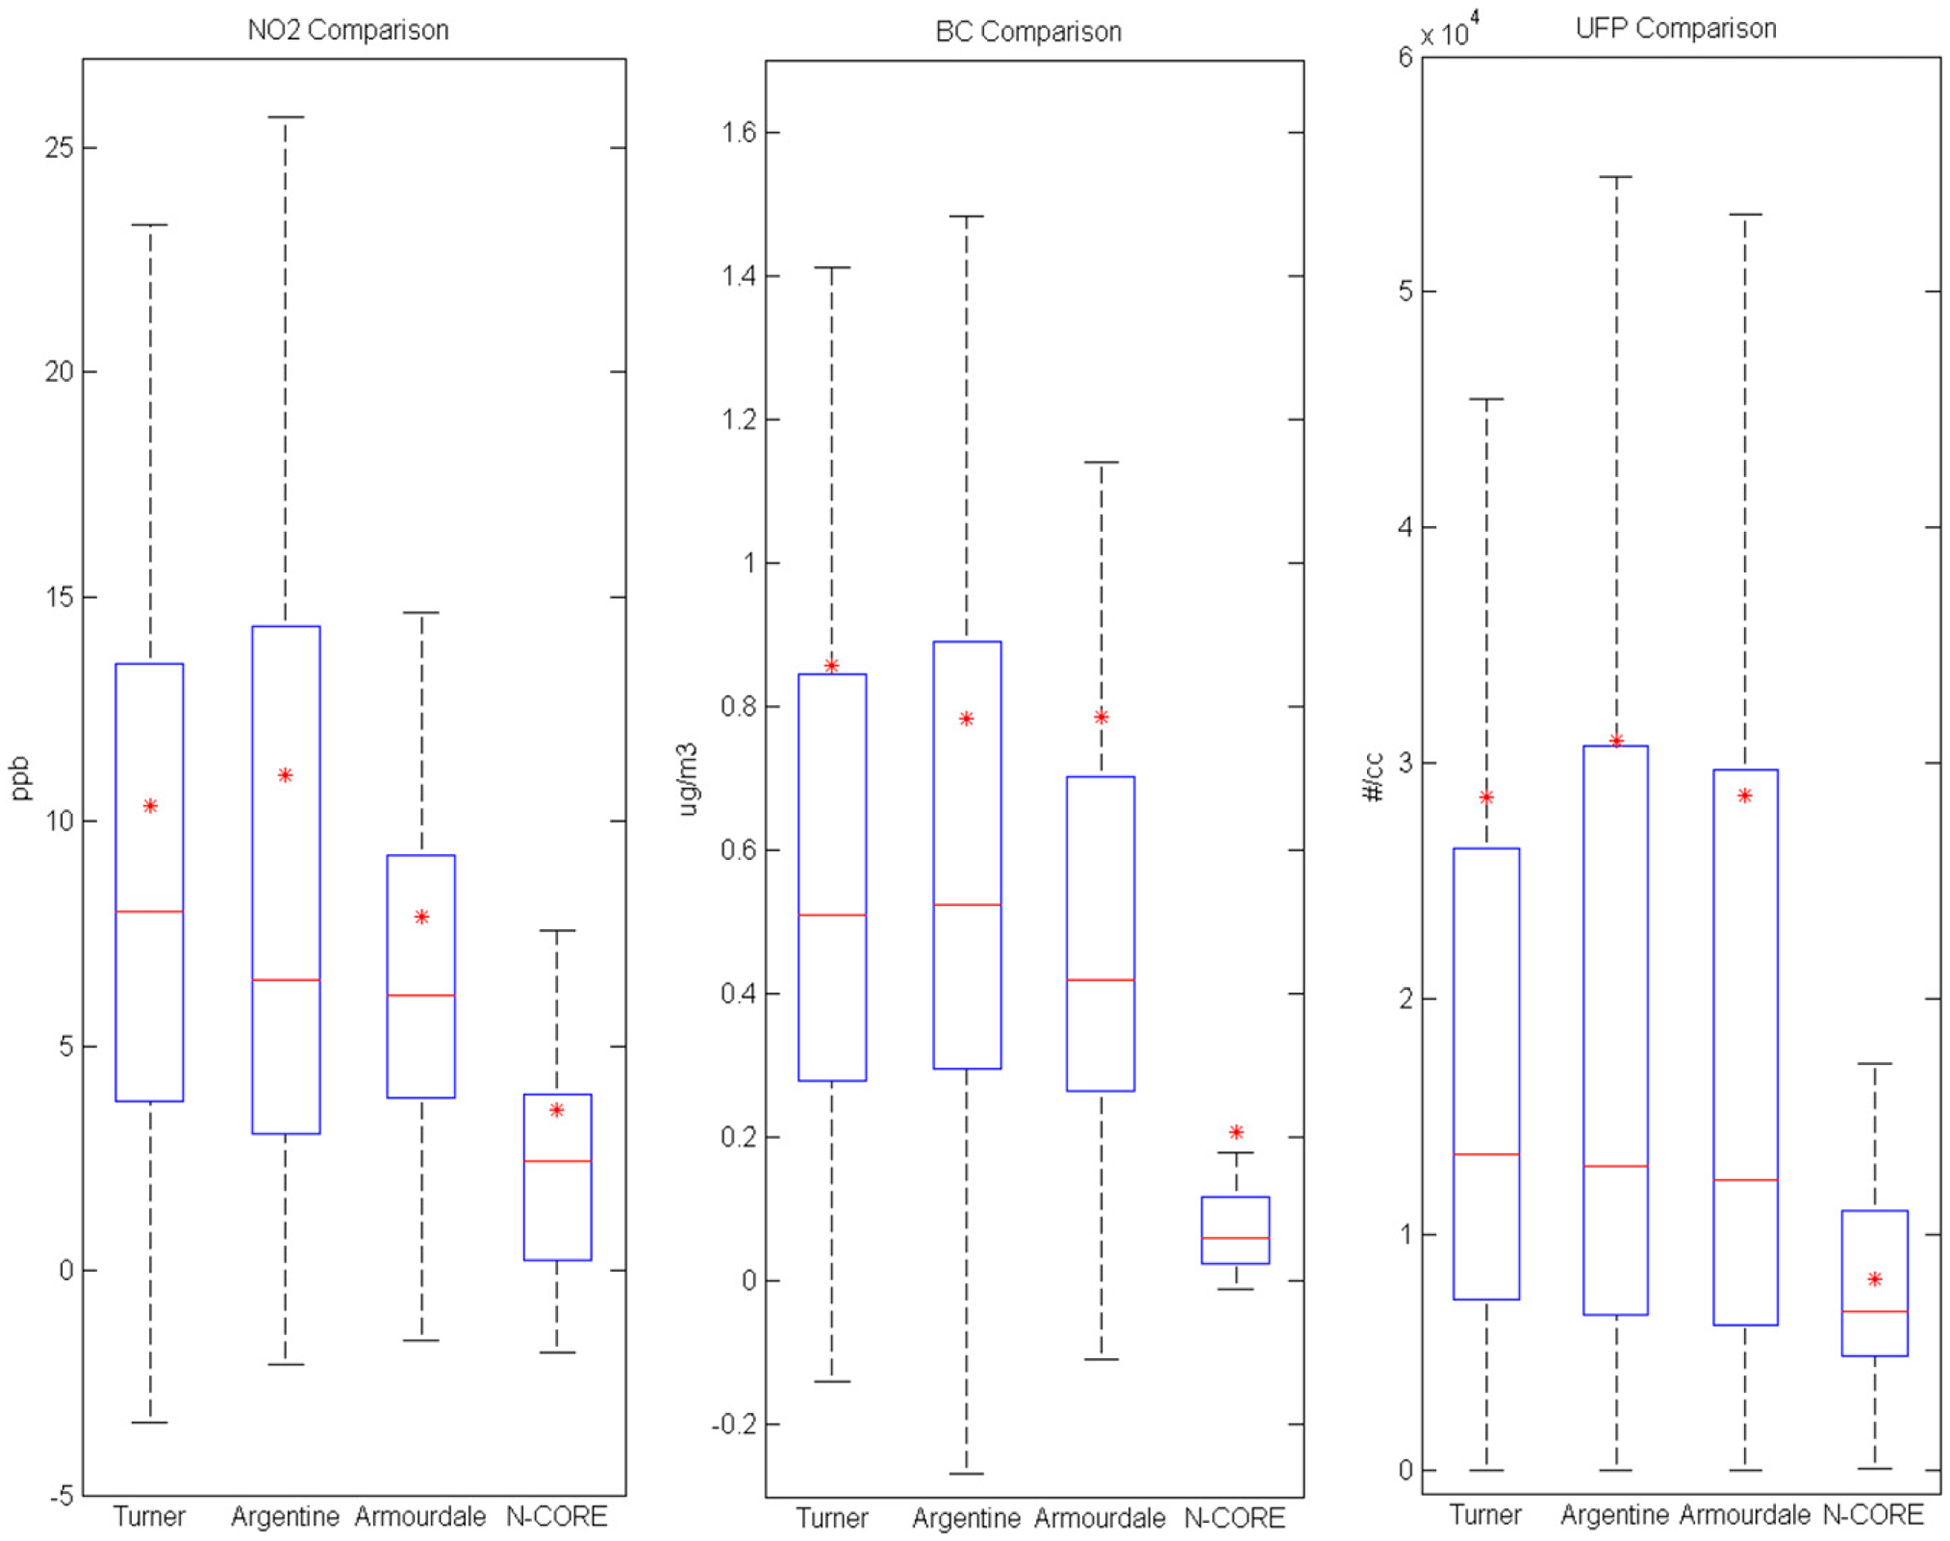
Distributions of pollutant concentrations measured by the EV in each community and at the NCore site for NO2, BC and UFP, respectively. In the box plots, the solid red line represents the mean; the red star represents the median; the bottom and top of the box plots represents the 25th percentile and 75th percentile, respectively; and whiskers above and below represent the 90th and 10th percentiles, respectively.
Generally, the pollutant concentrations measured in each community were similar in range, with slightly higher measurements in Argentine and Turner compared with Armourdale. Mean measurements were always higher than medians, indicating that high concentration measurements occurring in each community skewed the distributions. High measurements likely resulted from impacts of emissions from local sources. However, since all EV sampling occurred on public roads, some high measurements can occur when the mobile sampling vehicle was directly behind a moving or idling vehicle while driving along the sampling routes. While vehicle operators tried to avoid sampling near another vehicle operating on the road, influences from nearby vehicles on the mobile monitoring route could not be avoided at all times.
As shown in Fig. 3, mean and median values for all mobile measurements within each community sampling route were generally a factor of 2 to 9 times higher than the urban background measurements at the NCore site, although sampling occurring on different days means some of these differences can be due to changes in background concentrations. Mean NO2 values ranged between 7.9 and 11 ppb for all three measurement routes, exceeding the background mean NO2 observed at the NCore site by 2 to 3 times. Median NO2 values followed similar trends. Median BC values ranged from 0.4 to 0.5 μg/m3, which exceeded the background median BC values by approximately 7 to 9 times. Observed median UFP concentrations ranged from 12,300 to 13,400 #/cc along the measurement routes, which were approximately 2 times higher than medians measured during UFP sampling at the urban background NCore site. For UFP, mean values were higher than median values by a factor close to 3 for all routes. Factors affecting the extent and range of pollutant measurements within each community are explored in the subsequent sections.
3.2. Wind effects on spatial pollutant variability
To better understand the impact of local air pollution sources on community air quality, mobile monitoring measurements were separated by the sampling location and evaluated during specific wind directions. The locations of the separate sampling zones were determined based on proximity to known air pollution sources along the sampling route, surrounding land use, and likelihood of air pollution impacts from local sources only occurring during winds from certain directions. Meteorological monitoring data obtained from the National Weather Service (NWS) station at the Kansas City (Missouri) Down-town Airport provided wind direction estimates during the time periods of mobile monitoring for all three communities. As described in Kimbrough et al. (2019), this NWS site likely best represented meteorological conditions in the communities of interest due to the nearby location, approximately 5 km east of the study area, and this station is situated within the same river valley as the three communities of interest.
3.2.1. Turner
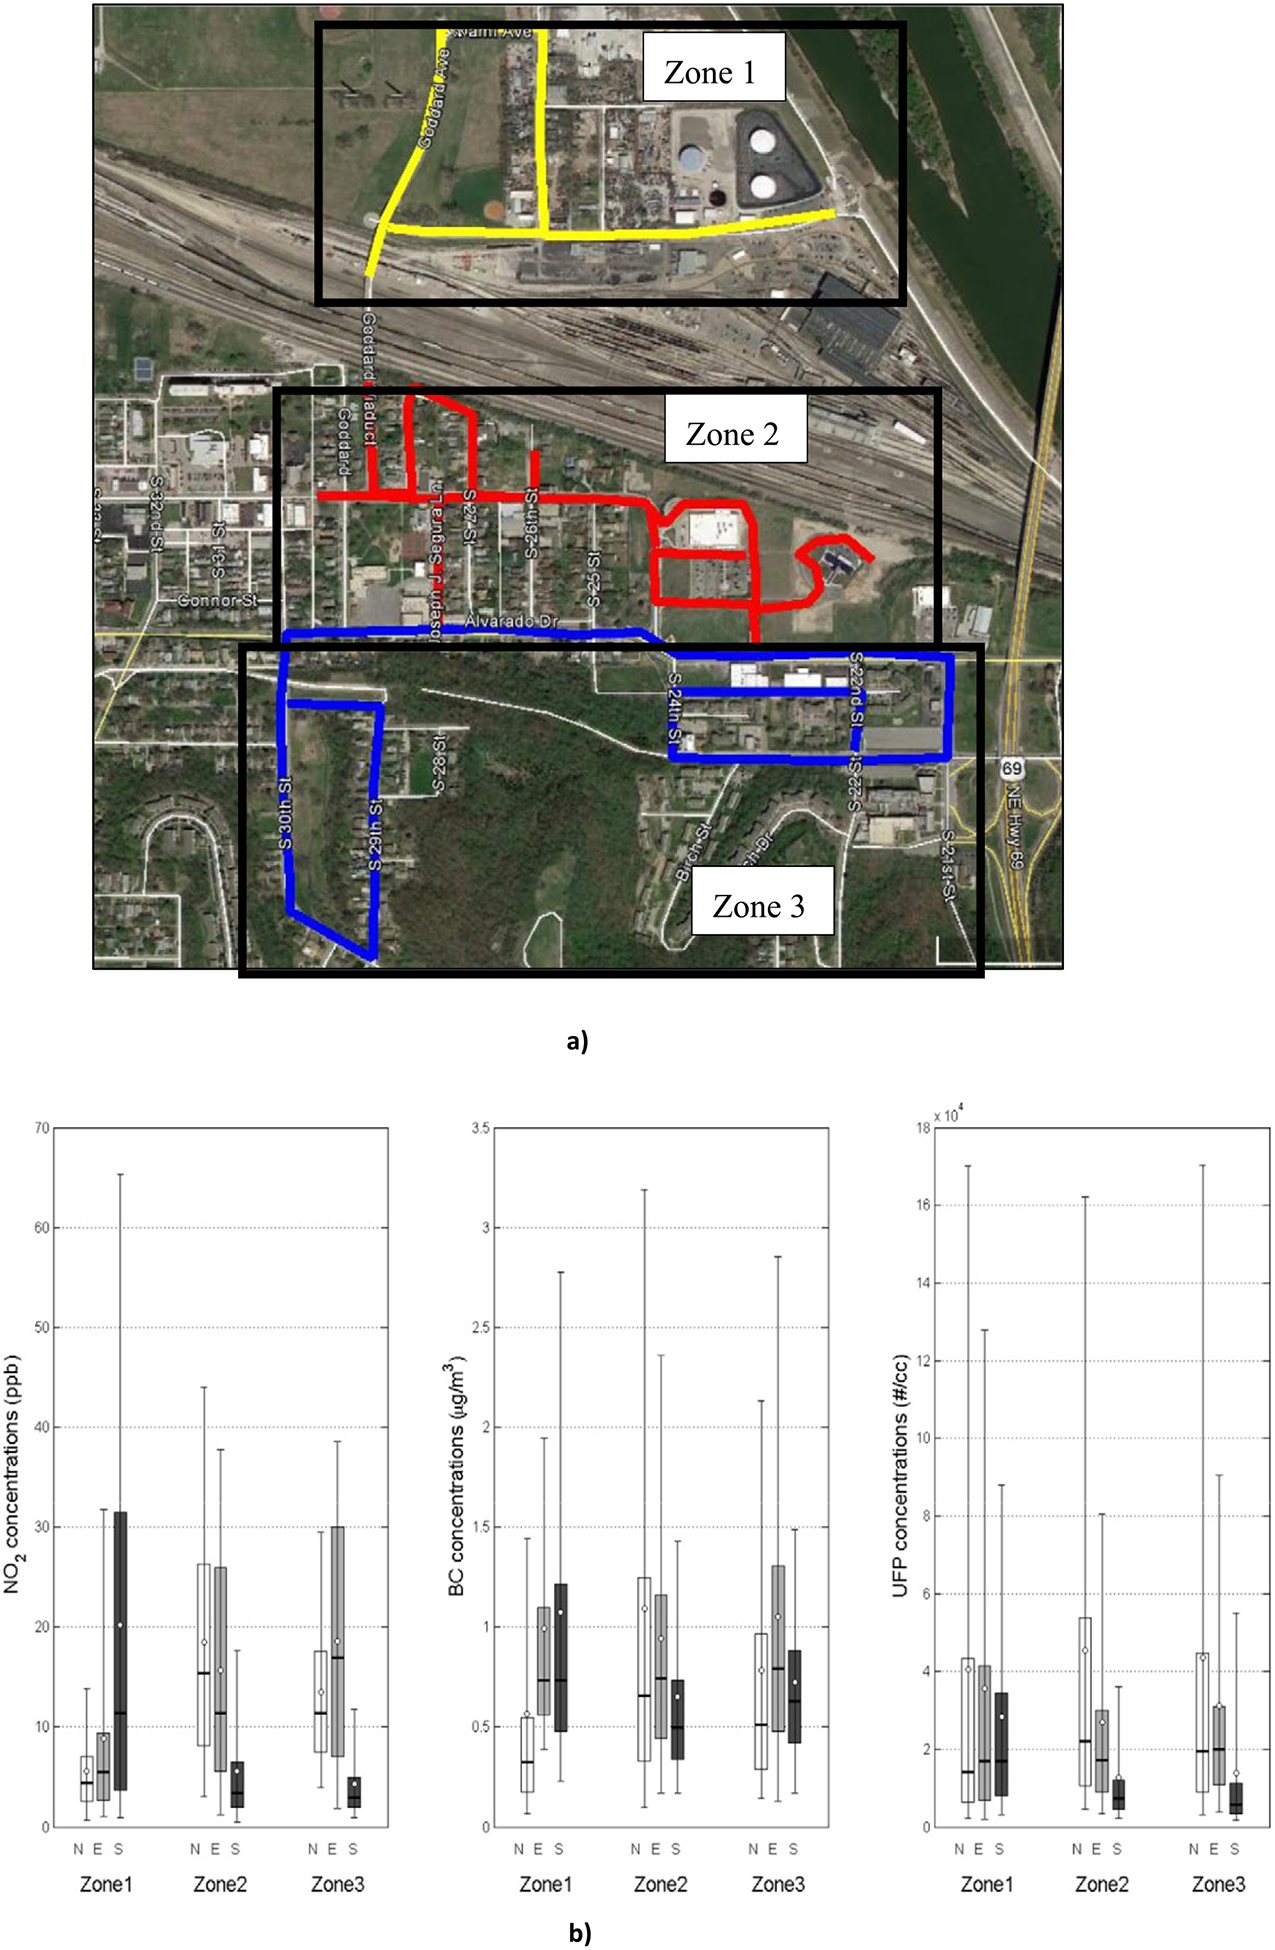
For the wind direction assessment of the Turner community mobile monitoring data, the area was divided into three zones as shown in Fig. 4: Zone 1 – the northern area that consisted of a large number of distribution centers with significant truck traffic; Zone 2 – a long bridge section around 10 m high which spanned the widest portion of the major railyard; and Zone 3 – the portion of the community south of the railyard, which was also intersected by I-635 in a north-south direction. This separation of zones allowed for analysis of measurements north, south and above the large railyard as well as isolating the truck traffic and distribution center activity only located in Zone 1. The results show a very local impact from the distribution centers in Zone 1, with generally higher concentrations under all wind directions. However, the railyard also showed an impact on the community, with median pollutant concentrations (10.4 ppb NO2; 0.73 μg/m3 BC; 15,610 #/cc UFP) in Zone 1 being 1.6 to 2.3 times higher than Zone 3 during winds from the south while median pollutant concentrations in Zones 2 and 3 were higher by factors ranging from 1.1 to 1.5 during winds from the north. Winds from the east showed mixed results with median NO2 and UFP concentrations highest in Zone 2 at 11.9 ppb and 26,642 #/cc, respectively, but BC being higher in Zones 1 and 3. These results indicate that truck traffic emissions have a greater impact on BC concentrations rather than railyard activity, although both diesel sources will impact NO2 and UFP concentrations due to fuel combustion.
Fig. 4.
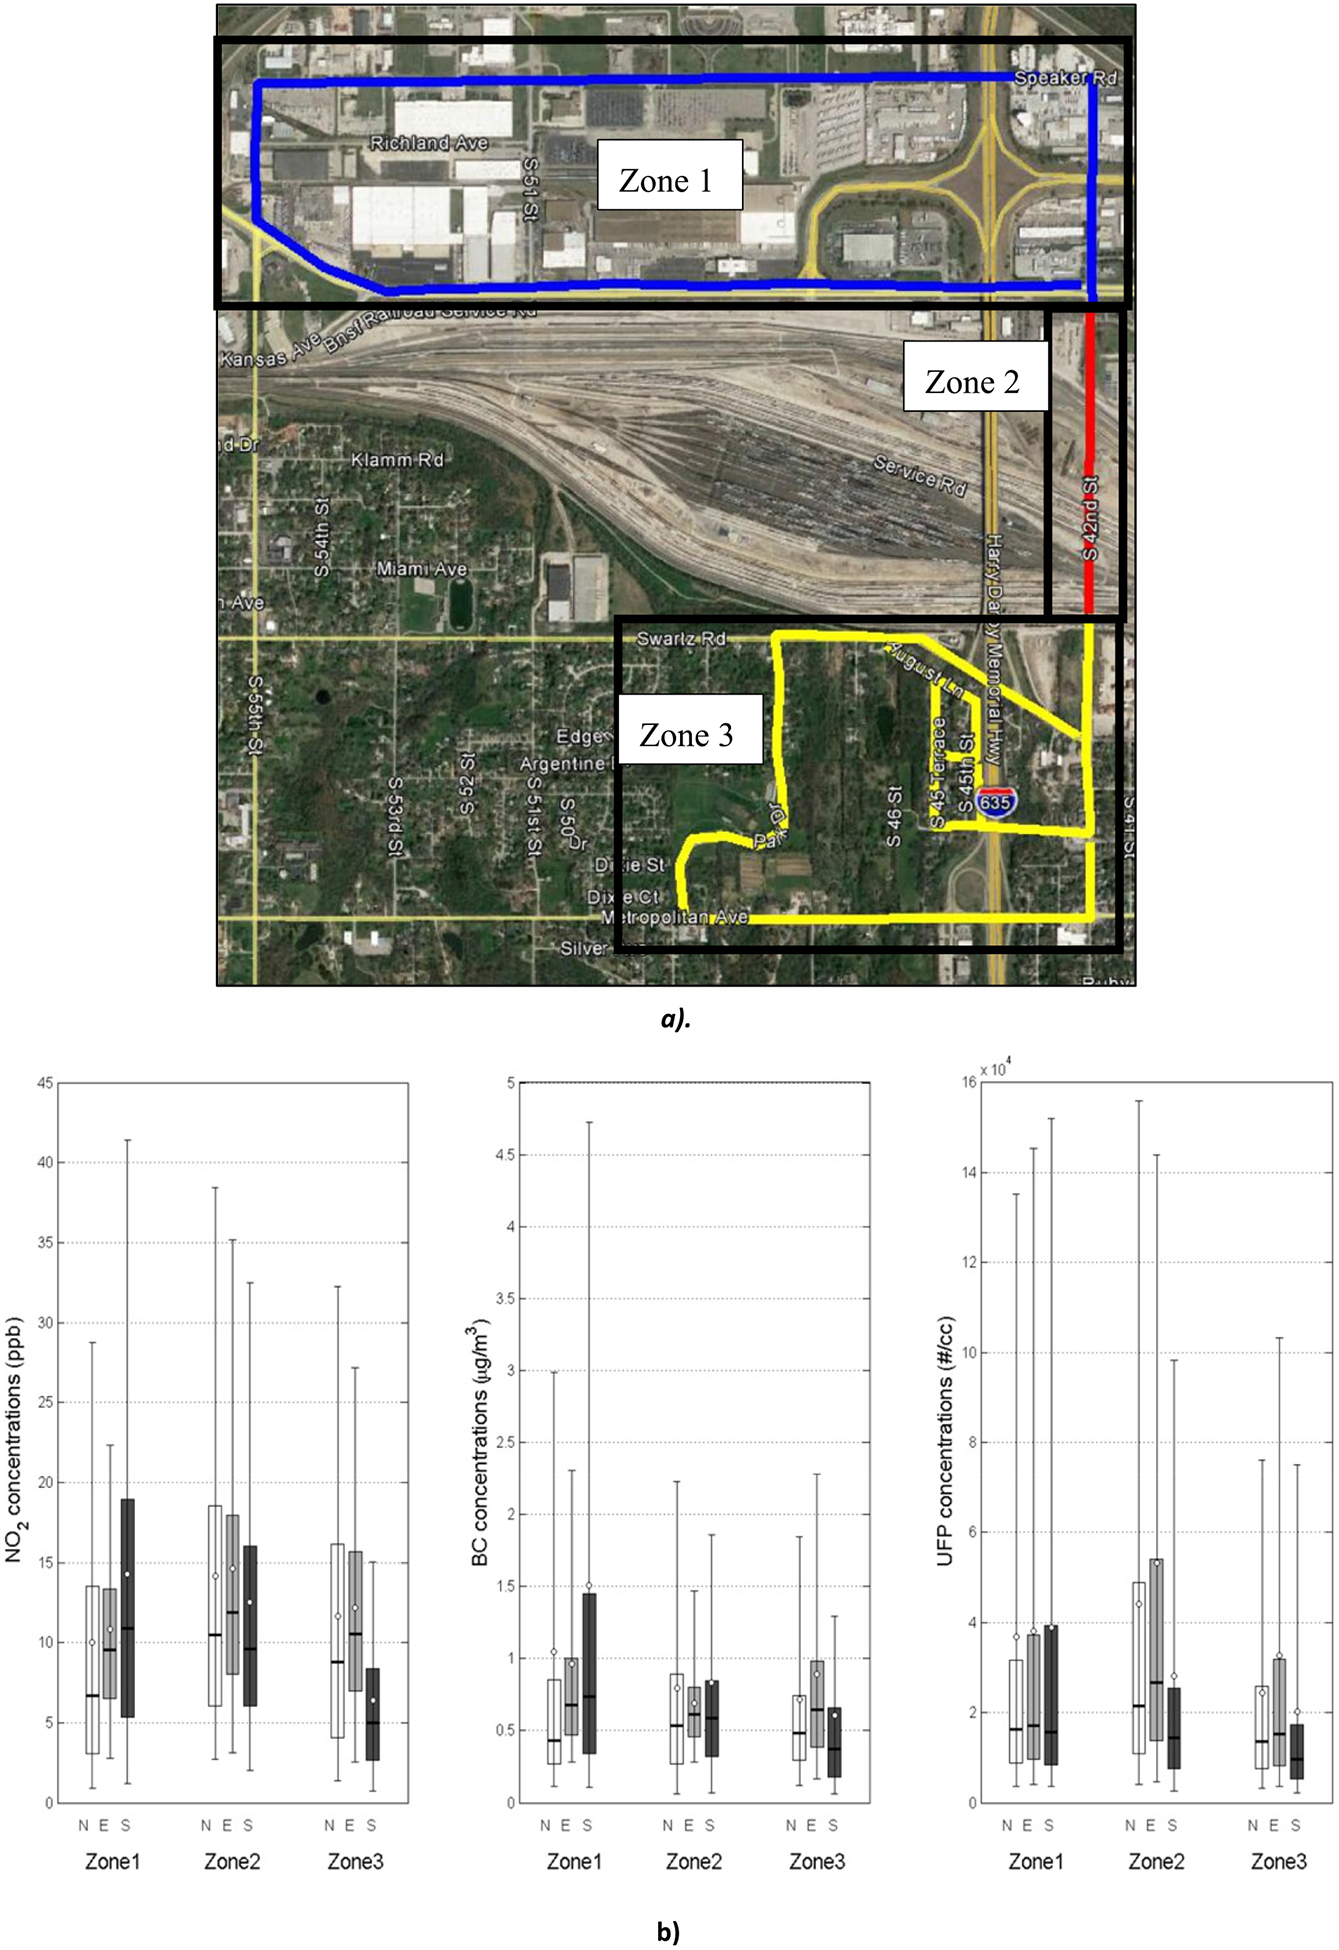
a) Turner mobile monitoring route divided into three zones to represent air quality impacts in multiple areas of the community relative to local air pollution sources; b) Box plots showing air pollution distributions with winds from the North (Zone1 n = 15,769; Zone2 n = 9273; Zone3 n = 37,334); winds from the East (Zone1 n = 9339; Zone2 n = 3444; Zone3 n = 17,269); winds from the South (Zone1 n = 22,962; Zone2 n = 11,504; Zone3 n = 48,452). In the box plots, the solid line represents the median; the circle represents the mean; the bottom and top of the box plots represents the 25th percentile and 75th percentile, respectively; and whiskers above and below represent the 95th and 5th percentiles, respectively.
3.2.2. Argentine
As shown in Fig. 5, the Argentine community mobile monitoring route was divided into three zones for comparing air quality impacts during differing wind direction conditions: Zone 1 – the area north of the railyard and maintenance facility; Zone 2 – the area directly south of the railyard and maintenance facility; and Zone 3 – the broader community area south of the railyard. These zones provided an assessment of immediate impacts north and south of the railyard as well as an evaluation of the gradient of pollution impacts into the community.
Fig. 5.
a) Argentine mobile monitoring route divided into three zones to represent air quality impacts in multiple areas of the community relative to local air pollution sources; b) Box Plots showing air pollution distributions with winds from the North (Zone1 n = 36,168; Zone2 n = 55,139; Zone3 n = 17,068); winds from the East (Zone1 n = 6384; Zone2 n = 17,650; Zone3 n = 15,826); winds from the South (Zone1 n = 22,282; Zone2 n = 34,724; Zone3 n = 18,740). In the box plots, the solid line represents the median; the circle represents the mean; the bottom and top of the box plots represents the 25th percentile and 75th percentile, respectively; and whiskers above and below represent the 95th and 5th percentiles, respectively.
Winds from the north and from the south clearly showed an impact from the railyard and maintenance facility. During winds from the north, Zone 2 (downwind from the railyard) had the highest concentrations for all pollutants with NO2 concentrations (median 13.95 ppb and mean 17.42 ppb) exceeding the Zone 1 (upwind from railyard) concentrations by a factor of 3.4. Zone 3 concentrations were also higher than Zone 1 with NO2 concentrations (median 11.4 ppb and mean13.5 ppb) being a factor of 2.6 higher. The decrease in pollutant concentrations from Zone 2 to Zone 3 also highlights a gradient as distance from the railyard increases. Winds from the south showed significantly higher concentrations in Zone 1 (downwind) compared to Zones 2 and 3 (upwind), with the sharpest difference again when comparing Zone 1 and 3 (mean NO2 concentrations of 19.7 ppb; a factor of 4.6 times higher). These results suggest the railyard and maintenance facility were the major sources affecting local air pollution levels within the Argentine community. However, when winds were from the east, Zone 3 experienced the highest pollutant levels compared with the other zones adjacent to the railyard. This result suggests that other, unidentified pollutant sources predominantly located to the east of the study area, likely impacted the higher elevation portions of the Argentine community found in Zone 3 compared with the lower elevation areas in the river valley incorporated into Zones 1 and 2. Expansion of the mobile monitoring routes would need to be conducted to identify the location and magnitude of impacts from these sources.
3.2.3. Armourdale
Fig. 6 shows the Armourdale community mobile monitoring route divided into four zones for the purpose of comparing air quality impacts during differing wind directions: Zone 1 – the area north and along I-70 and the smaller railyard; Zone 2 – the area directly south of the smaller railyard; Zone 3 – the broader community area south of the smaller railyard; and Zone 4 – the industrial area west of the community and northeast of the large railyard. This separation of zones allowed for a comparison of highway and railyard impacts north and south of these facilities, impacts of industrial activity to the west of the community, and the gradient of impacts within the community residential areas.
Fig. 6.

a) Armourdale mobile monitoring route divided into four zones to represent air quality impacts in multiple areas of the community relative to local air pollution sources; b) Box Plots showing air pollution distributions with winds from the North (Zone1 n = 4281; Zone2 n = 1325; Zone3 n = 12,625; Zone 4 n = 27,074); winds from the East (Zone1 n = 1155; Zone2 n = 310; Zone3 n = 3961; Zone4 n = 7306); winds from the South (Zone1 n = 1370; Zone2 n = 377; Zone3 n = 4512; Zone4 n = 9747); winds from the West (Zone1 n = 1370; Zone2 n = 377; Zone3 n = 4512). In the box plots, the solid line represents the median; the circle represents the mean; the bottom and top of the box plots represents the 25th percentile and 75th percentile, respectively; and whiskers above and below represent the 95th and 5th percentiles, respectively.
Winds from the north and from the south showed an impact from the interstate highway and the smaller railyard, with Zone 1 experiencing higher concentrations with winds from the south and Zone 2 with higher concentrations when winds are from the north. The Armourdale community typically experienced the lowest impacts during all wind directions, suggesting very localized effects from the sources adjacent to this community (e.g., light industrial facilities, highway, etc.). When winds come from the north (Fig. 6b), the highly skewed BC concentration distribution was likely influenced by a structural fire observed in Zone 2 on one of the measurement days, which would predominantly affect BC concentrations compared with NO2 and to a lesser extent UFP concentrations. During winds from the north, the NO2 and UFP medians of 6.2 ppb and 12,750 #/cc, respectively, were factors of 1.1 and 1.2 higher than Zone 1 showing minor impacts from the interstate and railyard. Winds from the south showed elevated concentrations in Zone 1 with median factors ranging from 1.1 (0.95 μg/m3) for BC to 2.8 (16.8 ppb) for NO2. The lower impact from traffic and railyard activities in Armourdale may be due to the configuration of the public roads used in the mobile monitoring route. The roads along this monitoring route were elevated above both the interstate highway and the smaller railyard, which would lessen the community air quality impacts from these sources as described in Baldauf et al. (2013). Alternatively, Zone 4 often experienced some of the highest impacts during all wind conditions, suggesting direct and fugitive emissions from industrial sources in this area had a significant impact within that zone, but did not impact the community greatly, as evident by lower Zone 3 measurements during winds from the west.
3.3. Highly spatially-resolved mobile monitoring
While comparing the distributions of air quality measurements within specific zones in each community provided insights on source impacts to community air quality, evaluating highly, spatially-resolved mobile measurements provided evidence of the location and extent of specific source impact and pollution gradients within each community. This level of assessment identifies hot spot locations with elevated pollutant concentrations, which can significantly impact both short and long-term air pollution exposures for nearby populations. The following sections provide a summary of median, 1-second air pollution measurements taken along each route for NO2 (see SI Figs. S5 and S6 for results of the BC and UFP measurements). Median values were used in the analysis in order to allow for the evaluation of all data collected, and not remove data points that may have been influenced by specific nearby vehicles like a truck on the road directly in front of the EV (as described in Section 3.1). While other research groups have attempted to identify these occurrences and remove these data points (e.g. Brantley et al., 2019; Apte et al., 2017), removing spikes in the data may also eliminate data points representing impacts from nearby sources of interest like the railyard and trucks operating around the distribution centers. Thus, the median provides a view of the relative differences in air quality measurements along the mobile monitoring routes, while preserving spikes in the measurements which may or may not be contributed by sources of interest in the study analysis. For the high-spatial analysis described below, grids of 50 by 50 m resolution were created and median values reported using all measurement data points collected by the EV within each grid cell. This process created spatially-resolved maps of median air pollution concentrations measured along each route for NO2, BC, and UFP for the entire duration of the study.
3.3.1. Turner
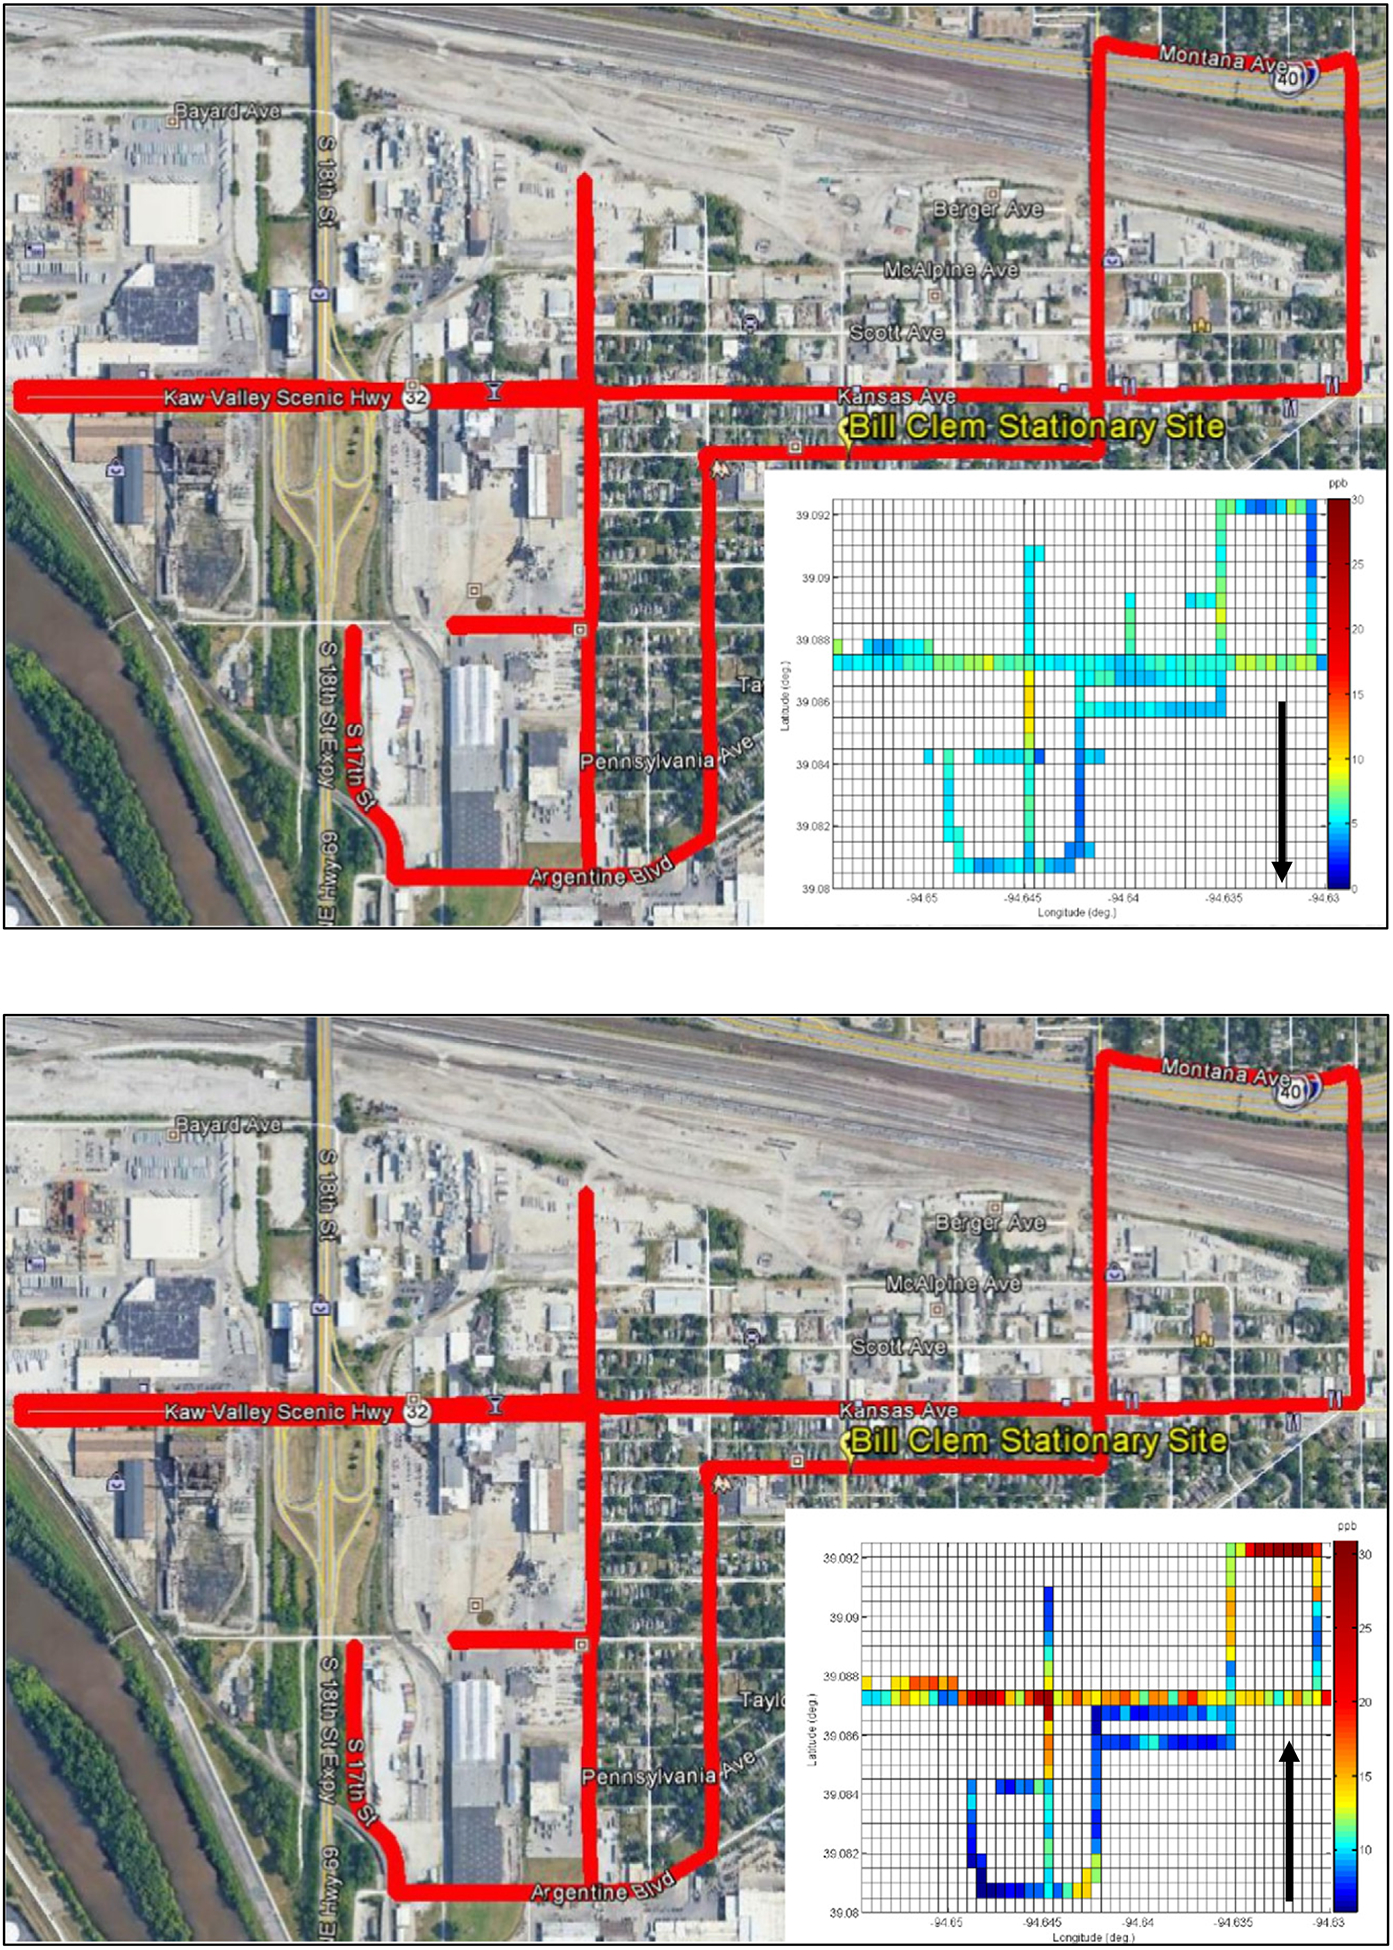
The evaluation of median measurements along the mobile monitoring route for winds from the north and from the south, respectively (shown in Fig. 7), highlight the contributions of multiple sources to air pollution levels within the Turner community. When winds are from the north, the Turner community south of the railyard experienced relatively higher NO2 concentrations than when winds came from the south, indicating the contribution of railyard activity to air quality in specific locations within the community. Similarly, winds from the south resulted in higher median measurements along Kansas Avenue (labeled “32” in Fig. 7) compared with winds from the north, again showing an impact from the railyard at locations adjacent to the facility. The higher concentrations along Kansas Avenue during winds from the south compared with winds from the north also show less of an air quality impact from the many distribution centers located in the northern section of this route, with the possible exception of facilities located along the eastern portion of the area where concentrations tended to be higher during all wind conditions. Examining the results of the measurements during winds from the south also highlight a small, but measurable, air pollution contribution from motor vehicles operating on I-635. As shown in Fig. 7b, relatively higher concentrations within 50–100 m (1 to 2 grid cells) of the highway can be identified at the locations within the Turner community south of the railyard where the mobile monitoring route crossed the highway. Increases in NO2 concentrations from the highway during winds from the north were less pronounced, presumably due to higher and more spatially broad impacts from the railyard within this portion of the community.
Fig. 7.
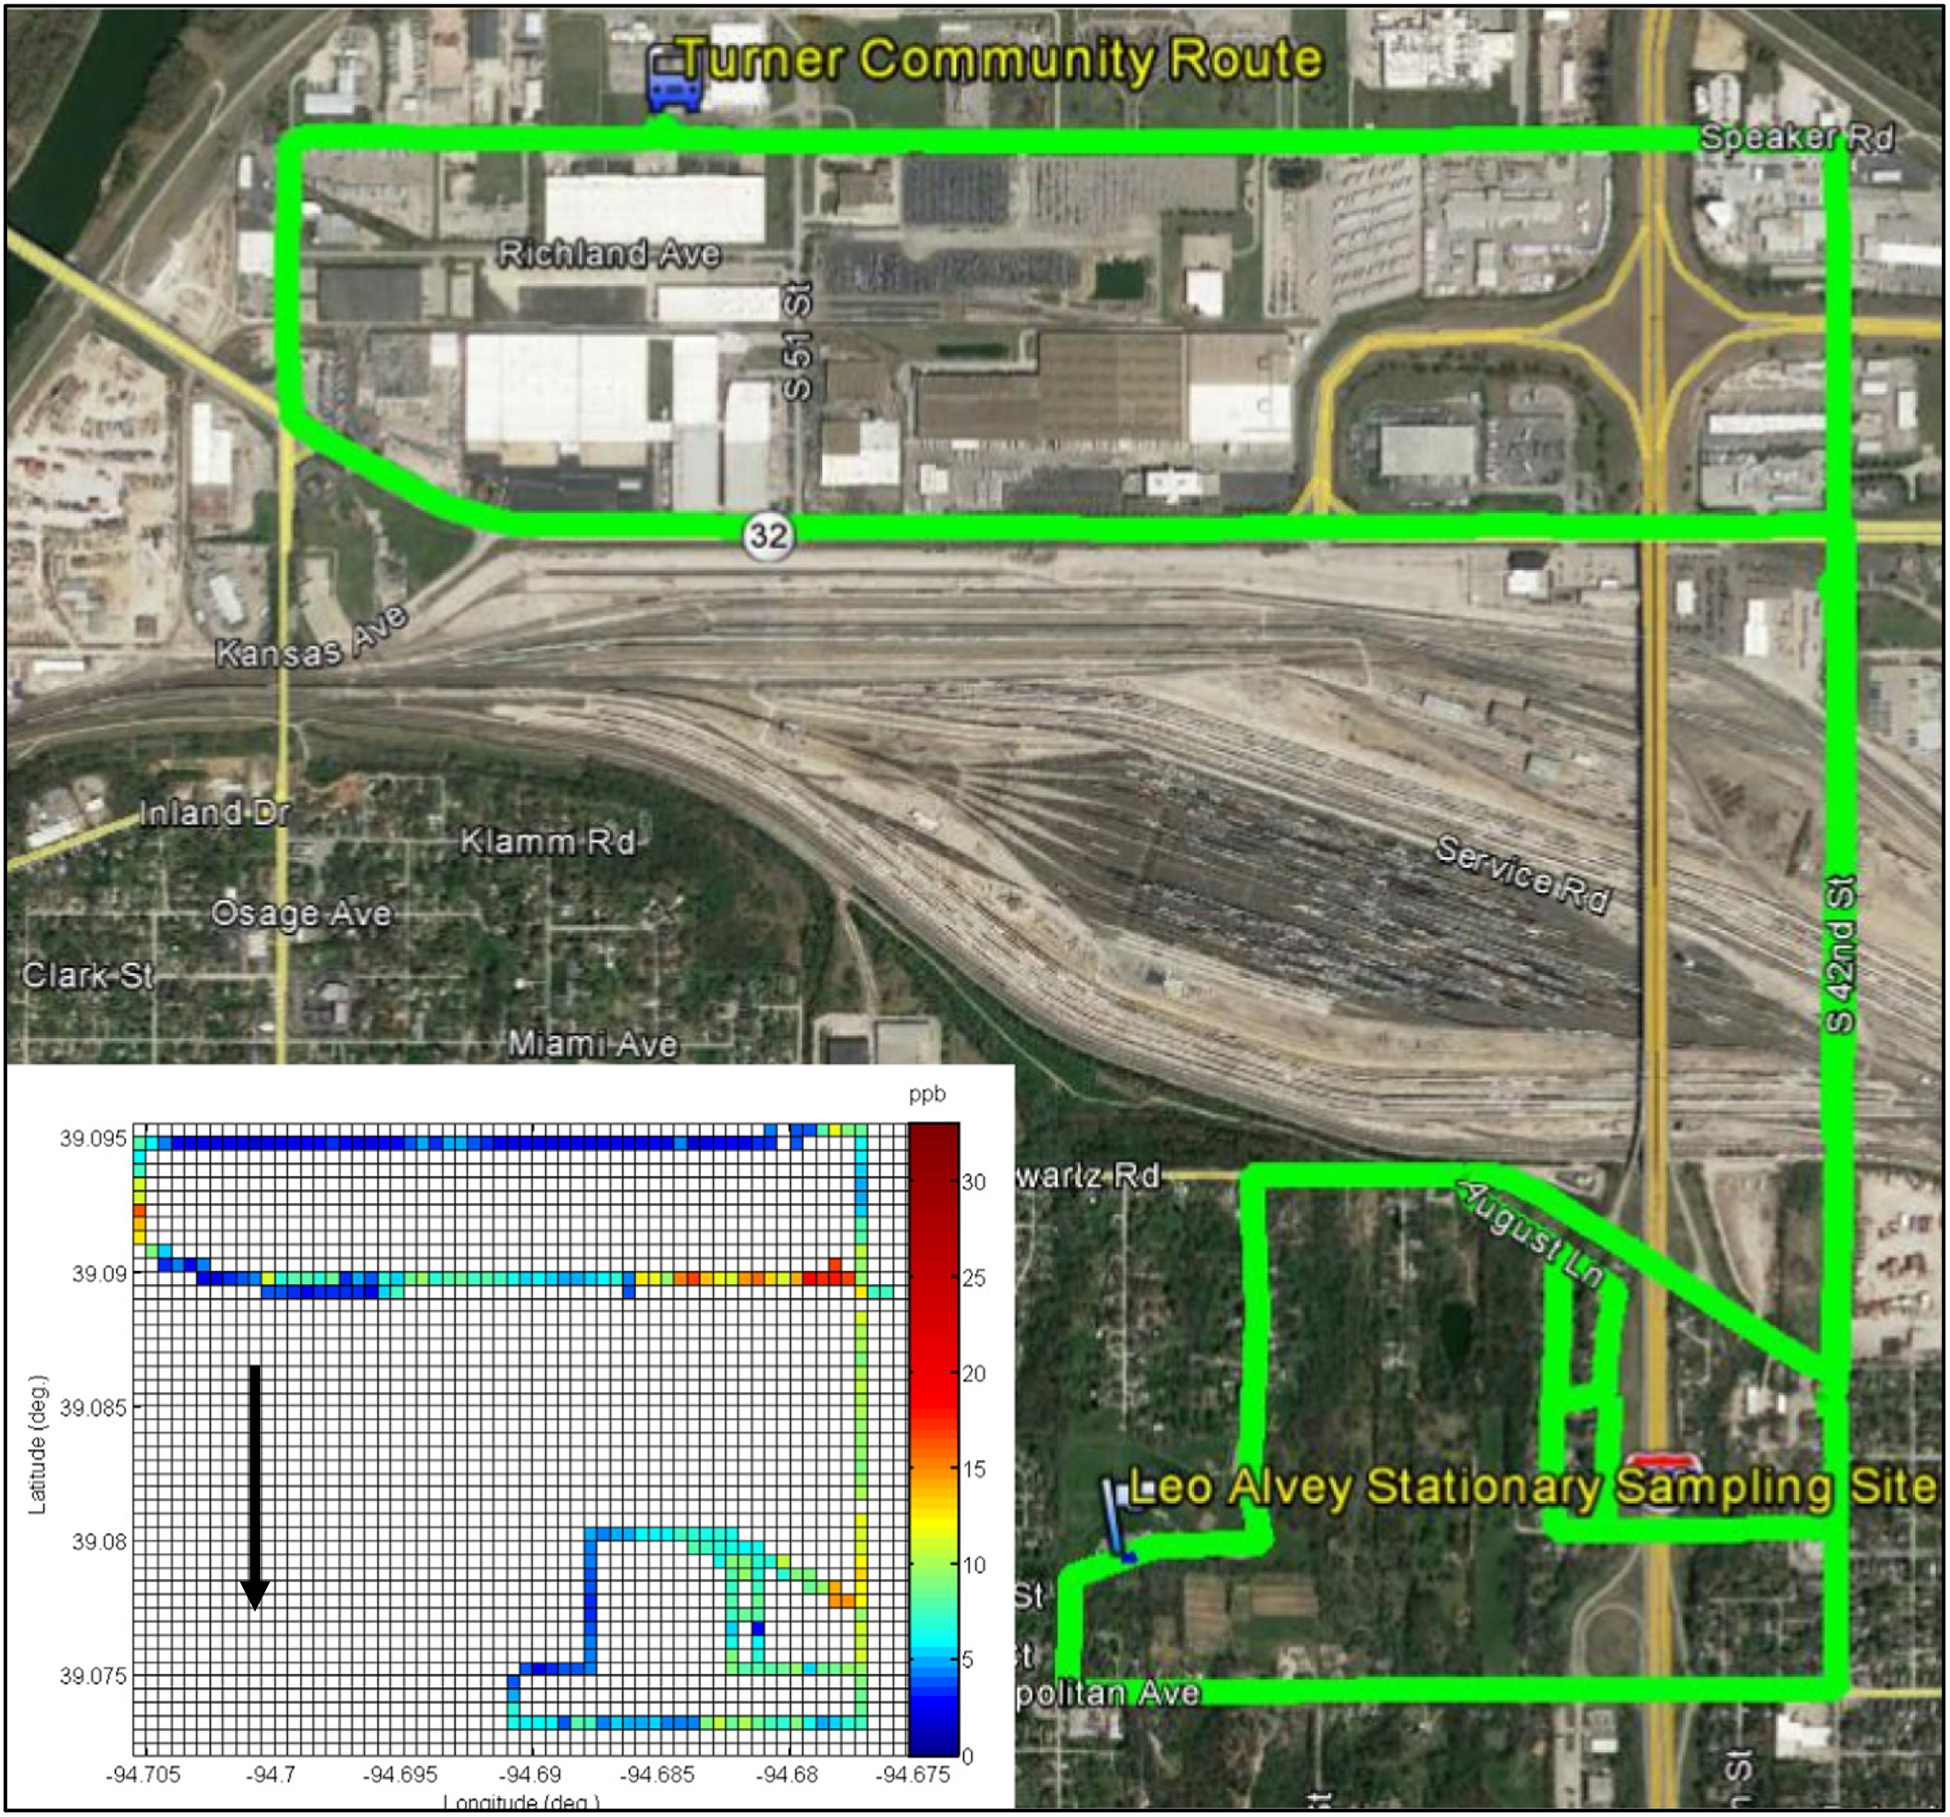
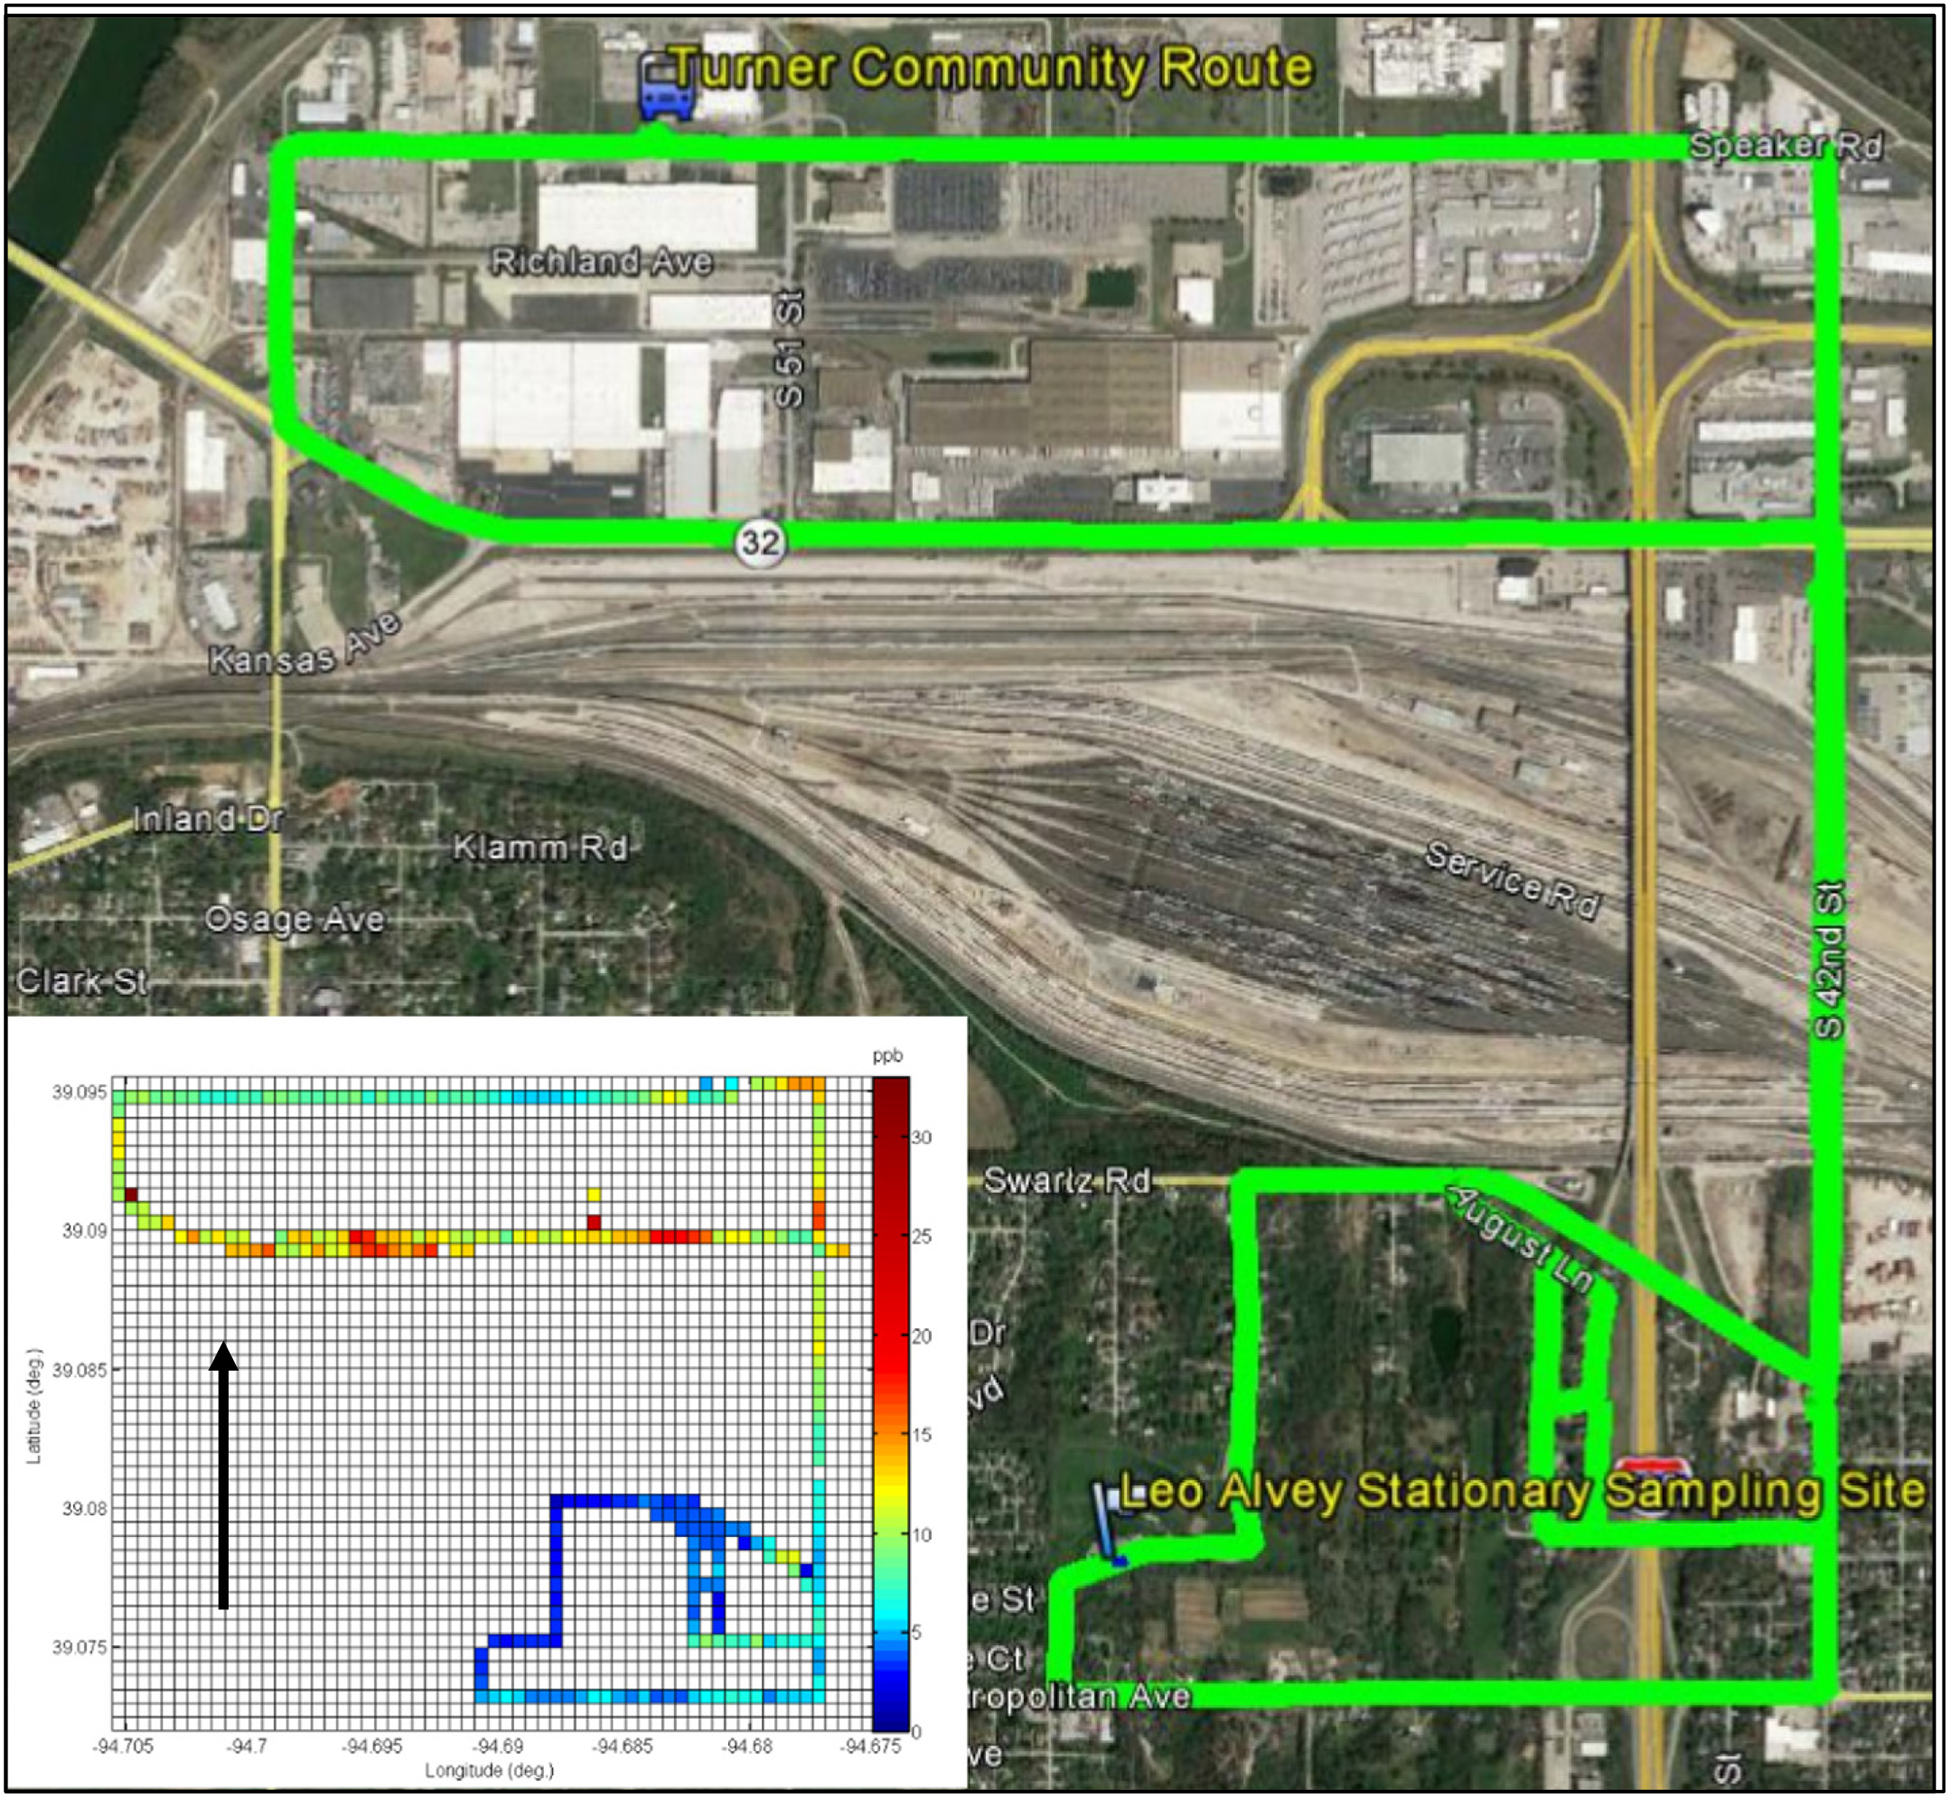
Turner NO2 median measurements with a) Winds from the North and b) Winds from the South. Black Arrow depicts wind direction.
3.3.2. Argentine
NO2 impacts from the railyard and maintenance facility activities can be seen in the results of the wind direction and high-spatial resolution assessment for Argentine. As shown in Fig. 8, median measurements were higher in the Argentine community south of the railyard and maintenance facility when winds were from the north, and alternatively, higher in the community north of the railyard when winds emanated from the south, with medians approximately 3 times higher downwind of the railyard/maintenance facility during these conditions. Elevated concentration gradients extended approximately 200 to 300 m downwind from the railyard under both wind directions. Fig. 8 also shows higher NO2 concentrations on the eastern portion of the community, which was closer to the maintenance facility location. However, note that the portion of the mobile route crossing the railyard on the western side of the community used an elevated bridge, which would result in lower air pollution impacts compared with ground-level measurements. Evaluation of the median NO2 measurements for Argentine also indicate no other sources significantly impacted local air pollutant concentrations during the study.
Fig. 8.
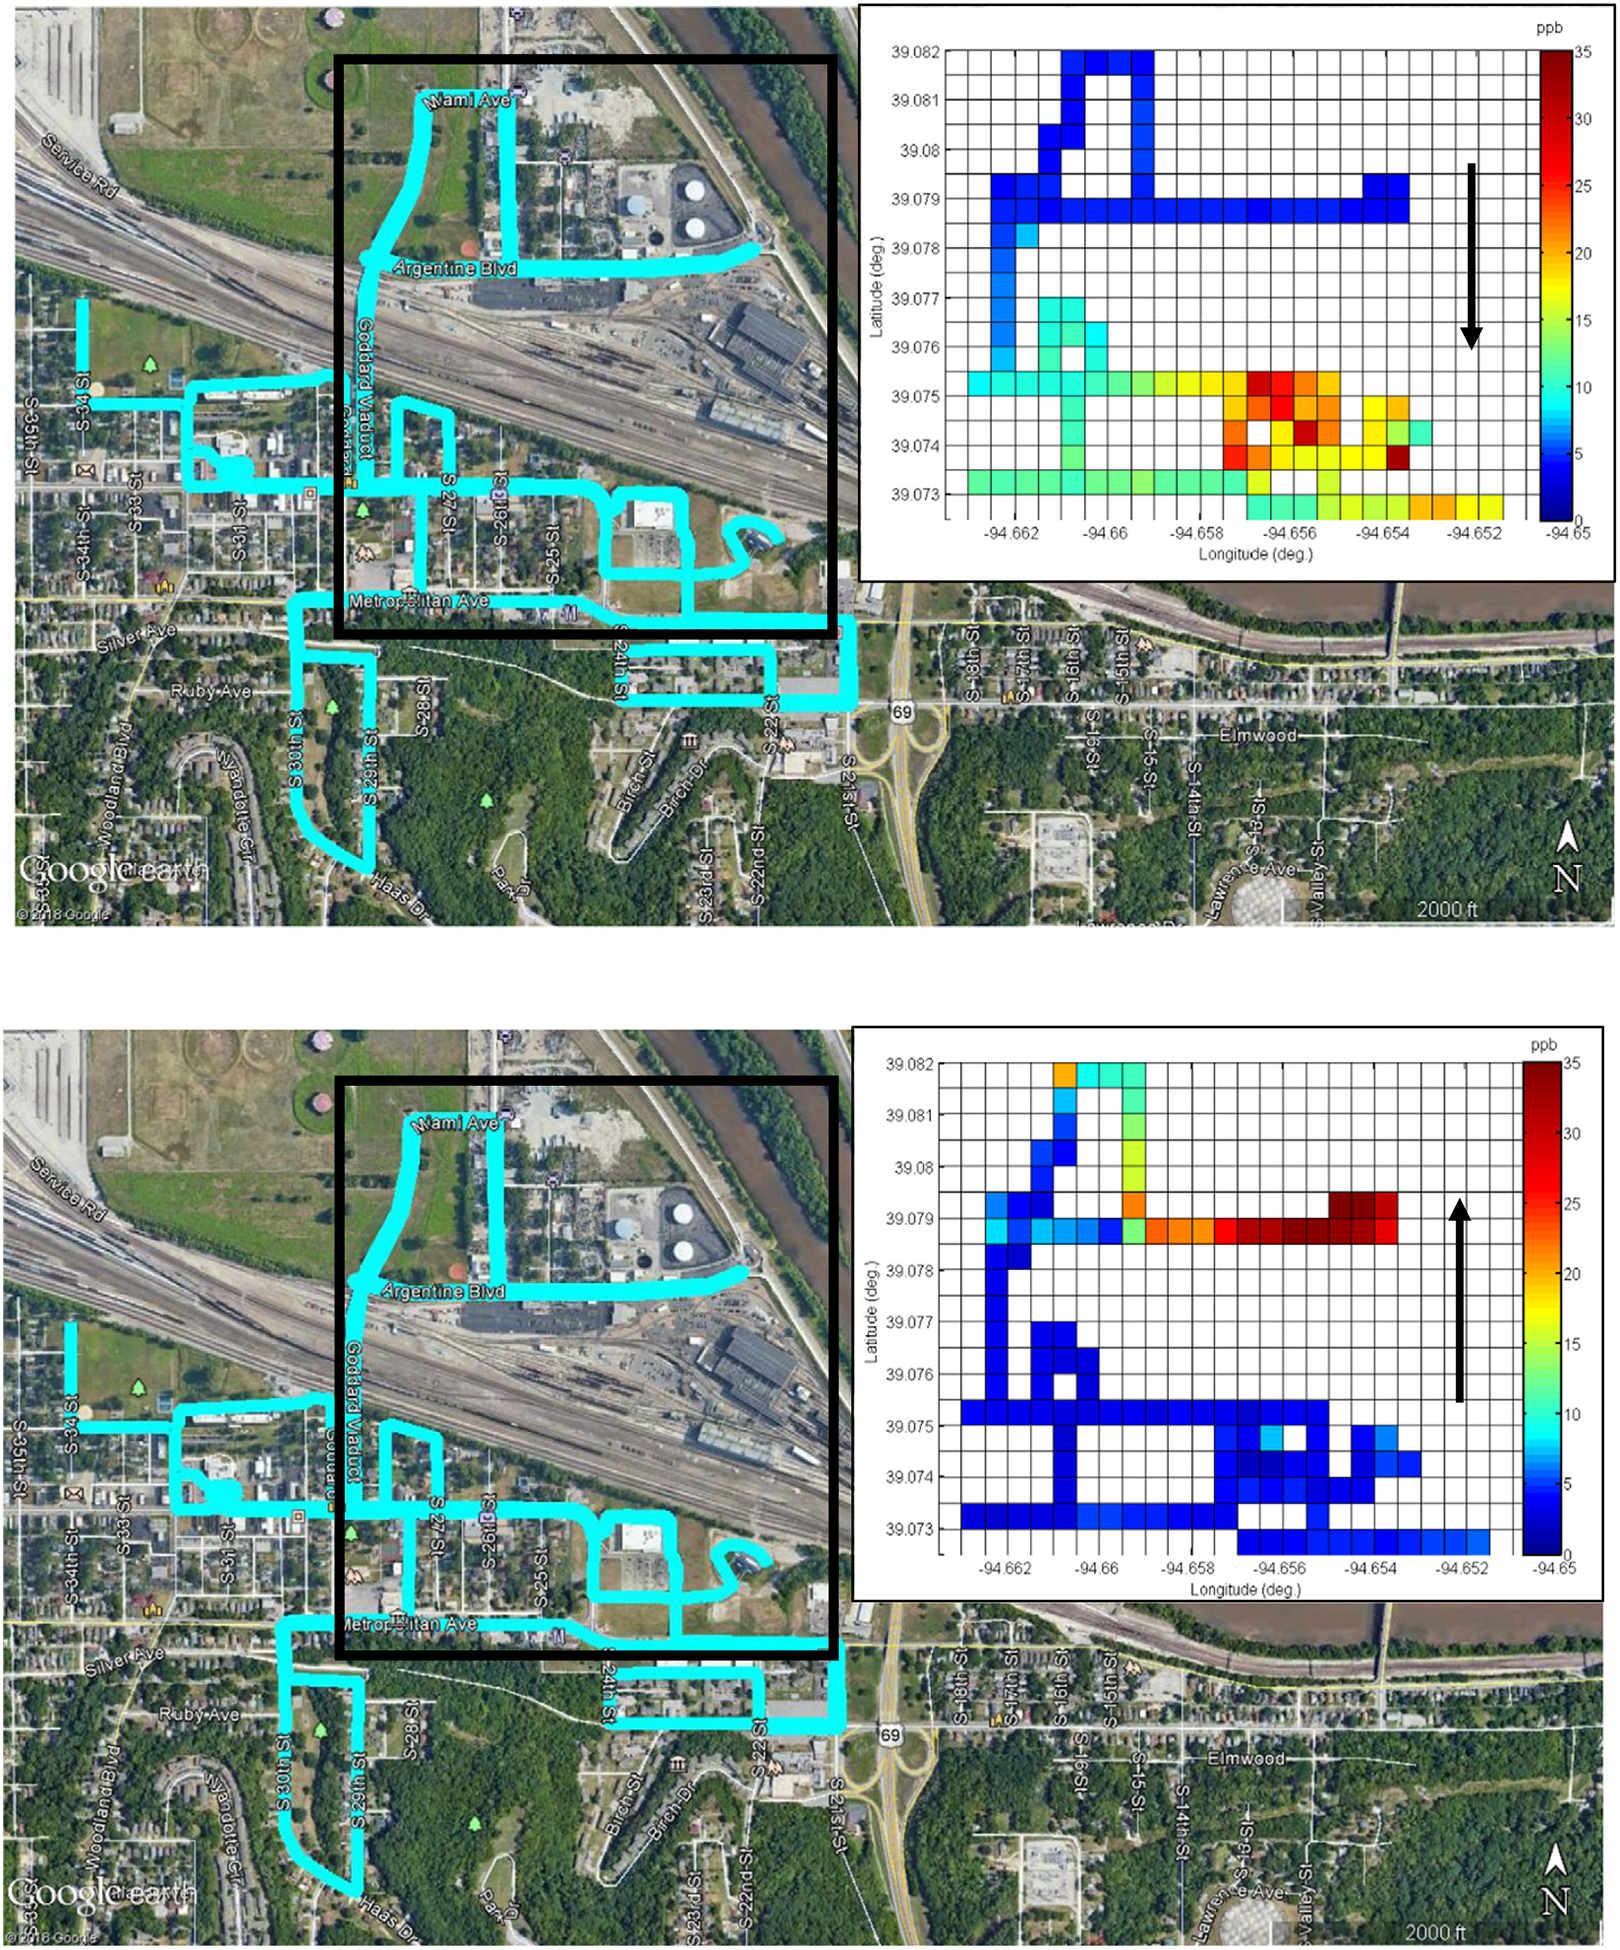
Argentine NO2 concentration Map. a) Winds from the North b) Winds from the South. Black Arrow depicts wind direction.
3.3.3. Armourdale
Comparison of NO2 concentrations during north and south winds in Armourdale showed a relatively significant difference in air quality levels as shown in Fig. 9. Winds from the north resulted in relatively low median concentration values in all parts of the community, suggesting that the highway and small railyard do not provide major contributions to local air pollution. However, winds from the south resulted in median pollution levels 3 or more times higher than during winds from the north. Winds from the south showed a strong impact from the highway, and potentially the smaller railyard, on the community to the north of these sources. The difference in pollutant impacts from the highway during changing wind directions can be explained by the elevation of the surrounding terrain. While the highway is below the surrounding terrain on both sides, the terrain is relatively closer to the highway grade to the north. In addition, the mobile monitoring route to the south of these sources was on top of a bridge above both the highway and railyard, which would enhance dilution of the emission plumes from these sources during winds from the north compared with the ground-level measurements to the north of the highway as discussed previously. The NO2 measurements during winds from the south also show that industrial sources located in the southwest portion of Armourdale contribute to air pollution levels within the community. Fig. 9 shows median concentrations along Kansas Avenue and were 3 times higher during winds from the south compared with winds from the north. The low median NO2 concentrations during winds from the north indicate that the median values obtained from the mobile monitoring were not highly impacted by nearby vehicles on the road. Thus, the large difference in median values between winds from the north and winds from the south was more likely due to impacts from the industrial activities nearby, although impacts from the larger railyard and maintenance facility in Armourdale during winds from the south cannot be ruled out.
Fig. 9.
Armourdale NO2 concentration map. a) Winds from the North b) Winds from the South. Black Arrow depicts wind direction.
4. Conclusions
Mobile monitoring provides the ability to conduct high, spatially-resolved air quality characterization in an area of interest. This monitoring technique can enhance air quality assessments by expanding the number of locations sampled along with understanding temporal changes in pollutant concentrations. These data can be especially useful in understanding how local sources and environmental conditions impact community-level air quality. This mobile monitoring data can be used to evaluate air pollution impacts and population exposures from very micro-scales to between community variability depending on data needs and objectives. To investigate community air pollution variability and how local air pollution sources affect pollutant variability, mobile monitoring was conducted in the Kansas City, Kansas metropolitan area with a focus on NO2, BC, and UFP measurements. Results showed that variability in pollutant concentrations could be as much as nine times different depending on factors such as location, distance from sources and wind direction. Evaluating impacts during certain wind conditions also showed that some local sources contributed to these high relative levels of air pollution within the community, and the extent of these impacts could be as much as 300 m from the air pollution source. Identifying the range and extent of this air pollution variability within these communities was only possible through mobile monitoring since the ability to operate a sufficient number of fixed-site monitors would not be economically feasible. The results from this study provide an understanding of air pollution variability within a community, which sources contribute to this concentration variability, and which can be used to identify appropriate and cost-effective air pollution mitigation strategies. This study also highlights how mobile monitoring can be used to identify community air quality and air pollution source impacts. Future analyses will focus on evaluating seasonal and other temporal factors on the local air quality in the study area, and comparisons of mobile and fixed-site measurements to assess the temporal and spatial variability of air pollution impacts from the local sources in this complex urban environment.
Supplementary Material
HIGHLIGHTS.
Mobile monitoring provided spatially-resolved air quality data in a complex urban area.
Mobile sampling identified how transport source contributed to local pollution variability.
Combining meteorology and mobile monitoring identified key source impacts.
Community hot spots were over an order of magnitude higher than background.
Knowledge of source impacts needed to design effective pollution control strategies.
Acknowledgments
The U.S. Environmental Protection Agency, through its Office of Research and Development, funded the research described here under Contract No. EP-C-15-008 to Jacobs Technology, Inc. and Contract No. EP-C-16-0016 to RTI International.
Footnotes
Declaration of competing interest
The authors declare that they have no known competing financial interests or personal relationships that could have appeared to influence the work reported in this paper.
Publisher's Disclaimer: Disclaimer
Publisher's Disclaimer: This document has been reviewed in accordance with the US Environmental Protection Agency policy and approved for publication. Mention of trade names or commercial products does not constitute endorsement or recommendation for use. The views expressed in this journal article are those of the authors and do not necessarily reflect the views or policies or the U.S. Environmental Protection Agency.
Appendix A. Supplementary data
Supplementary data to this article can be found online at https://doi.org/10.1016/j.scitotenv.2020.136979.
References
- Apte JS, Messier KP, Gani S, Brauer M, Kirchsteter TW, Lunden MM, 2017. High-resolution air pollution mapping with google street view cars: exploiting big data. Environ. Sci. & Technol 51 (12), 6999–7008. 10.1021/acs.est.7b00891. [DOI] [PubMed] [Google Scholar]
- Baldauf R, Thoma E, Hays M, Shores R, Kinsey J, Gullett B, Kimbrough S, Isakov V, Long T, Snow R, Khlystov A, Weinstein J, Chen FL, Seila R, Olson D, Gilmour I, Cho SH, Watkins N, Rowley P, Bang J, 2008. Traffic and meteorological impacts on near-road air quality: summary of methods and trends from the Raleigh near-road study. J Air Waste Manag Assoc 58, 865–878. 10.3155/1047-3289.58.7.865. [DOI] [PubMed] [Google Scholar]
- Baldauf R, Watkins N, Heist D, Bailey C, Rowley P, Shores R, 2009. Near-road air quality monitoring: Factors affecting network design and interpretation of data. Air Qual. Atmos. Health 2, 1–9. 10.1007/s11869-009-0028-0. [DOI] [Google Scholar]
- Baldauf RW, Heist D, Isakov V, Perry S, Hagler GSW, Kimbrough S, Shores R, Black K, Brixey L, 2013. Air quality variability near a highway in a complex urban environment. Atmos. Environ 64, 169–178. 10.1016/j.atmosenv.2012.09.054. [DOI] [Google Scholar]
- Baldauf RW, Isakov V, Deshmukh P, Venkatram A, Yang B, Zhang KM, 2016. Influence of solid noise barriers on near-road and on-road air quality. Atmos. Environ 129, 265–276. [Google Scholar]
- Brantley HL, Hagler GS, Herndon SC, Massoli P, Bergin MH, Russell AG, 2019. Characterization of spatial air pollution patterns near a large railyard area in Atlanta, Georgia. Int. J. Environ. Res. Public Health 16, 535. [DOI] [PMC free article] [PubMed] [Google Scholar]
- Deshmukh P, Isakov V, Venkatram A, Yang B, Zhang KM, Logan R, Baldauf R, 2019. The effects of roadside vegetation characteristics on local, near-road air quality. Air Qual. Atmos. Health 12 (3), 259–270. [PMC free article] [PubMed] [Google Scholar]
- Hagler GSW, Thoma ED, Baldauf RW, 2010. High-resolution mobile monitoring of carbon monoxide and ultrafine particle concentrations in a near-road environment. J Air Waste Manag Assoc 60, 328–336. 10.3155/1047-3289.60.3.328. [DOI] [PubMed] [Google Scholar]
- HEI, 2010. Traffic-related Air Pollution: A Critical Review of the Literature on Emissions, Exposure, and Health Effects. vol, edn. Health Effects Institute, Boston, MA. [Google Scholar]
- HEI, 2018. State of Global Air 2018: A Special Report on Global Exposure to Air Pollution and its Disease Burden. Health Effects Institute, Boston, MA: Available online at: https://www.stateofglobalair.org/sites/default/files/soga-2018-report.pdf. [Google Scholar]
- Karner AA, Eisinger DS, Niemeier DA, 2010. Near-roadway air quality: synthesizing the findings from real-world data. Environ Sci Technol 44, 5334–5344. 10.1021/es100008x. [DOI] [PubMed] [Google Scholar]
- Kimbrough S, Krabbe S, Baldauf R, Barzyk T, Brown M, Brown S, Croghan C, Davis M, Deshmukh P, Duvall R, Feinberg S, Isakov V, Logan S, McArthur T, Shields A, 2019. The Kansas City transportation and local-scale air quality study (KC-TRAQS): integration of low-cost sensors and reference grade monitoring in a complex metropolitan area. Part 1: overview of the project. Chemosphere 7, 26 10.3390/chemosensors70200. [DOI] [PMC free article] [PubMed] [Google Scholar]
- Steffens J, Kimbrough S, Baldauf R, Isakov V, Brown R, Powell A, Deshmukh P, 2017. Near-port air quality assessment utilizing a mobile measurement approach. Atmos Pollut Res 10.1016/j.apr.2017.04.003. [DOI] [PMC free article] [PubMed] [Google Scholar]
- U.S. Census Bureau, 2007. American housing survey for the United States: 2007. http://www.census.gov/prod/2008pubs/h150-07.pdf.
- Zhou Y, Levy JI, 2007. Factors influencing the spatial extent of mobile source air pollution impacts: a meta-analysis. BMC Public Health 22 7, 89 10.1186/1471-2458-7-89. [DOI] [PMC free article] [PubMed] [Google Scholar]
- Zhu Y, Hinds WC, Kim S, Sioutas C, 2002. Concentration and size distribution of ultrafine particles near a major highway. Journal of Air and Waste Management Association 52, 1032–1042. [DOI] [PubMed] [Google Scholar]
Associated Data
This section collects any data citations, data availability statements, or supplementary materials included in this article.