

Abstract
Aims
Air pollution [i.e. particulate matter with diameter <2.5 μm (PM2.5)] is a risk factor for major adverse cardiovascular events (MACE). While PM2.5 promotes leucopoiesis and atherosclerotic inflammation in experimental models, it is unknown whether this occurs in humans. We tested in humans (a) whether PM2.5 associates with higher leucopoietic tissue activity and arterial inflammation (ArtI), (ii) whether these associations persist after accounting for the effects of potential confounders including socioeconomics, traffic noise, and risk factors, and (iii) whether these tissue effects mediate the association between air pollution and MACE.
Methods and results
Individuals (N = 503) without cardiovascular disease (CVD) or active malignancy underwent 18 F-fluorodeoxyglucose positron emission tomography/computed tomography. Major adverse cardiovascular event was adjudicated over 5 years of follow-up. Leucopoietic tissue activity (in bone marrow and spleen) as well as ArtI were measured. Annual PM2.5 levels were assessed at each individual’s home address. At baseline, higher PM2.5 associated with increased leucopoietic activity [standardized (95% CI): 0.129 (0.042, 0.215), P = 0.004] as well as ArtI [0.088 (0.006, 0.171), P = 0.036] after adjusting for CVD risk factors. Over a median 4.1 years, 40 individuals experienced MACE. PM2.5 exposure associated with MACE [Cox HR (95% CI): 1.404 (1.135, 1.737), P = 0.002], remaining significant after adjustment for CVD risk factors and other potential confounders. Mediation analysis demonstrated that increased leucopoietic activity and ArtI serially mediate the link between PM2.5 exposure and MACE.
Conclusions
Higher air pollution exposure associates with heightened leucopoietic activity and ArtI and independently predicts MACE through a biological pathway that includes higher leucopoietic activity and ArtI in series.
Keywords: Air pollution, Arterial inflammation, Leucopoietic activity, Cardiovascular disease, 18F-FDG-PET/CT
Graphical Abstract

The hypothesized mechanism linking air pollution exposure to major adverse cardiovascular disease events through an up-regulated leucopoietic-arterial axis (solid red arrows).
See page 773 for the editorial comment on this article (doi: 10.1093/eurheartj/ehaa1020)
Introduction
Air pollution is a pervasive environmental hazard that substantially contributes to cardiovascular disease (CVD).1–4 Particulate matter air pollution <2.5 µm in diameter (PM2.5) is the dominant component linking air pollution to CVD events.1 , 2 , 4 , 5 According to the Global Burden of Disease study, exposure to ambient PM2.5 caused 4.2 million deaths (7.6% of all deaths) in 2015 with >50% due to CVD.1 , 6 More recent estimates attribute even greater mortality to air pollution with continuing risk at levels well below United States National Air Quality guidelines.7 While multiple studies have shown that PM2.5 exposure increases CVD risk, the independence from confounders and mechanistic underpinnings of this relationship are incompletely defined.5 , 8 An improved understanding of the pathobiological mechanisms and simultaneous assessment of potential confounders may offer new opportunities to curb the burden of pollution-related CVD.
Prior studies provide important clues about the mechanism by which pollution potentiates CVD.3 Pollution incites several pro-atherogenic pathways, in part by promoting inflammation and oxidative stress.1 , 8 Mediators of oxidative stress (e.g. free radicals), generated either directly by air particulate compounds or in response to biological intermediates (e.g. modified phospholipids), trigger local and systemic inflammatory responses.1 , 5 In animal models, the resultant oxidized phospholipid-enriched, pro-inflammatory milieu increases atherosclerotic plaque burden and hastens atherosclerotic inflammation.1 , 9 Further, animal studies have shown that air pollution augments production and release of leucopoietic cells from the bone marrow (BM), providing a greater cache of cells for inflaming the evolving atheroma.10 Despite this abundant animal evidence supporting the role of heightened leucopoiesis and atherosclerotic inflammation in PM2.5-mediated CVD, the degree to which this occurs in humans is unknown.
Accordingly, we sought to evaluate the role of leucopoiesis and atherosclerotic inflammation in linking air pollution (particularly PM2.5) exposure to CVD in humans. To do so, we leveraged 18F-fluorodeoxyglucose positron emission tomography/computed tomography (18F-FDG-PET/CT) imaging, which uses a radioactive glucose analogue to simultaneously assess the metabolic activities of multiple tissues, including leucopoietic tissues (i.e. BM and spleen to provide an index of leucopoietic activity) and the arterial wall [to provide a validated measure of atherosclerotic inflammation, arterial inflammation (ArtI)].11 , 12 Using this approach, several studies have shown that both increased leucopoietic activity and ArtI are important precursors to major adverse cardiovascular events (MACE).11–13 Accordingly, we tested the hypotheses in humans that:
PM2.5 exposure independently associates with leucopoietic tissue activities and ArtI,
PM2.5 exposure independently associates with MACE after adjustments for important potential confounders: noise exposure, socioeconomic status, healthcare access, malignancy and malignancy treatment history, statin therapy, and traditional CVD risk factors, and
the association between high PM2.5 exposure and MACE is serially mediated by heightened leucopoietic activity and ArtI.
Methods
Study cohort selection
The study employed a retrospective, longitudinal, observational design. The cohort (N = 503) was identified from a database of 2143 patients without active oncologic disease at the time of imaging and throughout follow-up who underwent clinical 18F-FDG-PET/CT imaging at the Massachusetts General Hospital (Boston, MA, USA) from 2005 to 2008 (Figure 1). Pre-defined inclusion criteria are provided (Supplementary material online). The study was approved by the Partners Human Research Committee.
Figure 1.

Subject selection. CT, computed tomography; CVD, cardiovascular disease; FDG, fluorodeoxyglucose; MACE, major adverse cardiovascular event; MGH, Massachusetts General Hospital; PET, positron emission tomography.
18F-fluorodeoxyglucose positron emission tomography/computed tomography imaging protocol
Whole body 18F-FDG-PET/CT imaging was performed with a standard integrated PET/CT scanner (e.g. Biograph 64 Siemens Healthcare, Erlangen, Germany). Further details are provided (Supplementary material online).
Measurement of arterial inflammation and leucopoietic activity
Arterial inflammation as well as BM and splenic (i.e. leucopoietic) activities were measured using previously validated methods (Figure 2).11 , 13 Briefly, ArtI was assessed by measuring the 18F-FDG signal within the wall of the ascending aorta from 1 cm above the aortic annulus in the axial plane and every 3 mm to the aortic arch. The maximum derived standardized uptake values (SUVs) per slice were averaged and then adjusted for mean background venous blood activity from the superior vena cava (SVC) to calculate a target-to-background ratio (TBR). Additional details are provided (Supplementary material online). Similarly, BM activity was assessed by quantifying the average of the maximum SUVs from regions of interest (ROIs) in the vertebral bodies (T1–L5), and splenic activity was assessed by deriving the average of the maximum SUVs from five ROIs in the spleen. Both BM and splenic activities were corrected for mean SVC activity to yield TBRs.
Figure 2.
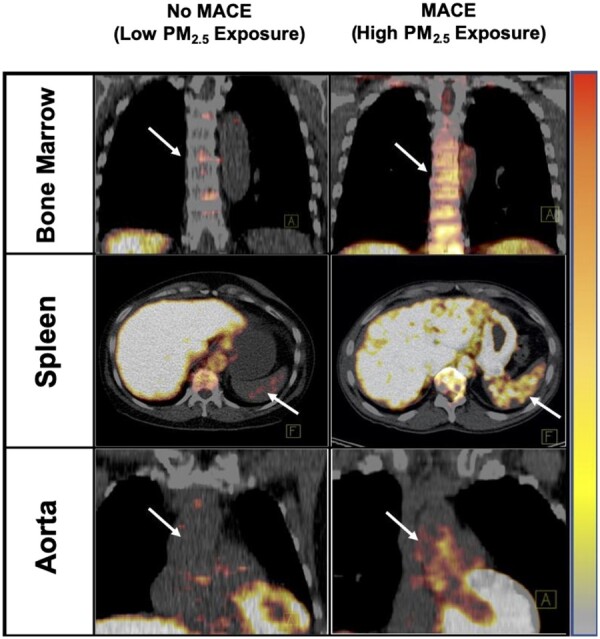
Tissue activities on 18F-FDG-PET/CT by PM2.5 exposure (≥ vs. < population median). Axial views of the spleen (middle) and coronal views of the bone marrow (top) and aorta (bottom) are shown. Tissue 18F-FDG uptake was increased in individual with increased PM2.5 exposure and major adverse cardiovascular event (left) vs. an individual with lower PM2.5 and no major adverse cardiovascular event (right). MACE, major adverse cardiovascular event; PM, particulate matter.
Assessment of ambient air pollution, environmental, socioeconomic, and cardiovascular disease risk factors
Residential addresses were obtained from medical records. Annual average 24-h PM2.5 levels were evaluated using each individual’s home address and the United States (US) Environment Protection Agency Air Quality System Data Mart for 2017 (the year with the most complete data for our cohort). Data were obtained from the air quality monitor closest to each participant’s residence that was active for the entire year (https://www.epa.gov).14 In supplemental analyses, air pollution was also quantified as an annual average 24-h PM2.5 level of measurements from the closest monitor from 1 year before through 2 years after index imaging for participants with available data. Health insurance status, in-state residency, and traditional CVD risk factors were derived from the medical record. Additional information, including descriptions of the derivations of socioeconomic and noise data, is included (Supplementary material online).
Adjudication of outcome events
Using clinical records, event adjudication was performed by two cardiologists blinded to imaging data (Supplementary material online). Major adverse cardiovascular event was defined as a composite of cardiovascular death, congestive heart failure, non-fatal myocardial infarction, unstable angina, peripheral artery disease event, coronary or peripheral revascularization, or cerebrovascular accident within 5 years of index imaging.12 Participants were censored upon their first MACE event or last available clinic visit note.
Statistical analyses
Statistical analyses were performed using SPSS (Version 26, IBM Corporation, Armonk, NY, USA). Continuous variables are provided as mean and standard deviation (SD), or when skewed, as median and interquartile range (IQR). For analysis, air pollution levels were represented as a standardized continuous variable and were additionally categorized into population quantiles (e.g. quartiles and median). In a supplemental analysis, air pollution levels were stratified into tertiles, and using a Receiver Operating Curve-derived cut-off value (i.e. the Youden index). Associations between air pollution and other variables (including tissue activities) were evaluated using adjusted and unadjusted linear regression models, yielding β with 95% confidence intervals (CIs). To evaluate odds ratios (ORs), hazard ratios (HRs) and event-free survival, logistic regression, Cox models, and Kaplan–Meier log-rank tests were employed, respectively. Mediation analysis was performed with the SPSS PROCESS macro (IBM Corporation, Armonk, NY, USA), to test the roles of leucopoietic activity and ArtI in linking air pollution exposure to MACE. Statistical significance was determined as a two-tailed P-value <0.05 for all analyses. Further statistical details are provided (Supplementary material online).
Results
Baseline characteristics
A total of 503 individuals were included [median age (IQR) 55 (45–66) years, 42.0% male]. Individuals who developed subsequent MACE (N = 40) had a higher prevalence of several CVD risk factors vs. those without MACE (Table 1). Moreover, those with subsequent MACE had lower socioeconomic status, greater noise exposure, and as hypothesized, greater PM2.5 exposure. Associations between annual PM2.5 exposure and environmental, socioeconomic, healthcare access, malignancy and malignancy treatment history, and CVD risk factors were evaluated (Supplementary material online, Table S1). Higher PM2.5 exposure associated with higher noise exposure, lower socioeconomic status, and a lower likelihood of having health insurance.
Table 1.
Baseline characteristics of participants grouped by occurrence of major adverse cardiovascular event within 5 years of 18F-fluorodeoxyglucose positron emission tomography/computed tomography imaging
| Variables | Full cohort (N = 503) | No MACE (N = 463) | MACE (N = 40) | P -value | Cox HR (95% CI) | Cox P -value | ||
|---|---|---|---|---|---|---|---|---|
| Demographics | Median age, years (IQR) | 55 | 54 | 67.5 | <0.001 | 2.986 | <0.001 | |
| (45–66) | (44–65) | (61–78) | (2.087, 4.273)a | |||||
| Male sex | 210 | 194 | 16 | 0.815 | 0.948 | 0.868 | ||
| (41.7%) | (41.9%) | (40.0%) | (0.503, 1.784) | |||||
| White race | 456 | 420 | 36 | 0.780 | 0.934 | 0.897 | ||
| (90.7%) | (90.7%) | (90.0%) | (0.332, 2.625) | |||||
| Cardiovascular risk factors | Current smoker | 54 | 43 | 11 | 0.002 | 3.119 | 0.001 | |
| (10.7%) | (9.3%) | (27.5%) | (1.557, 6.250) | |||||
| Hypertension | 175 | 150 | 25 | <0.001 | 3.237 | <0.001 | ||
| (34.9%) | (32.4%) | (62.5%) | (1.706, 6.140) | |||||
| Diabetes mellitus | 44 | 36 | 8 | 0.016 | 2.551 | 0.018 | ||
| (8.8%) | (7.8%) | (20.0%) | (1.175, 5.538) | |||||
| Hyperlipidaemia | 140 | 124 | 16 | 0.075 | 1.789 | 0.072 | ||
| (27.9%) | (26.8%) | (40%) | (0.950, 3.369) | |||||
| Mean total cholesterol, mg/dL (SD) | 191.15 | 192 | 186.11 | 0.698 | 0.880 | 0.446 | ||
| (42.29) | (42.77) | (39.58) | (0.633, 1.223)a | |||||
| Mean LDL cholesterol, mg/dL (SD) | 110.31 | 110.71 | 108.03 | 0.972 | 0.952 | 0.768 | ||
| (36.84) | (37.34) | (34.193) | (0.685, 1.322)a | |||||
| Statin therapy | 100 | 84 | 16 | <0.001 | 2.803 | 0.001 | ||
| (19.9%) | (18.1%) | (40.0%) | (1.389, 5.227) | |||||
| Median Framingham risk score (IQR) | 3.00 | 2.00 | 8.00 | <0.001 | 2.043 | <0.001 | ||
| (1.00–.00) | (1.00–6.00) | (3.00–13.50) | (1.401, 2.979)a | |||||
| Median BMI, kg/m2 (IQR) | 26.54 | 26.30 | 27.13 | 0.510 | 1.177 | 0.485 | ||
| (23.41–30.05) | (23.30–31.09) | (24.69–30.77) | (0.745, 1.859)a | |||||
| Air pollution exposure | Annual PM2.5 exposure, mg/m3 (IQR) | 6.1 | 5.9 | 6.75 | 0.002 | 1.404 | 0.002 | |
| (4.6–7.6) | (4.6–7.6) | (5.43–8.8) | (1.135, 1.737)a | |||||
| Socioeconomic, environmental, and healthcare access factors | Environmental factors | Home transportation noise exposure > 55 dBA | 63 | 49 | 14 | <0.001 | 4.175 | <0.001 |
| (12.7%) | (10.6%) | (35%) | (2.178, 8.004) | |||||
| Straight-line distance between residence and nearest highway or major artery, miles (IQR) | 0.296 | 0.304 | 0.225 | 0.058 | 1.207 | 0.059 | ||
| (0.137–0.633) | (0.142–0.654) | (0.075–0.377) | (0.993, 1.466)a | |||||
| Urban status | 486 | 447 | 39 | 0.796 | 0.744 | 0.770 | ||
| (96.8%) | (96.8%) | (97.5%) | (0.102, 5.414) | |||||
| Socioeconomic factors | Loca median income, USD (IQR) | 78 191 | 79 540 | 76 527 | 0.024 | 0.668 | 0.025 | |
| (61 618–100 121) | (61 619–100 286) | (50 923–87 381) | (0.469, 0.951)a | |||||
| Median high school graduation rate, % (IQR) | 94 | 94.20 | 91.50 | 0.001 | 0.680 | 0.001 | ||
| (90.00–96.50) | (90.10–96.60) | (82.20–94.63) | (0.541, 0.856)a | |||||
| Median total local annual crimes (IQR) | 718 | 713 | 1327 | 0.144 | 1.221 | 0.151 | ||
| (303–1907) | (283.5–1907) | (369–1990) | (0.929, 1.604)a | |||||
| Healthcare access factors | Health insurance available at baseline | 440 | 414 | 26 | <0.001 | 0.172 | <0.001 | |
| (87.5%) | (89.4%) | (65.0%) | (0.089, 0.332) | |||||
| In-state residence | 440 | 402 | 38 | 0.134 | 2.771 | 0.160 | ||
| (87.5%) | (86.8%) | (95.0%) | (0.669, 11 488) | |||||
| Malignancy history | History of cancer | 422 | 398 | 24 | <0.001 | 0.287 | <0.001 | |
| (83.9%) | (86%) | (60.0%) | (0.152, 0.540) | |||||
| Previous chemotherapy or radiation | 380 | 362 | 18 | <0.001 | 0.259 | <0.001 | ||
| (75.5%) | (78.2%) | (45%) | (0.139, 0.484) | |||||
| Psychiatric history | History of depression or anxiety | 29 | 27 | 2 | 0.674 | 1.216 | 0.796 | |
| (9.6%) | (5.8%) | (5%) | (0.276, 5.353) | |||||
| Antidepressant drug use | 27 | 25 | 2 | 0.657 | 1.262 | 0.758 | ||
| (9.7%) | (5.4%) | (5%) | (0.287, 5.556) | |||||
Data are N (%), unless otherwise specified. Data regarding psychiatric conditions and medications available in 277 subjects. Bold values indicate P < 0.05.
HR, hazard ratio; IQR, interquartile range; LDL, low-density lipoprotein; MACE, major adverse cardiovascular event; SD, standard deviation.
Continuous predictor, standardized HRs provided.
PM2.5 exposure vs. leucopoietic activity
Annual average PM2.5 exposure was associated with increased BM and splenic activities [standardized β (95% CI): 0.129 (0.042, 0.215), P = 0.004 and 0.110 (0.021, 0.199), P = 0.015, respectively] in a model adjusted for CVD risk factors, race, body mass index (BMI), and statin use and remained significant after further adjustments (Table 2). Similar observations were made when average annual PM2.5 exposure was stratified by quartiles or the median (Table 2 and Figure 3, Supplementary material online, Table S2 and Figure S1) and in supplemental analyses using PM2.5 measurements obtained around the date of imaging (Supplementary material online, Table S3).
Table 2.
Associations between annual pollution (PM2.5) exposure and tissue activities
| Model predictors | Multivariable models | Tissue activities |
|||||
|---|---|---|---|---|---|---|---|
| Atherosclerotic inflammation |
Bone marrow activity |
Splenic activity |
|||||
| Standardized β (95% CI) | P-value | Standardized β (95% CI) | P-value | Standardized β (95% CI) | P-value | ||
| Air pollution (continuous annual PM2.5 exposure) | A | 0.073 | 0.103 | 0.099 | 0.035 | 0.098 | 0.039 |
| (−0.015, 0.161) | (0.007, 0.191) | (0.005, 0.191) | |||||
| B | 0.088 | 0.036 | 0.129 | 0.004 | 0.110 | 0.015 | |
| (0.006, 0.171) | (0.042, 0.215) | (0.021, 0.199) | |||||
| C | 0.089 | 0.044 | 0.124 | 0.008 | 0.101 | 0.033 | |
| (0.002, 0.176) | (0.032, 0.216) | (0.008, 0.194) | |||||
| Air pollution (quartiles of annual PM2.5 exposure) | A | 0.092 | 0.030 | 0.093 | 0.038 | 0.106 | 0.020 |
| (0.009, 0.176) | (0.005, 0.181) | (0.017, 0.194) | |||||
| B | 0.106 | 0.008 | 0.128 | 0.002 | 0.123 | 0.005 | |
| (0.027, 0.184) | (0.045, 0.210) | (0.038, 0.207) | |||||
| C | 0.097 | 0.016 | 0.124 | 0.003 | 0.117 | 0.006 | |
| (0.018, 0.175) | (0.041, 0.206) | (0.033, 0.200) | |||||
Model A: univariable.
Model B: adjusted for CVD risk factors (i.e. age, sex, current smoking, diabetes mellitus, hyperlipidaemia, hypertension), race, BMI, and statin use.
Model C (combines all multivariable models): adjusted for Model B and environmental and socioeconomic factors that differ between the groups of MACE vs. no MACE (i.e. noise exposure >55 dBA, local median income, median high school graduation rate, and baseline health insurance).
BMI, body mass index; CI, confidence interval; CVD, cardiovascular disease; PM, particulate matter. Significant P-values (P < 0.05) are bolded.
Figure 3.

Air pollution exposure (as quartiles) vs. bone marrow activity (A), splenic activity (B), and arterial inflammation (C). Models were adjusted for cardiovascular disease risk factors (i.e. age, sex, current smoking, diabetes, hyperlipidaemia, hypertension), race, body mass index, and statin use. Z-values for tissue activities are shown, wherein each unit change indicates a standard deviation difference in absolute values. Error bars represent standard error of the mean. CVD, cardiovascular disease.
PM2.5 exposure vs. arterial inflammation
Annual average PM2.5 exposure associated with increased ArtI [standardized β (95% CI): 0.088 (0.006, 0.171), P = 0.036] in a model adjusted for CVD risk factors, race, BMI, and statin use and remained significant after further adjustments (Table 2). Similar observations were made when annual PM2.5 exposure was stratified by quartiles or the median (Table 2 and Figure 3, Supplementary material online, Table S2 and Figure S1) and in supplemental analyses using PM2.5 measurements obtained around the date of imaging (Supplementary material online, Table S3).
Higher PM2.5 exposure independently predicts major adverse cardiovascular event risk and event-free survival
During a median follow-up period of 4.1 (IQR 2.96–5.00) years, 40 (8.0%) individuals developed incident MACE with 18 myocardial infarctions, 10 unstable angina presentations, 8 cerebrovascular accidents, and 4 peripheral artery disease revascularizations. Major adverse cardiovascular event risk was associated with several CVD risk factors, socioeconomic factors, noise exposure, lower healthcare access, and malignancy history (Table 1). Moreover, MACE risk was associated with PM2.5 exposure [standardized HR (95% CI): 1.404 (1.135, 1.737), P = 0.002]. That is, each standard deviation increase in air pollution exposure associates with a 40% increase in incident MACE. The attributable MACE risk remained significant through multivariable models that adjusted for CVD risk factors, race, BMI, statin use, socioeconomic factors, environmental factors, history of malignancy and malignancy treatment, and healthcare access (Table 3). Similarly, these associations remained significant when annual PM2.5 exposure was dichotomized about the population median (log-rank P-value = 0.009, Figure 4 and Table 3) or in supplemental analyses using other cut-off values (Supplementary material online, Figure S2) and PM2.5 measurements obtained around the date of imaging (Supplementary material online, Table S3).
Table 3.
Cox-proportional hazard ratios for major adverse cardiovascular event risk
| Co-variables | Air pollution (continuous annual PM2.5 exposure) |
Air pollution (≥ vs. < median annual PM2.5 exposure) |
|||
|---|---|---|---|---|---|
| HR [95% CI] | P -value | HR [95% CI] | P -value | ||
| Univariable | 1.404 | 0.002 | 2.435 | 0.012 | |
| (1.135, 1.737) | (1.216, 4.875) | ||||
| Multivariable models | |||||
| Demographics | Age, sex, and race | 1.413 | 0.011 | 2.160 | 0.030 |
| (1.081, 1.847) | (1.077, 4.333) | ||||
| CVD risk factors | CVD risk factorsb | 1.356 | 0.038 | 2.062 | 0.044 |
| (1.017, 1.808) | (1.021, 4.167) | ||||
| Statin therapyb | 1.404 | 0.014 | 2.117 | 0.035 | |
| (1.072, 1.839) | (1.055, 4.250) | ||||
| Socioeconomic, environmental, and healthcare access factors | Socioeconomic factorsb , c | 1.488 | 0.024 | 2.252 | 0.034 |
| (1.055, 2.099) | (1.065, 4.761) | ||||
| Environmental factorsb , d | 1.481 | 0.032 | 2.552 | 0.023 | |
| (1.034, 2.122) | (1.138, 5.727) | ||||
| Healthcare access factorsb , e | 1.442 | 0.019 | 2.133 | 0.034 | |
| (1.062, 1.958) | (1.060, 4.292) | ||||
| Malignancy-related factors | History of cancer and previous chemotherapy or radiationb | 1.354 | 0.037 | 2.047 | 0.045 |
| (1.018, 1.802) | (1.018, 4.117) | ||||
CI, confidence interval; CVD, cardiovascular disease; HR, hazard ratio; MACE, major adverse cardiovascular event; WHO, World Health Organization. Significant P-values (P < 0.05) are bolded.
Adjusted for CVD risk factors (i.e. age, sex, diabetes, hypertension, hyperlipidaemia, current smoking), race, and body mass index.
Also adjusted for age and sex.
Socioeconomic factors: local median income, local total crimes, and median high school graduation rate.
Environmental factors: home transportation noise exposure (>55 dBA), distance from nearest roadway (miles), and urban status.
Healthcare access factors: baseline health insurance and in-state residence.
Figure 4.

Kaplan–Meier major adverse cardiovascular event-free survival curves for individuals with (≥ vs. < population median) of annual PM2.5 exposure. The log-rank P-value is shown. MACE, major adverse cardiovascular event; PM, particulate matter.
The association between PM2.5 exposure and major adverse cardiovascular event is mediated via a leucopoietic-arterial pathway
We performed mediation analysis to test whether air pollution results in MACE via the pre-specified serial-mediator path of: ↑PM2.5 exposure→↑leucopoietic activity→↑ArtI→↑MACE. Single mediator analyses were performed to separately assess the roles of leucopoietic activity and ArtI in linking air pollution to MACE. These age- and sex-adjusted models were significant (Supplementary material online, Figure S3). Additionally, as shown previously, there was a strong independent association between leucopoietic activity and ArtI on the one hand, and ArtI and MACE on the other (Supplementary material online, Figure S4).12 Accordingly, we conducted serial mediation analysis of the path: ↑PM2.5 exposure→↑BM activity→↑splenic activity→↑ArtI→↑MACE (Figure 5). In this analysis, three distinct pathways predicted MACE:
Figure 5.

Mediation analyses for hypothesized pathways linking PM2.5 exposure and major adverse cardiovascular event. Serial three-mediator analyses testing the hypothesized indirect pathways (red, blue, and green arrows) and the direct effect (black arrow) of PM2.5 on major adverse cardiovascular event. CI, confidence interval; MACE, major adverse cardiovascular event; PM, particulate matter.
↑PM2.5 exposure→↑BM activity→↑splenic activity→↑ArtI→ ↑MACE: β (95% CI): 0.044 (0.008, 0.106), P < 0.05 (red arrows).
↑PM2.5 exposure→↑BM activity→↑ArtI→↑MACE: 0.015 (0.001, 0.047), P < 0.05 (blue arrows).
↑PM2.5 exposure→↑BM activity→↑MACE: 0.085 (0.004, 0.199), P < 0.05 (green arrows).
Collectively, these three indirect paths account for 29% of the relationship between ↑PM2.5 exposure and MACE [standardized log OR (95% CI): 0.146 (0.010, 0.346), P < 0.05] in an age- and sex-adjusted model.
Discussion
The current study implemented multi-system 18F-FDG-PET/CT imaging to provide novel insights into the mechanism linking air pollution to CVD risk in humans. We observed that higher pollution exposure associates with increased leucopoietic activity (i.e. BM and splenic activities) and heightened atherosclerotic inflammation. Furthermore, we found that even modestly elevated PM2.5 exposure associates with an increased risk of subsequent MACE after adjustments for important confounders including CVD risk factors, socioeconomic status, healthcare access, malignancy history, statin therapy, and environmental factors. Moreover, we observed that the link between air pollution and MACE may be mediated in part by a serial multi-organ pathway that involves heightened leucopoietic activity and increased ArtI.
The independent association between air pollution and major adverse cardiovascular event
Air pollution is a well-recognized inducer of atherosclerosis and driver of CVD events and mortality worldwide.3 , 6 Prior studies of this relationship vary greatly with regards to the duration and location of exposure, study population, and assessment of potential confounders.5 , 8 Accordingly, we sought to bridge several of these gaps by simultaneously accounting for many confounders and evaluating average annual PM2.5 exposure. Through these assessments, we confirmed a significant independent relationship between PM2.5 exposure and MACE.
The scale of the health hazards imposed by air pollution is considerable. Over 90% of the global population is exposed to levels exceeding the World Health Organization (WHO) Air Quality Guidelines (AQG) of annual PM2.5 exposure <10 mg/m3. Notably, no concentration threshold is recognized below, which exposures can be considered safe; even low levels within the AQG targets are believed to pose significant health risks.7 Furthermore, a supralinear relationship between PM2.5 exposure and mortality has been noted with average annual levels as low as 2 mg/m3.15 Our results are consistent with these associations between PM2.5 and CVD, as our study population had low annual PM2.5 exposure but still manifested a gradient of MACE risk with relatively modest increases in pollution exposure.
Mechanistic insights
While much is known about the biological mechanisms linking PM2.5 exposure to CVD, the current study provides important new insights. Specifically, it shows, for the first time in humans, that PM2.5 exposure associates with both heightened leucopoietic activity and greater ArtI. Moreover, the data point to a multi-tissue mechanism linking PM2.5 exposure to CVD via a leucopoietic-arterial axis. In animals, both PM10 (PM with diameter <10 μm) and PM2.5 stimulate migration of monocyte populations from the BM and spleen into atherosclerotic lesions.10 , 16 The mechanisms may involve oxidized phospholipids generation and/or CCL2/CCR2-mediated Ly6chi monocyte release from BM.17 Up-regulated BM leucopoietic activity has consistently been demonstrated to play an important role in multiple models and appears to be a common risk-conferring mechanism.18 , 19 Importantly, increased leucopoietic activity and an activated leucopoietic-arterial axis associate with MACE risk in humans, and the current study shows that increased PM2.5 may drive the front end of this pathway.12 , 20 Accordingly, the current observations may represent an important mechanism (i.e. shared with other conventional risk factors) by which air pollution potentiates CVD in humans.
Future strategies to mitigate cardiovascular disease effects of PM2.5 exposure
This study’s findings suggest potential therapies to decrease the burden of CVD due to air pollution beyond policy changes and technological advances. Potential approaches to reduce air pollution-induced leucopoietic-arterial axis activity include the use of drugs that target ArtI and/or leucopoiesis (e.g. statins or anti-inflammatory drugs).21 There is also emerging evidence that lifestyle interventions may attenuate pollution’s adverse cardiovascular impacts.22 , 23 Recent animal studies have shown that exercise and healthy sleep attenuate leucopoietic activity and atherosclerosis, suggesting these approaches may impart benefits via the leucopoietic-arterial axis.18 , 19 Future studies could examine the impact of these therapies on CVD outcomes in pollution-exposed individuals.
Limitations
The current study has limitations related to its retrospective design. Additionally, although none of the participants had active cancer, a majority had prior cancer and were cured or in remission. Thus, the findings of the study should be examined in that context. Nonetheless, the observed associations remained significant after adjusting for previous cancer and cancer therapies. Direct measures of oxidative stress and systemic inflammation were not available. Other components of air pollution and measures of humidity, wind, and temperature were not assessed. Although 18F-FDG is not specific for macrophage infiltration in atherosclerotic plaques, ArtI assessed using 18F-FDG-PET/CT provides a measurement that robustly associates with plaque macrophage density and MACE.24 , 25 Additionally, in this retrospective study, we were unable to account for possible relocation after imaging, which may have led to some misclassification of socioeconomic status and pollution measures derived during follow-up. However, sensitivity analyses, which included pollution data obtained using alternate time periods, yielded consistent results, and multiple studies have shown little reclassification of socioeconomic status between census time periods.26
Furthermore, such misclassifications likely would have made it harder to find significant associations. Lastly, an observational study such as ours cannot firmly establish a causal relationship between PM2.5 and leucopoietic activity, ArtI, and CVD risk. Overall, these limitations are substantially counterbalanced by several important innovations, including the application of multi-tissue 18F-FDG-PET/CT imaging and the comprehensive assessment of potential confounders to study the biological mechanism linking PM2.5 exposure to MACE.
Conclusion
Chronic PM2.5 exposure associates with increased risk for adverse CVD events after comprehensively accounting for confounders. Moreover, the link between chronic PM2.5 exposure and CVD may be mediated in part by a multi-organ mechanism involving both up-regulated leucopoietic activity and heightened ArtI. These findings point to leucopoietic-arterial mechanism that could be targeted with the goal of reducing CVD risk associated with heightened PM2.5 exposure.
Supplementary material
Supplementary material is available at European Heart Journal online.
Data availability
The datasets analysed during the current study are available from the corresponding author on reasonable request.
Funding
United States National Institutes of Health (KL2TR002542 to M.T.O, P01HL131478 to Z.A.F. and A.T., and R01HL122177 to A.T.).
Conflict of interest: A.T. received institutional grants from Genentech and Actelion and personal fees from Actelion and Esperion for research outside this work. M.T.O. received consulting fees from Intrinsic Imaging, LLC for unrelated work. The remaining authors have no significant disclosures.
Supplementary Material
Contributor Information
Shady Abohashem, Cardiology Division, Department of Medicine, Massachusetts General Hospital and Harvard Medical School, 55 Fruit St, Yawkey 5E, Boston, MA 02114-2750, USA; Cardiovascular Imaging Research Center, Departments of Medicine and Imaging, Massachusetts General Hospital, 165 Cambridge St., Boston, MA 02114, USA.
Michael T Osborne, Cardiology Division, Department of Medicine, Massachusetts General Hospital and Harvard Medical School, 55 Fruit St, Yawkey 5E, Boston, MA 02114-2750, USA; Cardiovascular Imaging Research Center, Departments of Medicine and Imaging, Massachusetts General Hospital, 165 Cambridge St., Boston, MA 02114, USA.
Tawseef Dar, Cardiology Division, Department of Medicine, Massachusetts General Hospital and Harvard Medical School, 55 Fruit St, Yawkey 5E, Boston, MA 02114-2750, USA; Cardiovascular Imaging Research Center, Departments of Medicine and Imaging, Massachusetts General Hospital, 165 Cambridge St., Boston, MA 02114, USA.
Nicki Naddaf, Cardiovascular Imaging Research Center, Departments of Medicine and Imaging, Massachusetts General Hospital, 165 Cambridge St., Boston, MA 02114, USA.
Taimur Abbasi, Cardiology Division, Department of Medicine, Massachusetts General Hospital and Harvard Medical School, 55 Fruit St, Yawkey 5E, Boston, MA 02114-2750, USA; Cardiovascular Imaging Research Center, Departments of Medicine and Imaging, Massachusetts General Hospital, 165 Cambridge St., Boston, MA 02114, USA.
Ahmed Ghoneem, Cardiovascular Imaging Research Center, Departments of Medicine and Imaging, Massachusetts General Hospital, 165 Cambridge St., Boston, MA 02114, USA.
Azar Radfar, Cardiology Division, Department of Medicine, Massachusetts General Hospital and Harvard Medical School, 55 Fruit St, Yawkey 5E, Boston, MA 02114-2750, USA; Cardiovascular Imaging Research Center, Departments of Medicine and Imaging, Massachusetts General Hospital, 165 Cambridge St., Boston, MA 02114, USA.
Tomas Patrich, Cardiovascular Imaging Research Center, Departments of Medicine and Imaging, Massachusetts General Hospital, 165 Cambridge St., Boston, MA 02114, USA.
Blake Oberfeld, Cardiovascular Imaging Research Center, Departments of Medicine and Imaging, Massachusetts General Hospital, 165 Cambridge St., Boston, MA 02114, USA.
Brian Tung, Cardiovascular Imaging Research Center, Departments of Medicine and Imaging, Massachusetts General Hospital, 165 Cambridge St., Boston, MA 02114, USA.
Zahi A Fayad, BioMedical Engineering and Imaging Institute, Icahn School of Medicine at Mount Sinai, 1470 Madison Ave., New York, NY 10029, USA.
Sanjay Rajagopalan, Department of Cardiovascular Medicine, Case Western Reserve University, 10900 Euclid Ave., Cleveland, OH 44106, USA.
Ahmed Tawakol, Cardiology Division, Department of Medicine, Massachusetts General Hospital and Harvard Medical School, 55 Fruit St, Yawkey 5E, Boston, MA 02114-2750, USA; Cardiovascular Imaging Research Center, Departments of Medicine and Imaging, Massachusetts General Hospital, 165 Cambridge St., Boston, MA 02114, USA.
References
- 1. Rajagopalan S, Al-Kindi SG, Brook RD. Air pollution and cardiovascular disease: JACC state-of-the-art review. J Am Coll Cardiol 2018;72:2054–2070. [DOI] [PubMed] [Google Scholar]
- 2. Miller KA, Siscovick DS, Sheppard L, Shepherd K, Sullivan JH, Anderson GL, Kaufman JD. Long-term exposure to air pollution and incidence of cardiovascular events in women. N Engl J Med 2007;356:447–458. [DOI] [PubMed] [Google Scholar]
- 3. Newby DE, Mannucci PM, Tell GS, Baccarelli AA, Brook RD, Donaldson K, Forastiere F, Franchini M, Franco OH, Graham I, Hoek G, Hoffmann B, Hoylaerts MF, Kunzli N, Mills N, Pekkanen J, Peters A, Piepoli MF, Rajagopalan S, Storey RF. Expert position paper on air pollution and cardiovascular disease. Eur Heart J 2015;36:83–93b. [DOI] [PMC free article] [PubMed] [Google Scholar]
- 4. Shah AS, Langrish JP, Nair H, McAllister DA, Hunter AL, Donaldson K, Newby DE, Mills NL. Global association of air pollution and heart failure: a systematic review and meta-analysis. Lancet 2013;382:1039–1048. [DOI] [PMC free article] [PubMed] [Google Scholar]
- 5. Munzel T, Sorensen M, Gori T, Schmidt FP, Rao X, Brook FR, Chen LC, Brook RD, Rajagopalan S. Environmental stressors and cardio-metabolic disease: part II-mechanistic insights. Eur Heart J 2017;38:557–564. [DOI] [PMC free article] [PubMed] [Google Scholar]
- 6. Cohen AJ, Brauer M, Burnett R, Anderson HR, Frostad J, Estep K, Balakrishnan K, Brunekreef B, Dandona L, Dandona R, Feigin V, Freedman G, Hubbell B, Jobling A, Kan H, Knibbs L, Liu Y, Martin R, Morawska L, Pope CA 3rd, Shin H, Straif K, Shaddick G, Thomas M, van Dingenen R, van Donkelaar A, Vos T, Murray CJL, Forouzanfar MH. Estimates and 25-year trends of the global burden of disease attributable to ambient air pollution: an analysis of data from the Global Burden of Diseases Study 2015. Lancet 2017;389:1907–1918. [DOI] [PMC free article] [PubMed] [Google Scholar]
- 7. Di Q, Wang Y, Zanobetti A, Wang Y, Koutrakis P, Choirat C, Dominici F, Schwartz JD. Air pollution and mortality in the medicare population. N Engl J Med 2017;376:2513–2522. [DOI] [PMC free article] [PubMed] [Google Scholar]
- 8. Munzel T, Gori T, Al-Kindi S, Deanfield J, Lelieveld J, Daiber A, Rajagopalan S. Effects of gaseous and solid constituents of air pollution on endothelial function. Eur Heart J 2018;39:3543–3550. [DOI] [PMC free article] [PubMed] [Google Scholar]
- 9. Sun Q, Wang A, Jin X, Natanzon A, Duquaine D, Brook RD, Aguinaldo J-GS, Fayad ZA, Fuster V, Lippmann M, Chen LC, Rajagopalan S. Long-term air pollution exposure and acceleration of atherosclerosis and vascular inflammation in an animal model. JAMA 2005;294:3003–3010. [DOI] [PubMed] [Google Scholar]
- 10. Goto Y, Ishii H, Hogg JC, Shih CH, Yatera K, Vincent R, van Eeden SF. Particulate matter air pollution stimulates monocyte release from the bone marrow. Am J Respir Crit Care Med 2004;170:891–897. [DOI] [PubMed] [Google Scholar]
- 11. Emami H, Singh P, MacNabb M, Vucic E, Lavender Z, Rudd JHF, Fayad ZA, Lehrer-Graiwer J, Korsgren M, Figueroa AL, Fredrickson J, Rubin B, Hoffmann U, Truong QA, Min JK, Baruch A, Nasir K, Nahrendorf M, Tawakol A. Splenic metabolic activity predicts risk of future cardiovascular events: demonstration of a cardiosplenic axis in humans. JACC Cardiovasc Imaging 2015;8:121–130. [DOI] [PMC free article] [PubMed] [Google Scholar]
- 12. Tawakol A, Ishai A, Takx RAP, Figueroa AL, Ali A, Kaiser Y, Truong QA, Solomon CJE, Calcagno C, Mani V, Tang CY, Mulder WJM, Murrough JW, Hoffmann U, Nahrendorf M, Shin LM, Fayad ZA, Pitman RK. Relation between resting amygdalar activity and cardiovascular events: a longitudinal and cohort study. Lancet 2017;389:834–845. [DOI] [PMC free article] [PubMed] [Google Scholar]
- 13. Figueroa AL, Abdelbaky A, Truong QA, Corsini E, MacNabb MH, Lavender ZR, Lawler MA, Grinspoon SK, Brady TJ, Nasir K, Hoffmann U, Tawakol A. Measurement of arterial activity on routine FDG PET/CT images improves prediction of risk of future CV events. JACC Cardiovasc Imaging 2013;6:1250–1259. [DOI] [PubMed] [Google Scholar]
- 14. McGuinn LA, Ward-Caviness C, Neas LM, Schneider A, Di Q, Chudnovsky A, Schwartz J, Koutrakis P, Russell AG, Garcia V, Kraus WE, Hauser ER, Cascio W, Diaz-Sanchez D, Devlin RB. Fine particulate matter and cardiovascular disease: comparison of assessment methods for long-term exposure. Environ Res 2017;159:16–23. [DOI] [PMC free article] [PubMed] [Google Scholar]
- 15. Pappin AJ, Christidis T, Pinault LL, Crouse DL, Brook JR, Erickson A, Hystad P, Li C, Martin RV, Meng J, Weichenthal S, van Donkelaar A, Tjepkema M, Brauer M, Burnett RT. Examining the shape of the association between low levels of fine particulate matter and mortality across three cycles of the canadian census health and environment cohort. Environ Health Perspect 2019;127:107008. [DOI] [PMC free article] [PubMed] [Google Scholar]
- 16. Suwa T, Hogg JC, Quinlan KB, Ohgami A, Vincent R, van Eeden SF. Particulate air pollution induces progression of atherosclerosis. J Am Coll Cardiol 2002;39:935–942. [DOI] [PubMed] [Google Scholar]
- 17. Kampfrath T, Maiseyeu A, Ying Z, Shah Z, Deiuliis JA, Xu X, Kherada N, Brook RD, Reddy KM, Padture NP, Parthasarathy S, Chen LC, Moffatt-Bruce S, Sun Q, Morawietz H, Rajagopalan S. Chronic fine particulate matter exposure induces systemic vascular dysfunction via NADPH oxidase and TLR4 pathways. Circ Res 2011;108:716–726. [DOI] [PMC free article] [PubMed] [Google Scholar]
- 18. McAlpine CS, Kiss MG, Rattik S, He S, Vassalli A, Valet C, Anzai A, Chan CT, Mindur JE, Kahles F, Poller WC, Frodermann V, Fenn AM, Gregory AF, Halle L, Iwamoto Y, Hoyer FF, Binder CJ, Libby P, Tafti M, Scammell TE, Nahrendorf M, Swirski FK. Sleep modulates haematopoiesis and protects against atherosclerosis. Nature 2019;566:383–387. [DOI] [PMC free article] [PubMed] [Google Scholar]
- 19. Frodermann V, Rohde D, Courties G, Severe N, Schloss MJ, Amatullah H, McAlpine CS, Cremer S, Hoyer FF, Ji F, van Koeverden ID, Herisson F, Honold L, Masson GS, Zhang S, Grune J, Iwamoto Y, Schmidt SP, Wojtkiewicz GR, Lee IH, Gustafsson K, Pasterkamp G, de Jager SCA, Sadreyev RI, MacFadyen J, Libby P, Ridker P, Scadden DT, Naxerova K, Jeffrey KL, Swirski FK, Nahrendorf M. Exercise reduces inflammatory cell production and cardiovascular inflammation via instruction of hematopoietic progenitor cells. Nat Med 2019;25:1761–1771. [DOI] [PMC free article] [PubMed] [Google Scholar]
- 20. Tawakol A, Osborne MT, Wang Y, Hammed B, Tung B, Patrich T, Oberfeld B, Ishai A, Shin LM, Nahrendorf M, Warner ET, Wasfy J, Fayad ZA, Koenen K, Ridker PM, Pitman RK, Armstrong KA. Stress-associated neurobiological pathway linking socioeconomic disparities to cardiovascular disease. J Am Coll Cardiol 2019;73:3243–3255. [DOI] [PMC free article] [PubMed] [Google Scholar]
- 21. Tawakol A, Fayad ZA, Mogg R, Alon A, Klimas MT, Dansky H, Subramanian SS, Abdelbaky A, Rudd JHF, Farkouh ME, Nunes IO, Beals CR, Shankar SS. Intensification of statin therapy results in a rapid reduction in atherosclerotic inflammation results of a multicenter fluorodeoxyglucose-positron emission tomography/computed tomography feasibility study. J Am Coll Cardiol 2013;62:909–917. [DOI] [PubMed] [Google Scholar]
- 22. Tong H. Dietary and pharmacological intervention to mitigate the cardiopulmonary effects of air pollution toxicity. Biochim Biophys Acta 2016;1860:2891–2898. [DOI] [PubMed] [Google Scholar]
- 23. Tainio M, de Nazelle AJ, Götschi T, Kahlmeier S, Rojas-Rueda D, Nieuwenhuijsen MJ, de Sá TH, Kelly P, Woodcock J. Can air pollution negate the health benefits of cycling and walking? Prev Med 2016;87:233–236. [DOI] [PMC free article] [PubMed] [Google Scholar]
- 24. Figueroa AL, Abdelbaky A, Truong QA, Corsini E, MacNabb MH, Lavender ZR, Lawler MA, Grinspoon SK, Brady TJ, Nasir K, Hoffmann U, Tawakol A. Measurement of arterial activity on routine FDG PET/CT images improves prediction of risk of future CV events. JACC Cardiovasc Imaging 2013;6:1250–1259. [DOI] [PubMed] [Google Scholar]
- 25. Fernández-Friera L, Fuster V, López-Melgar B, Oliva B, Sánchez-González J, Macías A, Pérez-Asenjo B, Zamudio D, Alonso-Farto JC, España S, Mendiguren J, Bueno H, García-Ruiz JM, Ibañez B, Fernández-Ortiz A, Sanz J. Vascular inflammation in subclinical atherosclerosis detected by hybrid PET/MRI. J Am Coll Cardiol 2019;73:1371–1382. [DOI] [PubMed] [Google Scholar]
- 26.Brown A, Buchholz D, Davis D, Gonzalez A (eds). Economic Mobility: Research & Ideas on Strengthening Families, Communities & the Economy. St. Louis, MO and Washington, D.C., USA: Federal Reserve Bank of St. Louis & Board of Governors of the Federal Reserve System; 2016.
Associated Data
This section collects any data citations, data availability statements, or supplementary materials included in this article.
Supplementary Materials
Data Availability Statement
The datasets analysed during the current study are available from the corresponding author on reasonable request.