

Abstract
Background
Accumulating evidence shows that microRNAs are aberrantly expressed and exert essential roles in the tumorigenesis and tumor progression of non‐small cell lung cancer (NSCLC).
Methods
The plasma miRNAs from five healthy donors and four NSCLC patients were profiled by miRNA microarray. The differentially expressed miRNAs from 154 primary NSCLC patients and 146 healthy donors were subjected to RNA isolation and verified by quantitative PCR (qPCR).
Results
The miRNA microarray analysis revealed that 40 differential miRNAs between NSCLC patients and healthy donors were selected. We found that the plasma miR‐1247‐5p, miR‐301b‐3p and miR‐105‐5p levels of patients were significantly higher than those of healthy controls. The receiver operating characteristic curve (ROC) analyses revealed higher area under the ROC curve (AUC) values and higher sensitivity/specificity of carcinoembryonic antigen (CEA) in combination with miR‐1247‐5p, miR‐301b‐3p, or miR‐105‐5p were superior to that of CEA alone.
Conclusions
High miR‐1247‐5p, miR‐301b‐3p and miR‐105‐5p expression have been demonstrated to accelerate tumorigenesis, and these three miRNAs in plasma act as novel biomarkers for the early diagnosis of NSCLC patients.
Key points
Plasma miR‐1247‐5p, miR‐301b‐3p and miR‐105‐5p act as novel biomarkers for early NSCLC and NSCLC.
Keywords: Biomarkers, miR‐105‐5p, miR‐1247‐5p, miR‐301b‐3p, non‐small cell lung cancer

In summary, our results indicate that miR‐1247‐5p, miR‐301b‐3p, and miR‐105‐5p are candidate biomarkers of NSCLC, which perform even better when combined with CEA levels. These findings also prompted us to hypothesize that the early dysregulation of miR‐1247‐5p, miR‐301b‐3p, and miR‐105‐5p in the NSCLC disease process, and the requirement of only a small amount of plasma, render miR‐1247‐5p, miR‐301b‐3p, and miR‐105‐5p very suitable as early warning biomarkers for NSCLC.
Introduction
Non‐small cell lung cancer (NSCLC) contributes to approximately 80% of lung cancer subtypes which is acknowledged as the leading cause of cancer associated incidence and mortality for both sexes combined worldwide. 1 The disappointing survival rate is mainly determined by late diagnosis and most patients already have local or distant metastasis which leads to the opportunity of surgical excision being lost. 2 Therefore, the discovery of early specific biomarkers for diagnosis and potential therapeutic targets may significantly improve the clinical intervention and survival rate of NSCLC patients.
The molecular regulatory pathway alterations that affects the biological behavior of NSCLC cells are multiple and these molecular networks may lead to an imbalance that generates a malignant phenotype at the very beginning. These molecular modifications include changes in gene expression, copy number alterations, different methylation patterns, but also changes in the expression of non‐coding RNAs. 3 MicroRNAs (miRNAs), containing about 22 nucleotides, are the most important category of the non‐coding part of the genome. 4 It has been proven that miRNAs are stably contained within biofluid medium such as plasma 5 and exert modulatory functions upon target genes or molecules that further affect important signaling pathways in lung cancer cells development, epithelial–mesenchymal transition and response to therapy. 6 The essential role of miRNAs results from the fact that one single miRNA is able to target multiple mRNAs in a post‐transcriptional manner, thus simultaneously affecting the expression of hundreds of genes. 7
Specific miRNAs have been implicated in blood specimens of patients with NSCLC, suggesting that these markers could act as potential diagnostic indicators for NSCLC. There is evidence that miR‐146a‐5p has a significantly higher expression in the serum and tissue samples of NSCLC patients than that of the healthy controls. Its effects on NSCLC cell survival and migration have previously been reported to be mediated by direct binding to, and suppression of, TRAF6. 8 Additionally, multiple studies reported miR‐21 as an oncogene was upregulated in NSCLC patients, and closely associated with a worse outcome. 9 All these suggested miRNAs measured in body fluids can reflect altered physiological conditions, and may serve as a noninvasive and sensitive object able to detect early neoplastic changes.
In the current study, we found and verified three miRNAs (miR‐1247‐5p, miR‐301b‐3p and miR‐105‐5p) from plasma between NSCLC patients and healthy donors using miRNA microarray analysis. We evaluated the expression signature and diagnostic power of these three miRNAs in NSCLC and early‐stage patients. The aim of this study was to assess whether plasma miR‐1247‐5p, miR‐301b‐3p and miR‐105‐5p can be used as biomarkers for identifying NSCLC, especially for early‐stage NSCLC.
Methods
Patients and clinical samples
Whole blood samples of 154 NSCLC patients and 146 healthy volunteers were obtained from Shandong Cancer Hospital and Institute between November 2019 and June 2020. None of the involved patients had received surgery or antitumor treatments, including chemo‐, radio‐ or targeted therapy. The healthy controls were selected from a healthy population who participated in the physical examination. Written informed consent was obtained from each individual participant and the study protocol was approved by the Ethics Committee of Shandong Cancer Hospital and Institute.
RNA extraction and complementary DNA (cDNA) synthesis
Whole blood was collected in EDTAK2‐coated purple‐cap Vacutainer tubes (BD, Franklin Lakes, NJ, USA) until centrifugation twice at 3000 × g for 10 minutes (4°C) to separate plasma from cells and debris. Total RNA was extracted from plasma using TRIzol LS reagent (Thermo Fisher Scientific, Carlsbad, CA, USA), and stored at −80°C until use. The concentration and purity of extracted RNA samples were determined with the NanoDrop (Thermo Fisher Scientific, Wilmington, DE). Thereafter, cDNA was synthesized by reverse transcription using Mix‐X miRNA first‐strand synthesis kit (TaKaRa Bio, Nojihigashi, Kusatsu, Japan).
Identification of differentially expressed genes (DEGs) in miRNA microarray
Plasma was obtained from 10 mL of peripheral blood from four NSCLC patients and five healthy donors, and analyzed using an Agilent 2100 Bioanalyzer (Agilent Biotechnologies, Palo Alto, CA, USA). The prepared libraries were finally sequenced using Illumina NextSeq 500/550 V2 kit (#FC‐4042005, Illumina, USA), according to the manufacturer's instructions. P < 0.05 and |log2fold change (FC)| ≥ 1.5 were set as the cutoff criteria for differentially expressed miRNAs. Hierarchical clustering, scatter plot and volcano plot were constructed with the differentially expressed miRNAs in either R or Python.
Quantitative PCR (qPCR) assay
A quantitative PCR assay was performed using TB‐Green Premix Ex Taq II reagent (Takara Bio) in a volume of 20 μL. The expression of miRNAs was detected on LightCycler 480 qPCR system (Roche Diagnostics, Germany) and evaluated by the comparative cycle threshold (ΔCt) method: (ΔCt = Ct miRNA – Ct U6) as described previously. 10 U6 acted as an endogenous control as described previously. 11 The primers designed to amplify the miRNA transcripts are listed in Table 1.
Table 1.
Sequence information of the primers for qPCR
| Gene | Primer |
|---|---|
| hsa‐miR‐1247‐5p | GTCCCGTTCGTCCCCGGAAA |
| hsa‐miR‐301b‐3p | GCAGTGCAATGATATTGTCAAAGC |
| hsa‐miR‐105‐5p | TCAAATGCTCAGACTCCTGTGGT |
| U6 forward | TGGAACGCTTCACGAATTTGCG |
| U6 reverse | GGAACGATACAGAGAAGATTAGC |
Bioinformatic analysis
TargetScan 12 (http://www.targetscan.org/vert_72/) and miRDB 13 (http://mirdb.org/) were employed for the prediction of potential miRNA targets. The target genes of miR‐1247‐5p, miR‐301b‐3p and miR‐105‐5p were predicted by these two databases, respectively and the top 200 target genes were selected according to their respective database scores. We used the Database for Annotation Visualization and Integrated Discovery 14 (DAVID 6.8 online, https://david.ncifcrf.gov/home.jsp) to analyze the gene ontology (GO) enrichment and KEGG pathway of these target genes to identify the possible biological function of the three miRNAs. P < 0.05 was considered statistically significant.
Statistical analysis
The statistical analyses were carried out using GraphPad Prism version 6.0 (GraphPad Software, San Diego, CA, USA) and SPSS 22.0 (SPSS Inc., Chicago, IL, US). An unpaired t‐test or Mann‐Whitney test was used to assess the statistical significance between groups, while multiple group analysis was tested by Kruskal‐Wallis test. Chi‐square test was employed to evaluate the relationship between miRNAs and clinical characteristics. The diagnostic power of miRNAs was evaluated by sensitivity, specificity, and ROC curve. P‐values <0.05 were considered statistically significant, and all tests were set as two‐tailed.
Results
Differentially expressed miRNAs identified by miRNA microarray
To determine the differential expression of miRNAs, we analyzed the RAW miRNA expression profiling data of plasma from four NSCLC patients and five healthy controls. In total, 40 miRNAs were identified to be differentially expressed between the two groups, of which 28 were upregulated and 12 were downregulated in plasma relative to NSCLC, and listed in Table 2. Hierarchical clustering analysis was performed using these significantly differential miRNAs, indicating a distinguishable miRNA expression profiling among these samples (Fig 1a). As shown in Fig 1b,c, the scatter and volcano plots were constructed to visualize the variation in miRNA expression between the two groups.
Table 2.
miRNAs expression profiling (28 upregulated and 12 downregulated)
| miRNA | log2 fold change | Description | miRNA | log2 fold change | Description |
|---|---|---|---|---|---|
| hsa‐miR‐512‐5p | 9.766 150 787 | up | hsa‐miR‐520d‐5p | 6.627 214 059 | up |
| hsa‐miR‐376c‐3p | 9.503 468 956 | up | hsa‐miR‐877‐3p | 6.574 761 579 | up |
| hsa‐miR‐548n | 9.243 849 325 | up | hsa‐miR‐548ab | 6.534 445 097 | up |
| hsa‐miR‐106a‐3p | 9.107 295 079 | up | hsa‐miR‐520f‐3p | 6.502 631 988 | up |
| hsa‐miR‐548p | 8.807 415 444 | up | hsa‐miR‐18a‐3p | 5.224 509 517 | up |
| hsa‐miR‐548ah‐3p | 8.807 415 444 | up | hsa‐miR‐181a‐2‐3p | 3.794 524 717 | up |
| hsa‐miR‐485‐5p | 8.681 734 057 | up | hsa‐miR‐215‐5p | 1.815 606 041 | up |
| hsa‐miR‐1247‐5p | 8.101 421 637 | up | hsa‐miR‐122‐5p | 1.545 033 385 | up |
| hsa‐miR‐501‐5p | 7.893 508 413 | up | hsa‐miR‐30c‐1‐3p | 7.706 989 298 | down |
| hsa‐miR‐301b‐3p | 7.717 498 37 | up | hsa‐miR‐548ay‐3p | 7.651 187 735 | down |
| hsa‐miR‐5187‐5p | 7.639 762 596 | up | hsa‐miR‐6722‐3p | 7.620 853 852 | down |
| hsa‐miR‐655‐3p | 7.577 037 146 | up | hsa‐miR‐521 | 7.517 812 815 | down |
| hsa‐miR‐517c‐3p | 7.572 255 215 | up | hsa‐miR‐187‐3p | 7.090818229 | down |
| hsa‐miR‐1273h‐3p | 7.402 062 921 | up | hsa‐miR‐581 | 7.025694494 | down |
| hsa‐miR‐195‐3p | 7.207 760 832 | up | hsa‐miR‐580‐3p | 6.404 865 374 | down |
| hsa‐miR‐3940‐3p | 7.165 152 739 | up | hsa‐miR‐384 | 5.477 500 265 | down |
| hsa‐miR‐365b‐5p | 7.104 387 651 | up | hsa‐miR‐873‐5p | 5.254 075 151 | down |
| hsa‐miR‐377‐5p | 7.046102123 | up | hsa‐miR‐147b‐3p | 5.133 807 356 | down |
| hsa‐let‐7b‐3p | 6.965 388 803 | up | hsa‐miR‐214‐5p | 5.114 376 122 | down |
| hsa‐miR‐105‐5p | 6.827 985 131 | up | hsa‐miR‐454‐3p | 2.774 020 807 | down |
Figure 1.

Plasma miRNA profile of the non‐small cell lung cancer (NSCLC) patients. (a) A heat map was generated after supervised hierarchical cluster analysis. The differential miRNA expression is shown in red (upregulation) versus green (downregulation) (P < 0.05). (b) The scatter plot between two groups for NSCLC patients and healthy donors. (c) Volcano plot compared the expression log2fold‐change of miRNA in NSCLC patients and healthy donors. The red dots represent the upregulated miRNAs, and the green dots represent the downregulated miRNAs.
Validation of miRNAs expression using qPCR
To validate the reliability of the miRNA microarray data, 11 upregulated miRNAs which varied significantly between patients and controls in the microarray were chosen to be verified by qPCR. Several miRNAs were ruled out due to no statistical difference, low expression and low specificity of primers. Intriguingly, miR‐1247‐5p, miR‐301b‐3p and miR‐105‐5p were identified due to their remarkable differences and then subjected to a larger scale validation cohort including 146 healthy donors and 154 NSCLC patients naive to any anticancer treatment.
To explore the potential roles of miR‐1247‐5p, miR‐301b‐3p and miR‐105‐5p in NSCLC, we identified their target genes which were subjected to relevant biological annotation analysis as described in Methods. As shown in Fig S1a–c, GO enrichment analysis demonstrated they were significantly enriched in several biological processes. The target genes were enriched in utero embryonic development for miRNA‐1247‐5p; negative regulation of transcription for miR‐301b‐3p, and peptidyl−threonine phosphorylation for miR‐105‐5p, respectively. Due to the lack of predicted target genes, only miR‐301b‐3p was subjected to KEGG analysis and more than three pathways were enriched. As shown in Fig S1d, the target genes of miR‐301b‐3p were enriched in the mTOR signaling pathway, implying that it might be involved in mTOR signaling dependent tumorigenesirs.
miR‐1247‐5p, miR‐301b‐3p and miR‐105‐5p were upregulated in NSCLC
As shown in Fig 2a‐c, miR‐1247‐5p, miR‐301b‐3p and miR‐105‐5p were significantly expressed in NSCLC patients compared with normal individuals, and elevated significantly from NSCLC plasma samples (P < 0.0001, P < 0.0001 and P < 0.0001, respectively). Furthermore, we analyzed the differential levels of miR‐1247‐5p, miR‐301b‐3p and miR‐105‐5p in patients with different TNM stage. As shown in Fig 2d–f, when compared with the healthy donors, the miRNA levels were significantly upregulated in various TNM stage.
Figure 2.

miR‐1247‐5p, miR‐301b‐3p and miR‐105‐5p were upregulated in non‐small cell lung cancer (NSCLC). (a–c) miR‐1247‐5p, miR‐301b‐3p and miR‐105‐5p were upregulated in NSCLC patients (n = 154) compared with healthy controls (n = 146); (d–f) miR‐1247‐5p, miR‐301b‐3p and miR‐105‐5p were upregulated in various TNM stages. HD, healthy donors; NSCLC, non‐small cell lung cancer patients. ****P < 0.0001.
The relationship between miRNA expression and clinical pathological characteristics of NSCLC patients are summarized in Table 3. However, none of these were correlated with gender, age, smoking, drinking, histological type, lymph node metastasis, or distant metastasis.
Table 3.
Correlation between miRNA‐1247‐5p, miRNA‐301b‐3p, miRNA‐105‐5p expression and clinicopathological characteristics of lung cancer patients
| miRNA‐1247‐5p | miRNA‐301b‐3p | miRNA‐105‐5p | ||||||||
|---|---|---|---|---|---|---|---|---|---|---|
| Characteristics | Cases No. (%) | Low | High | P‐value* | Low | High | P‐value* | Low | High | P‐value* |
| Gender | ||||||||||
| Male | 91 (59.1) | 46 | 45 | 0.87 | 41 | 50 | 0.14 | 42 | 49 | 0.251 |
| Female | 63 (40.9) | 31 | 32 | 36 | 27 | 35 | 28 | |||
| Age (years) | ||||||||||
| <62 | 73 (47.4) | 39 | 34 | 0.42 | 38 | 35 | 0.628 | 37 | 36 | 0.872 |
| ≥62 | 81 (52.6) | 38 | 43 | 39 | 42 | 40 | 41 | |||
| Smoking | ||||||||||
| No | 99 (64.3) | 48 | 51 | 0.614 | 50 | 49 | 0.866 | 51 | 48 | 0.614 |
| Yes | 55 (35.7) | 29 | 26 | 27 | 28 | 26 | 29 | |||
| Drinking | ||||||||||
| No | 112 (72.7) | 53 | 59 | 0.278 | 54 | 58 | 0.469 | 57 | 55 | 0.717 |
| Yes | 42 (27.3) | 24 | 18 | 23 | 19 | 20 | 22 | |||
| Histology | ||||||||||
| NSCLC | ||||||||||
| AC | 108 (70.1) | 55 | 53 | 0.407 | 56 | 52 | 0.223 | 57 | 51 | 0.189 |
| SCC | 35 (22.7) | 15 | 20 | 14 | 21 | 14 | 21 | |||
| Others | 11 (7.1) | 4 | 3 | 4 | 3 | 4 | 3 | |||
| Tumor size | ||||||||||
| <8.788 cm3 | 65 (42.2) | 36 | 29 | 0.256 | 35 | 30 | 0.337 | 33 | 32 | 0.664 |
| ≥8.788 cm3 | 66 (42.9) | 30 | 36 | 30 | 36 | 31 | 35 | |||
| Unknown | 23 (14.9) | |||||||||
| T stage | ||||||||||
| Tis | 2 (1.3) | 0 | 2 | 0.562 | 0 | 2 | 0.587 | 0 | 2 | 0.528 |
| T1 | 50 (32.5) | 27 | 23 | 26 | 24 | 26 | 24 | |||
| T2 | 46 (29.9) | 22 | 24 | 21 | 25 | 19 | 27 | |||
| T3 | 22 (14.3) | 12 | 10 | 12 | 10 | 11 | 11 | |||
| T4 | 23 (14.9) | 10 | 13 | 10 | 13 | 12 | 11 | |||
| Unknown | 11 (7.1) | |||||||||
| TNM stage | ||||||||||
| Stage 0 | 2 (1.3) | 0 | 2 | 0.075 | 0 | 2 | 0.273 | 0 | 2 | 0.481 |
| Stage I | 39 (25.3) | 20 | 19 | 19 | 20 | 19 | 20 | |||
| Stage II | 12 (7.8) | 10 | 2 | 9 | 3 | 8 | 4 | |||
| Stage III | 32 (20.8) | 13 | 19 | 15 | 17 | 15 | 17 | |||
| Stage IV | 62 (40.3) | 32 | 30 | 31 | 31 | 31 | 31 | |||
| Unknown | 7 (4.5) | |||||||||
| Lymph node metastasis | ||||||||||
| No | 56 (36.4) | 30 | 26 | 0.536 | 28 | 28 | 0.84 | 26 | 30 | 0.726 |
| Yes | 87 (56.5) | 42 | 45 | 42 | 45 | 43 | 44 | |||
| Unknown | 11 (7.1) | |||||||||
| Distant metastasis | ||||||||||
| No | 85 (55.2) | 43 | 42 | 0.902 | 43 | 42 | 0.944 | 42 | 43 | 0.944 |
| Yes | 62 (40.3) | 32 | 30 | 31 | 31 | 31 | 31 | |||
| Unknown | 7(4.5) | |||||||||
Chi‐square test was used.
Diagnostic role of miR‐1247‐5p, miR‐301b‐3p and miR‐105‐5p in NSCLC patients
ROC curves were plotted to evaluate the diagnostic values of miR‐1247‐5p, miR‐301b‐3p and miR‐105‐5p in distinguishing patients with NSCLC from cancer‐free individuals. As shown in Fig 3a–c, AUCs were 0.769 with 87.7% sensitivity and 57.8% specificity, 0.761 with 65.8% sensitivity and 79.9% specificity, as well as 0.777 with 66.4% sensitivity of and 79.9% specificity for miR‐1247‐5p, miR‐301b‐3p and miR‐105‐5p, respectively. These data provide compelling evidence that miR‐1247‐5p, miR‐301b‐3p and miR‐105‐5p potentially act as relatively high diagnostic accuracies for NSCLC.
Figure 3.
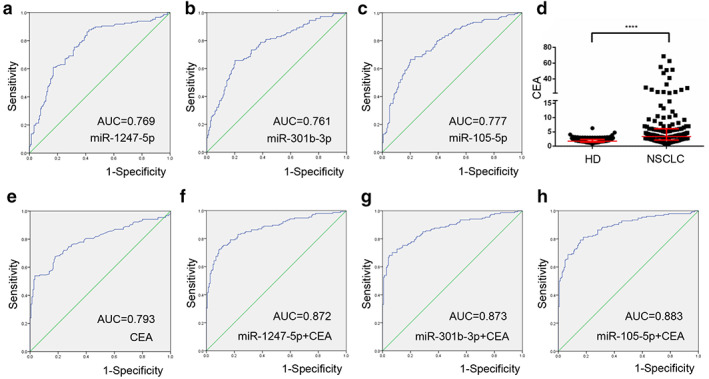
Diagnostic role of miR‐1247‐5p, miR‐301b‐3p and miR‐105‐5p in non‐small cell lung cancer (NSCLC) patients. (a–c) The ROC curve analysis of miR‐1247‐5p, miR‐301b‐3p and miR‐105‐5p for NSCLC. (d) The levels of CEA were increased in NSCLC patients compared with healthy controls. (e) The ROC curve analysis of CEA for NSCLC patients. (f–h) The ROC curve analysis of CEA in combination with miR‐1247‐5p, miR‐301b‐3p, or miR‐105‐5p for NSCLC patients. ****P < 0.0001.
Because the carcinoembryonic antigen (CEA) is the most commonly accepted blood biomarker for NSCLC, 15 we estimated plasma CEA levels and analyzed the ROC curves of CEA of the subjects. Compared with healthy controls, NSCLC patients showed significantly increased CEA levels (P < 0.0001), and plasma CEA levels were able to distinguish NSCLC patients from healthy individuals with an AUC of 0.793. The corresponding sensitivity and specificity were 53.9% and 96.6%, respectively (Fig 3d,e).
Importantly, based on the previously reported methods, 16 we estimated diagnostic performance for the combination of CEA with miR‐1247‐5p, miR‐301b‐3p, or miR‐105‐5p in NSCLC. As shown in Fig 3f–h, AUCs were 0.872 with 72.1% sensitivity and 91.1% specificity, 0.873 with 68.2% sensitivity and 95.2% specificity, as well as 0.883 with 79.2% sensitivity and 84.2% specificity, respectively, higher than that for CEA alone.
miR ‐1247‐5p, miR‐301b‐3p, miR‐105‐5p function as early diagnostic biomarkers
We then analyzed the differential expression of miR‐1247‐5p, miR‐301b‐3p, and miR‐105‐5p in 53 early‐stage NSCLC patients (Tis stage = 2, I stage = 39, II stage = 12) as well as in 146 healthy donors. As shown in Fig 4a–c, significantly higher levels of miR‐1247‐5p, miR‐301b‐3p and miR‐105‐5p were detected in early‐stage NSCLC patients than in healthy donors. To explore the potential of miR‐1247‐5p, miR‐301b‐3p, and miR‐105‐5p as circulating biomarkers for early NSCLC, ROC curves were applied to analyze favorable diagnostic efficiencies between stages I & II and healthy controls, possessing AUCs of 0.812 with 88.4% sensitivity and 64.7% specificity, 0.788 with 65.8% sensitivity and 82.4% specificity, and 0.793 with 68.5% sensitivity and 82.4% specificity, respectively (Fig 5a–c). Moreover, the diagnostic performance for their combination demonstrated the AUC was 0.815 with a relative sensitivity of 72.5% and relative specificity of 82.2% (Fig 5d). As shown in Fig 5e,f, the levels of CEA were greatly increased in stage I & II patients (P < 0.0001), with AUC of 0.803, 78.4% sensitivity and 70.5% specificity for early NSCLC diagnosis. More importantly, diagnosis of NSCLC was greatly improved by using CEA in combination with miR‐1247‐5p, miR‐301b‐3p, miR‐105‐5p, or a combination of all miRNAs (Fig 5f‐h).
Figure 4.
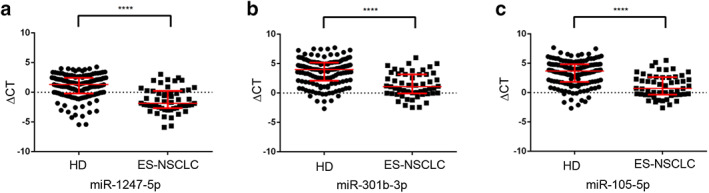
miR‐1247‐5p, miR‐301b‐3p and miR‐105‐5p were upregulated in ES‐NSCLC. (a–c) miR‐1247‐5p, miR‐301b‐3p and miR‐105‐5p were upregulated in early‐stage non‐small cell lung cancer (NSCLC) patients (n = 53) compared with healthy controls (n = 146). HD, healthy donors; ES‐NSCLC, early‐stage NSCLC patients. ****P < 0.0001.
Figure 5.
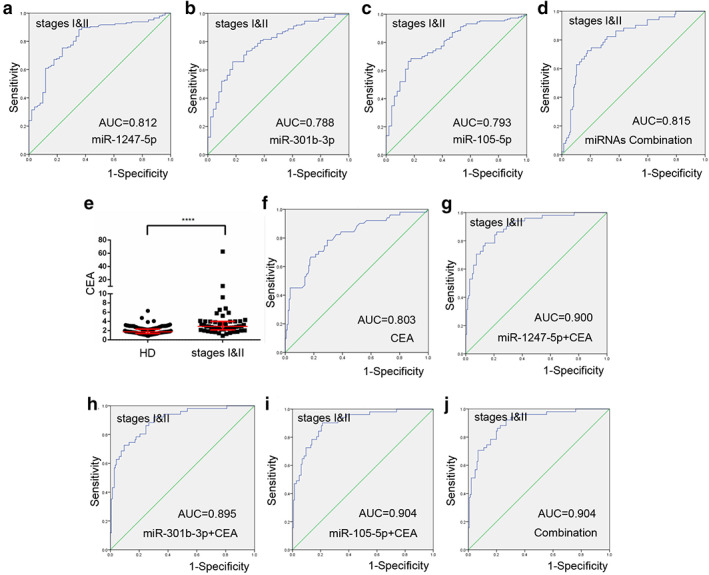
miR‐1247‐5p, miR‐301b‐3p, miR‐105‐5p function as early diagnostic biomarkers. (a–d) The ROC curve analysis of miR‐1247‐5p, miR‐301b‐3p, miR‐105‐5p, and combination of miRNAs for stage I & II non‐small cell lung cancer (NSCLC). (e) The levels of CEA were increased in stage I & II patients compared with healthy controls. (f) The ROC curve analysis of CEA for stage I & II NSCLC patients. (g–j) The ROC curve analysis of CEA in combination with miR‐1247‐5p, miR‐301b‐3p, miR‐105‐5p, or miRNA combination for stage I & II NSCLC patients. ****P < 0.0001.
In addition, we also generated ROC for III & IV including a combination of all miRNAs compared with healthy donors as shown in Fig S2a‐d. However, no significant difference in the three miRNA expression was observed between patients with stages I & II and III & IV (Fig S2e–g).
Discussion
In the era of precision oncology, molecular profiling of individual patients' tumors can determine treatment decisions, monitor subsequent responses, and provide early warning of treatment resistance and neoplasm recurrence. 17 Traditional biomarkers, such as carcinoembryonic antigen (CEA), a broad‐spectrum tumor marker, have been in routine clinical use for decades, but are increasingly unable to satisfy the requirements of liquid biopsy in today's precision oncology era due to their poor specificity and sensitivity in the early diagnosis of NSCLC. In the current study, we screened miR‐1247‐5p, miR‐301b‐3p, and miR‐105‐5p using microarrays and validated their expression pattern in a large cohort, thus providing evidence that miR‐1247‐5p, miR‐301b‐3p, and miR‐105‐5p are biomarkers for NSCLC.
Several studies have previously indicated that miR‐1247‐5p, miR‐301b‐3p, and miR‐105‐5p play different roles in various types of cancer cells. MiR‐1247–5p has been reported to be overexpressed in castration‐resistant prostate cancer (CRPC) 18 and pancreatic cancer. 19 However, it has been found to be downregulated in several malignancies, functioning as a tumor suppressor in hepatocellular carcinoma (HCC), 20 malignant glioma, 21 as well as being associated with poor prognosis and facilitating tumor cell growth in breast cancer. 22 , 23 It has previously been reported that miR‐301b‐3p serves as a tumor promoter which drives the growth of gastric cancer (GC) 24 and HCC. 25 It also facilitates tumor metastasis in high‐grade ovarian serous cancer by targeting CPEB3/EGFR axis. 26 In addition, other studies have confirmed that miRNA‐105‐5p has been found to inhibit cell proliferation in glioma cells 27 and HCC. 28 The inconsistent results are probably due to the different tumor microenvironment(s) which act on tumor cells affecting miR‐105‐5p expression.
In our recent study, we reported that miR‐1247‐5p, miR‐301b‐3p, and miR‐105‐5p were potential biomarkers for NSCLC. First, miR‐1247‐5p, miR‐301b‐3p, and miR‐105‐5p expression levels were found to be significantly increased in patients with NSCLC or early stage NSCLC. ROC curve analysis showed miR‐1247‐5p, miR‐301b‐3p, and miR‐105‐5p could distinguish patients from healthy donors, possessing favorable diagnostic efficiencies. Our study showed that CEA could be combined for the diagnosis of early‐stage NSCLC patients. miR‐1247‐5p miR‐301b‐3p, and miR‐105‐5p in combination with CEA could improve the diagnostic power for early‐stage NSCLC to 0.880, 0.877 and 0.888, respectively. Taken together, miR‐1247‐5p, miR‐301b‐3p, and miR‐105‐5p are specifically present in the plasma and could spill into the circulation at an early stage of NSCLC, thus acting as early and specific biomarkers for NSCLC.
Several limitations should be carefully considered in the present study. First, our results included 154 NSCLC patients, and therefore the total sample sizes were small and might lack statistically vigorous power. Second, we did not detect the expression of these three miRNAs beyond NSCLC, resulting in a lack of tissue‐specificity. Finally, the underlying mechanisms in which those miRNAs studied contribute to LC development remain unclear, and require further assessment in future. Nevertheless, our study and others have also demonstrated miR‐1247‐5p, miR‐301b‐3p and miR‐105‐5p in plasma act as novel biomarkers in the early diagnosis of NSCLC patients. Notably, our group and others have identified kinds of non‐coding RNAs in circulation, which also serve as promising biomarkers for lung cancer, such as lncRNAs, 29 tumor educated platelet small nuclear RNAs (snRNAs) 30 and exosomal miRNAs, 31 indicating the complex mechanisms involved in the tumorigenesis of lung cancer. Combined detection of these kinds of non‐coding RNAs might be a shortcut to increase the accuracy of the diagnoses of lung cancer.
In conclusion, our results indicate that miR‐1247‐5p, miR‐301b‐3p, and miR‐105‐5p are candidate biomarkers of NSCLC, which perform even better when combined with CEA levels. These findings also prompted us to hypothesize that the early dysregulation of miR‐1247‐5p, miR‐301b‐3p and miR‐105‐5p in the NSCLC disease process, together with the requirement of only a small amount of plasma, render miR‐1247‐5p, miR‐301b‐3p and miR‐105‐5p suitable as early warning biomarkers for NSCLC.
Disclosure
The authors declare that they have no competing interests.
Supporting information
Figure S1. Bioinformatic analysis for miR‐1247‐5p, miR‐301b‐3p and miR‐105‐5p. (a–c) Gene ontology enrichment analyses showed that the target genes of miRNA‐1247‐5p, miR‐301b‐3p, miR‐105‐5p. (d) KEGG pathway analysis for miR‐301b‐3p target genes. The vertical axis shows the annotated functions of the target genes, and the horizontal axis the enrichment score. GO, gene ontology; MF, molecular function; CC, cellular component; BP, biological process; KEGG, Kyoto Encyclopedia of Genes and Genome.
Figure S2. Analyses of miR‐1247‐5p, miR‐301b‐3p and miR‐105‐5p in stages III & IV NSCLC. (a–d) The ROC curve analysis of miR‐1247‐5p, miR‐301b‐3p, miR‐105‐5p, and combination of miRNAs for stages III & IV NSCLC. (e–g) No significant difference of miR‐1247‐5p, miR‐301b‐3p, or miR‐105‐5p was observed in either stages I & II or in stages III & IV.
Acknowledgments
This work was supported by the National Natural Science Foundation of China (81972014, 81672104) and the Shandong Provincial Natural Science Foundation (ZR2019MH004 and ZR2019LZL016).
References
- 1. Bray F, Ferlay J, Soerjomataram I, Siegel RL, Torre LA, Jemal A. Global cancer statistics 2018: GLOBOCAN estimates of incidence and mortality worldwide for 36 cancers in 185 countries. CA Cancer J Clin 2018; 68 (6): 394–424. [DOI] [PubMed] [Google Scholar]
- 2. Gao S, Li N, Wang S et al Lung cancer in People's Republic of China. J Thorac Oncol 2020; 15 (10): 1567–76. [DOI] [PubMed] [Google Scholar]
- 3. Pikor LA, Ramnarine VR, Lam S, Lam WL. Genetic alterations defining NSCLC subtypes and their therapeutic implications. Lung Cancer 2013; 82 (2): 179–89. [DOI] [PubMed] [Google Scholar]
- 4. Berindan‐Neagoe I, Monroig Pdel C, Pasculli B, Calin GA. MicroRNAome genome: A treasure for cancer diagnosis and therapy. CA Cancer J Clin 2014; 64 (5): 311–36. [DOI] [PMC free article] [PubMed] [Google Scholar]
- 5. Vickers KC, Palmisano BT, Shoucri BM, Shamburek RD, Remaley AT. MicroRNAs are transported in plasma and delivered to recipient cells by high‐density lipoproteins. Nat Cell Biol 2011; 13 (4): 423–33. [DOI] [PMC free article] [PubMed] [Google Scholar]
- 6. Del Vescovo V, Denti MA. microRNA and lung cancer. Adv Exp Med Biol 2015; 889: 153–77. [DOI] [PubMed] [Google Scholar]
- 7. Gulei D, Mehterov N, Nabavi SM, Atanasov AG, Berindan‐Neagoe I. Targeting ncRNAs by plant secondary metabolites: The ncRNAs game in the balance towards malignancy inhibition. Biotechnol Adv 2018; 36 (6): 1779–99. [DOI] [PubMed] [Google Scholar]
- 8. Liu X, Liu B, Li R et al miR‐146a‐5p plays an oncogenic role in NSCLC via suppression of TRAF6. Front Cell . Dev Biol 2020; 8: 847. [DOI] [PMC free article] [PubMed] [Google Scholar]
- 9. Bica‐Pop C, Cojocneanu‐Petric R, Magdo L, Raduly L, Gulei D, Berindan‐Neagoe I. Overview upon miR‐21 in lung cancer: Focus on NSCLC. Cell Mol Life Sci 2018; 75 (19): 3539–51. [DOI] [PMC free article] [PubMed] [Google Scholar]
- 10. Reddy PS, Dhaware MG, Reddy DS et al Comprehensive evaluation of candidate reference genes for real‐time quantitative PCR (RT‐qPCR) data normalization in nutri‐cereal finger millet [Eleusine coracana (L.)]. PLOS One 2018; 13 (10): e0205668. [DOI] [PMC free article] [PubMed] [Google Scholar]
- 11. Zhao YJ, Song X, Niu L, Tang Y, Song X, Xie L. Circulating exosomal miR‐150‐5p and miR‐99b‐5p as diagnostic biomarkers for colorectal cancer. Front Oncol 2019; 9: 1129. [DOI] [PMC free article] [PubMed] [Google Scholar]
- 12. Agarwal V, Bell GW, Nam JW, Bartel DP. Predicting effective microRNA target sites in mammalian mRNAs. Elife 2015; 4: e05005. [DOI] [PMC free article] [PubMed] [Google Scholar]
- 13. Chen Y, Wang X. miRDB: An online database for prediction of functional microRNA targets. Nucleic Acids Res 2020; 48 (D1): D127–31. [DOI] [PMC free article] [PubMed] [Google Scholar]
- 14. da Huang W, Sherman BT, Lempicki RA. Bioinformatics enrichment tools: Paths toward the comprehensive functional analysis of large gene lists. Nucleic Acids Res 2009; 37 (1): 1–13. [DOI] [PMC free article] [PubMed] [Google Scholar]
- 15. Ferrigno D, Buccheri G, Biggi A. Serum tumour markers in lung cancer: History, biology and clinical applications. Eur Respir J 1994; 7 (1): 186–97. [DOI] [PubMed] [Google Scholar]
- 16. Shaw PA, Pepe MS, Alonzo TA, Etzioni R. Methods for assessing improvement in specificity when a biomarker is combined with a standard screening test. Stat Biopharm Res 2009; 1 (1): 18–25. [DOI] [PMC free article] [PubMed] [Google Scholar]
- 17. Kilgour E, Rothwell DG, Brady G, Dive C. Liquid biopsy‐based biomarkers of treatment response and resistance. Cancer Cell 2020; 37 (4): 485–95. [DOI] [PubMed] [Google Scholar]
- 18. Scaravilli M, Porkka KP, Brofeldt A et al MiR‐1247‐5p is overexpressed in castration resistant prostate cancer and targets MYCBP2. Prostate 2015; 75 (8): 798–805. [DOI] [PubMed] [Google Scholar]
- 19. Wang J, Raimondo M, Guha S et al Circulating microRNAs in pancreatic juice as candidate biomarkers of pancreatic cancer. J Cancer 2014; 5 (8): 696–705. [DOI] [PMC free article] [PubMed] [Google Scholar]
- 20. Chu Y, Fan W, Guo W et al miR‐1247‐5p functions as a tumor suppressor in human hepatocellular carcinoma by targeting Wnt3. Oncol Rep 2017; 38 (1): 343–51. [DOI] [PubMed] [Google Scholar]
- 21. Liu Q, Dong Z, Chen T. MiR‐1247‐5p functions as a tumor suppressor in human Astroglioma cells by targeting CDC14B. Ann Clin Lab Sci 2020; 50 (2): 182–9. [PubMed] [Google Scholar]
- 22. Zhang P, Fan C, Du J, Mo X, Zhao Q. Association of miR‐1247‐5p expression with clinicopathological parameters and prognosis in breast cancer. Int J Exp Pathol 2018; 99 (4): 199–205. [DOI] [PMC free article] [PubMed] [Google Scholar]
- 23. Zeng B, Li Y, Feng Y et al Downregulated miR‐1247‐5p associates with poor prognosis and facilitates tumor cell growth via DVL1/Wnt/beta‐catenin signaling in breast cancer. Biochem Biophys Res Commun 2018; 505 (1): 302–8. [DOI] [PubMed] [Google Scholar]
- 24. Fan H, Jin X, Liao C, Qiao L, Zhao W. MicroRNA‐301b‐3p accelerates the growth of gastric cancer cells by targeting zinc finger and BTB domain containing 4. Pathol Res Pract 2019; 215 (11): 152667. [DOI] [PubMed] [Google Scholar]
- 25. Guo Y, Yao B, Zhu Q et al MicroRNA‐301b‐3p contributes to tumour growth of human hepatocellular carcinoma by repressing vestigial like family member 4. J Cell Mol Med 2019; 23 (8): 5037–47. [DOI] [PMC free article] [PubMed] [Google Scholar]
- 26. Liu F, Zhang G, Lv S, Wen Z, Liu P. miRNA‐301b‐3p accelerates migration and invasion of high‐grade ovarian serous tumor via targeting CPEB3/EGFR axis. J Cell Biochem 2019; 120 (8): 12618–27. [DOI] [PubMed] [Google Scholar]
- 27. Zhang J, Wu W, Xu S et al MicroRNA‐105 inhibits human glioma cell malignancy by directly targeting SUZ12. Tumour Biol 2017; 39 (6): 1010428317705766. [DOI] [PubMed] [Google Scholar]
- 28. Shen G, Rong X, Zhao J et al MicroRNA‐105 suppresses cell proliferation and inhibits PI3K/AKT signaling in human hepatocellular carcinoma. Carcinogenesis 2014; 35 (12): 2748–55. [DOI] [PubMed] [Google Scholar]
- 29. Yang Q, Kong S, Zheng M et al Long intergenic noncoding RNA LINC00173 as a potential serum biomarker for diagnosis of non‐small‐cell lung cancer. Cancer Biomark 2020; 29 (4): 441–51. [DOI] [PubMed] [Google Scholar]
- 30. Dong X, Ding S, Yu M et al Small nuclear RNAs (U1, U2, U5) in tumor‐educated platelets are downregulated and act as promising biomarkers in lung cancer. Front Oncol 2020; 10: 1627. [DOI] [PMC free article] [PubMed] [Google Scholar]
- 31. Zhang Z, Tang Y, Song X, Xie L, Zhao S, Song X. Tumor‐derived exosomal miRNAs as diagnostic biomarkers in non‐small cell lung cancer. Front Oncol 2020; 10: 560025. [DOI] [PMC free article] [PubMed] [Google Scholar]
Associated Data
This section collects any data citations, data availability statements, or supplementary materials included in this article.
Supplementary Materials
Figure S1. Bioinformatic analysis for miR‐1247‐5p, miR‐301b‐3p and miR‐105‐5p. (a–c) Gene ontology enrichment analyses showed that the target genes of miRNA‐1247‐5p, miR‐301b‐3p, miR‐105‐5p. (d) KEGG pathway analysis for miR‐301b‐3p target genes. The vertical axis shows the annotated functions of the target genes, and the horizontal axis the enrichment score. GO, gene ontology; MF, molecular function; CC, cellular component; BP, biological process; KEGG, Kyoto Encyclopedia of Genes and Genome.
Figure S2. Analyses of miR‐1247‐5p, miR‐301b‐3p and miR‐105‐5p in stages III & IV NSCLC. (a–d) The ROC curve analysis of miR‐1247‐5p, miR‐301b‐3p, miR‐105‐5p, and combination of miRNAs for stages III & IV NSCLC. (e–g) No significant difference of miR‐1247‐5p, miR‐301b‐3p, or miR‐105‐5p was observed in either stages I & II or in stages III & IV.