

Abstract
Introduction
Lanabecestat, a beta‐site amyloid precursor protein‐cleaving enzyme 1 (BACE1) inhibitor, was investigated as a potential Alzheimer's disease (AD)‐modifying treatment. As previously reported, amyloid beta (Aβ) neuritic plaque burden reduction did not result in clinical benefit. Lanabecestat's effects on neuroimaging biomarkers and correlations between neuroimaging biomarkers and efficacy measures are reported.
Methods
AMARANTH and DAYBREAK‐ALZ were 104‐ and 78‐week, multicenter, randomized, double‐blind, placebo‐controlled studies of lanabecestat in early symptomatic AD (AMARANTH) and mild AD dementia (DAYBREAK‐ALZ). Patients randomly (1:1:1) received placebo, lanabecestat 20 mg, or lanabecestat 50 mg daily (AMARANTH, n = 2218; DAYBREAK‐ALZ, n = 1722). Florbetapir positron emission tomography (PET), fluorodeoxyglucose (FDG) PET, flortaucipir PET, and volumetric magnetic resonance imaging (MRI) were used to measure Aβ neuritic plaque burden, cerebral metabolism, aggregated tau neurofibrillary tangles, and brain volume, respectively. Additionally, florbetapir perfusion scans were performed in DAYBREAK‐ALZ. Efficacy measures included 13‐item Alzheimer's Disease Assessment Scale–Cognitive Subscale, Alzheimer's Disease Cooperative Study Activities of Daily Living Inventory, Clinical Dementia Rating–Sum of Boxes, Functional Activities Questionnaire, and Mini‐Mental State Examination. These studies stopped early due to futility.
Results
Despite previously observed annualized reduction in Aβ neuritic plaque burden, there were no treatment differences in annualized change of aggregated tau neurofibrillary tangle burden (AMARANTH, n = 284; DAYBREAK‐ALZ, n = 70), cerebral metabolism (AMARANTH, n = 260; DAYBREAK‐ALZ, n = 38) and perfusion (DAYBREAK‐ALZ, n = 213). Greater brain volume reduction (AMARANTH, n = 1697 [whole brain]; DAYBREAK‐ALZ, n = 650 [whole brain]) occurred on lanabecestat compared to placebo. Higher baseline aggregated tau neurofibrillary tangle burden, lower cerebral metabolism, and lower brain volumes correlated with poorer baseline efficacy scores and greater clinical worsening. Lower baseline cerebral perfusion correlated with poorer baseline efficacy scores. Reduction in cerebral metabolism or whole brain volume correlated with clinical worsening, regardless of treatment assignment.
Discussion
Tau pathology and cerebral metabolism assessments showed no evidence of lanabecestat slowing pathophysiologic progression of AD. Lanabecestat exposure was associated with brain volume reductions. Correlations between imaging measures and cognitive assessments may aid future study design.
Keywords: Alzheimer's disease, amyloid, beta‐site amyloid precursor protein‐cleaving enzyme BACE inhibitor, cerebral metabolism, cerebral perfusion, florbetapir, flortaucipir, fluorodeoxyglucose, lanabecestat, magnetic resonance imaging, mild cognitive impairment, positron emission tomography, tau
1. BACKGROUND
Alzheimer's disease (AD) is a fatal neurodegenerative disorder associated with progressive cognitive deterioration and impairment of daily activities. 1 Pathological changes associated with AD include accumulation of amyloid beta (Aβ) neuritic plaques and aggregated tau neurofibrillary tangles, and neurodegeneration. 2 Beta‐site amyloid precursor protein‐cleaving enzyme 1 (BACE1) is a type I transmembrane aspartic protease related to the pepsin and retroviral aspartic protease families. 3 BACE inhibitors were considered for use in preventing Aβ peptide generation, reducing the detrimental effects of Aβ toxicity, and reducing the formation of amyloid plaques in the brain, with the goal of slowing AD progression. Lanabecestat, a brain‐permeable inhibitor of human BACE1 (β‐secretase), was under investigation as a potential disease‐modifying treatment for AD 4 , 5 at once daily doses of 20 mg or 50 mg. AMARANTH was a 104‐week Phase 2/3 study in patients with early symptomatic AD (mild cognitive impairment [MCI] due to AD and mild AD dementia), whereas DAYBREAK‐ALZ was a 78‐week, Phase 3 study in patients with mild AD dementia; these studies were stopped early due to futility.
As published, lanabecestat failed to slow cognitive or functional decline compared to placebo in patients with early symptomatic AD or mild AD dementia, despite cerebrospinal fluid (CSF) and florbetapir positron emission tomography (PET) evidence supportive of target engagement. 5 In AMARANTH, which had more patients contributing longitudinal data than DAYBREAK‐ALZ at the time of study termination, CSF Aβ1‐42 concentration was reduced by 51.3% and 65.5% in lanabecestat 20 mg and 50 mg groups, respectively. In completers of AMARANTH (n = 376 included in florbetapir PET analysis), least squares mean (standard error) Centiloid reduction was 2.1 (1.9), 15.8 (1.9), and 19.7 (2.0) for placebo, lanabecestat 20 mg, and lanabecestat 50 mg groups, respectively. 5 Centiloid is a standardized scale of PET measures of amyloid plaque burden. 6
Multiple imaging modalities were incorporated into AMARANTH and DAYBREAK‐ALZ to characterize effects of lanabecestat treatment on key pathological changes associated with AD. Florbetapir PET, fluorodeoxyglucose PET (FDG PET), flortaucipir PET, and volumetric magnetic resonance imaging (MRI) were used to measure Aβ neuritic plaque burden, cerebral metabolism, aggregated tau neurofibrillary tangles, and brain volume, respectively. Additionally, florbetapir perfusion scans were performed in DAYBREAK‐ALZ to measure cerebral perfusion. In this report, we present additional results of lanabecestat treatment on these neuroimaging assessments. Correlations between neuroimaging parameters and key clinical efficacy measures are reported.
2. METHODS
2.1. Study design and patient population
AMARANTH (NCT02245737) and DAYBREAK‐ALZ (NCT02783573) were 104‐ and 78‐week, multicenter, randomized, double‐blind, placebo‐controlled studies of lanabecestat in patients with early symptomatic AD and mild AD dementia, respectively 5 Details of the study design and patient population were reported previously. 5 Key details of study design are provided in Table 1. 5 The study was conducted in accordance with ethical principles originating from the Declaration of Helsinki and was consistent with good clinical practice and applicable regulatory requirements. 7 Before enrollment, all patients, their legal representatives when applicable, and study partners provided written informed consent.
TABLE 1.
AMARANTH and DAYBREAK‐ALZ study characteristics
| Characteristic | Timepoint | BOTH STUDIES | AMARANTH | DAYBREAK‐ALZ |
|---|---|---|---|---|
| Phase | 2/3 | 3 | ||
| Indication |
Early symptomatic AD (MCI due to AD and mild AD dementia) |
Mild AD dementia | ||
| Clinicaltrials.gov identifier | NCT02245737 | NCT02783573 | ||
| Treatment dose | Lanabecestat 20 mg, 50 mg, or placebo once daily | |||
| Study duration | 104 weeks; placebo‐controlled treatment | 78 weeks; placebo‐controlled treatment | ||
| Total patients enrolled and randomized | 2218 | 1722 | ||
| Key inclusion criteria |
|
MCI: meet NIA‐AA criteria with a CDR‐global score of 0.5, with memory box score ≥0.5 RBANS DMI ≤85 |
N/A | |
| Key exclusion criteria |
|
|||
| Neuroimaging assessments schedule | Screening/Baseline |
|
|
|
| Week 39 | N/A |
|
||
| Week 52 |
|
N/A | ||
| Week 78 | N/A |
|
||
| Week 104 |
|
N/A | ||
| Efficacy assessments schedule | Screening/Baseline |
|
|
|
| Week 13 |
|
|
||
| Week 26 |
|
|
||
| Week 39 | N/A |
|
||
| Week 52 |
|
|
||
| Week 65 | N/A |
|
||
| Week 78 |
|
|
||
| Week 104 |
|
N/A |
Abbreviations: AD, Alzheimer's disease; ADAS‐Cog13, 13‐item Alzheimer's Disease Assessment Scale‐Cognitive Subscale; ADCS‐ADL, Alzheimer's Disease Cooperative Study‐Activities of Daily Living Inventory; CDR, Clinical Dementia Rating; CSF, cerebrospinal fluid; FAQ, Functional Activities Questionnaire; FDG, fluorodeoxyglucose; MCI, mild cognitive impairment; MMSE, Mini‐Mental State Examination; MRI, magnetic resonance imaging; N/A, not applicable; NIA‐AA, National Institute on Aging‐Alzheimer's Association; PET, positron emission tomography; QTcF, QT interval corrected using Fridericia's formula; RBANS DMI, Repeatable Battery for the Assessment of Neuropsychological Status Delayed Memory Index.
2.2. Study treatment
In both studies, patients randomly (1:1:1) received lanabecestat 20 mg, lanabecestat 50 mg, or placebo orally once daily for the duration of the double‐blind placebo‐controlled periods. 5
2.3. Study assessments
A schedule of neuroimaging and efficacy study assessments is outlined in Table 1. Imaging operationalization details and imaging methods are summarized in the supporting information (Appendix S1). If early discontinuation occurred, patients were to undergo efficacy assessments if more than 12 weeks since they were last administered, and all longitudinal neuroimaging assessments for which they were eligible if the time of discontinuation occurred at least 24 weeks after the previous assessment. All MRI and PET imaging was performed under the management of a central vendor. 5
In both studies, randomized patients who had a florbetapir PET scan at screening participated in the longitudinal florbetapir PET imaging substudy. In DAYBREAK‐ALZ, at imaging sites with capability, an optional perfusion florbetapir PET scan was also performed. Other key details regarding imaging eligibility are outlined in the following bullets.
In AMARANTH, only patients participating in the longitudinal florbetapir PET imaging substudy could enroll in the flortaucipir PET or FDG PET imaging addendum.
In DAYBREAK‐ALZ, patients could enroll in either the flortaucipir PET or FDG PET imaging addenda, regardless of the method used for confirmation of the presence of amyloid at screening (CSF or PET).
In both studies, eligible patients enrolled in either flortaucipir PET or FDG PET imaging addenda; they could not participate in both imaging addenda.
All randomized patients were to have had serial MRIs of the brain (Table 1). 5
2.4. Statistics for assessing effects of lanabecestat treatment on neuroimaging assessments
All PET scans and volumetric MRI changes from baseline were computed and then converted to annualized changes by dividing the change from baseline to the last observation by the exposure days and multiplying by 365. 5 Least squares (LS) mean changes were computed using analysis of covariance models with disease status at baseline (AMARANTH only), baseline value of the biomarker of interest, age at baseline, and treatment as model terms. Volumetric MRI also included intracranial volume in the model to adjust for inter‐patient variability in head size. All MRI regions were reported as the sum of the left and right hemisphere volumes in each patient. Annualized LS mean percent change relates the mean change of the last observation carried forward (LOCF) to the corresponding average baseline volume and normalizes the fraction to 52 weeks. All statistical tests were two tailed, conducted using a nominal critical value cut‐off of 0.05, and were not adjusted for multiplicity, because these analyses were exploratory as per the study protocol. For flortaucipir and FDG PET, patients with a baseline scan acquired no more than 28 days after starting study drug and at least one post‐baseline scan were included in the analysis.
2.5. Methods and statistics for correlations of neuroimaging assessments with efficacy measures
Spearman correlation analyses were performed to assess the association between imaging modalities (florbetapir PET, flortaucipir PET, FDG PET, florbetapir perfusion PET, volumetric MRI), and the following efficacy measures: 13‐item Alzheimer's Disease Assessment Scale–Cognitive Subscale (ADAS‐Cog13), 8 , 9 Mini‐Mental State Exam (MMSE), 10 Alzheimer's Disease Cooperative Study Activities of Daily Living Inventory (ADCS‐ADL), 11 Functional Activities Questionnaire (FAQ), 12 and Clinical Dementia Rating–Sum of Boxes (CDR‐SB). 13 For ADAS‐Cog13, FAQ, and CDR‐SB, higher scores indicate worse performance. Conversely, for ADCS‐ADL and MMSE, lower scores indicate worse performance. To depict worsening in the same direction for all cognitive measures (such that a lower score on a cognitive measure reflects worse performance), the correlations for ADAS‐Cog13, FAQ, and CDR‐SB were multiplied by –1 in the forest plots. Statistical tests were two tailed, conducted using a nominal critical value cut‐off of 0.05, and were not adjusted for multiplicity, because these analyses were exploratory as per the study protocol. The procedure for creating the confidence intervals for correlation coefficients was based on the results of Bonett and Wright. 14
For both studies, after protocol‐planned study results were reviewed, partial correlation analyses (adjusted for apolipoprotein E [APOE] ε4 carrier status [yes/no], age, and sex) were conducted between baseline imaging modalities versus baseline efficacy measures, as well as between baseline imaging modalities versus change in efficacy measures. Baseline volumetric MRI measures were converted to a percent of intracranial volume (ICV) prior to the correlation analysis. For the correlations of baseline imaging modalities versus change in efficacy measures, week 97 to week 104 was used as endpoint for AMARANTH. DAYBREAK‐ALZ used an endpoint of week 45 to week 52, because <5% of patients completed the placebo‐controlled period at the time of study termination.
Correlation analyses to assess associations between change in imaging modalities and change in efficacy measures were performed in AMARANTH only, as a limited number of patients in DAYBREAK‐ALZ had both imaging and efficacy measures available at week 45 to week 52. To accommodate data from a larger number of study participants, data from participants reaching week 97 of the study were included, rather than the protocol‐specified analysis of study completers only. Correlations were analyzed between change from baseline to endpoint (week 97 to week 104) in imaging modalities versus change in efficacy measures.
3. RESULTS
In AMARANTH, 2218 patients were enrolled (placebo, n = 740; lanabecestat 20 mg, n = 739; lanabecestat 50 mg, n = 739), of which 539 (24.3%) completed and 1679 (75.7%) discontinued the double‐blind treatment period. In DAYBREAK‐ALZ, 1722 patients were enrolled (placebo, n = 562; lanabecestat 20 mg, n = 590; lanabecestat 50 mg, n = 570), of which 76 (4.4%) completed and 1646 (95.6%) discontinued the double‐blind treatment period (Figure 1). 5 Baseline patient characteristics for longitudinal imaging subsets assessing effects of lanabecestat on neuroimaging assessments are provided in Tables S1a‐f in supporting information.
FIGURE 1.
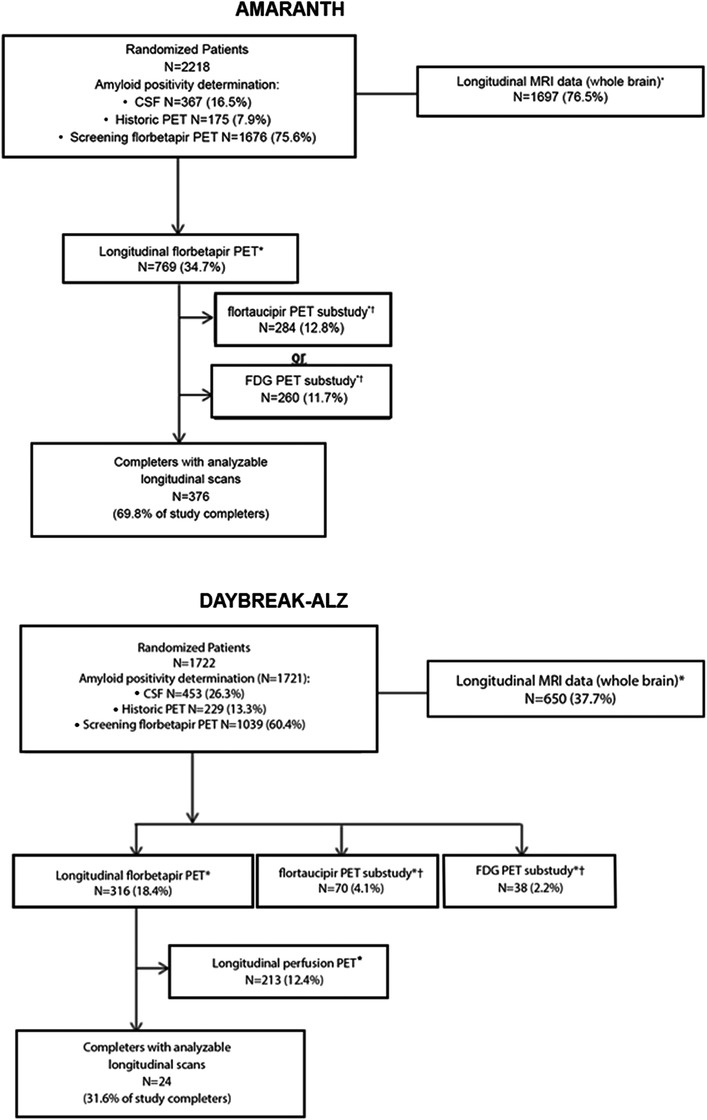
Patient disposition (AMARANTH and DAYBREAK‐ALZ).
*Number of patients with baseline scan and analyzable post‐baseline scan. †Patients could participate in the flortaucipir PET or FDG PET imaging substudy (not both) and could also participate in the longitudinal florbetapir PET imaging substudy. Note: percentages are proportion of randomized patients, unless otherwise noted. Abbreviations: CSF, cerebrospinal fluid; FDG, fluorodeoxyglucose; MRI, magnetic resonance imaging; PET, positron emission tomography
3.1. Effects of lanabecestat treatment on neuroimaging assessments
As previously published, lanabecestat exposure was associated with a greater annualized reduction in Aβ neuritic plaque burden compared to placebo, as measured by florbetapir PET. 5 In contrast, in both studies, no significant differences in aggregated tau neurofibrillary tangle burden were observed between either of the lanabecestat groups and placebo, as measured by annualized LS mean change from baseline in flortaucipir standardized uptake volume ratio (SUVr; Figure 2). Similarly, no significant differences in cerebral metabolism and perfusion were observed between either the lanabecestat and the placebo groups, as measured by annualized LS mean change from baseline in FDG SUVr (Figure 3) or florbetapir perfusion SUVr in DAYBREAK‐ALZ (Figure 4), respectively. The annualized LS mean change from baseline of hippocampal volume as measured by volumetric MRI have been previously reported; 5 the results presented in Figure 5 represent the LS mean change of whole brain and ventricular volumes in addition to differences in hippocampal volumes, presented as previously reported. In AMARANTH, statistically greater reductions from baseline in whole brain and hippocampal volumes were observed with lanabecestat 20 mg and 50 mg compared to placebo. However, in DAYBREAK‐ALZ, statistically greater reduction in whole brain volume was observed only with lanabecestat 50 mg compared to placebo, and no significant differences were observed in hippocampal volume between either of the lanabecestat dose groups and the placebo group. In both studies, no significant differences in ventricular volumes were observed between either of the two treatment groups and the placebo group (Figure 5). In both studies, analyses of several other regions demonstrated greater volume reduction in the lanabecestat groups compared to the placebo group (Table S2 in supporting information). Annualized LS mean percent change in whole brain, hippocampal, and ventricular volume are provided in Table S3 in supporting information.
FIGURE 2.
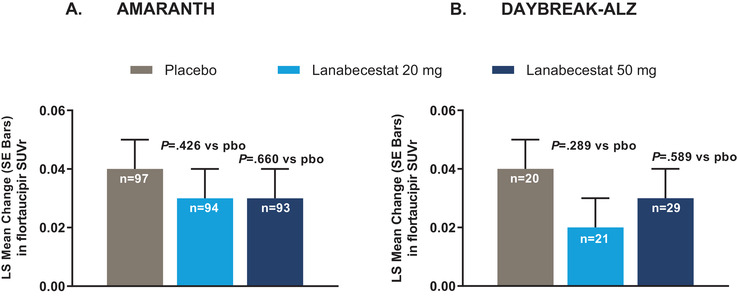
Annualized LS mean change from baseline in flortaucipir SUVr from AMARANTH (A) and DAYBREAK‐ALZ (B) studies.
No significant differences in aggregated tau neurofibrillary tangle burden were observed between either of the lanabecestat groups and placebo. Abbreviations: LS, least squares; pbo, placebo; SE, standard error; SUVr, standardized uptake value ratio (in a composite neocortical region with white matter as a reference).
FIGURE 3.
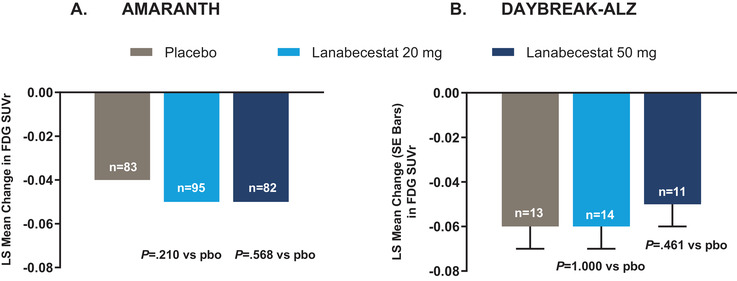
Annualized LS mean change from baseline in FDG PET SUVr from AMARANTH (A) and DAYBREAK‐ALZ (B) studies.
No significant differences in cerebral metabolism were observed between either of the lanabecestat groups and placebo. The standard errors for LS mean change in FDG SUVr in placebo, lanabecestat 20 mg, and lanabecestat 50 mg groups from AMARANTH study were < 0.01. Abbreviations: FDG, fluorodeoxyglucose; LS, least squares; pbo, placebo; PET, positron emission tomography; SE, standard error; SUVr, standardized uptake value ratio (in a composite region with pons plus vermis as a reference).
FIGURE 4.
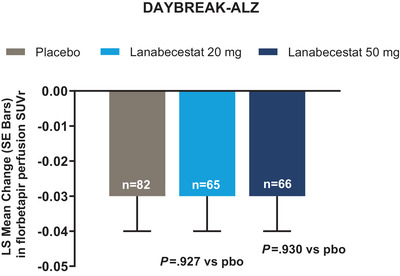
Annualized LS mean change from baseline in florbetapir perfusion SUVr from DAYBREAK‐ALZ study.
No significant differences in cerebral perfusion were observed between either of the lanabecestat groups and placebo. Abbreviations: LS, least squares; pbo, placebo; PET, positron emission tomography; SE, standard error; SUVr, standardized uptake value ratio (in a composite region with pons plus vermis as a reference).
FIGURE 5.
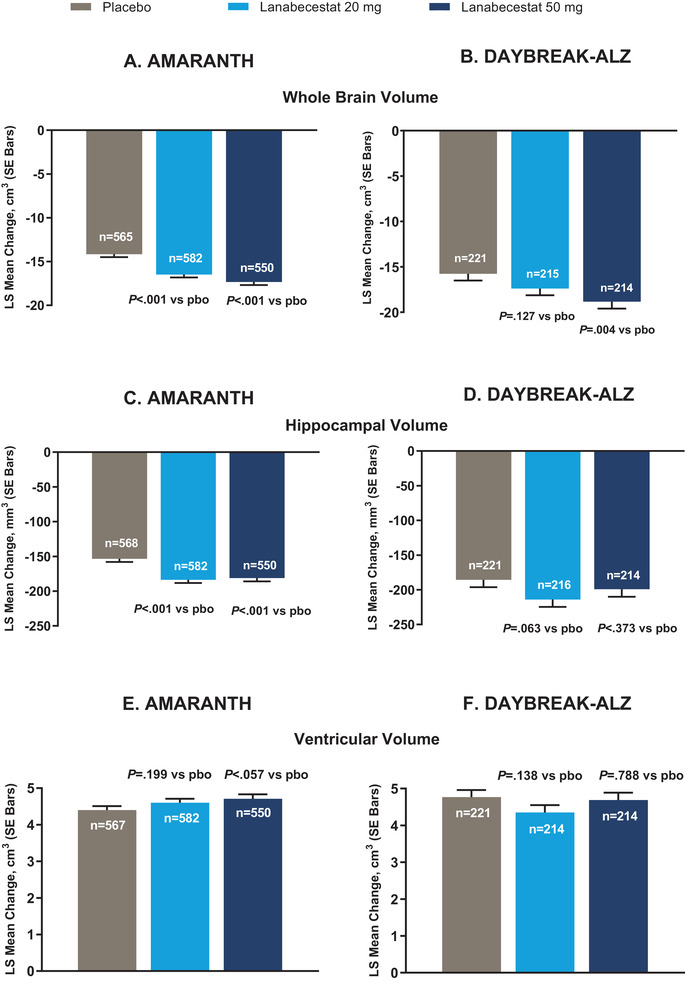
Annualized LS mean change from baseline of whole brain volume, hippocampal volume, and ventricular volumes as measured by volumetric MRI from AMARANTH and DAYBREAK‐ALZ studies.
Significantly greater decrease in whole brain volume was observed for lanabecestat 20 mg and 50 mg groups in (A) AMARANTH and for lanabecestat 50 mg group in (B) DAYBREAK‐ALZ compared to placebo. Significantly greater decrease in hippocampal volume was observed for lanabecestat 20 mg and 50 mg groups compared to placebo in (C) AMARANTH, but not in (D) DAYBREAK‐ALZ. No significant differences in ventricular enlargement were observed between either of the lanabecestat groups and placebo (E, F). P values nominal and not adjusted for multiplicity. Hippocampal volumes figure reprinted with permission from Wessels et al. 5 Abbreviations: LS, least squares; pbo, placebo; SE, standard error; vMRI, volumetric magnetic resonance imaging.
3.2. Correlations of neuroimaging assessments with efficacy measures
In both studies, baseline Aβ neuritic plaque burden was not consistently correlated with baseline scores of efficacy measures or changes in efficacy scores. Higher baseline aggregated tau neurofibrillary tangle burden (AMARANTH, P value ≤0.05 for 11 of 15 comparisons), lower baseline cerebral metabolism (AMARANTH, 12 of 15 comparisons) or cerebral perfusion (DAYBREAK‐ALZ, 13 of 15 comparisons), and lower baseline brain volumes (AMARANTH, 15 of 15 comparisons; DAYBREAK‐ALZ, 13 of 15 comparisons) were typically correlated with poorer baseline scores on efficacy measures (Table S4, Figure S1 in supporting information). Higher baseline aggregated tau neurofibrillary tangle burden (AMARANTH, 9 of 15 comparisons), lower baseline cerebral metabolism (AMARANTH, 15 of 15 comparisons), and lower baseline brain volumes (AMARANTH, 15 of 15 comparisons; DAYBREAK‐ALZ, 11 of 15 comparisons) were consistently associated with worsening of efficacy measures over the period of observation (Table S5, Figure S2 in supporting information).
In AMARANTH, a decrease in Aβ neuritic plaque burden, as indicated by a decrease in florbetapir PET SUVr, was at times correlated with worsening of performance (5 of 15 comparisons). No significant correlations were observed between change in aggregated tau neurofibrillary tangles and change in efficacy scores. Decrease in cerebral metabolism and decrease in whole brain volume were associated with worsening on all efficacy measures (15 of 15 comparisons for each modality), and lanabecestat exposure did not alter these correlations (Table S6, Figure S3 in supporting information).
4. DISCUSSION
4.1. Effects of lanabecestat treatment on neuroimaging assessments
The robust imaging dataset collected during AMARANTH and DAYBREAK‐ALZ permitted extensive evaluation of the effects of lanabecestat on underlying disease pathology in patients with early symptomatic AD and mild AD dementia. Lanabecestat exposure was associated with reduction in Aβ neuritic plaque burden. The observed reduction in Aβ plaque burden together with the reduction of CSF Aβ is supportive of successful target engagement of lanabecestat. 5
In addition to accumulation of amyloid plaques, AD is characterized by progressive accumulation of neurofibrillary tangles and neurodegeneration. 15 In the placebo groups of both AMARANTH and DAYBREAK‐ALZ, longitudinal changes in aggregated tau neurofibrillary tangles and neurodegeneration as assessed by cerebral metabolism or brain volume were directionally consistent with previous characterizations of disease progression. 15 Despite lanabecestat‐associated reduction in Aβ neuritic plaque burden, analyses of aggregated tau neurofibrillary tangle burden, cerebral metabolism, and perfusion failed to demonstrate significant differences in either lanabecestat dose group compared to placebo. It is still unknown whether targeting the amyloid pathway earlier in the disease continuum may have downstream effects on these biomarkers. It is also possible that the amount of Aβ reduction seen in these studies was insufficient to modify pathologic tau accumulation, cerebral metabolism, or perfusion, or that a relationship between Aβ and other pathophysiologic indicators of disease progression is not pronounced or does not exist at this stage in the disease.
In these studies, lanabecestat exposure was associated with greater reduction in brain volumes compared to placebo. Preclinical and clinical studies of the effects of BACE1 inhibition on brain structure may help elucidate the mechanism and clinical meaningfulness of the observed reduction in brain volumes. In recently published animal studies, chronic blockade of BACE1 activity altered synaptic functions and reduced formation of new dendritic spines. 16 Impaired processing of Sez6, a BACE1 substrate and potential modulator of synaptic function, may contribute to synaptic changes. 17 Conditional BACE1 knockout mice exhibit a BACE1‐null phenotype involving disorganization and shortening of an axonal pathway in the hippocampus. 18 Another BACE1 inhibitor, verubecestat, reduced hippocampal volume when studied in people with prodromal and mild to moderate AD. 19 , 20 Recent exploratory analyses from a Phase 3 study in people with mild to moderate AD demonstrated that verubecestat‐associated volume reduction occurred by 13 weeks of exposure then remained comparable between verubecestat and placebo groups for the remainder of the 78‐week study. 21 The volume reduction only occurred in amyloid‐enriched brain regions and did not correlate with the magnitude of disease‐related neurodegeneration or cognitive impairment, suggesting the volume reduction may be related to specific effects of verubecestat on amyloid‐related processes rather than generalized or progressive neurotoxic effects. 21 MRI analyses of brain volumes after atabecestat exposure in people with preclinical AD and MCI due to AD did not show a clear treatment‐related difference. 22 However, the sample size was limited. It therefore remains possible there is a BACE1 inhibitor class effect of reducing brain volumes. The mechanism and clinical meaningfulness of the observation remain unknown. Whether lesser BACE1 inhibition would result in a similar observation also remains unknown, and authors of a recently published in vitro assessment of BACE1 inhibitors in cultured neurons suggest that lesser BACE1 inhibition may not be associated with synaptic dysfunction. 23
4.2. Correlations of neuroimaging assessments with efficacy measures
Due to the robust amount of biomarker data collected in these studies, exploratory analyses of correlations were performed to compare the neuroimaging assessments to cognitive and functional efficacy measures. In both studies, baseline Aβ neuritic plaque burden was not consistently correlated either directionally or across cognitive and functional measures, with <10% of comparisons reaching significance for baseline or longitudinal efficacy measures included in the correlation analyses. However, in the majority of comparisons, higher baseline aggregated tau neurofibrillary tangle burden (AMARANTH) or greater neurodegeneration as assessed by cerebral metabolism (AMARANTH) or brain volume (AMARANTH and DAYBREAK‐ALZ) correlated with poorer baseline efficacy scores and worsening of scores. Lower baseline cerebral perfusion also correlated with poorer baseline performance in the majority of comparisons but not with worsening of scores, although this analysis may be impacted by the short period of observation and low numbers of patients included in the DAYBREAK‐ALZ analysis. The correlations between baseline imaging results and change in cognitive and functional performance at this point in the AD continuum might be helpful for selecting patient populations at risk of disease progression, 24 , 25 and support findings from a recent publication. 26
In AMARANTH, decreases in cerebral metabolism and decreases in whole brain volume were consistently associated with worsening of cognitive and functional performance. These findings support the use of biomarkers as evidence of disease modification in clinical trials. A decrease in Aβ neuritic plaque burden as measured by florbetapir PET SUVr was associated with worsening on the MMSE score in all groups and with worsening of the ADAS‐Cog13 score in placebo and lanabecestat 20 mg groups. However, this relationship may be due in part to multiple comparisons or lack of adjustment for volume changes.
4.3. Strengths and limitations
This imaging dataset is one of the largest currently available for the early symptomatic AD population based on the types and number of imaging biomarkers collected in these Phase 2/3 and Phase 3 studies. Analysis of this dataset contributes to the understanding of the nature of these biomarkers in this population, regardless of treatment assignment. Incorporating the use of biomarkers of pathologic tau accumulation and neurodegeneration in selection of study participants could be used as a methodology to identify participants with higher or lower rates of decline. Obtaining early frame scans during PET imaging sessions in clinical trials may allow for assessment of cerebral perfusion with a single administration of a PET tracer, lessening study participant burden and radiation exposure.
These studies terminated early due to futility, resulting in an overall study duration shorter than planned. Some eligible patients declined assessments at early discontinuation visits, further decreasing sample sizes. These limited sample sizes may have impacted the ability of these studies to detect more sensitive changes in performance and imaging measures. Annualized change analyses have allowed for more data inclusion, which is beneficial given the early study terminations, but it assumes a linear rate of change in biomarkers. The potential impact of cerebrovascular conditions was not accounted for in these analyses. Despite the limitations, these results provide useful information regarding imaging biomarker assessments in people with early symptomatic AD and mild dementia with or without exposure to lanabecestat.
5. CONCLUSIONS
The integration of multiple neuroimaging modalities into these Phase 2/3 or Phase 3 studies, AMARANTH and DAYBREAK‐ALZ, facilitated a thorough assessment of the effects of BACE1 inhibition by lanabecestat on AD pathology. Despite evidence from these studies that lanabecestat reduces Aβ neuritic plaque burden, no significant changes from baseline in aggregated tau neurofibrillary tangle burden, cerebral metabolism, and perfusion were observed. Greater brain volume reduction was observed in several regions in lanabecestat groups compared to placebo. Whether less BACE1 inhibition or intervention earlier in the disease process would yield similar results needs to be investigated. Correlations between biomarkers and cognitive and functional performance generated from these studies may aid in future study designs.
CONFLICTS OF INTEREST
Drs Zimmer, Shcherbinin, Devous, Selzler, Wessels, Downing, Fleisher, Otero Svaldi, and Sims; Ms Bragg; Messrs Landry and Andersen reported being full‐time employees and minor shareholders of Eli Lilly and Company. Drs Shering and Mullen reported being employees of AstraZeneca, which holds the intellectual property for lanabecestat, and being minor shareholders of AstraZeneca. Dr Mullen is a former AstraZeneca employee.
FUNDING INFORMATION
Eli Lilly and Company and AstraZeneca provided the funding for the study. Eli Lilly and Company was responsible for data collection, monitoring, and statistical analyses. AstraZeneca was responsible for manufacturing investigational product and matching placebo. AstraZeneca participated in the study designs, and both companies interpreted the data and reviewed the manuscript. All final content decisions were made by the authors.
Supporting information
Supplementary Table S1a: Demographics and baseline characteristics of patients with data included in analysis of annualized LS mean change from baseline in florbetapir SUVr from AMARANTH and DAYBREAK‐ALZ studies.
Supplementary Table S1b. Demographics and baseline characteristics of patients with data included in analysis of change from baseline in florbetapir PET scan in study completers from AMARANTH and DAYBREAK‐ALZ studies.
Supplementary Table S1c. Demographics and baseline characteristics of patients with data included in annualized LS mean change from baseline in flortaucipir SUVr from AMARANTH and DAYBREAK‐ALZ‐studies.
Supplementary Table S1d. Demographics and baseline characteristics of patients with data included in annualized in LS mean change from baseline in FDG PET SUVr from AMARANTH and DAYBREAK‐ALZ studies.
Supplementary Table S1e. Demographics and baseline characteristics of patients with data included in annualized LS mean change from baseline in florbetapir perfusion SUVr from DAYBREAK‐ALZ study.
Supplementary Table S1f. Demographics and baseline characteristics of patients with data included in annualized LS mean change from baseline of whole brain volume, hippocampal volume, and ventricular volumes as measured by volumetric MRI from AMARANTH and DAYBREAK‐ALZ studies.
Supplementary Table S2. vMRI results from AMARANTH and DAYBREAK‐ALZ – Annualized LS mean change.
Supplementary Table S3: vMRI results from AMARANTH and DAYBREAK‐ALZ – Annualized LS mean percent change.
Supplementary Table S4. Correlation analysis between baseline imaging measures versus baseline efficacy measures.
Supplementary Figure S1. Correlation analysis between baseline imaging measures versus baseline efficacy measures.
Supplementary Table S5. Correlation analysis between baseline imaging measures versus change in efficacy measures. Post‐baseline efficacy measures are Weeks 97‐104 for AMARANTH and Weeks 45‐52 for DAYBREAK‐ALZ.
Supplementary Figure S2. Correlation analysis between baseline imaging measures versus change in efficacy measures.
Supplementary Table S6. Correlation analysis between change in imaging measures versus change in efficacy measures. Post‐baseline measures are Weeks 97‐104.
Supplementary Figure S3. Correlation analysis between change in imaging measures versus change in efficacy measures.
ACKNOWLEDGMENTS
Editorial support was provided by Diane Cleverley, PhD (full‐time employee of Certara); Kalyan Pulipaka, MSc, MBA; and Swati Bhandari, PhD (full‐time employees of Eli Lilly Services India Private Limited). Certara received compensation for writing support. We thank Christopher Aluise, PhD, for critical review of the discussion of BACE1 inhibition in animals. We thank all of the patients, site employees, investigators, vendor partners, employees, and former employees of Eli Lilly and Company and AstraZeneca.
Zimmer JA, Shcherbinin S, Devous MD, et al. Lanabecestat: Neuroimaging results in early symptomatic Alzheimer's disease. Alzheimer's Dement. 2021;7:e12113 10.1002/trc2.12123
Trial registration: NCT02245737 and NCT02783573
REFERENCES
- 1. Reitz C, Brayne C, Mayeux R. Epidemiology of Alzheimer disease. Nat Rev Neurol. 2011;7(3):137‐152. [DOI] [PMC free article] [PubMed] [Google Scholar]
- 2. Jack CR Jr, et al. A/T/N: an unbiased descriptive classification scheme for Alzheimer disease biomarkers. Neurology. 2016;87(5):539‐547. [DOI] [PMC free article] [PubMed] [Google Scholar]
- 3. Yan R, Vassar R. Targeting the beta secretase BACE1 for Alzheimer's disease therapy. Lancet Neurol. 2014;13(3):319‐329. [DOI] [PMC free article] [PubMed] [Google Scholar]
- 4. Eketjall S, et al. AZD3293: a novel, orally active BACE1 inhibitor with high potency and permeability and markedly slow off‐rate kinetics. J Alzheimers Dis. 2016;50(4):1109‐1123. [DOI] [PMC free article] [PubMed] [Google Scholar]
- 5. Wessels AM, et al. Efficacy and safety of lanabecestat for treatment of early and mild Alzheimer disease: the AMARANTH and DAYBREAK‐ALZ randomized clinical trials. JAMA Neurol. 2020;77(2):199‐209. [DOI] [PMC free article] [PubMed] [Google Scholar]
- 6. Navitsky M, et al. Standardization of amyloid quantitation with florbetapir standardized uptake value ratios to the Centiloid scale. Alzheimers Dement. 2018;14(12):1565‐1571. [DOI] [PubMed] [Google Scholar]
- 7. World Medical Association . World Medical Association Declaration of Helsinki: ethical principles for medical research involving human subjects. JAMA., 2013; 310(20):2191‐2194. [DOI] [PubMed] [Google Scholar]
- 8. Mohs RC, et al. Development of cognitive instruments for use in clinical trials of antidementia drugs: additions to the Alzheimer's Disease Assessment Scale that broaden its scope. The Alzheimer's Disease Cooperative Study. Alzheimer Dis Assoc Disord. 1997;11(Suppl 2):S13‐21. [PubMed] [Google Scholar]
- 9. Rosen WG, Mohs RC, Davis KL. A new rating scale for Alzheimer's disease. Am J Psychiatry. 1984;141(11):1356‐1364. [DOI] [PubMed] [Google Scholar]
- 10. Folstein MF, Folstein SE, McHugh PR. Mini‐mental state”. A practical method for grading the cognitive state of patients for the clinician. J Psychiatr Res. 1975;12(3):189‐198. [DOI] [PubMed] [Google Scholar]
- 11. Galasko D, et al. An inventory to assess activities of daily living for clinical trials in Alzheimer's disease. The Alzheimer's Disease Cooperative Study. Alzheimer Dis Assoc Disord. 1997;11(Suppl 2):S33‐S39. [PubMed] [Google Scholar]
- 12. Pfeffer RI, Kurosaki TT, Harrah CH Jr, Chance JM, Filos S. Measurement of functional activities in older adults in the community. J Gerontol. 1982;37(3):323‐329. [DOI] [PubMed] [Google Scholar]
- 13. Hughes CP, Berg L, Danziger WL, Coben LA, Martin RL. A new clinical scale for the staging of dementia. Br J Psychiatry. 1982;140:566‐572. [DOI] [PubMed] [Google Scholar]
- 14. Bonett DG, Wright TA. Sample size requirements for estimating pearson, kendall and spearman correlations. Psychometrika. 2000;65:23‐28. [Google Scholar]
- 15. Jack CR Jr, Petersen RC, Xu YC, et al. hetical model of dynamic biomarkers of the Alzheimer's pathological cascade. Lancet Neurol. 2010;9(1):119‐128. [DOI] [PMC free article] [PubMed] [Google Scholar]
- 16. Blume T, Filser S, Jaworska A, et al. BACE1 inhibitor MK‐8931 alters formation but not stability of dendritic spines. Front Aging Neurosci. 2018;10:229. [DOI] [PMC free article] [PubMed] [Google Scholar]
- 17. Zhu K, Peters F, Filser S, Herms J. Consequences of pharmacological BACE inhibition on synaptic structure and function. Biol Psychiatry. 2018;84(7):478‐487. [DOI] [PubMed] [Google Scholar]
- 18. Ou‐Yang MH, Kurz JE, Nomur T, et al. Axonal organization defects in the hippocampus of adult conditional BACE1 knockout mice. Sci Transl Med. 2018;10(459). [DOI] [PMC free article] [PubMed] [Google Scholar]
- 19. Egan MF, Kost J, Tariot PN, et al. Randomized trial of verubecestat for mild‐to‐moderate Alzheimer's disease. N Engl J Med. 2018;378(18):1691‐1703. [DOI] [PMC free article] [PubMed] [Google Scholar]
- 20. Egan MF, Kost J, Voss T, et al. Randomized trial of verubecestat for prodromal Alzheimer's disease. N Engl J Med. 2019;380(15):1408‐1420. [DOI] [PMC free article] [PubMed] [Google Scholar]
- 21. Sur C, et al. O3‐10‐02: verubecestat‐Induced brain volume loss occurs rapidly and only in amyloid‐enriched brain regions in EPOCH, a phase 3 trial in mild‐to‐moderate Alzheimer's disease patients. Alzheimer's Dement. 2019;15:P909‐P09. [Google Scholar]
- 22. Novak G, Streffer JR, Timmers M, et al. Long‐term safety and tolerability of atabecestat (JNJ‐54861911), an oral BACE1 inhibitor, in early Alzheimer's disease spectrum patients: a randomized, double‐blind, placebo‐controlled study and a two‐period extension study. Alzheimers Res Ther. 2020;12(1):58. [DOI] [PMC free article] [PubMed] [Google Scholar]
- 23. Satir TM, Agholme L, Karlsson A, et al. Partial reduction of amyloid beta production by beta‐secretase inhibitors does not decrease synaptic transmission. Alzheimers Res Ther. 2020;12(1):63. [DOI] [PMC free article] [PubMed] [Google Scholar]
- 24. Marquez F, Yassa MA. Neuroimaging Biomarkers for Alzheimer's Disease. Mol Neurodegener. 2019;14(1):21. [DOI] [PMC free article] [PubMed] [Google Scholar]
- 25. Veitch DP, Weiner MW, Aisen PS, et al. Understanding disease progression and improving Alzheimer's disease clinical trials: recent s from the Alzheimer's disease neuroimaging initiative. Alzheimers Dement. 2019;15(1):106‐152. [DOI] [PubMed] [Google Scholar]
- 26. Pontecorvo MJ, Devous MD, Kennedy I, et al. A multicentre longitudinal study of flortaucipir (18F) in normal ageing, mild cognitive impairment and Alzheimer's disease dementia. Brain. 2019;142(6):1723‐1735. [DOI] [PMC free article] [PubMed] [Google Scholar]
Associated Data
This section collects any data citations, data availability statements, or supplementary materials included in this article.
Supplementary Materials
Supplementary Table S1a: Demographics and baseline characteristics of patients with data included in analysis of annualized LS mean change from baseline in florbetapir SUVr from AMARANTH and DAYBREAK‐ALZ studies.
Supplementary Table S1b. Demographics and baseline characteristics of patients with data included in analysis of change from baseline in florbetapir PET scan in study completers from AMARANTH and DAYBREAK‐ALZ studies.
Supplementary Table S1c. Demographics and baseline characteristics of patients with data included in annualized LS mean change from baseline in flortaucipir SUVr from AMARANTH and DAYBREAK‐ALZ‐studies.
Supplementary Table S1d. Demographics and baseline characteristics of patients with data included in annualized in LS mean change from baseline in FDG PET SUVr from AMARANTH and DAYBREAK‐ALZ studies.
Supplementary Table S1e. Demographics and baseline characteristics of patients with data included in annualized LS mean change from baseline in florbetapir perfusion SUVr from DAYBREAK‐ALZ study.
Supplementary Table S1f. Demographics and baseline characteristics of patients with data included in annualized LS mean change from baseline of whole brain volume, hippocampal volume, and ventricular volumes as measured by volumetric MRI from AMARANTH and DAYBREAK‐ALZ studies.
Supplementary Table S2. vMRI results from AMARANTH and DAYBREAK‐ALZ – Annualized LS mean change.
Supplementary Table S3: vMRI results from AMARANTH and DAYBREAK‐ALZ – Annualized LS mean percent change.
Supplementary Table S4. Correlation analysis between baseline imaging measures versus baseline efficacy measures.
Supplementary Figure S1. Correlation analysis between baseline imaging measures versus baseline efficacy measures.
Supplementary Table S5. Correlation analysis between baseline imaging measures versus change in efficacy measures. Post‐baseline efficacy measures are Weeks 97‐104 for AMARANTH and Weeks 45‐52 for DAYBREAK‐ALZ.
Supplementary Figure S2. Correlation analysis between baseline imaging measures versus change in efficacy measures.
Supplementary Table S6. Correlation analysis between change in imaging measures versus change in efficacy measures. Post‐baseline measures are Weeks 97‐104.
Supplementary Figure S3. Correlation analysis between change in imaging measures versus change in efficacy measures.