

Abstract
Objectives
In late July, Cyprus experienced the second epidemic wave of COVID‐19. We present the steps taken by the government and evaluate their effect on epidemic trends.
Materials
Cyprus Press and Information Office data were analysed. Using an R‐based forecasting program, two models were created to predict cases up to 01/09/2020: Model 1, which utilised data up to 09/06/2020, when airports reopened to foreign travelers with COVID‐19 screening; and Model 2, which utilised data until 24/06/2020, when screening for passengers from low‐transmission countries was discontinued.
Results
PIO data revealed no significant policy changes between 24/06/2020 and 31/07/2020. Prediction models were robust and accurate (Model 1, R 2 = 0.999, P < .001; Model 2, R 2 = 0.998, P < .001). By August 30th, recorded cases exceeded those predicted by Model 1 by 24.47% and by Model 2 by 20.95%, with P values <.001 for both cases.
Conclusions
The significant difference between recorded cases and those projected by Models 1 and 2 suggests that changes in epidemic trends may have been associated with policy changes after their respective dates. Discontinuation of major restrictions such as airport reopening, can destabilise the control of the epidemic, and may concomitantly necessitate a reevaluation of the current epidemic status. In the face of an evolving situation such as the COVID‐19 pandemic, states are forced to balance the imposing of restrictions against their impact on the economy.
What’s known
Despite an initial success in containing the local COVID‐19 pandemic, Cyprus has been experiencing the 2nd wave of the epidemic since late July.
A de‐escalation of measures occurred prior to the second wave.
The short time interval between changes may not have allowed for sufficient evaluation of their impact on the status of the epidemic.
What’s new
We constructed a timeline identifying dates of important policy changes, which identified that the last major policy changes occurred on June 9th (when airports reopened to foreign travelers with COVID‐19 screening) and June 24th (when screening for passengers from low‐transmission countries was discontinued).
Using an R‐based forecasting program, we have demonstrated that COVID‐19 cases in August were 20%‐24% higher than predicted by data collected before the de‐escalation of these specific measures.
1. INTRODUCTION
The response to the COVID‐19 pandemic has varied significantly among countries, especially in the early stages of the pandemic. Cyprus, an island nation in the eastern Mediterranean Sea, had an initial success in containing the epidemic by implementing strict and early travel restrictions and lockdowns. However, within a few months, cases had once again risen to levels similar or worse to those observed at the start of the pandemic. We sought to identify the reasons behind this destabilisation by examining and comparing the daily cumulative incidence and dates in which government policy changes occurred.
2. MATERIALS AND METHODS
2.1. Data acquisition
Data pertaining to the number of daily confirmed cases, number of tests, numbers of patients hospitalised in general wards and intensive care units (ICU) and government decrees were obtained from the Cyprus National Opendata Portal, 1 from the Cyprus Press and Information Office (PIO), the daily announcements of the Cyprus Ministry of Health and Cyprus Official Government Gazette. 2 A confirmed case of COVID‐19 as reported from the Cyprus Ministry of Health to the PIO is any patient with a polymerase chain reaction (PCR) test positive for SARS‐CoV‐2, regardless of whether they are symptomatic or not. 2 Using these data, daily COVID‐19 incidence, tests and hospitalisations were plotted using Microsoft Excel. Furthermore, a timeline of government policy changes was constructed.
2.2. Data availability statement
All data utilised in this study are available from the websites of the Cyprus PIO 2 (https://www.pio.gov.cy/coronavirus/) and the Cyprus National Opendata Portal 1 (https://www.data.gov.cy/node/4617?language=en).
2.3. Data analysis
Data were analysed using Prophet, an R‐based forecasting model, in order to make predictions for certain dates and evaluate whether changes in government policy impacted outbreak control. Prophet is a time series forecasting model that implements machine learning fitting and time series decomposition, returning a high accuracy time series forecast. The algorithm takes into consideration historical data and their characteristics to predict future observations. Prophet is considered a robust model to outliers, missing data and dramatic changes in time series events. 3 Prophet uses a time series forecasting algorithm, based on an additive model for future prediction, and has been utilised successfully to predict COVID‐19 epidemic trends both at a national 4 and international level. 5 In this work, Prophet was implemented in R programming language.
In order to provide results, Prophet requires an input of a time series with two features: date ds and value y. Its algorithm chooses a training model according to historical data and their characteristics to find future observation results, which are fitted in yearly, weekly and daily seasonality plus holiday effects. The prophet model has the form y(t) + s(t) +h(t) + ε(t), where g(t) is the trend function, s(t) is the periodic component, h(t) represents holidays which occur irregularly and ε(t) is the error term which is often assumed to be normally distributed. 6
Using the data and algorithms described above, Prophet can execute various functions. The two functions utilised in this study were ‘make_future_dataframe’, which creates a future date data frame up to a requested date, and ‘predict’, which makes predictions for each row in the future data frame provided by the ‘make_future_dataframe’ function, up to the date chosen. Through this function, Prophet predicts incidence in future dates based on the incidence of previous dates.
In this study, a data frame was created in R using the dates and the cumulative incidence of the COVID‐19 outbreak in Cyprus. Subsequently, the ‘make_future_dataframe’ and ‘predict’ functions were utilised respectively to create dates and predict cases up to September 1st. The effect of government policy changes was evaluated by comparing the projected cumulative incidence from the date of policy changes to the actual cumulative incidence. Utilising Prophet, graphs representing the projected cumulative incidence were plotted by entering non‐linear data of confirmed cases up to the date in question. Projective graphs were plotted for June 9th through September 1st (termed Model 1) and June 24th through September 1st (termed Model 2). These graphs were then compared with the actual cumulative incidence until September 1st.
2.4. Statistical analysis
Statistical analysis was conducted to evaluate the differences between projected cases predicted by Model 1 and Model 2 to the recorded cases up to September 1st. P values were calculated using Kruskal‐Wallis rank‐sum test. Statistical analysis was also conducted to compare the proportion of positive COVID‐19 tests in August and July, using a two‐sample test for binomial proportions and reporting a two‐sided P value. Only P values <.05 were considered significant.
3. RESULTS
3.1. Timeline of government policy changes
Data regarding daily new cases were available from March 9th through September 1st. A timeline of government policy changes is depicted in Figure 1, while daily new cases and tests, as well as numbers of patients hospitalised in general wards and ICUs, are depicted in Figure 2. These data are also presented in a combined form in Figure S1, which depicts the cumulative incidence of COVID‐19 in Cyprus, while highlighting the dates of important changes in policy.
FIGURE 1.

Timeline of Cyprus government policy changes in response to the COVID‐19 pandemic. Data taken from the Cyprus Press and Information Office (PIO) and the Cyprus Official Government Gazette 2
FIGURE 2.

Timeline of daily new COVID‐19 cases and tests, as well as numbers of patients hospitalised in general wards and intensive care units in Cyprus, from the date of the first reported cases in Cyprus (March 16th) until September 1st
The first two cases on the island were identified on 09/03/2020 in returning travelers. On 16/03/2020 (A), entrance to Cyprus was forbidden to non‐residents and required a negative COVID‐19 test. Non‐emergency hospital admissions were cancelled, schools and non‐essential businesses were closed, while on 17/03/2020, non‐essential personnel in the public sector began working from home. On 20/03/2020, incoming passenger flights were forbidden (B). As a result of rising number of cases, outside movements were limited to 3/day on 23/03/2020 (C) and restricted to 1/day on 30/03/2020 (D). Two days later, the epidemic reached its peak, 23 days since its beginning.
Cases entered a steady decline on 17/04/2020, 17 days after the curfew was imposed. On 30/04/2020 (E), following 2 weeks of steadily low cases, the public sector returned to work and outside movements were increased to 3/day. Curfew was entirely lifted on 21/05/2020 (F), 52 days after being imposed and 73 days after the first cases were reported. Concomitantly, most businesses and open‐space restaurants reopened with masked employees, while gatherings up to 10 persons were permitted. On 09/06/2020, passengers from low and average transmission countries were allowed to enter Cyprus. Passengers were either tested on arrival or provided a negative COVID‐19 test within the previous 72 hours (G). On 24/06/2020, following a streak of four consecutive days without cases, passengers from low‐transmission countries were allowed entrance without a test and gatherings exceeding 10 people were permitted (H).
On 23/07/2020, 63 days post‐end of curfew and 33 days after permitting free entrance to Cyprus, a steady increase in the number of cases was documented in Limassol. On 31/07/2020, 25 new cases were documented, a 107‐day high. The government responded by making masks mandatory in closed spaces and, imposed gathering restrictions in Limassol (I). It should be noted that this was the first significant change in government policy since June 24th. A steady increase of cases has been observed ever since. Within 30 days from July 23rd, the start of the second wave, more new cases were identified than within the previous 100 days.
3.2. Effects of de‐escalation of measures
Data up to the 9th of June and up to the 24th of June were utilised by the Prophet algorithm to develop two models to predict the cumulative incidence of the virus up to the 1st of September. Graphs depicting the projected cumulative incidence were plotted for June 9th and June 24th, termed respectively Model 1 and Model 2, as depicted in Figure 3, and compared with the actual cumulative incidence. These dates were considered significant, as each represented a major de‐escalation of government restriction measures. Both datasets produced models that could predict future incidence with high accuracy, with R 2 values of 0.999 and 0.998 for the Model 1 and Model 2 respectively. The P values for both models were <.001.
FIGURE 3.
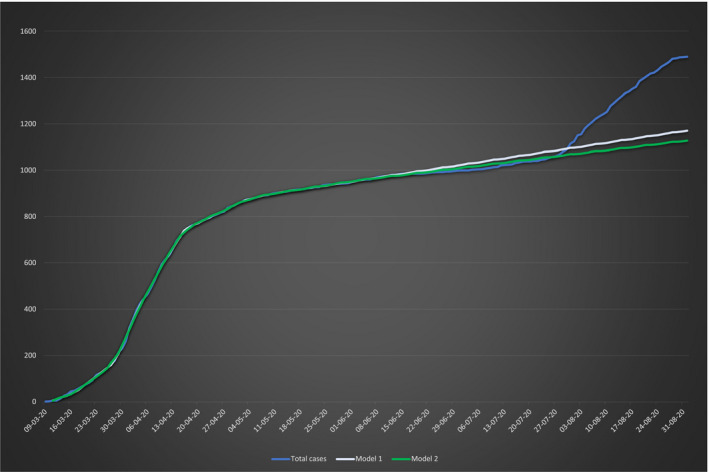
Graph depicting the recorded COVID‐19 cumulative incidence in Cyprus until September 1st, along with predictions based on data until June 9th (Model 1) and June 24th (Model 2)
As evident from the results depicted in Figure 3, there is no significant difference between the projected cumulative incidence between the two Models and the actual cumulative incidence until July 31st, when a significant deviation from predicted data is noted. By comparing the recorded cases against the projected cases from Model 2, it becomes evident that recorded cases begin exceeding projected cases on 27/07/2020. The recorded cases exceeded Model 2’s cases by 4.04% on 31/07/2020, by 13.34% on 10/08/2020, and by 20.65% on 20/08/2020. The difference peaked on 30/08/2020, with recorded cases being 24.47% higher than those predicted by Model 2. The difference between recorded cases and those projected by Model 1 were also calculated. Regarding Model 1, the recorded cases also exceeded the projected cases by 1.51% on 31/07/2020, by 10.39% on 10/08/2020, by 17.39% on 20/08/2020 and by 20.95% on 30/08/2020. Statistical analysis demonstrated that the difference in cases between Model 1, Model 2 and recorded data for August were highly significant, with P values <0.001.
3.3. Changes in testing trends
Both the case definition as well as testing guidelines utilised by Cyprus are those published by the European Centre for Disease Prevention and Control (ECDC). 7 Despite there being no changes in testing guidelines since mid‐July, 2 an increased number of COVID‐19 tests were conducted in the latter part of the pandemic especially in August, as can be observed in Figure 2. This occurred as a response from the Cyprus government to a spike in cases observed in late July. 8
As the number of COVID‐19 tests conducted during August (99102) was nearly double that of those conducted in July (46648), a potential explanation for the increased number of cases observed in August (374) compared with July (116) may have been the increase in testing. To evaluate this hypothesis, the proportions of positive tests for July (0.002487) and August (0.003774) were compared and were found to differ significantly, with a P value = .000092. Therefore, despite the increased testing, the proportion of positive tests in August was significantly higher than in July. This observation supports the position that this is compatible with the second pandemic wave in Cyprus.
4. DISCUSSION
Early and decisive enforcement of restrictions by the government of Cyprus led to successful control of the epidemic within 73 days. The geography of Cyprus likely played a significant role in the successful implementation of measures, as the import of new cases ceased with the closing of airports and ports. Cypriots returning to the island through repatriation flights followed a strict isolation protocol in government designated areas, thereby limiting the community spread of imported cases.
On June 9th, airports were re‐opened to foreign travelers, allowing passengers from low and average transmission countries to enter Cyprus, provided they had a negative COVID‐19 test within the previous 72 hours; otherwise, they were submitted to a test on arrival and remained isolated pending the results. On June 24th, only 2 weeks later, testing for passengers from low‐transmission countries was no longer necessary. These measures were discontinued in an effort to restart the tourism industry, which accounted for 21.9% of the island’s GDP in 2018. 9 Unfortunately, the percentage of imported cases in Cyprus has risen significantly, from 14.7% (139 imported cases from a total of 943 cases diagnosed in Cyprus during that time) in the early months of the pandemic (January to May), to 75.6% (59 imported cases from a total of 78 cases diagnosed in Cyprus, correspondingly) in the latter months (June to July). 10
In addition, restrictions in the number of individuals gathered were also lifted on June 24th. This likely contributed to the further transmission of the virus, as reports from the ministry of health on August 13th mention the development of transmission chains and clusters arising from three or more parties, 11 which would not have been possible had the measure restricting gatherings up to 10 people remained in place (or would at least be in violation of the decree).
Based on the results of the comparison of the projected cumulative incidence from Model 1 and Model 2 and the actual cumulative incidence, it is evident that no difference can be detected between the number of cases in these scenarios until July 27th. By July 31st, the difference is significant enough that it can be appreciated as shown in Figure 3.
We speculate that the period between the opening of the airports and the cessation of testing for passengers from low‐incidence countries did not provide adequate time for evaluation of the new status. The effects of the discontinuation of a specific measure need time before they become evident and should be studied before another measure is lifted as well.
While a combination of factors is more likely responsible for the observed spike in cases, we speculate that the combination of the entrance to Cyprus without a prior negative test and the lifting of gathering restrictions led to a spike in new cases. Therefore, while the opening of the airports may have been inevitable, in combination with the subsequent discontinuation of additional restrictions, may have possibly contributed to the development of the second wave of the pandemic in Cyprus. Specifically, the policy of not testing passengers from low‐transmission countries can have grave consequences, as the transmission rate of each country can change in a matter of days. By the time this change is evaluated and policy changes are implemented, a significant amount of time may have elapsed, and COVID‐19‐positive passengers, who might have been detected during pre‐travel or on‐arrival screening, can enter the country and ignite new transmission chains.
Until an effective vaccine against SARS‐CoV‐2 becomes available, new epidemic waves will continue to be a risk. 12 At this time, the only measure to limit the virus spread is a well‐organised and coordinated public health policy. In order to achieve a sustained containment of the pandemic, states should be wary of lifting multiple restriction measures at once. Without adequate time to evaluate the effect of the discontinuation of a specific measure on pandemic trends, lifting of multiple restrictions increases the risk of causing a surge in new cases.
Limitations of this study include a possible error in future prediction models made using the machine learning algorithm that may arise from the relatively small size of data inserted in the datasets. In addition, it is not possible to ascertain whether the calculated differences between projected and observed cases were because of the discontinuation of travel restrictions or other events, such as the reopening of businesses or for permitting large gatherings of multiple people. In general, as the sheer amount of variables that affect the spread of the pandemic is incomprehensible, it is possible that factors other than the de‐escalation of measures may have led to the second wave of the pandemic in Cyprus. Other limitations include the inability to separate the impact that tourists may have had on the transmission of the virus, as official data do not separate between returning Cypriot subjects or foreign nationals arriving to Cyprus; and the fact that our analysis is based on time periods starting at the day of implementation or discontinuation of restrictions without taking into account the incubation period of COVID‐19, thereby limiting the conclusions that can be drawn from Model 1 and Model 2. Finally, this is an observational retrospective study utilising publicised open data.
In conclusion, the lack of policy implementation stamina, while possibly unavoidable, can have significant consequences on the control of the pandemic. The lifting of restrictions, especially of major restrictions such as border, port, airport or—in the case of Cyprus—checkpoint closure, can have a major impact in states which have controlled the pandemic. The prognostic data provided in this study could not be used to make interventions at the time of writing but can be used as a reference to guide future studies and management of the pandemic in Cyprus or elsewhere. In the face of an evolving situation such as the COVID‐19 pandemic, states are forced to balance the imposing of restrictions against their impact on the economy. This equilibrium is difficult to achieve, as well as maintain for extended periods of time. Considering that a pandemic of magnitude of COVID‐19 has not occurred in decades, with states and scientists learning as they go, the intention of this work was to present the effect of the policies applied in Cyprus, to be of use by other nations or territories under similar circumstances.
DISCLOSURES
All authors declare that they have no conflict of interest.
Supporting information
Fig S1
AKNOWLEDGMENTS
Part of the data presented in this manuscript were previously presented at the European Society of Clinical Microbiology and Infectious Diseases (ESCMID) Conference on Coronavirus Disease (ECCVID).
Kakoullis L, Eliades E, Papachristodoulou E, et al. Response to COVID‐19 in Cyprus: Policy changes and epidemic trends. Int J Clin Pract.2021;75:e13944. 10.1111/ijcp.13944
REFERENCES
- 1. Cyprus National Opendata Portal . COVID‐19 Daily Statistics. https://www.data.gov.cy/node/4618?language=en#%7B%7D. Accessed August 23, 2020. [Google Scholar]
- 2. Cyprus Press and Information Office . Cyprus Press and Information Office, COVID‐19. https://www.pio.gov.cy/coronavirus/eng. Accessed October 21, 2020. [Google Scholar]
- 3. Taylor SJ, Letham B. Forecasting at scale. Am Stat. 2018;72(1):37‐45. 10.1080/00031305.2017.1380080. [DOI] [Google Scholar]
- 4. Abdulmajeed K, Adeleke M, Popoola L. Online forecasting of COVID‐19 cases in Nigeria using limited data. Data Br. 2020;30:105683. 10.1016/j.dib.2020.105683. [DOI] [PMC free article] [PubMed] [Google Scholar]
- 5. Wang P, Zheng X, Li J, Zhu B. Prediction of epidemic trends in COVID‐19 with logistic model and machine learning technics. Chaos, Solitons Fractals. 2020;139:110058. 10.1016/j.chaos.2020.110058. [DOI] [PMC free article] [PubMed] [Google Scholar]
- 6. Harvey AC, Peters S. Estimation procedures for structural time series models. J Forecast. 1990;9(2):89‐108. 10.1002/for.3980090203. [DOI] [Google Scholar]
- 7. European Centre for Disease Prevention and Control . Case Definition for Coronavirus Disease 2019 (COVID‐19), as of 29 May 2020. https://www.ecdc.europa.eu/en/covid‐19/surveillance/case‐definition. Published May 29, 2020. Accessed October 22, 2020. [Google Scholar]
- 8. Cyprus Ministry of Health . Announcement regarding the COVID‐19 pandemic, August 21st, 2020. Nicosia (Cyprus): Cyprus Ministry of Health; 2020. [Google Scholar]
- 9. KNOWEMA . The GDP contribution from tourism in Cyprus. https://knoema.com/data/services‐tourism+cyprus+contribution+gdp. Accessed December 24th 2020.
- 10. European Centre for Disease Prevention and Control . Coronavirus Disease 2019 (COVID‐19) in the EU/EEA and the UK‐Eleventh Update: Resurgence of Cases. Stockholm (Sweden): European Centre for Disease Prevention and Control; 2020. [Google Scholar]
- 11. Cyprus Ministry of Health . Information Bulletin published on August 13th, 2020. Nicosia (Cyprus): Cyprus Ministry of Health; 2020. [Google Scholar]
- 12. Papachristodoulou E, Kakoullis L, Parperis K, Panos G. Long‐term and herd immunity against SARS‐CoV‐2: implications from current and past knowledge. Pathog Dis. 2020;78(3):10‐12. 10.1093/femspd/ftaa025. [DOI] [PMC free article] [PubMed] [Google Scholar]
Associated Data
This section collects any data citations, data availability statements, or supplementary materials included in this article.
Supplementary Materials
Fig S1
Data Availability Statement
All data utilised in this study are available from the websites of the Cyprus PIO 2 (https://www.pio.gov.cy/coronavirus/) and the Cyprus National Opendata Portal 1 (https://www.data.gov.cy/node/4617?language=en).