

Abstract
Data describing outcomes of solid organ transplant (SOT) recipients with coronavirus disease 2019 (COVID‐19) are variable, and the association between SOT status and mortality remains unclear. In this study, we compare clinical outcomes of SOT recipients hospitalized with COVID‐19 between March 10, and September 1, 2020, to a matched cohort of non‐SOT recipients at a national healthcare system in the United States (US). From a population of 43 461 hospitalized COVID‐19‐positive patients, we created a coarsened exact matched cohort of 4035 patients including 128 SOT recipients and 3907 weighted matched non‐SOT controls. Multiple logistic regression was used to evaluate association between SOT status and clinical outcomes. Among the 4035 patients, median age was 60 years, 61.7% were male, 21.9% were Black/African American, and 50.8% identified as Hispanic/Latino ethnicity. Patients with a history of SOT were more likely to die within the study period when compared to matched non‐SOT recipients (21.9% and 14.9%, respectively; odds ratio [OR] 1.93; 95% confidence interval [CI]: 1.18–3.15). Moreover, SOT status was associated with increased odds of receiving invasive mechanical ventilation (OR [95% CI]: 2.34 [1.51–3.65]), developing acute kidney injury (OR [95% CI]: 2.41 [1.59–3.65]), and receiving vasopressor support during hospitalization (OR [95% CI]: 2.14 [1.31–3.48]).
Keywords: COVID‐19, outcomes, solid organ transplant
1. INTRODUCTION
With more than 36 million confirmed cases and 1 069 080 deaths as of October 10, 2020, coronavirus disease 2019 (COVID‐19) caused by severe acute respiratory coronavirus 2 (SARS‐CoV‐2) has caused unprecedented global health and societal impact. 1 Risk factors for adverse outcomes from COVID‐19 have been identified, including older age, obesity, and coexisting conditions such as cancer, chronic kidney disease (CKD), chronic obstructive pulmonary disease, serious heart conditions, immunocompromised state from solid organ transplant (SOT), sickle cell disease, smoking, and type 2 diabetes mellitus. 2 However, data describing characteristics and outcomes among hospitalized patients in this cohort have varied throughout the course of the pandemic, and the effect prior SOT has on mortality and other clinical outcomes remains unclear.
Single‐center studies from New York and Houston reflecting the initial surge of the pandemic in the United States (US) report mortality rates of 24%–36% and 7%, respectively, among prior SOT recipients hospitalized with COVID‐19. 3 , 4 , 5 , 6 , 7 Pooled mortality rates derived from these studies and other small‐sized series 8 , 9 , 10 , 11 , 12 , 13 , 14 , 15 , 16 , 17 are shown to be similar to the observed mortality rate in a large multicenter cohort study from the University of Washington including 482 SOT recipients, which was 20.5%. 18 A more recent observational study on a nationwide SOT registry from France (n = 279) shows a 30‐day mortality rate of 22.8% among hospitalized kidney transplant recipients with COVID‐19, which is a comparable finding to the US‐based large cohort study. 19
Few studies have compared clinical characteristics and outcomes among SOT recipients and matched non‐SOT control groups, which is critical to appropriately ascertain risk of mortality in this population. 20 , 21 , 22 , 23 , 24 Results from these studies have been conflicting or non‐significant regarding association between SOT status and mortality, with three reports concluding risk of mortality is similar in both transplant and non‐transplant patients with COVID‐19. 20 , 21 , 23 It is important to note that the source populations and endpoints differ across these studies, which poses a challenge to generalizability of results. However, results from these studies suggest that a large source population from which to sample the matched non‐SOT cohort is required to make firm conclusions.
In this study, we aim to better characterize the relationship between SOT status and mortality by comparing outcomes from this population to a large matched non‐SOT control group across a multistate community‐based healthcare system. This experience is unique given the geographical diversity and scale of this non‐tertiary medical system.
2. MATERIALS AND METHODS
2.1. Study oversight
This study was supported by HCA Healthcare and institutional review board exempt. The design, analysis, and data interpretations were conducted independently by the investigators. All authors testify to the accuracy and completeness of the data.
2.2. Study setting and patient population
The HCA Healthcare system consists of 184 affiliated acute care facilities and over 2000 sites of care in 21 US states. 25 We included consecutive patients with laboratory‐confirmed COVID‐19 that were hospitalized at an affiliated facility between March 10, and September 1, 2020. Patients were followed until the first of hospital discharge, death, or September 1, 2020—the date on which the data were queried for analysis. A COVID‐19‐confirmed case was defined as a positive SARS‐CoV‐2 result on high‐throughput sequencing, real‐time reverse transcriptase polymerase chain reaction (RT‐PCR), or rapid antigen testing of nasopharyngeal swab and other clinical specimens.
2.3. Data collection
Data were collected from the enterprise electronic health record (EHR; Cerner, EPIC, and Meditech) reporting database and compiled in an enterprise data warehouse. We collected detailed data including demographics, coexisting conditions, home medications (including immunosuppressive medications), longitudinal data on vitals and laboratory values, and inpatient medications. Longitudinal data on respiratory support requirements beginning at date of presentation were also collected; patients were categorized based on a modified 5‐point clinical scale, adapted from the World Health Organization (WHO) R&D Blueprint group and others to assess clinical improvement. 26 , 27 , 28 Patients were assigned a score at presentation and subsequently evaluated each day following admission, such that patients received a daily score reflecting level of respiratory support received throughout hospitalization. The modified 5‐point scale, hereby referred to as “WHO Index,” is as follows: 1, no supplemental oxygen; 2, received low‐flow supplemental oxygen; 3, received non‐invasive or high‐flow oxygen devices including continuous positive airway pressure (CPAP) and bilevel positive airway pressure (BIPAP); 4, received invasive mechanical ventilation; and 5, received extracorporeal membrane oxygenation (ECMO). Definitions of baseline characteristics, coexisting conditions, at home medications, and levels of respiratory support following the 5‐point scale are shown in Table S1.
2.4. Exposure variable
The primary exposure was SOT at baseline.
2.5. Clinical outcome measurements
The primary outcome was death within the study period. Key secondary outcomes included intensive care unit (ICU) status, defined as receiving intensive care at any point during hospitalization; receipt of invasive mechanical ventilation, defined as WHO Index 4 during hospitalization; receipt of ECMO, defined as WHO Index 5 during hospitalization; receipt of vasopressor during hospitalization; acute kidney injury (AKI), defined as a ≥0.3 mg/dl increase in serum creatinine from baseline; and acute respiratory distress syndrome (ARDS), defined as PaO2/FiO2 ratio ≤300 mmHg and a score of 3 or higher on the modified 5‐point scale. We also collected data on complications including pneumonia, sepsis, and bacteremia based on ICD‐10 codes. Additional clinical outcome measures included length of stay, defined as the time between admission until death or discharge from hospital; ICU length of stay, defined as the time between ICU admission until death or discharge from the ICU; length of time from infection to outcome, defined as the time between sample collection for COVID‐19 testing to discharge or death; level of respiratory support at most severe, defined as the highest daily score reached in the modified 5‐point scale during hospitalization. Cause of death was ascertained by manual chart review for SOT recipients only.
2.6. Statistical analysis
Patients were assigned to the SOT and non‐SOT groups using coarsened exact matching (CEM) on the basis of covariates for age, sex, race, ethnicity, body mass index (BMI), hypertension, diabetes mellitus, congestive heart failure, and obesity (defined as BMI ≥30 kg/m2). We utilized the R implementation of the CEM algorithm in the package “MatchIt” 29 to construct the study population. Baseline patient characteristics were summarized according to SOT status as counts and percentages for categorical variables and median and interquartile range (IQR) for continuous variables. Differences between variables across both groups were assessed by weighted t test for continuous variables and weighted chi‐square test for categorical variables.
We used multiple logistic regression to evaluate the association between prior SOT status and death and each of the key secondary outcomes with reporting of coefficients as conditional odds ratios (OR). In addition to the covariates used in the exact matching, values at presentation for absolute neutrophil count, absolute lymphocyte count, D‐dimer, and SPO2, as well as level of respiratory support received at presentation (WHO Index 2, 3, and 4) were included in the model. Missing data for baseline characteristics in the multiple logistic regression were imputed with Multivariate Imputation By Chained Equations, using the R package “Mice.” 30 Odds ratios, p‐values, and 95% confidence intervals were reported for all covariates used in the multiple logistic regression model.
3. RESULTS
3.1. Study population
Between March 10, and September 1, 2020, a total of 95 908 patients had a confirmed positive COVID‐19 test result within the health system. Of these patients, 45.3% (n = 43 461) were hospitalized, 40.6% (n = 38 944) were emergency department (ED) encounters, 13.2% (12 649) were managed as outpatients, and < 1% (n = 854) of cases were scheduled/same‐day surgeries. Only those patients requiring hospitalization were included in our source population (n = 43 461), of which 136 were confirmed SOT recipients. Table S2 includes baseline characteristics, laboratory values and vitals at presentation, and comorbidities for the source population before CEM. Median age was similar between SOT and non‐SOT patients in the source population, 60 years vs. 62 years, respectively (p = .33). SOT recipients were more likely to be male, Hispanic/Latino ethnicity and have comorbid conditions including diabetes, hypertension, and CKD (Table S2).
Coarsened exact matching matching yielded a cohort of 4035 patients, subsequently the “study population,” including 128 patients in the SOT group and a weighted matched non‐SOT comparison group of 3907 patients. A flow chart describing the study cohort is shown in Figure 1. The distribution of the 128 SOT patients included 106 kidney, 9 liver, 6 heart, 4 combined kidney/pancreas, and 3 combined kidney/liver transplant recipients. The median time since transplant among the patients in the SOT group was 6 years (IQR, 3–11; range, 0–27 years); year of transplant was missing for 7.8% (n = 10) of patients.
FIGURE 1.
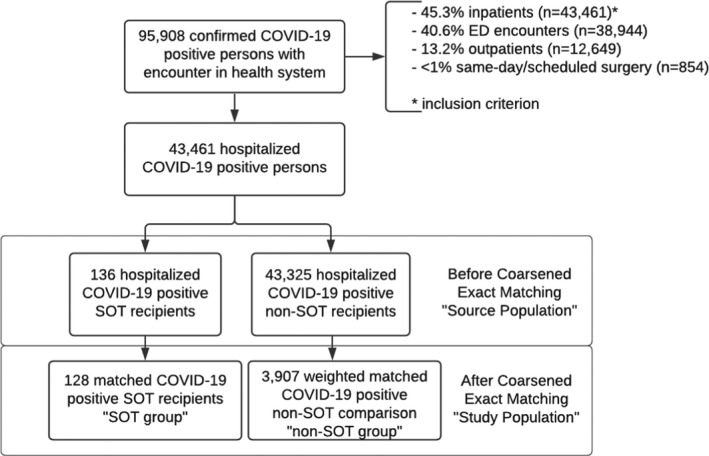
Flow chart of patient selection for study population. COVID‐19, coronavirus disease 2019; SOT, solid organ transplant; ED, emergency department
3.2. Baseline characteristics
Clinical characteristics in the SOT and non‐SOT groups were the same across covariates used in the exact matching (Table 1). The median age in both groups was 60 years (IQR, SOT: 50–68; non‐SOT: 51–69), 61.7% of patients were male, 21.9% were of Black/African American race, and 50.8% identified as Hispanic/Latino ethnicity. Further, per study design, prevalence of diabetes mellitus (56.2%), hypertension (59.4%), congestive heart failure (3.1%), and obesity (8.6%) were the same. Median BMI at presentation was also similar across groups (SOT: 26.89, IQR [24.24–29.88] vs. non‐SOT: 28.93, IQR [25.8–32.14]; p = .06). Other variables that were not used in the exact matching yet were similar across groups include incidence of comorbidities such as cirrhosis, coronary artery disease, cancer, and chronic obstructive pulmonary disease, fever upon admission, as well as initial vitals and laboratory findings as portrayed by their p‐values (Table 1). Level of respiratory support received at presentation was also similar across groups, with 22.3% of patients among the study population receiving low‐flow supplemental oxygen at presentation (SOT: 21.9% vs. non‐SOT: 22.4%; p = .98).
TABLE 1.
Comparison of baseline characteristics, vitals and laboratory values at presentation, and at home medications in solid organ transplant patients and non‐transplant controls in the coarsened exact matched cohort
| Characteristics b | SOT group (n = 128) | Non‐SOT group (n = 3907) | p‐value |
|---|---|---|---|
| Demographics | |||
| Median age (IQR)—yr a | 60 [50, 68] | 60 [51, 69] | .90 |
| Male sex a | 79 (61.7%) | 2411.35 (61.7%) | 1.00 |
| Race a | |||
| Asian/Asian American/Asian Indian | 2 (1.6%) | 61.05 (1.6%) | 1.00 |
| Black/African American | 28 (21.9%) | 854.66 (21.9%) | 1.00 |
| White/Caucasian | 74 (57.8%) | 2258.73 (57.8%) | 1.00 |
| Other/multiracial/multiethnic | 23 (18%) | 702.04 (18%) | 1.00 |
| Unknown | 1 (0.8%) | 30.52 (0.8%) | 1.00 |
| Ethnicity a | |||
| Hispanic/Latino | 65 (50.8%) | 1984.02 (50.8%) | 1.00 |
| Non‐Hispanic/Non‐Latino | 60 (46.9%) | 1786.14 (45.7%) | .87 |
| Decline to specify | 0 (0%) | 2.26 (0.1%) | 1.00 |
| Unknown | 2 (1.6%) | 101.33 (2.6%) | .66 |
| Missing | 1 (0.8%) | 33.24 (0.9%) | 1.00 |
| Median BMI (IQR)—kg/m2 a | 26.89 [24.24, 29.88] | 28.93 [25.8, 32.14] | .06 |
| Coexisting conditions | |||
| Diabetes mellitus a | 72 (56.2%) | 2197.69 (56.2%) | 1.00 |
| Hypertension a | 76 (59.4%) | 2319.78 (59.4%) | 1.00 |
| Congestive heart failure a | 4 (3.1%) | 122.09 (3.1%) | 1.00 |
| Obesity (≥30 kg/m2) a | 11 (8.6%) | 335.76 (8.6%) | 1.00 |
| Coronary artery disease | 3 (2.3%) | 80.13 (2.1%) | 1.00 |
| Chronic kidney disease | 74 (57.8%) | 295.49 (7.6%) | <.01 |
| Chronic obstructive pulmonary disease | 3 (2.3%) | 159.81 (4.1%) | .45 |
| Cirrhosis | 2 (1.6%) | 21.57 (0.6%) | .38 |
| Cancer | 0 (0%) | 32.87 (0.8%) | .59 |
| Smoking status | |||
| Current smoker | 0 (0%) | 224.9 (5.8%) | .01 |
| Former smoker | 17 (13.3%) | 543.26 (13.9%) | .94 |
| Never smoker | 91 (71.1%) | 2479.42 (63.5%) | .09 |
| Unknown | 20 (15.6%) | 659.41 (16.9%) | .80 |
| Laboratory values and vitals at presentation c | |||
| Temperature ≥ 38°C – no. (%) | 11 (8.6%) | 366.54 (9.4%) | .88 |
| Median SpO2 at nadir (IQR) ‐ % | 90 [82, 93] | 89 [82, 92] | .29 |
| White blood cell count—×103/ul | 5.4 [4.18, 7.45] | 7.1 [5.3, 9.75] | <.01 |
| Absolute lymphocyte count—×103/ul | 0.7 [0.5, 0.93] | 1 [0.7, 1.4] | <.01 |
| Serum creatinine—mg/dl | 1.8 [1.3, 2.69] | 1 [0.8, 1.4] | <.01 |
| D‐dimer—ng/ml DDU | 547.25 [300, 799.88] | 449.62 [280, 769.39] | .67 |
| Ferritin—ng/ml | 890.9 [386.2, 1660] | 452 [228, 952.98] | <.01 |
| Lactate dehydrogenase—units/L | 289 [219, 374] | 333 [235, 436] | .24 |
| C‐reactive protein—mg/dl | 8 [3.51, 11.95] | 8.9 [4.5, 15.9] | .15 |
| Immunosuppression at home | |||
| Tacrolimus | 95 (74.2%) | 10.41 (0.3%) | <.01 |
| Cyclosporine | 5 (3.9%) | 4.84 (0.1%) | <.01 |
| Mycophenolate mofetil | 58 (45.3%) | 16.12 (0.4%) | <.01 |
| Sirolimus | 6 (4.7%) | 0.16 (0%) | <.01 |
| Prednisone | 62 (48.4%) | 158.11 (4%) | <.01 |
| Level of respiratory support at presentation | |||
| No supplemental oxygen | 24 (18.8%) | 725.5 (18.6%) | 1.00 |
| Received low‐flow supplemental oxygen | 28 (21.9%) | 873.29 (22.4%) | .98 |
| Received non‐invasive ventilation or high‐flow oxygen devices | 6 (4.7%) | 349.7 (9%) | .13 |
| Received invasive mechanical ventilation | 3 (2.3%) | 110.66 (2.8%) | .95 |
| No evidence of respiratory support | 67 (52.3%) | 1847.84 (47.3%) | .30 |
Abbreviations: BMI, body mass index; ECMO, extracorporeal membrane oxygenation; IQR, interquartile range; SOT, solid organ transplant.
Characteristic used in coarsened exact matching.
Data are presented as counts and percentages.
Laboratory values and vitals at presentation are presented as median (IQR), unless otherwise noted.
We observed some differences across baseline characteristics in both groups. Patients in the SOT group were less likely to be current everyday smokers (SOT: 0% vs. non‐SOT 5.8%; p = .01) and more likely to have chronic kidney disease (SOT: 57.8% vs. non‐SOT: 7.6%; p < .01). Median values for absolute white blood cell count, absolute neutrophil count, and absolute lymphocyte count were lower in the SOT group. While median values for lactate dehydrogenase, D‐dimer, ferritin, and C‐reactive protein were above the standard institutional reference ranges across both groups, ferritin at presentation was notably higher in the SOT group compared to the non‐SOT group (SOT: 890.9 ng/ml vs. non‐SOT: 452 ng/ml; p < .01). Patients in the SOT group also had higher median serum creatinine values at presentation (SOT: 1.8 mg/dl vs. non‐SOT: 1 mg/dl; p < .01). Immunosuppressive medications were present almost exclusively in SOT patients prior to admission. At home, medication data were incomplete for 13.2% (18/136) patients in the SOT study population as shown in supplemental Table S3.
3.3. Inpatient management
Table 2 includes data on treatments used during hospitalization in both the SOT and non‐SOT groups. A higher proportion of patients in the non‐SOT group compared to the SOT group received remdesivir, 24.7% and 16.4%, respectively (p = .04). Among corticosteroids, patients in the SOT group were more likely to receive prednisone (60.2% vs. non‐SOT: 19.8%; p < .01), whereas non‐SOT patients were more commonly treated with dexamethasone (44.5% vs. SOT: 28.1%; p < .01). Other treatments such as convalescent plasma and tocilizumab were similar between groups.
TABLE 2.
Comparison of inpatient management in solid organ transplant patients and non‐transplant controls in the coarsened exact matched cohort
| Treatments a | SOT group (n = 128) | Non‐SOT group (n = 3907) | p‐value |
|---|---|---|---|
| Remdesivir | 21 (16.4%) | 964.81 (24.7%) | .04 |
| Prednisone | 77 (60.2%) | 774.12 (19.8%) | <.01 |
| Dexamethasone | 36 (28.1%) | 1737.17 (44.5%) | <.01 |
| Methylprednisolone | 13 (10.2%) | 608.03 (15.6%) | .12 |
| Tocilizumab | 8 (6.2%) | 275.14 (7%) | .87 |
| Convalescent plasma | 15 (11.7%) | 631.24 (16.2%) | .22 |
Abbreviations: SOT, solid organ transplant.
Data are presented as counts and percentages.
3.4. Primary and secondary clinical outcomes
In Table 3, we summarize clinical outcomes across the study population, and Table 4 includes odds ratios from multiple logistic regression to measure the impact of prior SOT on death and each of the key secondary outcomes. Mortality was higher in the SOT group compared to the non‐SOT group (21.9% and 14.9%, respectively; odds ratio [OR] 1.93, 95% confidence interval [CI], 1.18–3.15). Of the 28 SOT patients that died, 82.1% (n = 23) received a kidney transplant, 7.1% (n = 2) received a combined kidney‐liver transplant, 7.1% (n = 2) received a liver transplant, and 1 patient received a heart transplant.
TABLE 3.
Comparison of primary and secondary clinical outcomes in solid organ transplant and non‐transplant controls in the coarsened exact matched cohort
| Clinical outcomes a | SOT group (n = 128) | Non‐SOT group (n = 3907) | p‐value |
|---|---|---|---|
| Primary outcome | |||
| Death | 28 (21.9%) | 580.92 (14.9%) | .04 |
| Kidney | 23/28 (82.1%) | NA | NA |
| Kidney‐liver | 2/28 (7.1%) | NA | NA |
| Liver | 2/28 (7.1%) | NA | NA |
| Heart | 1/28 (3.6%) | NA | NA |
| Key secondary outcomes | |||
| AKI | 43 (33.6%) | 789.3 (20.2%) | <.01 |
| ARDS | 34 (26.6%) | 938.26 (24%) | .58 |
| Required vasopressor | 30 (23.4%) | 630.72 (16.1%) | .04 |
| Received ICU care | 50 (39.1%) | 1318.25 (33.7%) | .25 |
| Median length of stay (IQR) – d | |||
| Discharged | 4 [2, 10] | 5 [2, 10] | .67 |
| Expired | 9 [4, 27] | 13 [6, 20] | .75 |
| Median time from infection to outcome (IQR)—d | 7 [3, 13] | 7 [3, 14] | .77 |
| Level of respiratory support at most severe | |||
| No supplemental oxygen | 26 (20.3%) | 613.79 (15.7%) | .20 |
| Received low‐flow supplemental oxygen | 44 (34.4%) | 1544.5 (39.5%) | .28 |
| Received non‐invasive ventilation or high‐flow oxygen devices | 16 (12.5%) | 830.66 (21.3%) | .02 |
| Received invasive mechanical ventilation | 38 (29.7%) | 792.57 (20.3%) | .01 |
| Received ECMO | 0 (0%) | 10.1 (0.3%) | 1.00 |
| No evidence of respiratory support | 0 (0%) | 10.1 (0.3%) | 1.00 |
Intensive care and vasopressors are considered received if the patient received intensive care or vasopressor support, respectively, at any point in the hospital stay. Level of respiratory support at most severe is defined as the highest daily level reached during hospitalization on the modified 5‐point scale.
Abbreviations: AKI, acute kidney injury; ARDS, acute respiratory distress syndrome; ECMO, extracorporeal membrane oxygenation; ICU, intensive care unit.
Data are presented as counts and percentages unless otherwise noted.
TABLE 4.
Odds ratios of primary and secondary outcomes in solid organ transplant and non‐transplant patients in the coarsened exact matched cohort using multiple logistic regression
| Primary and secondary outcomes | Odds ratio | 95% confidence interval | p‐value |
|---|---|---|---|
| Death | 1.93 | 1.18–3.15 | <.01 |
| AKI | 2.41 | 1.59–3.65 | <.01 |
| ARDS | 1.49 | 0.93–2.36 | .10 |
| Received ICU care | 1.46 | 0.99–2.16 | .06 |
| Received invasive mechanical ventilation | 2.34 | 1.51–3.65 | <.01 |
| Required vasopressor support | 2.14 | 1.31–3.48 | <.01 |
Abbreviations: AKI, acute kidney injury; ARDS, acute respiratory distress syndrome; ECMO, extracorporeal membrane oxygenation; ICU, intensive care unit.
Among key secondary outcomes, patients with prior SOT had increased odds of receiving invasive mechanical ventilation compared to patients without prior SOT (29.7% vs. 20.3%; OR [95% CI]: 2.34 [1.51–3.65]) (Table 4). Moreover, prior SOT was significantly associated with increased odds of developing acute kidney injury (SOT: 33.6% vs. non‐SOT: 20.2%; OR [95% CI]: 2.41 [1.59–3.65]) and requiring vasopressor support (SOT: 23.4% vs. non‐SOT: 16.1%; OR [95% CI]: 2.14 [1.31–3.48]) during hospitalization. There was a trend toward increased odds of receiving ICU care among patients with prior SOT (SOT: 39.1% vs. non‐SOT: 33.7%; OR [95% CI]:1.46 [0.99–2.16]). Development of acute respiratory distress syndrome was similar between groups with no increased risk observed in patients with prior SOT. Receipt of ECMO was not included as a key secondary outcome in the multiple logistic regression given small numbers of patients receiving ECMO among the study population (SOT: 0% vs. non‐SOT: 0.3%).
In addition to prior SOT, other significant predictors of mortality in the multiple logistic regression model include male sex, age, diabetes mellitus, and values at presentation for absolute neutrophil count and D‐dimer (Figure 2, Table S4). Level of respiratory support received at presentation—namely WHO Index 3 and 4—was also significant predictors of mortality when conditional on other covariates in the model. Similar predictors were observed across multiple logistic regression models for each of the key secondary outcomes. These results are available in the supplement (Tables S5–S9, Figures S1–S5).
FIGURE 2.

Odds ratios from multiple logistic regression for mortality. WHO Indices 2–4 are defined as follows: WHO Index 2, receiving low‐flow supplemental oxygen; WHO Index 3, receiving non‐invasive or high‐flow oxygen devices including CPAP/BIPAP; WHO Index 4, receiving invasive mechanical ventilation or extracorporeal membrane oxygenation (ECMO). Heart failure and diabetes refer to congestive heart failure and diabetes mellitus, respectively. SOT, solid organ transplant; BMI, body mass index
3.5. Characteristics of SOT survivors and non‐survivors in the source population
Table 5 shows baseline characteristics, coexisting conditions, and key secondary outcomes among all hospitalized SOT recipients (n = 136) before coarsened exact matching by survivors (n = 107) and non‐survivors (n = 29). Non‐survivors were older (68 vs. 58; p < .01), more likely to have diabetes (82.8% vs. 49.5%; p < .01), and had a longer median duration between COVID‐19 infection and outcome (11 vs. 6 days; p = .01). Further, 65.5% (n = 19) of SOT recipients were male, 65.5% (n = 19) were White/Caucasian, and 69.0% (n = 20) were of Hispanic/Latino ethnicity. The median time since transplant was 6 years (IQR, 5–10) among expired SOT patients and 5 years (IQR, 3–11) for survivors.
TABLE 5.
Baseline characteristics and key secondary outcomes among solid organ transplant recipients hospitalized with COVID‐19 before coarsened exact matching by survivors and non‐survivors
| Characteristics a | Survivors (n = 107) | Non‐survivors (n = 29) | p‐value |
|---|---|---|---|
| Demographics | |||
| Median age (IQR)—yr | 58 [48, 66] | 68 [62.3, 70] | <.01 |
| Male sex | 63 (58.9%) | 19 (65.5%) | .66 |
| Race | |||
| Asian/Asian American/Asian Indian | 2 (1.9%) | 0 (0%) | 1 |
| Black/African American | 26 (24.3%) | 4 (13.8%) | .34 |
| White/Caucasian | 60 (56.1%) | 19 (65.5%) | .48 |
| Other/multiracial/multiethnic | 18 (16.8%) | 6 (20.7%) | .83 |
| Unknown | 1 (0.9%) | 0 (0%) | 1 |
| Ethnicity | |||
| Hispanic/Latino | 50 (46.7%) | 20 (69%) | .06 |
| Non‐Hispanic/Non‐Latino | 54 (50.5%) | 9 (31%) | .10 |
| Unknown | 2 (1.9%) | 0 (0%) | 1 |
| Missing | 1 (0.9%) | 0 (0%) | 1 |
| Median BMI (IQR)—kg/m2 | 27.33 [24, 31.16] | 27.38 [24.9, 31.32] | .82 |
| Type of transplant | |||
| Kidney | 86 (80.4) | 24 (82.8) | NA |
| Liver | 8 (7.5) | 2 (6.9) | NA |
| Heart | 8 (7.5) | 1 (3.4) | NA |
| Kidney‐liver | 1 (<1) | 2 (6.9) | NA |
| Kidney‐pancreas | 4 (3.7) | 0 (0) | NA |
| Median time since transplant (IQR) ‐ y | 5 (3–11) | 6 (5–10) | |
| Median time from infection to outcome (IQR)—d a | 6 [3, 13] | 11 [6, 21] | .01 |
| Coexisting conditions | |||
| Diabetes mellitus | 53 (49.5%) | 24 (82.8%) | <.01 |
| Hypertension | 62 (57.9%) | 20 (69%) | .39 |
| Congestive heart failure | 7 (6.5%) | 2 (6.9%) | 1 |
| Obesity (≥30 kg/m2) | 10 (9.3%) | 5 (17.2%) | .38 |
| Coronary artery disease | 3 (2.8%) | 0 (0%) | .84 |
| Chronic kidney disease | 64 (59.8%) | 16 (55.2%) | .81 |
| Chronic obstructive pulmonary disease | 1 (0.9%) | 2 (6.9%) | .22 |
| Cirrhosis | 1 (0.9%) | 1 (3.4%) | .90 |
| Smoking status | |||
| Current smoker | 0 (0%) | 0 (0%) | NA |
| Former smoker | 11 (10.3%) | 7 (24.1%) | .10 |
| Never smoker | 81 (75.7%) | 15 (51.7%) | .02 |
| Unknown | 11 (10.3%) | 7 (24.1%) | .30 |
| Level of respiratory support at presentation | |||
| No supplemental oxygen | 19 (17.8%) | 5 (17.2%) | 1 |
| Received low‐flow supplemental oxygen | 24 (22.4%) | 6 (20.7%) | 1 |
| Received non‐invasive ventilation or high‐flow oxygen devices | 3 (2.8%) | 4 (13.8%) | .06 |
| Received invasive mechanical ventilation | 2 (1.9%) | 2 (6.9%) | .42 |
| No evidence of respiratory support | 59 (55.1%) | 12 (41.4%) | .27 |
| Key secondary outcomes | |||
| AKI | 24 (22.4%) | 24 (82.8%) | <.01 |
| ARDS | 11 (10.3%) | 25 (86.2%) | <.01 |
| Required vasopressor | 9 (8.4%) | 24 (82.8%) | <.01 |
| Received ICU care | 37 (34.6%) | 18 (62.1%) | .01 |
| Received invasive mechanical ventilation | 15 (14%) | 26 (89.7%) | <.01 |
| Complications during hospitalization | |||
| Secondary bacterial pneumonia | 1 (0.9%) | 5 (17.2%) | <.01 |
| Sepsis | 28 (26.2%) | 7 (24.1%) | 1 |
| Severe sepsis | 7 (6.5%) | 12 (41.4%) | <.01 |
| Cause of death | |||
| Respiratory failure | NA | 25 (86.2%) | NA |
| Myocardial infarction | NA | 2 (6.9%) | NA |
| Bacterial sepsis | NA | 2 (6.9%) | NA |
Abbreviations: AKI, acute kidney injury; ARDS, acute respiratory distress syndrome; BMI, body mass index; COVID‐19, coronavirus disease 2019; ECMO, extracorporeal membrane oxygenation; ICU, intensive care unit; IQR, interquartile range.
Data are presented as counts and percentages unless otherwise noted.
There were no significant differences in level of respiratory support received at presentation between survivors and non‐survivors. More than 80% of non‐survivors developed AKI and ARDS during hospitalization, and 26 (89.7%) expired patients received invasive mechanical ventilation. Secondary bacterial pneumonia was diagnosed more frequently in non‐survivors (17.2% vs. 0.9%; p < .01). Respiratory failure was documented as the cause of death for 25 (86.2%) SOT recipients; myocardial infarction and bacterial sepsis were indicated for 2 (6.9%) patients each.
4. DISCUSSION
In this study, we report outcomes of COVID‐19 among hospitalized SOT recipients compared to non‐SOT patients using data from a large multistate, community‐based healthcare system in the United states. Four major findings are notable through this study. First, for patients hospitalized with COVID‐19, prior SOT is independently associated with 1.93 times the odds of death compared to those without prior SOT. Second, patients with prior SOT are more likely to require invasive mechanical ventilation during hospitalization. Third, development of AKI is more common in SOT recipients. Lastly, SOT recipients are more likely to require vasopressor support during hospitalization for COVID‐19. Other outcomes such as receipt of ECMO and development of acute respiratory distress syndrome are similar between groups.
We observed a mortality rate of 21.9% among a cohort of 128 SOT recipients. This result is comparable to mortality rates reported in large observational studies from SOT COVID‐19 registries in the United States and France, 20.5% and 22.8%, respectively. 18 , 19 However, our main finding of higher mortality among hospitalized SOT recipients is in contrast to results from similar publications. 20 , 21 , 22 , 23 , 24 We speculate that differences in inclusion criteria for patient enrollment across studies, such as severity of disease and type of organ transplant, as well as study limitations due to small sample size of SOT cohorts and degree of matching to a control group are contributing to variable findings in these reports.
Several studies each with <50 SOT recipients found no significant association between prior SOT and mortality, with one study detecting a trend toward higher mortality in SOT recipients. 20 , 21 , 23 These studies were largely limited by small sample sizes and underpowered statistical analyses. Two studies with larger SOT cohorts used propensity score matching to evaluate outcomes between SOT and non‐SOT patients; however, findings are limited in generalizability. 22 , 24 Molnar et al included only critically ill patients admitted to the ICU, reporting a mortality rate of 40% among SOT recipients versus 43% for non‐SOT patients. 22 We hypothesize that once patients become critically ill from COVID‐19, they will experience adverse outcomes regardless of their underlying comorbidities, a possible explanation for the lack of observed effect. A study by Mansoor et al included only liver transplant recipients and reported a mortality rate of 8% in both the SOT and non‐SOT cohorts. 24 These patients are likely on less intense maintenance immunosuppression than kidney transplant recipients in general, which may explain the lower mortality observed in this group compared to our SOT cohort.
Incidence of AKI in the SOT group in our study is significantly higher at 33.6% vs. 20.2% in the non‐SOT group. Higher incidence of AKI in SOT recipients is reported in two other case‐control studies. 20 , 22 This finding likely underlines the increased susceptibility of SOT recipients for AKI, possibly from a combination of factors including lower baseline GFR from solitary functioning kidney in kidney transplant recipients and effects of calcineurin inhibitor‐based immunosuppression. Our results also show that a significantly higher proportion of SOT patients received vasopressor support during hospitalization, 23.4% in the SOT group compared to 16.1% in the non‐SOT group. This finding is in contrast to another study finding of no difference in vasopressor requirements between SOT and non‐SOT groups admitted to ICU. 22
In our assessment of inpatient management, we found usage of remdesivir and dexamethasone to be higher among non‐transplant patients, whereas SOT recipients were more likely to receive prednisone. A manual chart review of SOT recipients showed that prednisone was continued at home dosage in a majority of patients. Few cases in later months of the pandemic show a gradual increase in dosage over the course of hospitalization. Data obtained from randomized clinical trials show that administration of systemic corticosteroids is associated with lower 28‐day all‐cause mortality in critically ill patients with COVID‐19. 31 , 32 Despite SOT recipients receiving corticosteroids in higher proportions overall, we observed higher mortality in this group compared to non‐transplant controls. Remdesivir has also been shown to provide clinical benefit in randomized clinical trials. 33 It is possible that higher usage of remdesivir contributed to lower mortality in non‐transplant patients; however, evidence has been conflicting regarding potential benefit of this drug. 34 Usage of other therapies that have showed possible clinical benefit in non‐controlled studies like convalescent plasma and tocilizumab were similar in both groups.
Our study has several strengths. First, the unique experience provided by data from a community‐based healthcare system serving a geographically diverse population of patients across 21 US states and second, our use of CEM to match the comparison group. We chose CEM over other commonly used methods due to the size of our source population, which offered a broad matching distribution of patients from which to sample the comparison group. This mitigated concerns of loss of sample size due to matching. Further, we sought to match a discrete list of static covariates available at baseline that reflect key risk factors associated with mortality in COVID‐19. CEM is expected to produce high performance relative to other matching options in this scenario. 35
This study also has its limitations. First, given this is a large cohort retrospective study, data were collected from EHR systems, which precluded the level of detail possible with a manual medical chart review. Second, we were unable to assess adjustments to immunosuppression regimens during hospitalization and how this may or may not impact mortality. Similarly, our study does not address potential associations between inpatient therapies and outcomes. Additionally, we did not study temporal trends in mortality as treatment algorithms evolved with steroids and remdesivir becoming standard of care for moderate‐to‐severe COVID‐19 during the later months of our study period. Third, we defined CKD using ICD‐10 codes rather than estimated glomerular filtration rate values due to lack of longitudinal data, however only those diagnoses codes entered after the transplant date were considered. We chose not to include CKD as a covariate in the logistic regression model given its association with transplantation, but it is possible this contributed to increased mortality among SOT recipients. We acknowledge that data on patients with AKI requiring renal replacement therapy are missing in our study. Lastly, as our healthcare system is primarily inpatient centered, we were not able to study outcomes of COVID‐19 for non‐hospitalized patients and if SOT recipients have different outcomes in the outpatient setting.
5. CONCLUSIONS
In conclusion, patients with prior SOT that are hospitalized with COVID‐19 have a higher risk of mortality compared to patients without a history of SOT, suggesting an independent relationship between SOT status and mortality. SOT patients are also more likely to develop AKI and require invasive mechanical ventilation and vasopressor support during hospitalization. More research is needed to assess the effect of adjustments in immunosuppression regimens and inpatient management on mortality and other clinical outcomes.
CONFLICTS OF INTEREST
Authors of this manuscript have no conflicts of interest relevant to this study to disclose.
AUTHORS' CONTRIBUTIONS
AMF participated in data collection, drafting of article, and revision of article. DS participated in data analysis/statistics, drafting of article, and revision of article. MM participated in concept/design, drafting, and approval of article. AD participated in drafting and approval of article. AIR participated in drafting and approval of article. MC participated in drafting and approval of article. GJF participated in drafting and approval of article. JP participated in concept/design, drafting and approval of article. AWB participated in drafting and approval of article. BS participated in drafting and approval of article. SRA participated in concept/design, data interpretation, drafting of article, and revision of article.
Supporting information
App S1
ACKNOWLEDGEMENTS
Research was supported in whole by HCA Healthcare, in part through Genospace, a wholly owned subsidiary. No external funding was obtained for this analysis. The authors wish to acknowledge Troy Gifford, Meredith Mattlin, Sarah Danglo, Shaita Picard, and Casey Martin for their contributions to this work.
Fisher AM, Schlauch D, Mulloy M, et al. Outcomes of COVID‐19 in hospitalized solid organ transplant recipients compared to a matched cohort of non‐transplant patients at a national healthcare system in the United States. Clin Transplant. 2021;35:e14216. 10.1111/ctr.14216
Fisher and Schlauch authors contributed equally to this work
DATA AVAILABILITY STATEMENT
The data that support the findings of this study are available on request from the corresponding author. The data are not publicly available due to privacy or ethical restrictions.
REFERENCES
- 1. Johns Hopkins University coronavirus resource center. URL: https://coronavirus.jhu.edu. Accessed October 10, 2020.
- 2. Centers for disease control and prevention. URL: https://www.cdc.gov/coronavirus/2019‐ncov/need‐extra‐precautions/index.html. Accessed October 10, 2020.
- 3. Pereira MR, Mohan S, Cohen DJ, et al. COVID‐19 in solid organ transplant recipients: initial report from the US epicenter. Am J Transplant. 2020;20(7):1800‐1808. 10.1111/ajt.15941 [DOI] [PMC free article] [PubMed] [Google Scholar]
- 4. Yi SG, Rogers AW, Saharia A, et al. Early experience with COVID‐19 and solid organ transplantation at a US high‐volume transplant center. Transplantation. 2020;104(11):2208‐2214. [DOI] [PMC free article] [PubMed] [Google Scholar]
- 5. Lee BT, Perumalswami PV, Im GY, et al. COVID‐19 in liver transplant recipients: an initial experience from the US epicenter. Gastroenterology. 2020;159(3):1176‐1178.e2. 10.1053/j.gastro.2020.05.050 [DOI] [PMC free article] [PubMed] [Google Scholar]
- 6. Akalin E, Azzi Y, Bartash R, et al. Covid‐19 and kidney transplantation. N Engl J Med. 2020;382(25):2475‐2477. 10.1056/nejmc2011117 [DOI] [PMC free article] [PubMed] [Google Scholar]
- 7. Nair V, Jandovitz N, Hirsch JS, et al. COVID‐19 in kidney transplant recipients. Am J Transplant. 2020;20(7):1819‐1825. 10.1111/ajt.15967 [DOI] [PMC free article] [PubMed] [Google Scholar]
- 8. Alberici F, Delbarba E, Manenti C, et al. A single center observational study of the clinical characteristics and short‐term outcome of 20 kidney transplant patients admitted for SARS‐CoV2 pneumonia. Kidney Int. 2020;97(6):1083‐1088. [DOI] [PMC free article] [PubMed] [Google Scholar]
- 9. Latif F, Farr MA, Clerkin KJ, et al. Characteristics and outcomes of recipients of heart transplant with coronavirus disease 2019. JAMA Cardiol. 2020;5(10):1165–1169. 10.1001/jamacardio.2020.2159 [DOI] [PMC free article] [PubMed] [Google Scholar]
- 10. Tschopp J, L'Huillier AG, Mombelli M, et al. First experience of SARS‐CoV‐2 infections in solid organ transplant recipients in the Swiss transplant cohort study. Am J Transplant. 2020;20(10):2876‐2882. 10.1111/ajt.16062 [DOI] [PMC free article] [PubMed] [Google Scholar]
- 11. Hoek RAS, Manintveld OC, Betjes MGH, et al. Covid‐19 in solid organ transplant recipients: a single center experience. Transpl Int. 2020;33(9):1099‐1105. 10.1111/tri.13662 [DOI] [PMC free article] [PubMed] [Google Scholar]
- 12. Fernández‐Ruiz M, Andrés A, Loinaz C, et al. COVID‐19 in solid organ transplant recipients: a single‐center case series from Spain. Am J Transplant. 2020;20(7):1849‐1858. 10.1111/ajt.15929 [DOI] [PMC free article] [PubMed] [Google Scholar]
- 13. Rodriguez‐Cubillo B, Moreno de la Higuera MA, Lucena R, et al. Should cyclosporine be useful in renal transplant recipients affected by SARS‐CoV‐2?. Am J Transplant. 2020;20(11):3173‐3181. 10.1111/ajt.16141 [DOI] [PMC free article] [PubMed] [Google Scholar]
- 14. Crespo M, José Pérez‐Sáez M, Redondo‐Pachón D, et al. COVID‐19 in elderly kidney transplant recipients. Am J Transplant. 2020;20(10):2883‐2889. 10.1111/ajt.16096 [DOI] [PMC free article] [PubMed] [Google Scholar]
- 15. Travi G, Rossotti R, Merli M, et al. Clinical outcome in solid organ transplant recipients with COVID‐19: a single‐center experience. Am J Transplant. 2020;20(9):2628‐2629. 10.1111/ajt.16069 [DOI] [PMC free article] [PubMed] [Google Scholar]
- 16. Ketcham SW, Adie SK, Malliett A, et al. Coronavirus disease‐2019 in heart transplant recipients in Southeastern Michigan: a case series. J Card Fail. 2020;S1071–9164(20):30415‐30422. 10.1016/j.cardfail.2020.05.008 [DOI] [PMC free article] [PubMed] [Google Scholar]
- 17. Zhu L, Gong N, Liu B, et al. Coronavirus disease 2019 pneumonia in immunosuppressed renal transplant recipients: a summary of 10 confirmed cases in Wuhan, China. Eur Urol. 2020;S0302–2838(20):30214‐30221. 10.1016/j.eururo.2020.03.039 [DOI] [PMC free article] [PubMed] [Google Scholar]
- 18. Kates OS, Haydel BM, Florman SS, et al. COVID‐19 in solid organ transplant: a multi‐center cohort study. Clin Infect Dis. 2020:ciaa1097. 10.1093/cid/ciaa1097 [DOI] [Google Scholar]
- 19. Caillard S, Anglicheau D, Matignon M, et al. An initial report from the French SOT COVID registry suggests high mortality due to Covid‐19 in recipients of kidney transplants. Kidney Int. 2020;98(6):1549‐1558. 10.1016/j.kint.2020.08.005 [DOI] [PMC free article] [PubMed] [Google Scholar]
- 20. Chaudhry ZS, Williams JD, Vahia A, et al. Clinical characteristics and outcomes of COVID‐19 in solid organ transplant recipients: a cohort study. Am J Transplant. 2020;20(11):3051‐3060. 10.1111/ajt.16188 [DOI] [PMC free article] [PubMed] [Google Scholar]
- 21. Rinaldi M, Bartoletti M, Bussini L, et al. COVID‐19 in solid organ transplant recipients: no difference in survival compared to general population. Transpl Infect Dis. 2020:e13421. 10.1111/tid.13421 [DOI] [PMC free article] [PubMed] [Google Scholar]
- 22. Molnar MZ, Bhalla A, Azhar A, et al. Outcomes of critically Ill solid organ transplant patients with COVID‐19 in the United States. Am J Transplant. 2020;20(11):3061‐3071. 10.1111/ajt.16280 [DOI] [PMC free article] [PubMed] [Google Scholar]
- 23. Miarons M, Larrosa‐García M, García‐García S, et al. COVID‐19 in solid organ transplantation: a matched retrospective cohort study and evaluation of immunosuppression management. Transplantation. 2021;105(1):138‐150. 10.1097/TP.0000000000003460 [DOI] [PubMed] [Google Scholar]
- 24. Mansoor E, Perez A, Abou‐Saleh M, et al. Clinical characteristics, hospitalization and mortality rates of COVID‐19 among liver transplant patients in the United States: a multi‐center research network study. Gastroenterology. 2020;S0016–5085(20):35214‐35218. 10.1053/j.gastro.2020.09.033 [DOI] [PMC free article] [PubMed] [Google Scholar]
- 25. McLaughlin C. Top US health systems by total member hospital beds, definitive healthcare. September 11, 2019. https://blog.definitivehc.com/top‐us‐health‐systems‐total‐beds. Accessed online October 7, 2020.
- 26. World Health Organization R&D Blueprint . Novel coronavirus COVID‐19 therapeutic trial synopsis. https://www.who.int/blueprint/priority‐diseases/key‐action/COVID‐19_Treatment_Trial_Design_Master_Protocol_synopsis_Final_18022020.pdf. Accessed online October 7, 2020.
- 27. Marshall JC, Murthy S, Diaz J, et al. A minimal common outcome measure set for COVID‐19 clinical research. Lancet Infect Dis. 2020;20(8):e192‐e197. 10.1016/s1473-3099(20)30483-7 [DOI] [PMC free article] [PubMed] [Google Scholar]
- 28. Salazar E, Perez KK, Ashraf M, et al. Treatment of COVID‐19 patients with convalescent plasma in Houston, Texas. 2020. 10.1101/2020.05.08.20095471 [DOI] [PMC free article] [PubMed]
- 29. Ho DE, Imai K, King G, Stuart EA. MatchIt: nonparametric preprocessing for parametric causal inference. J Stat Softw. 2011;42(8):1‐28. http://www.jstatsoft.org/v42/i08/. [Google Scholar]
- 30. Buuren S, Groothuis‐Oudshoorn K. (n.d.). Mice: multivariate imputation by Chained Equations in R. https://www.jstatsoft.org/article/view/v045i03. Accessed October 23, 2020.
- 31. Sterne JAC, Murthy S, Diaz JV, et al. Association between administration of systemic corticosteroids and mortality among critically Ill patients With COVID‐19: a meta‐analysis. JAMA. 2020;324(13):1330‐1341. 10.1001/jama.2020.17023 [DOI] [PMC free article] [PubMed] [Google Scholar]
- 32. Siemieniuk RA, Bartoszko JJ, Ge L, et al. Drug treatments for covid‐19: living systematic review and network meta‐analysis. BMJ. 2020;370:M2980. 10.1136/bmj.m2980 [DOI] [PMC free article] [PubMed] [Google Scholar]
- 33. Beigel JH, Tomashek KM, Dodd LE, et al. Remdesivir for the #reatment of Covid‐19 — final report. N Engl J Med. 2020;383(19):1813‐1826. 10.1056/nejmoa2007764 [DOI] [PMC free article] [PubMed] [Google Scholar]
- 34. Wang Y, Zhang D, Du G, et al. Remdesivir in adults with severe COVID‐19: a randomised, double‐blind, placebo‐controlled, multicentre trial [published correction appears in Lancet. 2020 May 30;395(10238):1694]. Lancet. 2020;395(10236):1569‐1578. 10.1016/S0140-6736(20)31022-9 [DOI] [PMC free article] [PubMed] [Google Scholar]
- 35. Ripollone JE, Huybrechts KF, Rothman KJ, Ferguson RE, Franklin JM. Evaluating the utility of coarsened exact matching for pharmacoepidemiology using real and simulated claims data. Am J Epidemiol. 2019;189(6):613‐622. 10.1093/aje/kwz268 [DOI] [PMC free article] [PubMed] [Google Scholar]
Associated Data
This section collects any data citations, data availability statements, or supplementary materials included in this article.
Supplementary Materials
App S1
Data Availability Statement
The data that support the findings of this study are available on request from the corresponding author. The data are not publicly available due to privacy or ethical restrictions.