

Summary
In a large‐scale study, 128176 non‐pregnant patients (228 studies) and 10000 pregnant patients (121 studies) confirmed COVID‐19 cases included in this Meta‐Analysis. The mean (confidence interval [CI]) of age and gestational age of admission (GA) in pregnant women was 33 (28–37) years old and 36 (34–37) weeks, respectively. Pregnant women show the same manifestations of COVID‐19 as non‐pregnant adult patients. Fever (pregnant: 75.5%; non‐pregnant: 74%) and cough (pregnant: 48.5%; non‐pregnant: 53.5%) are the most common symptoms in both groups followed by myalgia (26.5%) and chill (25%) in pregnant and dysgeusia (27%) and fatigue (26.5%) in non‐pregnant patients. Pregnant women are less probable to show cough (odds ratio [OR] 0.7; 95% CI 0.67–0.75), fatigue (OR: 0.58; CI: 0.54–0.61), sore throat (OR: 0.66; CI: 0.61–0.7), headache (OR: 0.55; CI: 0.55–0.58) and diarrhea (OR: 0.46; CI: 0.4–0.51) than non‐pregnant adult patients. The most common imaging found in pregnant women is ground‐glass opacity (57%) and in non‐pregnant patients is consolidation (76%). Pregnant women have higher proportion of leukocytosis (27% vs. 14%), thrombocytopenia (18% vs. 12.5%) and have lower proportion of raised C‐reactive protein (52% vs. 81%) compared with non‐pregnant patients. Leucopenia and lymphopenia are almost the same in both groups. The most common comorbidity in pregnant patients is diabetes (18%) and in non‐pregnant patients is hypertension (21%). Case fatality rate (CFR) of non‐pregnant hospitalized patients is 6.4% (4.4–8.5), and mortality due to all‐cause for pregnant patients is 11.3% (9.6–13.3). Regarding the complications of pregnancy, postpartum hemorrhage (54.5% [7–94]), caesarean delivery (48% [42–54]), preterm labor (25% [4–74]) and preterm birth (21% [12–34]) are in turn the most prevalent complications. Comparing the pregnancy outcomes show that caesarean delivery (OR: 3; CI: 2–5), low birth weight (LBW) (OR: 9; CI: 2.4–30) and preterm birth (OR: 2.5; CI: 1.5–3.5) are more probable in pregnant woman with COVID‐19 than pregnant women without COVID‐19. The most prevalent neonatal complications are neonatal intensive care unit admission (43% [2–96]), fetal distress (30% [12–58]) and LBW (25% [16–37]). The rate of vertical transmission is 5.3% (1.3–16), and the rate of positive SARS‐CoV‐2 test for neonates born to mothers with COVID‐19 is 8% (4–16). Overall, pregnant patients present with the similar clinical characteristics of COVID‐19 when compared with the general population, but they may be more asymptomatic. Higher odds of caesarean delivery, LBW and preterm birth among pregnant patients with COVID‐19 suggest a possible association between COVID‐19 infection and pregnancy complications. Low risk of vertical transmission is present, and SARS‐CoV‐2 can be detected in all conception products, particularly placenta and breast milk. Interpretations of these results should be done cautiously due to the heterogeneity between studies; however, we believe our findings can guide the prenatal and postnatal considerations for COVID‐19 pregnant patients.
Keywords: COVID‐19, infection, meta‐analysis, neonate, pregnancy, SARS‐CoV‐2, vertical transmission
Abbreviations
- ACE2
angiotensin‐converting enzyme 2
- BMI
body mass index
- CDC
Centers for Disease Control and Prevention
- CFR
case fatality rate
- CI
confidence interval
- COVID‐19
coronavirus disease 2019
- CRP
C‐reaction protein
- CT scan
computed tomography scan
- ESR
erythrocyte sedimentation rate
- GA
gestational age
- GGO
ground‐glass opacity
- IQR
interquartile range
- LBW
low birth weight
- LDH
lactate dehydrogenase
- MERS‐CoV
Middle East respiratory syndrome coronavirus
- N
number
- NA
not known
- NICU
newborn intensive care unit
- OR
odds ratio
- PPH
postpartum haemorrhage
- PRISMA
Preferred Reporting Items for systematic Reviews and Meta‐analysis Statement
- RT‐PCR
real‐time polymerase chain reaction
- SARS‐CoV
severe acute respiratory syndrome coronavirus
- WBC
white blood cell
1. INTRODUCTION
Major human pathogenic coronaviruses are severe acute respiratory syndrome coronavirus 1 (SARS‐CoV‐1), Middle East respiratory syndrome coronavirus (MERS‐CoV) and the severe acute respiratory syndrome coronavirus 2 (SARS‐CoV‐2). 1 Horizontal transmission of SARS‐CoV‐2 occurs via aerosolized droplets or through contact with infected surfaces, potentially leading to the coronavirus disease 2019 (COVID‐19). 2 SARS‐CoV‐2 is more contiguous than SARS‐CoV‐1 and MERS‐CoV. 3 All demographics are susceptible to SARS‐CoV‐2; pregnant women are no exception. Respiratory and immune system adaptations during pregnancy increase the risk of acquiring pneumonia and developing severe complications. 4 , 5 Pregnancy makes women more susceptible to severe infection by infectious agents such as influenza virus. 6 Influenza vaccine was shown to decrease birth outcomes involving preterm birth and low birth weight (LBW). 7 To protect the fetus from maternal immune responses, alterations in the immune system are necessary, which include decreased number and activity of T cells (both CD4+ and CD8+) and natural killer cells and decreased T‐cell proliferation, 8 , 9 , 10 as well as pregnancy‐related hormones that are speculated to weaken cellular immunity. 11 Cardiopulmonary alterations such as increased heart rate and stroke volume and decreased residual capacity may also play an important role in vulnerability of pregnant women to respiratory infections. Decreased functional residual capacity occurs due to anatomical changes in diaphragm and thorax and stimulation of the central respiratory centre via hormonal changes, such as increased corticosteroid aimed at increasing ventilation, but they can cause hypoxia and decreased respiratory capacity in an acute lung injury such as pneumonia. 12
SARS‐CoV‐1 was linked to complications related to severe infection and a higher mortality rate in pregnant women compared to non‐pregnant patients. 13 , 14 Similarly, an increased risk for severe COVID‐19 among pregnant women compared with non‐pregnant women has also been reported. 15 SARS‐CoV‐1 was also reported to cause obstetric complications such as spontaneous abortion, preterm delivery and intrauterine growth restriction. 13 , 16 Of note, animal models evidenced that expression and activity of angiotensin‐converting enzyme 2 (ACE2), the main receptor for SARS‐CoV‐2, increase in kidney, uterus and placenta during pregnancy. 17 Thus, it can be hypothesized that reproductive organs are potential targets for SARS‐CoV‐2. Impact of SARS‐CoV‐2 infection on pregnancy outcomes have not been consistently reported. Women infected with SARS‐CoV‐2 were reported to show elevated rates of obstetric complications such as caesarean delivery and preterm birth. 18 , 19 However, there are reports that indicated no significant difference between SARS‐CoV‐2 infection and adverse outcomes of pregnancy. 20 , 21 By conducting a large‐scale meta‐analysis of reports on SARS‐CoV‐2 infection, we aimed to provide comprehensive data regarding pregnant patients. We quantified clinical, laboratory and imaging features of the SARS‐CoV‐2 infection in addition to pregnancy‐related characteristics and outcomes of pregnant women. To assess the impact of SARS‐CoV‐2 on pregnancy, comparison between pregnant women and control groups was performed, whenever data were available.
Another concern is the vertical transmission from the mother to the fetus or neonate during perinatal period that needs to be addressed. Since the beginning of the SARS‐CoV‐2 outbreak, several studies have been published regarding mother‐to‐infant transmission, 22 , 23 , 24 , 25 but the risk of vertical transmission in the population is not clear. This lack of knowledge and subsequent anxiety in patients and clinicians might be an explanation for the high prevalence of preterm birth and caesarean delivery in COVID‐19 patients. 26 , 27 In this study, data are provided regarding the rate of the vertical transmission, SARS‐CoV‐2 detection in neonates born to infected mothers, and viral detection in breast milk and conception products.
2. METHODS
2.1. Search strategy
This study was conducted according to the Preferred Reporting Items for Systematic Reviews and Meta‐Analyses Statement guidelines. 28 We searched all studies published up to October 2020, from the following databases: Embase, Scopus, PubMed, Web of Science and the Cochrane library. Search medical subject headings terms used were ‘COVID‐19’, ‘SARS Cov‐2’, ‘severe acute respiratory syndrome coronavirus 2’, ‘coronavirus disease 2019 virus’, ‘ 2019 novel coronavirus’, ‘COVID‐19’, ‘ pregnant’, ‘pregnancy’ and all their synonyms like ‘SARS‐CoV‐2’ and ‘2019‐nCoV’. Moreover, we searched for unpublished and grey literature with Google scholar, Centers for Disease Control and Prevention (CDC) and World Health Organization databases. We also examined references of included articles to find additional relevant studies. There was no language restriction, and all other languages were translated by https://translate.google.com/. Additional search strategy details are provided in Table S1.
2.2. Study selection
Duplicate studies were removed using EndNote X7 (Thomson Reuters). Records were initially reviewed by title and abstract independently by three authors (AP, SG and MR). The full text of potentially eligible records was retrieved and examined, and any disagreement was resolved by consensus.
2.3. Eligibility and inclusion criteria
Studies to be eligible for inclusion in our meta‐analysis had to have the following predetermined criteria. All case–control, cross‐sectional, cohort studies, case reports and case‐series peer‐reviewed studies were included if they reported the number of confirmed cases of patients with demographic data, [AND] [OR] clinical data, [AND] [OR] radiology data, [AND] [OR] laboratory data [AND] [OR] risk factor data. Only patients with laboratory confirmation of SARS‐CoV‐2 infection were included. In all included case–control studies, ‘pregnant women with confirmed COVID‐19’ were the case group. Two different types of control groups were included and analysed as follows: (1) non‐pregnant patients (either genders) with COVID‐19 and (2) pregnant women without COVID‐19.
2.4. Exclusion criteria
Studies without the number of confirmed cases, letters to editor, review articles, individual case reports and news reports were excluded. Duplicate data from the same patients were combined and counted as a single case when the data were reported more than one.
2.5. Data extraction
All included literatures were published in 2020. The following items were extracted from each article: first author, centre and study location, countries, sample collection time, patient follow‐up time, the reference standard for infection confirmation, number of confirmed cases, study type, and all demographic, clinical, radiological, laboratory data, and risk factor data. Two of our authors (SG and MR) independently extracted data, and all extracted data were checked randomly by another author (AP); the differences were resolved by consensus.
2.6. Quality assessment
Quality assessments of studies were performed by two reviewers independently according to the Critical Appraisal Checklist recommended by the Joanna Briggs Institute, and disagreements were resolved by consensus. The checklist is composed of nine questions that reviewers addressed for each study. The ‘Yes’ answer to each question received one point. Thus, the final scores for each study could range from 0 to 9 (Table S2). 29
2.7. Analysis
Data cleaning and preparation were done in Microsoft Excel 2010 (Microsoft©), and further analyses were carried out via Comprehensive Meta‐Analysis Software Version 2.0 (Biostat). Determination of heterogeneity among the studies was undertaken using the chi‐squared test (Cochran's Q) to assess the appropriateness of pooling data. We used random‐effect model (M‐H heterogeneity) for pooled proportion results. 30 Pooled odds ratios (ORs) and 95% confidence intervals (CIs) were calculated from the raw data of the included studies using the random‐effects models. Percentages and means ± standard deviations (SDs) were calculated to describe the distributions of categorical and continuous variables, respectively. p‐Values reflect study heterogeneity with <0.05 being significant. We also used the funnel plot, Begg's and Egger's tests based on the symmetry assumption to detect publication bias (Figure S1).
3. RESULTS
3.1. Characteristics of included studies
The process of study selection is represented in Figure 1. A total of 551,755 reports were screened for the analysis of patients with non‐pregnant COVID‐19 and pregnant COVID‐19; 545,031 of them were excluded after the duplicate removing, title and abstract screening; and the full text of 497 reports were reviewed in full text. We excluded studies that did not report sufficient data such as variables that we were looking for. Out of 349 included studies, 228 studies met the inclusion criteria for non‐pregnant COVID‐19 and 121 for pregnant COVID‐19. The characteristics of the selected articles are summarized in Table S3.
FIGURE 1.
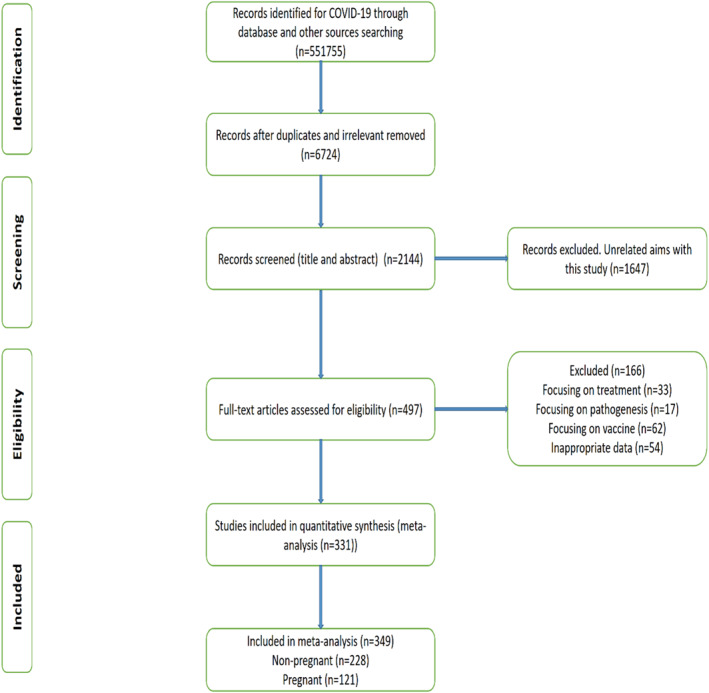
Flow diagram of literature search and study selection (PRISMA flow chart)
FIGURE 2.
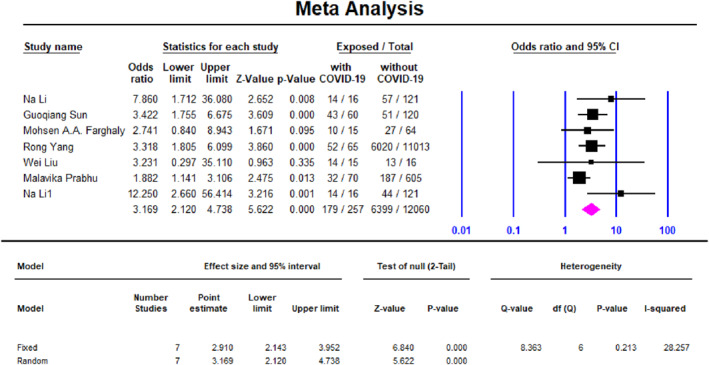
Meta‐analysis forest plot, association of caesarean delivery in COVID‐19 pregnant women (case) and COVID‐19 non‐pregnant women (control)
FIGURE 3.

Meta‐analysis forest plot, association of history of low birth weight (<2500 gr) in COVID‐19 pregnant women (case) and COVID‐19 non‐pregnant women (control)
3.2. Quality assessment
Quality assessment of included studies was performed based on the Critical Appraisal Checklist, and the final quality scores of the included studies are represented in Table S2. Among 349 included studies, 155 had high quality (8–9 score), 117 medium (6–7 score), and 77 study had low (score 5) or unknown quality. For example, studies by Chen, 31 Wang, 32 Huang, 33 Guan, 34 Zhang, 35 Cheng, 36 Li, 37 Xu 38 and Song 39 had the highest quality of the COVID‐19 studies available to date in the purpose of this study.
3.3. Demographics, baseline characteristics and clinical characterization
Overall, 128,176 non‐pregnant patients with confirmed COVID‐19 infection and 10,000 pregnant COVID‐19 patients were included in the meta‐analysis. Funnel plots for included studies did not detect significant publication bias (Figure S1). The mean age among 125,360 non‐pregnant COVID‐19 patients, was 51.2 (95% CI 45–57, p < 0.001), and was 33 (95% CI 28–37, p < 0.001) among 3348 pregnant COVID‐19 patients.
Table 1 shows that most non‐pregnant COVID‐19 was 74% (95% CI 72.5–79, p < 0.001), and pregnant COVID‐19 75.5% (95% CI 36–58, p < 0.001) had fever. Cough was the second most common symptom presenting in both non‐pregnant COVID‐19 53.5% (95% CI 50–58, p < 0.001) and pregnant COVID‐19 48.5% (95% CI 42–55, p < 0.001) patients. Myalgia was the third most common manifestation in pregnant COVID‐19 26.5% (95% CI 19–35, p < 0.001). Dysgeusia was the third most common symptom presenting in non‐pregnant COVID‐19 27% (95% CI 10–53, p = 0.9). Also, fatigue was the fourth most common symptom in non‐pregnant COVID‐19 26.5% (95% CI 24–30, p < 0.001), while it was less common in pregnant COVID‐19 21% (95% CI 17–25.5, p < 0.001) patients. Chill was the fourth most common symptom detected in 25% (95% CI 17–87, p = 0.03) of pregnant patients. Anosmia was found in 25% (95% CI 11–48, p = 0.9) of non‐pregnant COVID‐19, while it is found in 13.5% (95% CI 5–31.5, p < 0.001) of pregnant COVID‐19 patients. The mean body temperature was 37.2 (95% CI 37.1–37.3, p = 0.1) among non‐pregnant COVID‐19 patients, and it was 36.7 (95% CI 33–38.5, p < 0.001) among pregnant COVID‐19 patients. Hemoptysis was found in 3% (95% CI 1.5–4.5, p < 0.001) among non‐pregnant COVID‐19 patients, and it was found in 3.5% (95% CI 0.5–19 p = 0.07) among pregnant COVID‐19 patients.
TABLE 1.
Demographics and clinical manifestations of COVID‐19 in pregnant women compared with non‐pregnant adult patients with confirmed SARS‐CoV‐2 infection
| Variables | Non‐pregnant (total of 228 studies, 128,176 patients) | Pregnant (total 121 studies, 10,000 patients) | ||||||||
|---|---|---|---|---|---|---|---|---|---|---|
| Proportion%/Mean * (95% CI) | Number of included studies | Number of included patients | I 2 | p‐Value *** | Proportion%/Mean * (95% CI) | Number of included studies | Number of included patients | I 2 | p‐Value *** | |
| Age (years) * | 51.2 (45–57) | 189 | 125,360 | 98 | <0.001 | 33 (28–37) | 56 | 3348 | 98 | <0.001 |
| Male sex | 52.2 (50–53.2) | 216 | 127,743 | 81 | <0.001 | ‐ | ‐ | ‐ | ‐ | ‐ |
| Fever | 74 (72.5–79) | 182 | 125,237 | 89 | <0.001 | 75.5 (36–58) | 55 | 3302 | 75 | <0.001 |
| Chill | 15.5 (9–21) | 34 | 9577 | 89 | <0.001 | 25 (17–87) | 6 | 102 | 77 | 0.03 |
| Body temperature (°C) | 37.2 (37.1–37.3) | 28 | 7691 | 53 | 0.01 | 36.7 (mean)(35–38.5) | 27 | 159 | 99 | <0.001 |
| Fatigue | 26.5 (24–30) | 163 | 121,645 | 92 | <0.001 | 21 (17–25.5) | 25 | 2030 | 66 | <0.001 |
| Myalgia | 19.5 (17–24) | 145 | 97,077 | 91 | <0.001 | 26.5 (19–35) | 18 | 1196 | 79 | <0.001 |
| Dyspnea | 14.5 (11–19) | 124 | 78,761 | 89 | <0.001 | 22 (16–28) | 26 | 2306 | 85 | <0.001 |
| Cough | 53.5 (50–58) | 183 | 125,162 | 89 | <0.001 | 48.5 (42–55) | 52 | 3175 | 84 | <0.001 |
| Sputum | 19.5 (18–24) | 134 | 81,506 | 81 | <0.001 | 13 (5–31.5) | 13 | 1209 | 93 | <0.001 |
| Sore throat | 10.5 (9.5–14) | 98 | 57,989 | 89 | <0.001 | 9 (6–14) | 10 | 313 | 0 | 0.7 |
| Dysgeusia | 27 (10–53) | 14 | 1023 | 0 | 0.9 | 6 (3–10) | 7 | 221 | 0 | 0.09 |
| Anosmia | 25 (11–48) | 18 | 1220 | 0 | 0.9 | 13.5 (5–31.5) | 9 | 1240 | 90 | <0.001 |
| Headache | 11 (9–12) | 121 | 72,311 | 81 | <0.001 | 16 (6–46) | 8 | 240 | 69 | 0.02 |
| Chest pain | 11 (8–12.5) | 78 | 47,759 | 89 | <0.001 | 13 (9–19) | 13 | 216 | 0 | 0.09 |
| Diarrhoea | 8 (6.6–11) | 131 | 81,421 | 93 | <0.001 | 9 (6–12.5) | 28 | 2523 | 73 | <0.001 |
| Nausea and vomiting | 4 (4–8.5) | 81 | 52,878 | 89 | <0.001 | 11 (7–18) | 11 | 954 | 75 | <0.001 |
| Hemoptysis | 3 (1.5–4.5) | 28 | 7754 | 71 | <0.001 | 3.5 (0.5–19) | 7 | 696 | 69 | 0.07 |
| Renal injury | 9.5 (6–14.5) | 58 | 6577 | 92 | <0.001 | 3 (1–9.5) | 12 | 1381 | 73 | 0.09 |
| Risk factors and comorbidities | ||||||||||
|---|---|---|---|---|---|---|---|---|---|---|
| Non‐pregnant | Pregnant | |||||||||
| Proportion% (95% CI) | Number of included studies | Number of included patients | I 2 | p‐Value *** | Proportion% (95% CI) | Number of included studies | Number of included patients | I 2 | p‐Value *** | |
| Contact history a | 41 (35–52) | 65 | 11,126 | 94 | <0.001 | 35 (20–54) | 26 | 8365 | 69 | <0.001 |
| Healthcare worker | 22.5 (9–43) | 43 | 89,657 | 92 | <0.001 | 17 (6.5–31) | 5 | 129 | 66 | 0.02 |
| Hypertension | 21 (16–25) | 146 | 17,451 | 94 | <0.001 | b 9 (8–10) | 24 | 8328 | 96 | <0.001 |
| Diabetes | 11 (7.5–14.5) | 103 | 96,545 | 94 | <0.001 | c 18 (11–27) | 21 | 8267 | 0 | 0.4 |
| Non‐gestational diabetes | ‐ | ‐ | ‐ | ‐ | ‐ | 8 (4.5–13) | 26 | 8412 | 82 | <0.001 |
| Gestational diabetes | 10 (7.5–13.5) | 29 | 1563 | 37 | 0.07 | |||||
| Chronic respiratory disease | 10.5 (7–14.5) | 87 | 86,678 | 96 | <0.001 | 6.3 (4–10) | 14 | 8064 | 93 | <0.001 |
| Bacterial co‐infection | 4.3 (1.4–11) | 31 | 3767 | 89 | <0.001 | 16 (2.5–61) | 18 | 5467 | 84 | <0.001 |
| Viral co‐infection | 4.5 (2–11) | 28 | 5876 | 84 | <0.001 | 14 (7.5–25) | 17 | 5134 | 0 | 0.6 |
| Chest x‐ray and CT scan findings | ||||||||||
|---|---|---|---|---|---|---|---|---|---|---|
| Non‐pregnant | Pregnant | |||||||||
| Proportion% (95% CI) | Number of included studies | Number of included patients | I 2 ** | p‐Value *** | Proportion% (95%) CI | Number of included studies | Number of included patients | I 2 ** | p‐Value *** | |
| Maternal abnormal chest imaging | 83.5 (77–80) | 29 | 3765 | 89 | <0.001 | 89 (75–95) | 38 | 3361 | 96 | <0.001 |
| Bilateral involvement | 77.2 (61.5–86) | 35 | 86,156 | 91 | <0.001 | 68 (54–79) | 22 | 1477 | 85 | <0.001 |
| Unilateral involvement | 16 (12–21.5) | 63 | 8434 | 89 | <0.001 | 24 (21–27) | 14 | 1387 | 14 | 0.31 |
| Consolidation | 76 (50.5–91) | 16 | 3454 | 91 | <0.001 | 41 (30–53) | 9 | 771 | 85 | <0.001 |
| Ground‐glass opacity | 72 (41–92) | 37 | 97,768 | 82 | <0.001 | 57 (39–73) | 7 | 1470 | 94 | <0.001 |
| Neonatal abnormal chest X ray | ‐ | ‐ | ‐ | ‐ | ‐ | 49 (13–41) | 9 | 109 | 49 | 0.09 |
| Outcome | ||||||||||
|---|---|---|---|---|---|---|---|---|---|---|
| Non‐pregnant | Pregnant | |||||||||
| Proportion% (95% CI) | Number of included studies | Number of included patients | I 2 | p‐Value *** | Proportion% (95% CI) | Number of included studies | Number of included patients | I 2 | p‐Value *** | |
| Case fatality rate d | 6.4 (4.4–8.5) | 153 | 98,987 | 89 | <0.001 | 11.3 (9.6–13.3) | 18 | 2660 | 82 | <0.001 |
Abbreviations: CI, confidence interval; NA, not available; SARS‐CoV‐2, severe acute respiratory syndrome coronavirus 2.
Contact with another person with respiratory symptoms.
Including both gestational and chronic hypertension.
Including both gestational and non‐gestational diabetes.
For pregnant women, maternal death from all‐cause is reported
Age and body temperature are presented in mean. Other variables are reported as proportions.
Greater than 50% is considered high heterogeneity, less than 50% is considered low heterogeneity.
A low p‐value (<0.05) is consistent with high heterogeneity.
3.4. Risk factors and comorbidities of patients infected with COVID‐19
Totally, 41% (95% CI 35–52, p < 0.001) of non‐pregnant COVID‐19 patients and 35% (95% CI 20–54, p < 0.001) of pregnant COVID‐19 had contact with another person with respiratory symptoms. Another risk factor for non‐pregnant COVID‐19 was health care worker by 22.5% (95% CI 9–43, p < 0.001), in comparison to 17% (95% CI 6.5–31, p = 0.02) in pregnant COVID‐19. The most common comorbidity for non‐pregnant COVID‐19 was hypertension in 21% (95% CI 16–25, p < 0.001), in comparison to 9% (95% CI 8–10, p < 0.001) in pregnant COVID‐19. Diabetes was the most common comorbidity for pregnant COVID‐19 in 18% (95% CI 11–27, p = 0.4) in comparison to non‐pregnant COVID‐19 was 11% (95% CI 7.5–14.5, p < 0.001). In addition, non‐gestational diabetes and gestational diabetes among pregnant patients with COVID‐19 were 8% (95% CI 4.5–13, p < 0.001) and 10% (95% CI 7.5–13.5, p = 0.07), respectively. Bacterial co‐infection occurred in non‐pregnant COVID‐19 in 4.3% (95% CI 1.4–11, p < 0.001), compared to 16% (95% CI 2.5–61, p < 0.001) in pregnant COVID‐19. Viral co‐infection occurred in non‐pregnant COVID‐19 in 4.5% (95% CI 2–11, p < 0.001) patients, when compared to pregnant COVID‐19 14% (95% CI 7.5–25, p = 0.6).
3.5. Chest x‐ray and CT scan findings in non‐pregnant and pregnant patients with COVID‐19
The analysis showed that 83.5% (95% CI 77–80, p < 0.001) of non‐pregnant COVID‐19 patients and 89% (95% 75–95, p < 0.001) of pregnant COVID‐19 patients had abnormal radiological findings on chest x‐ray or computed tomography (CT) scan. The most common radiological abnormalities in non‐pregnant COVID‐19 patients were 77.2% (95% CI 61.5–86, p < 0.001) bilateral involvement, 76% (95% CI 50.5–91, p < 0.001) consolidation and 72% (95% CI 41–92, p < 0.001) ground‐glass opacities (GGOs). The most common radiological abnormalities in pregnant COVID‐19 were 68% (95% CI 54–79, <0.001) bilateral involvement, 57% (95% CI 39–73, p < 0.001) GGO and 41% (95% CI 30–53, p < 0.001) consolidation. Also, abnormal chest x‐ray findings in neonates were found in 49% (95% CI 13–41, p = 0.09) (Table 1).
3.6. Outcome
Based on the available data, the case fatality rate (CFR) of non‐pregnant COVID‐19 hospitalized patients was 6.4% (95% CI 4.4–8.5, p < 0.001). For pregnant patients, the CFR was not possible to report based on the original article; however, death from all‐cause in pregnant women with COVID‐19 was calculated 11.3% (95% CI 9.6–13.3, I 2 82%).
3.7. Association of clinical outcomes and laboratory findings between case and control groups
Table 2 shows odds ratio (OR) for comparing clinical symptoms of COVID‐19 between pregnant patients (cases) and non‐pregnant (controls). Pregnant patients were less probable to present some of the common manifestations of COVID‐19 comparing with non‐pregnant patients including cough (OR = 0.7, CI 0.67–0.75, I 2 = 85), sore throat (OR = 0.66, CI 0.61–0.7, I 2 = 82), headache (OR = 0.55, CI 0.55–0.58, I 2 = 65), fatigue (OR = 0.58, CI 0.54–0.61, I 2 = 91) and diarrhoea (OR = 0.46, CI 0.4–0.51, I 2 = 87). Odds of fever and nausea and vomiting, on the other hand, were not significant between groups. Table 2 also shows OR for clinical outcomes for comparison between COVID‐19 pregnant patients (cases) and non‐COVID‐19 pregnant patients (controls). Caesarean delivery was significantly higher in COVID‐19 patients by yielding a summary OR of 3 (95% CI 2–5, I 2 = 28), same as preterm birth with OR of 2.5 (95% CI 1.5–3.5, I 2 = 0) and LBW with OR of 9 (95% CI 2.4–30, I 2 = 0).
TABLE 2.
Association of clinical symptoms, pregnancy outcomes and laboratory findings between case and control groups
| Variables | Odds ratio (95%CI) | Number of studies | I ** | p‐value *** | Pregnant Women with COVID‐19 (Case) n/N | Non‐pregnant patients with COVID‐19 (Control) n/N |
|---|---|---|---|---|---|---|
| Fever | 0.8 (0.6–1.1) | 5 | 95 | <0.001 | 4562/31,871 | 87,090/470,092 |
| Cough | 0.7 (0.67–0.75) | 5 | 85 | <0.001 | 23,114/241,238 | 41,570/121,240 |
| Sore throat | 0.66 (0.61–0.7) | 5 | 82 | <0.001 | 543/14,238 | 1682/41,240 |
| Headache | 0.55 (0.55–0.58) | 5 | 65 | 0.007 | 2710/14,138 | 41,899/121,240 |
| Fatigue | 0.58 (0.54–0.61) | 5 | 91 | <0.001 | 1929/13,238 | 30,505/98,240 |
| Diarrhoea | 0.46 (0.4–0.51) | 4 | 87 | <0.001 | 872/14,138 | 18,121/142,240 |
| Nausea and vomiting | 1 (0.94–1.1) | 3 | 0 | 0.8 | 2737/31,672 | 35,798/469,268 |
| Odds ratio (95% CI) | Number of studies | I 2 ** | p‐Value *** | Pregnant women with COVID‐19 (Case) n/N | Pregnant women without COVID‐19 (Control) n/N | |
|---|---|---|---|---|---|---|
| Non‐gestational diabetes | 1.3 (0.87–1.9) | 5 | 0 | 0.9 | 36/638 | 120/2671 |
| Singleton | 0.11 (−0.2–0.68) | 3 | 0 | 0.4 | 118/121 | 414/415 |
| Medical comorbidities | 8.4 (0.7–92) | 3 | 49 | 0.16 | 4/32 | 5/242 |
| Preterm birth | 2.5 (1.5–3.5) | 8 | 0 | 0.8 | 45/295 | 694/12,634 |
| Low birth weight | 9 (2.4–30) | 2 | 0 | 0.99 | 6/32 | 6/242 |
| Fetal distress | 2.7 (0.6–9) | 2 | 0 | 0.99 | 4/32 | 12/242 |
| Caesarean delivery | 3 (2–5) | 7 | 28 | 0.21 | 179/257 | 6399/12,060 |
| Lab findings | ||||||
|---|---|---|---|---|---|---|
| Odds ratio (95% CI) | Number of study | I 2 ** | p‐Value *** | Pregnant women with COVID‐19 (Case) n/N | Pregnant Women without COVID‐19 (Control) n/N | |
| Leucocyte (mean) | 0.7 (0.3–1) | 2 | 0 | 0.54 | 32 | 242 |
| Neutrophil (mean) | 0.53 (0.15–0.9) | 2 | 0 | 0.4 | 32 | 242 |
| Lymphocyte (mean) | 0.4 (0.15–0.8) | 2 | 0 | 0.6 | 32 | 242 |
| Lymphocytes decreased * | 1 (0.3–3) | 2 | 0 | 0.9 | 4/32 | 29/242 |
| CRP (mean) | 0.37 (0.01–0.7) | 2 | 0 | 0.4 | 32 | 242 |
| CRPIncreased* | 0.4 (0.2–0.9) | 2 | 0 | 0.65 | 10/32 | 125/242 |
| ALT (mean) | 0.05 (−0.36–0.4) | 2 | 0 | 0.9 | 32 | 242 |
| AST (mean) | 0.3 (0.02–0.9) | 2 | 0 | 0.56 | 32 | 242 |
Note: Different case and control groups. n; number of patients in each group who presented the variable of interest. N; total number of patients in each group.
Abbreviations: ALT, alanine aminotransferase; AST, aspartate aminotransferase; CRP, C‐reaction protein, n = number of variable, N= number of total case or control; PMH, past medical history.
Increased or decreased refers to values above or below the normal range.
Greater than 50% is considered high heterogeneity, less than 50% is considered low heterogeneity.
A low p‐value (<0.05) is consistent with high heterogeneity.
3.8. Laboratory findings of patients infected with COVID‐19
The laboratory findings showed that among non‐pregnant COVID‐19 patients where data were available, mean count of leucocytes (white blood count [WBC]) was 6 × 10⁹ per L (95% CI 5–7.2) which is less than pregnant COVID‐19 that was 8 × 10⁹ per L (95% CI 7.2–8.8). Also, the WBC was increased in 14% of non‐pregnant patients and 27% of pregnant COVID‐19 cases. WBC count was decreased in 25.5% of non‐pregnant patients which was almost the same as in pregnant patients. Among non‐pregnant COVID‐19 patients, the mean count of neutrophil was 4.3 × 10⁹ per L (95% CI 3.5–8.5), which was less than pregnant COVID‐19, 6.6 × 10⁹ per L (95% CI 4.6–8.2). The platelet count was decreased in 12.5% and 18% of non‐pregnant and pregnant patients, respectively. D‐dimer level was elevated in both groups, but it was higher in pregnant (3.5 mcg/ml, 95% CI: 1.4–5.5) than non‐pregnant (2.5 mcg/ml, 95% CI: 0.8–5.5). C‐reactive protein (CRP) was increased in 81% and 52% of non‐pregnant and pregnant patients, respectively (Table 3).
TABLE 3.
Meta‐analysis; laboratory findings of pregnant and non‐pregnant patients with confirmed COVID‐19
| Normal range | Proportion%/Mean (95% CI) | Number of patients | Number of studies | Proportion%/Mean (95% CI) | Number of patients | Number of studies | |
|---|---|---|---|---|---|---|---|
| Non‐pregnant | Pregnant | ||||||
| Leucocytes | 3.5–9.5 (× 10⁹ per L) | 6 (5–7.2) | 10,268 | 81 | 8 (7.2–8.8) | 294 | 5 |
| Increased | 14 (%) | 27 (%) | |||||
| Decreased | 25.5 (%) | 25 (%) | |||||
| Neutrophils | 1.8–6.3 (× 10⁹ per L) | 4.3 (3.5–8.5) | 9742 | 53 | 6.6 (4.6–8.2) | 10 | 2 |
| Increased | ‐ | 70% | |||||
| Lymphocytes | 1.1–3.2 (× 10⁹ per L) | 1.12 (0.95–1.3) | 16,231 | 71 | 1.25 (0.5–1.7) | 317 | 9 |
| Decreased | 62.5 (%) | 64 (%) | |||||
| Platelets | 125–350 (× 10⁹ per L) | 185 (179–198) | 8456 | 46 | ‐ | ‐ | ‐ |
| Decreased | 12.5 (%) | 18 (%) | 47 | 5 | |||
| Increased | 28 (%) | ‐ | |||||
| C‐reactive protein a | 0–0.5 (mg/L) | 29 (16.7–42.5) | 1455 | 29 | 11 (5–16) | 316 | 8 |
| Increased | 81 (%) | 52 (%) | |||||
| Alanine aminotransferase | 20–60 IU/L | 28.4 (28.3–28.5) | 9958 | 64 | 31.5 (16–65) | 24 | 5 |
| Aspartate aminotransferase | 29–33IU/L | 37.5 (31–44) | 9803 | 62 | 29 (9–50) | 24 | 5 |
| Total bilirubin | 0.1–1.2 (mg/dl) | 0.6 (0.2–1.3) | 91 | 2 | 0.4 (0.3–0.5) | 58 | 3 |
| Albumin | 35‐55 g/L | 37 (35.6–38) | 8227 | 40 | 29 (22–36) | 64 | 3 |
| D‐dimer | <0.4 mcg/ml | 2.5 (0.8–5.5) | 7407 | 48 | 3.5 (1.4–5.5) | 27 | 3 |
| Na | 135–145 mmol/L | 140.8 (140.7–140.9) | 6403 | 20 | 139 (137–140) | 6 | 3 |
| K | 3.5–5.0 mmol/L | 4.1 (4–4.2) | 6171 | 20 | 3.7 (3–5) | 6 | 3 |
Increased and decreased refer to values above or below the normal range, respectively. Some normal ranges can be different in the different age and sex groups.
3.9. Maternal characteristics and outcomes of pregnant patients with confirmed COVID‐19
Medical comorbidities were present in 33% (95% CI 20–48, p < 0.001) of mothers, history of caesarean delivery in 17% (95% CI 9.6–28, p = 0.3), the mean number of gravidity was 4.3 (95% CI 3.2–5.5, p < 0.7), parity in 46% in a group of 864 pregnant women (95% CI 40–52, p < 0.5), nulliparity in 50% (95% CI 44–56, p < 0.6) in another group of 978 of pregnant patients. The mean body mass index (BMI) of mothers was 32.1 kg/m2 (95% CI 0.7–54, p < 0.3). The mean gestational age at admission was 36 weeks (95% CI 34–37, p < 0.001). Caesarean delivery occurred in 48% (95% CI 42–54, p < 0.001), vaginal delivery in 26% (95% CI 20–34, p < 0.001), singleton in 92% (95% CI 79–97, p < 0.09), twins in 9% (95% CI 2–26.5, p < 0.04), premature rupture of membranes in 14% (95% CI 7–29, p < 0.014), preterm labour in 25% (95% CI 4–74, p < 0.004), preterm birth in 21% (95% CI 12–34, p < 0.003), pre‐eclampsia in 9.5% (95% CI 3–27.5, p < 0.03), placenta previa in 7.5% (95% CI 2–28, p < 0.1), abortion in 4% (95% CI 2–9, p < 0.001), postpartum haemorrhage in 54.5 (95% CI 7–94, p < 0.001) of the pregnant COVID‐19 confirmed cases (Table 4).
TABLE 4.
Meta‐analysis: characteristics and obstetric and neonatal outcomes of pregnant patients with confirmed COVID‐19
| Variables | Proportion%/Mean * (95% CI) | Number of included studies | Number of included patients | I 2 ** | p‐Value *** |
|---|---|---|---|---|---|
| Medical comorbidities | 33 (20–48) | 21 | 8172 | 71 | <0.001 |
| History of caesarean delivery | 17 (9.6–28) | 6 | 723 | 17 | 0.3 |
| Number of gravidity * | 4.3 (3.2–5.5) | 15 | 562 | 0 | 0.7 |
| History of parity | 46 (40–52) | 16 | 864 | 0 | 0.5 |
| Nulliparity | 50 (44–56) | 9 | 978 | 0 | 0.6 |
| Maternal BMI (kg/m2) * | 32.1 (0.7–54) | 14 | 764 | 16 | 0.3 |
| Gestational age at admission (mean of weeks) | 36 (34–37) | 31 | 869 | 85 | <0.001 |
| Caesarean delivery | 48 (42–54) | 57 | 8141 | 88 | <0.001 |
| Vaginal delivery | 26 (20–34) | 39 | 7937 | 96 | <0.001 |
| Preterm birth | 21 (12–34) | 18 | 896 | 64 | 0.003 |
| Preterm labour | 25 (4–74) | 6 | 576 | 82 | 0.004 |
| Abortion | 4 (2–9) | 9 | 1292 | 75 | <0.001 |
| PROM | 14 (7–29) | 13 | 456 | 62 | 0.014 |
| Placenta previa | 7.5 (2–28) | 6 | 564 | 56 | 0.1 |
| Pre‐eclampsia | 9.5 (3–27.5) | 7 | 812 | 65 | 0.03 |
| Postpartum haemorrhage | 54.5 (7–94) | 8 | 564 | 88 | <0.001 |
| Singleton | 92 (79–97) | 12 | 654 | 44 | 0.09 |
| Twins | 9 (2–26.5) | 8 | 456 | 59 | 0.04 |
| Neonatal death | 2.5 (1.5–6) | 18 | 2152 | 0 | 0.6 |
| Stillbirth | 4 (1.5–10) | 21 | 989 | 47 | 0.036 |
| Low birth weight | 25 (16–37) | 22 | 481 | 69 | <0.001 |
| Fetal tachycardia | 10 (7.5–15) | 5 | 262 | 0 | 0.99 |
| Fetal distress | 16 (7–32) | 12 | 795 | 58 | 0.046 |
| 1 min APGAR score * | 9 (8–10) | 16 | 1364 | 0 | 0.9 |
| 5‐min APGAR score * | 10 (9‐10.7) | 16 | 563 | 0 | 0.9 |
| Neonatal asphyxia | 4 (1.5‐9) | 13 | 459 | 0 | 0.8 |
| NICU admission | 17 (11–25) | 25 | 6943 | 85 | <0.001 |
| Vertical transmission | 5.3 (13–16) | 4 | 563 | 19 | 0.3 |
| SARS‐CoV‐2 confirmed neonates | 8 (4–16) | 17 | 5593 | 0 | 0.78 |
| Symptomatic neonates | 33 (13–62) | 15 | 579 | 79 | <0.001 |
| Breastfeeding | 38 (20‐61) | 13 | 456 | 84 | <0.001 |
| Formula feeding | 56 (28.5–80) | 9 | 342 | 82 | <0.001 |
| Mixed feeding | 39 (2.5–94) | 5 | 231 | 81 | <0.001 |
| SARS‐CoV‐2 found in placenta | 12 (5–26) | 11 | 364 | 7 | 0.3 |
| SARS‐CoV‐2 found in breast milk | 5 (2–11) | 18 | 789 | 18 | 0.26 |
| SARS‐CoV‐2 found in amniotic fluid | 5.6 (2–15) | 13 | 968 | 0 | 0.8 |
| SARS‐CoV‐2 found in umbilical cord | 6 (2–16.5) | 9 | 324 | 0 | 0.9 |
| SARS‐CoV‐2 found in vaginal secretions | 4.6 (1.6–12.5) | 8 | 253 | 0 | 0.5 |
Abbreviations: BMI, Body Mass Index; PROM, premature rupture of the membrane; NICU, neonatal intensive care unit; SARS‐CoV‐2, severe acute respiratory syndrome coronavirus 2.
Number of gravidity, maternal BMI, gestational age at admission, 1‐min APGAR score and 5‐min APGAR score are reported as mean. Other variables are reported as proportions.
Greater than 50% is considered high heterogeneity, less than 50% is considered low heterogeneity.
A low p‐value (<0.05) is consistent with high heterogeneity.
3.10. Fetal characteristics and outcomes of pregnant patients with confirmed COVID‐19
Fetal distress reported in 16% (95% CI 7–32, p = 0.046), fetal tachycardia in 10% (95% CI 7.5–15, p < 0.99), neonatal death in 2.5% (95% CI 1.5–6, p < 0.6), stillbirth in 4% (95% CI 1.5–10, p < 0.036), LBW (<2500 g) in 25% (95% CI 16–37, p < 0.001), mean of 1 min APGAR score was 9 (95% CI 8–10, p = 0.9), mean of 5 min APGAR score was 10 (95% CI 9–10.7, p = 0.9), neonatal asphyxia in 4% (95% CI 1.5–9, p = 0.8), vertical transmission in 5.3% (95% CI 13–16, p = 0.3), neonatal symptoms was found among 33% (95% CI 13–62, p < 0.001) of 579 cases, neonates with confirmed COVID‐19 were 8% (95% CI 4–16, p < 0.78) and COVID‐19 negative children were 68% (95% CI 57–78, p < 0.001). Breast feeding in 38% (95% CI 20–61, p < 0.001), formula feeding in 56% (95% CI 28.5–80, p < 0.001), mixed feeding in 39% (95% CI 2.5–94, p < 0.001) of cases were reported. SARS‐CoV‐2 reported to detect in 12% (95% CI 5–26, p < 0.3) of placenta specimens, in 5% (95% CI 2–11, p < 0.26) of breast milk, in 5.6% (95% CI 2–15, p < 0.8) of amniotic fluid, in 6% (95% CI 2–12.5, p < 0.9) of umbilical cord and in 4.6% (95% CI 1.6–12.5, p < 0.5) of vaginal secretions (Table 4).
4. DISCUSSION
This meta‐analysis described the characteristics of COVID‐19 in pregnant patients in comparison with the non‐pregnant adult population. In general, our meta‐analysis showed that pregnant patients with COVID‐19 had similar clinical, laboratory and imaging characteristics to non‐pregnant adult patients in the general population. Pregnant women with COVID‐19 experience worse perinatal outcomes comparing with pregnant women without COVID‐19. SARS‐CoV‐2 is detected in conception products and breast milk that may allow the vertical transmission of the virus to the fetus.
Based on a report by the CDC, most prevalent symptoms in patients with COVID‐19 in the general population were cough (84%), fever (80%), myalgia (63%), chills (63%), fatigue (62%), headache (59%) and shortness of breath (57%). 40 Our results revealed that fever (75.5%) and cough (48.5%) were the most common clinical symptoms observed in both pregnant women and non‐pregnant patients with COVID‐19. They were followed by myalgia and chill in pregnant women and dysgeusia and fatigue in non‐pregnant patients. Fever and cough were also reported by other meta‐analyses as the most common manifestations of COVID‐19 in pregnant women. 19 , 41 , 42 Based on our analysis, pregnant women with COVID‐19 manifested fever with similar odds to non‐pregnant women with COVID‐19; however, they were less likely to show cough, fatigue, sore throat, headache and diarrhoea. The lower probability of common symptoms of COVID‐19 in pregnant women, shown by our results and another meta‐analysis, 19 suggests a more asymptomatic course of the disease in pregnancy.
Our analysis showed that from every three pregnant patients with COVID‐19, approximately one patient had pre‐existing comorbidities. The most common comorbidities were diabetes (including gestational and non‐gestational diabetes) and bacterial co‐infection in pregnant patients. History of diabetes was also more common in pregnant women with COVID‐19 compared with non‐pregnant women with the disease in a different meta‐analysis. 19 Our results showed that both bacterial and viral co‐infection were more prevalent among pregnant women than in non‐pregnant patients. These findings can be related to the relative immunosuppression status due to pregnancy as well as the immunocompromised state during SARS‐CoV‐2 infection. Co‐infection in pregnant women may be the reason of the observed laboratory changes such as leucocytosis and elevated CRP. They may also be linked with adverse pregnancy outcomes such as preterm labour and birth since there are evidence regarding this association. 43 The mean of maternal BMI (32.1 kg/m2) in this study suggests that a considerable number of pregnant patients with COVID‐19 were obese. It can be hypothesized that obese patients are more probable to catch the disease in the hospital since they are more possible to admit in the hospital due to obstetric complications. Obesity is a risk factor for almost all pregnancy complications and maternal death. 44 It is also an independent prognostic factor for the severity of COVID‐19. 45 A report from the CDC also indicated a high frequency of chronic lung disease, diabetes mellitus and cardiovascular disease among pregnant patients with COVID‐19. 46 Regardless of the possible impairment of the immune system in pregnancy, our results indicate that comorbidities likely play a role in acquiring the infection and developing complications.
Our findings suggest that pregnant patients with COVID‐19 show similar imaging lesions with non‐pregnant patients. In contrast, GGOs were more common than consolidation in pregnant women. GOO was reported by another meta‐analysis as the most common imaging finding in pregnant patients. 41 In another study, clinical and imaging parameters were retrospectively reviewed and compared between pregnant patients and non‐pregnant patients with COVID‐19. The results showed higher frequent consolidation including mixed GGO with consolidation and complete consolidation in the pregnant group compared to the non‐pregnant adults that are inconsistent with our results which may be due to a smaller number of patients in their study. 47
In a large group of patients with COVID‐19 from the general population, the most prevalent laboratory findings were increased CRP (73.6%), decreased albumin (62.9%), increased erythrocyte sedimentation rate (61.2%), decreased eosinophils (58.4%), increased interleucin‐6 (53.1%), lymphopenia (47.9%) and increased lactate dehydrogenase (LDH) (46.2%). 48 Leucopenia, lymphopenia, increased LDH, CRP and ferritin were also the most common laboratory signs among patients with COVID‐19 in another study. 49 Compared with non‐pregnant patients with COVID‐19 in previous studies and our results, pregnant patients had similar changes of laboratory values such as altered leucocyte and platelet counts (increased or decreased), elevated levels of CRP, and D‐Dimer. The most common laboratory findings in pregnant patients were in turn neutrophilia, lymphopenia and raised CRP. Pregnant women had a higher proportion of leucocytosis and thrombocytopenia, but a lower proportion of elevated CRP comparing with non‐pregnant patients. D‐Dimer levels were elevated in both groups, but were higher in pregnant women (3.5 mcg/ml vs. 2.5 mcg/ml). Lymphopenia and raised CRP were most commonly reported by other meta‐analyses of pregnant patients. 19 , 41 Somehow consistent with our findings, another study reported that elevated leucocyte and neutrophil counts were more common in pregnant patients comparing with non‐pregnant adults. In the same study, no significant difference was observed for lymphopenia between groups. 47 The findings of another study, more consistent with our results, reported elevated inflammatory markers such as WBC, neutrophil, CRP, procalcitonin and D‐dimer were significantly higher in pregnant women, whereas mean lymphocyte percentage was lower than in non‐pregnant women. 50 Physiologic alterations in laboratory values during pregnancy may influence the interpretation of the values of pregnant women with COVID‐19. Elevated leucocyte counts, particularly neutrophil count, lymphocytopenia and thrombocytopenia are expected changes in pregnant women. 51 Furthermore, CRP values have been shown to be elevated in pregnant women than non‐pregnant persons and may further elevate during labour. 52
In our meta‐analysis, the CFR for non‐pregnant adult patients with COVID‐19 was 6.4%. Reports from different populations on COVID‐19 CFR varied from 0 to 20%; however, the estimated overall CFR was close to our study around 4%. 53 In women infected by SARS‐CoV‐1, the mortality rate appeared higher in those affected in pregnancy compared with non‐pregnant women. 14 , 54 The CFR for all reported mortality cases of pregnant women due to SARS and MERS were 15% and 27%, respectively. 55 In the present meta‐analysis, mortality from all‐cause in 2660 pregnant patients with COVID‐19 was 11.3%, which was markedly higher than 0.1% in another meta‐analysis of 11,580 women. 19 Various factors may be the source of the observed difference such as high heterogeneity of the values in the two studies (I 2: 82% in the current study and I 2: 80.2% in the second study). Moreover, a significant proportion of some of the known risk factors for maternal mortality was observed in our study. History of medical comorbidities, obesity, gravidity and prior caesarean delivery are maternal characteristic that were shown to be predictors of maternal death. 56
The most common obstetric outcomes based on our analysis were postpartum haemorrhage, caesarean delivery, preterm labour and preterm birth, respectively. Compared to women without COVID‐19, preterm birth, caesarean delivery and LBW were more probable in women with COVID‐19 and low or absent heterogeneity were observed between studies. Higher odds of preterm birth (OR = 3.01) in women with COVID‐19 compared to women without the disease was reported by another meta‐analysis. They did not find a difference for other maternal outcomes between groups. 19 Preterm delivery and birth weight did not show a significant association with COVID‐19 in pregnant women in another meta‐analysis and they reported a lack of between‐study heterogeneity (I 2 = 0%). 21 Caesarean delivery in our meta‐analysis occurred in almost half of the patients. It was also shown to be higher by another meta‐analysis (pooled proportion of 89%). 42 Indications for the caesarean section were not clear in most of the reports to show if they were due to medical indications. In this context, a systematic review of the pregnant COVID‐19 cases reported a high proportion of preterm birth by caesarean delivery. Among cases with the available indications for caesarean delivery, 55.9% was due to COVID‐19 pneumonia. 27 Therefore, there is an urgent need to address these issues. Higher proportions of comorbidities in pregnant patients could have predisposed them to elevated risk for pregnancy complications in addition to a higher risk for incidence and severity of the COVID‐19. Inconsistent with the current study, a large‐scale cohort observed no significant difference in pregnancy complications among patients with SARS‐CoV‐2 infection and pregnant women without infection. 20 Neonatal intensive care unit (NICU) admission was shown to have higher odds (OR 3.13) in neonates of pregnant patients with COVID‐19 than neonates born to patients without COVID‐19 in another meta‐analysis. 17
Some reports showed no evidence of vertical transmission and all samples of neonates including throat swab, amniotic fluid, cord blood and breast milk were negative. 57 , 58 , 59 Conversely, there are reports on the vertical transmission of the COVID‐19. 22 , 23 , 24 , 25 The possibility of this type of transmission is still under debate and strong evidence is lacking to support this type of transmission. 57 , 58 , 59 Real‐time polymerase chain reaction (RT‐PCR) of nasopharyngeal or anal swabs of infants born to infected mothers was reported. 22 , 24 Elevated SARS‐CoV‐2 IgM and IgG were also observed in the neonates of mothers with COVID‐19, while the results of the RT‐PCR were negative for SARS‐CoV‐2. 60 , 61 This result suggests that elevated anti‐SARS‐CoV‐2 antibody is not a strong evidence for vertical transmission due to the possible transfer from mother to infant. The results from our study support that there is a low possibility of vertical transmission in agreement with the results of other meta‐analyses. 62 In our study, SARS‐CoV‐2 was detected in breast milk and all conception products, although with low proportion, suggest them as a route for viral transmission. Other studies reported consistent findings regarding the presence of SARS‐CoV‐2 in conception products. 25 , 62 Based on our results, the pooled proportion of positive SARS‐CoV‐2 in placental specimens was almost twice than with other specimens. ACE2 is strongly expressed in maternal–fetal interface involving the placenta and decidua. 63 Therefore, it can be hypothesized that the virus can invade and damage the placenta and increase placental permeability. It may possibly lead to placenta insufficiency and some of the obstetric complications that were reported in women with COVID‐19 such as abortion, LBW or preterm birth. Based on the suggestive evidence for direct placenta invasion, caesarean delivery may not significantly decrease the risk of vertical transmission. In this regard, the neonates of the mothers with COVID‐19 were assessed for acquiring the infection. It was reported that the risk was low and caesarean delivery and breastfeeding did not increase the risk. 64 Moreover, in most studies, infants with positive test results for SARS‐CoV‐2 were asymptomatic or developed mild symptoms. 22 , 60 , 61 , 64
In conclusion, this meta‐analysis provided valuable information regarding COVID‐19 in the pregnant women and clarified that they are at a potential higher risk for pregnancy complications. We emphasize that both patients and their families are needed to be educated about preventive measures for SARS‐CoV‐2 infection and closely follow‐up for the development of signs and symptoms of the disease.
4.1. Limitations
Several limitations exist for this study. Publication bias and study heterogeneity are unavoidable in this type of study; therefore, it should be considered when interpreting the final data set. Further, this study may overestimate disease severity due to lack of screening of asymptomatic or mildly symptomatic individuals and subsequent publication bias related to these factors. Journal bias is another issue facing those who carry out meta‐analysis, yet it does not usually affect the general conclusions. Also, the possibility of the occurrence of other biases such as choice bias cannot be rejected.
CONFLICT OF INTEREST
The authors declare no competing interests.
AUTHOR CONTRIBUTIONS
Investigation, writing – original draft: MaryamSadat Investigation, Writing ‐ original draft: Ali Pormohammad. Investigation, writing – original draft, conceptualization, investigation, writing – original draft, review and editing, coordination: Shohreh Alimohammadi. Investigation, writing – original draft. Mehdi Mohammadi: Writing – review and editing: Saied Ghorbani. Writing – review and editing: Masoud Nouri‐Vaskeh. Writing – review and editing: Deepanwita Bose. Writing – review and editing: Cody Rasmussen‐Ivey. Writing – review and editing: Sedigheh Basirjafari. Writing – review and editing: Mohammad Hossein Razizadeh. Conceptualization, investigation, writing – original draft, review and editing, coordination: Mohammad Zarei.
Supporting information
FIGURE S1
TABLE S1
TABLE S2
TABLE S3
ACKNOWLEDGEMENT
None.
Jafari M, Pormohammad A, Sheikh Neshin SA, et al. Clinical characteristics and outcomes of pregnant women with COVID‐19 and comparison with control patients: A systematic review and meta‐analysis. Rev Med Virol. 2021;31(5):e2208. doi: 10.1002/rmv.2208
References
- 1. Pal M, Berhanu G, Desalegn C, Kandi V. Severe acute respiratory syndrome coronavirus‐2 (SARS‐CoV‐2): an update [Internet]. Cureus. /pmc/articles/PMC7182166/?report=abstract [DOI] [PMC free article] [PubMed]
- 2. Tian HY. [2019‐nCoV: new challenges from coronavirus]. Zhonghua Yu Fang Yi Xue Za Zhi. 2020;54(0):E001. [DOI] [PubMed] [Google Scholar]
- 3. Lu R, Zhao X, Li J, et al. Genomic characterisation and epidemiology of 2019 novel coronavirus: implications for virus origins and receptor binding [Internet]. Lancet (Lond). 2020;395(10224), 565–574. https://europepmc.org/articles/PMC7159086. [DOI] [PMC free article] [PubMed] [Google Scholar]
- 4. Goodnight WH, Soper DE. Pneumonia in pregnancy. Crit Care Med. 2005;33(10 Suppl):S390‐S397. [DOI] [PubMed] [Google Scholar]
- 5. Qiao J. What are the risks of COVID‐19 infection in pregnant women? [Internet]. Lancet. 2020;395(10226):760‐762. https://pubmed.ncbi.nlm.nih.gov/32151334. [DOI] [PMC free article] [PubMed] [Google Scholar]
- 6. Kourtis AP, Read JS, Jamieson DJ. Pregnancy and infection. N Engl J Med. 2014;370(23):2211‐2218. https://pubmed.ncbi.nlm.nih.gov/24897084. [DOI] [PMC free article] [PubMed] [Google Scholar]
- 7. Nunes MC, Aqil AR, Omer SB, Madhi SA. The effects of influenza vaccination during pregnancy on birth outcomes: a systematic review and meta‐analysis. Am J Perinatol. 2016;33(11):1104‐1114. [DOI] [PubMed] [Google Scholar]
- 8. Branch DW. Physiologic adaptations of pregnancy. Am J Reprod Immunol. 1992;28(3–4):120‐122. [DOI] [PubMed] [Google Scholar]
- 9. Baley JE, Schacter BZ. Mechanisms of diminished natural killer cell activity in pregnant women and neonates. J Immunol. 1985;134(5):3042‐3048. [PubMed] [Google Scholar]
- 10. Clarke AG, Kendall MD. The thymus in pregnancy: the interplay of neural, endocrine and immune influences [Internet]. Immunol Today. 1994;15(11):545–552. http://www.sciencedirect.com/science/article/pii/0167569994902127. [DOI] [PubMed] [Google Scholar]
- 11. Lederman MM. Cell‐mediated immunity and pregnancy. Chest. 1984;86(3 Suppl):6S‐9S. [DOI] [PubMed] [Google Scholar]
- 12. Salmon B, Bruick Sorge C. Pneumonia in pregnant women: exploring this high risk complication& its links to preterm labor [Internet]. AWHONN Lifelines. 2003;7(1):48‐52. http://www.sciencedirect.com/science/article/pii/S1091592315307950. [DOI] [PubMed] [Google Scholar]
- 13. Schwartz DA, Graham AL. Potential maternal and infant outcomes from (Wuhan) coronavirus 2019‐nCoV infecting pregnant women: lessons from SARS, MERS, and other human coronavirus infections [Internet]. Viruses. 2020;12(2):194. https://pubmed.ncbi.nlm.nih.gov/32050635. [DOI] [PMC free article] [PubMed] [Google Scholar]
- 14. Lam CM, Wong SF, Leung TN, et al. A case‐controlled study comparing clinical course and outcomes of pregnant and non‐pregnant women with severe acute respiratory syndrome. BJOG An Int J Obstet Gynaecol. 2004;111(8):771‐774. [DOI] [PMC free article] [PubMed] [Google Scholar]
- 15. Zambrano LD, Ellington S, Strid P, et al. Update: characteristics of symptomatic women of reproductive age with laboratory‐confirmed SARS‐CoV‐2 infection by pregnancy status—United States, January 22–October 3, 2020. MMWR Morb Mortal Wkly Rep. 2020;69(44):1641‐1647. [DOI] [PMC free article] [PubMed] [Google Scholar]
- 16. Wong SF, Chow KM, Leung TN, et al. Pregnancy and perinatal outcomes of women with severe acute respiratory syndrome. Am J Obstet Gynecol [Internet]. 2004;191(1):292‐297. https://pubmed.ncbi.nlm.nih.gov/15295381. [DOI] [PMC free article] [PubMed] [Google Scholar]
- 17. Levy A, Yagil Y, Bursztyn M, Barkalifa R, Scharf S, Yagil C. ACE2 expression and activity are enhanced during pregnancy. Am J Physiol Regul Integr Comp Physiol. 2008;295(6):R1953‐R1961. [DOI] [PubMed] [Google Scholar]
- 18. Khoury R, Bernstein, PS , Debolt, C , et al. Characteristics and outcomes of 241 births to women with severe acute respiratory syndrome coronavirus 2 (SARS‐CoV‐2) infection at five New York City medical centers. Obstet Gynecol. 136(2):273‐282. [DOI] [PubMed] [Google Scholar]
- 19. Allotey J, Stallings E, Bonet M, et al. Clinical manifestations, risk factors, and maternal and perinatal outcomes of coronavirus disease 2019 in pregnancy: living systematic review and meta‐analysis. Br Med J. 2020;370:m3320. [DOI] [PMC free article] [PubMed] [Google Scholar]
- 20. Adhikari EH, Moreno W, Zofkie AC, et al. Pregnancy outcomes among women with and without severe acute respiratory syndrome coronavirus 2 infection [Internet]. JAMA Netw Open. 2020;3(11):e2029256. 10.1001/jamanetworkopen.2020.29256. [DOI] [PMC free article] [PubMed] [Google Scholar]
- 21. de Melo GC, de Araújo KCGM. COVID‐19 infection in pregnant women, preterm delivery, birth weight, and vertical transmission: a systematic review and meta‐analysis. Cad Saude Publica. 2020;36(7):e00087320. [DOI] [PubMed] [Google Scholar]
- 22. Alzamora MC, Paredes T, Caceres D, Webb CM, Valdez LM, La Rosa M. Severe COVID‐19 during pregnancy and possible vertical transmission. Am J Perinatol. 2020;37(8):861‐865. [DOI] [PMC free article] [PubMed] [Google Scholar]
- 23. Blumberg DA, Underwood MA, Hedriana HL, Lakshminrusimha S. Vertical transmission of SARS‐CoV‐2: what is the optimal definition? Am J Perinatol. 2020;37(8):769. [DOI] [PMC free article] [PubMed] [Google Scholar]
- 24. Zeng L, Xia S, Yuan W, et al. Neonatal early‐onset infection with SARS‐CoV‐2 in 33 neonates born to mothers with COVID‐19 in Wuhan, China. JAMA Pediatr. 2020;174(7):722–725. https://jamanetwork.com/journals/jamapediatrics/fullarticle/2763787. [DOI] [PMC free article] [PubMed] [Google Scholar]
- 25. Fenizia C, Biasin M, Cetin I, et al. Analysis of SARS‐CoV‐2 vertical transmission during pregnancy. Nat Commun [Internet]. 2020;11(1):5128. 10.1038/s41467-020-18933-4. [DOI] [PMC free article] [PubMed] [Google Scholar]
- 26. Liu H, Wang L‐L, Zhao S‐J, Kwak‐Kim J, Mor G, Liao A‐H. Why are pregnant women susceptible to COVID‐19? An immunological viewpoint. J Reprod Immunol. 2020;139:103122. [DOI] [PMC free article] [PubMed] [Google Scholar]
- 27. Della Gatta, AN , Rizzo, R , Pilu, G , Simonazzi, G . Coronavirus disease 2019 during pregnancy: a systematic review of reported cases. Am J Obstet Gynecol. 2020;223(1):36–41. [DOI] [PMC free article] [PubMed] [Google Scholar]
- 28. Moher D, Liberati A, Tetzlaff J, Altman DG. Preferred reporting items for systematic reviews and meta‐analyses: the PRISMA statement. PLoS Med. 2009;6(7):e1000097. [DOI] [PMC free article] [PubMed] [Google Scholar]
- 29. Munn Z, Aromataris E, Tufanaru C, et al. The development of software to support multiple systematic review types: the Joanna Briggs Institute system for the Unified Management, assessment and review of information (JBI SUMARI). Int J Evid Based Healthc. 2019;17(1):36‐43. [DOI] [PubMed] [Google Scholar]
- 30. Mantel N, Haenszel W. Statistical aspects of the analysis of data from retrospective studies of disease. J Natl Cancer Inst. 1959;22(4):719‐748. [PubMed] [Google Scholar]
- 31. Chen N, Zhou M, Dong X, et al. Epidemiological and clinical characteristics of 99 cases of 2019 novel coronavirus pneumonia in Wuhan, China: a descriptive study. Lancet (Lond). 2020;395(10223):507‐513. [DOI] [PMC free article] [PubMed] [Google Scholar]
- 32. Wang D, Hu B, Hu C, et al. Clinical characteristics of 138 hospitalized patients with 2019 novel coronavirus–infected pneumonia in Wuhan, China. JAMA. 2020;323(11):1061‐1069. [DOI] [PMC free article] [PubMed] [Google Scholar]
- 33. Huang C, Wang Y, Li X, et al. Clinical features of patients infected with 2019 novel coronavirus in Wuhan, China. Lancet (Lond). 2020;395(10223):497‐506. [DOI] [PMC free article] [PubMed] [Google Scholar]
- 34. Guan W, Ni Z, Hu Y, et al. Clinical characteristics of coronavirus disease 2019 in china. N Engl J Med. 2020;382(18):1708–1720. 10.1056/nejmoa2002032. [DOI] [PMC free article] [PubMed] [Google Scholar]
- 35. Zhang J‐J, Dong X, Cao Y‐Y, et al. Clinical characteristics of 140 patients infected with SARS‐CoV‐2 in Wuhan, China. Allergy. 2020;75 (7):1730–1741. 10.1111/all.14238. [DOI] [PubMed] [Google Scholar]
- 36. Cheng Y, Luo R, Wang K, et al. Kidney disease is associated with in‐hospital death of patients with COVID‐19. Kidney Int. 2020;97(5):829–838. 10.1016/j.kint.2020.03.005. [DOI] [PMC free article] [PubMed] [Google Scholar]
- 37. Li Q, Guan X, Wu P, et al. Early transmission dynamics in wuhan, china, of novel coronavirus–infected pneumonia. N Engl J Med. 2020;382(13):1199–1207. 10.1056/nejmoa2001316. [DOI] [PMC free article] [PubMed] [Google Scholar]
- 38. Clinical findings in a group of patients infected with the 2019 novel coronavirus (SARS‐Cov‐2) outside of Wuhan, China: retrospective case series. BMJ. 2020;m792. 10.1136/bmj.m792. [DOI] [PMC free article] [PubMed] [Google Scholar]
- 39. Song F, Shi N, Shan F, et al. Emerging 2019 novel coronavirus (2019‐nCoV) pneumonia. Radiology. 2020;295(1):210–217. 10.1148/radiol.2020200274. [DOI] [PMC free article] [PubMed] [Google Scholar]
- 40. Burke RM, Killerby ME, Newton S, et al. Symptom profiles of a convenience sample of patients with COVID‐19 — united states, January–April 2020. Morb Mortal Wkly Rep. 2020;69(28):904–908. 10.15585/mmwr.mm6928a2. [DOI] [PMC free article] [PubMed] [Google Scholar]
- 41. Matar R, Alrahmani L, Monzer N, et al. Clinical presentation and outcomes of pregnant women with coronavirus disease 2019: A systematic review and meta‐analysis. Clin Infect Dis. 2020;ciaa828 1–13. 10.1093/cid/ciaa828. [DOI] [PMC free article] [PubMed] [Google Scholar]
- 42. Capobianco G, Saderi L, Aliberti S, et al. COVID‐19 in pregnant women: A systematic review and meta‐analysis. Eur J Obstet Gynecol Reprod Biol. 2020;252:543–558. 10.1016/j.ejogrb.2020.07.006. [DOI] [PMC free article] [PubMed] [Google Scholar]
- 43. Romero R, Gómez R, Chaiworapongsa T, et al. The role of infection in preterm labour and delivery. Paediatr Perinat Epidemiol. 2001;15 (s2):41–56. 10.1046/j.1365-3016.2001.00007.x. [DOI] [PubMed] [Google Scholar]
- 44. Poston L, Harthoorn LF, van der Beek EM. Obesity in Pregnancy: Implications for the mother and lifelong health of the child. A consensus statement. Pediatr Res. 2011;69(2):175–180. 10.1203/pdr.0b013e3182055ede. [DOI] [PubMed] [Google Scholar]
- 45. Tamara A, Tahapary DL. Obesity as a predictor for a poor prognosis of COVID‐19: A systematic review. Diabetes Metab Syndr Clin Res Rev. 2020;14(4):655–659. 10.1016/j.dsx.2020.05.020. [DOI] [PMC free article] [PubMed] [Google Scholar]
- 46. Ellington S, Strid P, Tong VT, et al. Characteristics of women of reproductive age with laboratory‐confirmed SARS‐CoV‐2 infection by pregnancy status — united states, January 22–June 7, 2020. Morb Mortal Wkly Rep. 2020;69(25):769–775. 10.15585/mmwr.mm6925a1. [DOI] [PMC free article] [PubMed] [Google Scholar]
- 47. Liu H, Liu F, Li J, et al. Clinical and CT imaging features of the COVID‐19 pneumonia: Focus on pregnant women and children. J Infect. 2020;80 (5):e7–e13. 10.1016/j.jinf.2020.03.007. [DOI] [PMC free article] [PubMed] [Google Scholar]
- 48. Zhang Z‐L, Hou Y‐L, Li D‐T, Li F‐Z. Laboratory findings of COVID‐19: a systematic review and meta‐analysis. Scand J Clin Lab Invest. 2020;80(6):441–447. 10.1080/00365513.2020.1768587. [DOI] [PMC free article] [PubMed] [Google Scholar]
- 49. Xie Y, Wang Z, Liao H, et al. Epidemiologic, clinical, and laboratory findings of the COVID‐19 in the current pandemic: systematic review and meta‐analysis. BMC Infect Dis. 2020;20(1):640. 10.1186/s12879-020-05371-2. [DOI] [PMC free article] [PubMed] [Google Scholar]
- 50. Wang Z, Wang Z, Xiong G. Clinical characteristics and laboratory results of pregnant women with COVID‐19 in Wuhan, China. Int J Gynecol Obstet. 2020;150(3):312–317. 10.1002/ijgo.13265. [DOI] [PMC free article] [PubMed] [Google Scholar]
- 51. Chandra S, Tripathi AK, Mishra S, Amzarul M, Vaish AK. Physiological changes in hematological parameters during pregnancy. Indian J Hematol Blood Transfus. 2012;28(3):144–146. 10.1007/s12288-012-0175-6. [DOI] [PMC free article] [PubMed] [Google Scholar]
- 52. Szpakowski M, Nowak M, Oszukowski P, Wieczorek A, Skotnicka A. C‐reactive protein in normal pregnancy. Ginekol Pol. 1996;67(1):17–20. 10.1093/cid/ciaa828. [DOI] [PubMed] [Google Scholar]
- 53. Sorci G, Faivre B, Morand S. Explaining among‐country variation in COVID‐19 case fatality rate. Scientific Reports. 2020;10(1):18909. 10.1038/s41598-020-75848-2. [DOI] [PMC free article] [PubMed] [Google Scholar]
- 54. Maxwell C, McGeer A, Tai KFY, Sermer M. No. 225‐Management guidelines for obstetric patients and neonates born to mothers with suspected or probable severe acute respiratory syndrome (SARS). J Obstet Gynaecol Canada. 2017;39(8):e130–e137. 10.1016/j.jogc.2017.04.024. [DOI] [PMC free article] [PubMed] [Google Scholar]
- 55. Mullins E, Evans D, Viner RM, O'Brien P, Morris E. Coronavirus in pregnancy and delivery: rapid review. Ultrasound Obstet Gynecol. 2020;55(5):586–592. 10.1002/uog.22014. [DOI] [PubMed] [Google Scholar]
- 56. Goffman D, Madden RC, Harrison EA, Merkatz IR, Chazotte C. Predictors of maternal mortality and near‐miss maternal morbidity. J Perinatol. 2007;27(10):597–601. 10.1038/sj.jp.7211810. [DOI] [PubMed] [Google Scholar]
- 57. Chen H, Guo J, Wang C, et al. Clinical characteristics and intrauterine vertical transmission potential of COVID‐19 infection in nine pregnant women: a retrospective review of medical records. The Lancet. 2020;395(10226):809–815. 10.1016/s0140-6736(20)30360-3. [DOI] [PMC free article] [PubMed] [Google Scholar]
- 58. Zhu H, Wang L, Fang C, et al. Clinical analysis of 10 neonates born to mothers with 2019‐nCoV pneumonia. Transl Pediatr. 2020;9(1):51–60. 10.21037/tp.2020.02.06. [DOI] [PMC free article] [PubMed] [Google Scholar]
- 59. Yan J, Guo J, Fan C, et al. Coronavirus disease 2019 in pregnant women: a report based on 116 cases. Am J Obstet Gynecol. 2020;223(1):111.e1–111.e14. 10.1016/j.ajog.2020.04.014. [DOI] [PMC free article] [PubMed] [Google Scholar]
- 60. Dong L, Tian J, He S, et al. Possible Vertical Transmission of SARS‐CoV‐2 From an Infected Mother to Her Newborn. JAMA. 2020;323(18):1846–1848. 10.1001/jama.2020.4621. [DOI] [PMC free article] [PubMed] [Google Scholar]
- 61. Zeng H, Xu C, Fan J, et al. Antibodies in infants born to mothers with COVID‐19 pneumonia. JAMA. 2020;323(18):1848–1849. 10.1001/jama.2020.4861. [DOI] [PMC free article] [PubMed] [Google Scholar]
- 62. Kotlyar AM, Grechukhina O, Chen A, et al. Vertical transmission of coronavirus disease 2019: a systematic review and meta‐analysis. AJOG. 2020;S0002‐9378(20):30823‐1. https://www.ajog.org/article/S0002-9378(20)30823-1/fulltext. [DOI] [PMC free article] [PubMed] [Google Scholar]
- 63. Li M, Chen L, Zhang J, Xiong C, Li X. The SARS‐CoV‐2 receptor ACE2 expression of maternal‐fetal interface and fetal organs by single‐cell transcriptome study [Internet]. PLoS One. 2020;15(4):e0230295. https://pubmed.ncbi.nlm.nih.gov/32298273. [DOI] [PMC free article] [PubMed] [Google Scholar]
- 64. Walker KF, O’Donoghue K, Grace N, et al. Maternal transmission of SARS‐COV‐2 to the neonate, and possible routes for such transmission: a systematic review and critical analysis [Internet]. BJOG. 2020;127(11):1324‐1336. https://pubmed.ncbi.nlm.nih.gov/32531146. [DOI] [PMC free article] [PubMed] [Google Scholar]
Associated Data
This section collects any data citations, data availability statements, or supplementary materials included in this article.
Supplementary Materials
FIGURE S1
TABLE S1
TABLE S2
TABLE S3