Abstract
Demand for big-data scientists continues to escalate driving a pressing need for new graduates to be more fluent in the big-data skills needed by employers. If a gap exists between the educational knowledge held by graduates and big data workplace skills needed to produce results, workers will be unable to address the big data needs of employers.
This survey explores big-data skills in the classroom and those required in the workplace to determine if a skills gap exists for big-data scientists. In this work, data was collected using a national survey of healthcare professionals. Participant responses were analyzed to inform curriculum development, providing valuable information for academics and the industry leaders who hire new data talent.
Keywords: Big data, analytics, theory-practice gap, data science, Hadoop, Spark, nonrelational healthcare, curriculum, SQL
Introduction
The use of big-data tools has grown substantially with larger organizations having the highest adoption rates.1 Although the number of companies using big-data analytics is increasing rapidly, the biggest barrier to adoption of big data technologies is the persistent shortage of data scientists.2, 3
Data sciences jobs are now one of the top five emerging jobs in the United States.4, 5 A 2019 search of job boards showed there were 87,756 vacancies in the United States with 36,608 paying over $95,000 per year.6 Unfortunately, many job postings are not filled because the demand for data scientists far exceeds the supply, a trend that is predicted to continue.7
One factor affecting worker availability is that it takes many years to become a data scientist. Most U.S. data scientists agree that it takes on average 4.9 years.8 Data scientists must learn multiple programming and database languages and master advanced statistical analysis. Academics institutes struggle to deliver the data science curricular components due the costs associated with providing the hardware, software, and human capital for these courses.9 In addition, universities may have difficulty hiring knowledgeable professors who will teach these classes. Most professors lack the data science teaching skills, and few institutes have the budget for faculty training at this level.10 In the end, hiring for data science faculty is financially problematic because educational institutes are competing with companies who can offer higher salaries and better benefits.
Optimally if academia is doing a good job of educating and training, graduate new hires in data science should have a minimal learning curve. There is however a growing concern that data science graduates face a theory-practice gap when they are hired.11 The purpose of this paper is to 1.) explore the classroom to workplace skills gap for big data scientists using theory-practice gap, 2.) examine big data workplace needs, and 3.) propose resources for curriculum building to better prepare students for the workplace, closing the gap.
Background
Big data is defined as “high-volume, high-velocity and/or high-variety information assets that demand cost-effective, innovative forms of information processing that enable enhanced insight, decision making, and process automation.”12 Thus, the Four Vs of big data are, volume, variety, velocity, and veracity.13 Currently, volumes are measured in terabytes (1012) however this limit is expected to increase as storage capacities increase and cost decline. It is estimated that 43 trillion gigabytes of data are created each day. Data velocity can range from slow batch processes to lightning fast real-time stream analysis - the choice of which depends on the users' needs. Stream processing is beneficial for updating reports and metrics, but historically batch processing has provided more detailed analyses of the data. Batch processing jobs analyze the data all at once, they may run for a few minutes to several hours. A typical batch process runs at night at a set time to analyze all patient account charges for that day. Conversely, stream processing handles real-time data streams in less than a second, supporting real-time analytics.14 Data streams can be processed with Apache Storm software or Amazon Web Service. Streams of real-time data could come from medical healthcare monitors, mobile devices, web applications, software log files, or social media streams.
Big data comes from many sources. Sources could include healthcare activities (151 billion gigabytes), wearable health monitors (420 million), data from 6 billion cell phones or from 4 billion hours of data YouTube videos.15, 16 Big data can be structured, semi-structured, or unstructured. Structured data occurs in patient and administrative medical records. Unstructured data sources comprise emails, mobile devices, digitized radiology images, smart healthcare sensors on connected devices, Facebook posts, Twitter feeds, audio files and encrypted data from business activities. For reference, Facebook users upload over 900 million pictures a day.17
Big data analysis requires special tools. The largest provider of free open software for big data development is the Apache Software Foundation (ASF).18 In particular, the ASF Hadoop project develops distributed processing software.19 Hadoop is used by an amazing number of companies including Amazon, Adobe, eBay, Google, IBM, LinkedIn, Twitter, The New York Times and Yahoo.20 Hadoop encompasses a huge software library which includes Hadoop Distributed File System (HDFS) and the Hadoop Map Reduce tools (Hive and Pig).21 Because of the volume of big data users, the expanded software library and complexity of using Hadoop, data scientist require hands on training.
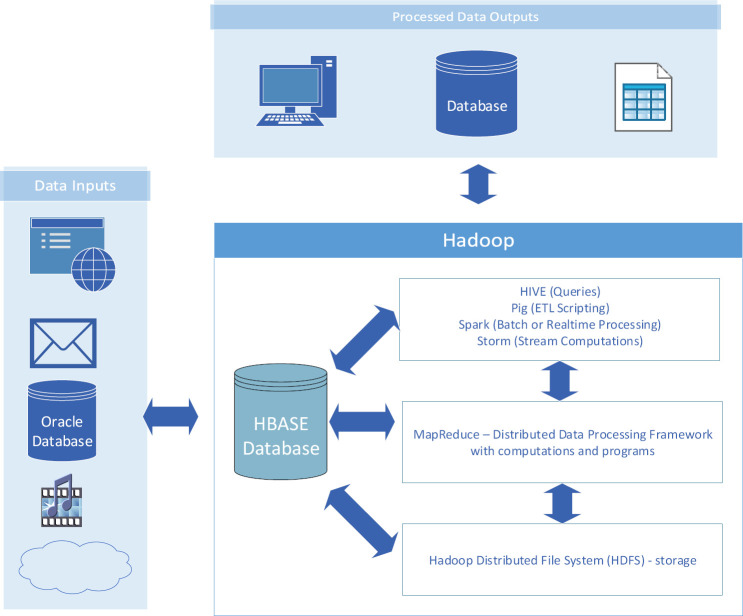
The complex operating environment of Hadoop provides support tools. Map Reduce applications work on the HDFS, consisting of map tasks, that work separately on data files, and reduce the number of tasks that combine and analyze map data.22 Pig is a MapReduce data scripting language for extracting, transforming, and loading data into data stores. Hive is an SQL query language for use with HDFS and HBase data warehouses. Figure 1 shows the relationships between Data Inputs, Hadoop and Processed Data Outputs.
Figure 1.
Hadoop Processing
Other related Hadoop software such as Spark and Storm, support big data processing. Spark provides large scale batch and real-time data processing of Hadoop data, machine learning and stream processes. Storm speeds real-time computational processing. Also, there are several ASF NOSQL databases, such as Cassandra, HBase, and CouchDB. Cassandra is a high performance non-relational database that provides excellent data replication with no single point of failure and no downtime. Cassandra is in use at Apple, eBay, GitHub, Hulu, Instagram, Netflix and the Weather Channel23 Apache HBase is also used with HDFS, providing real-time read and write of very large tables. If you need a web friendly document database, CouchDB works well with HTTP, JavaScript Object Notation (JSON), MapReduce and mobile applications. CouchDB has large deployments at IBM, Grubhub, and the UnitedHealth Group. Given the large number of big data tools, the complexity of the big data platform and the large number of corporations utilizing these tools, it is easy to see how extensive skills are required to function in the big data environment. Alignment between education and industry is required to provide new hires able to practice big-data skills.
Conceptual Framework
The framework for this paper is the conceptualization of a theory-practice gap between the academic knowledge (the theory) and the hands-on application of that knowledge in the work environment (the practice).24 The theoretical consideration of a theory practice gap is persistent and has been a topic of interest in many fields.25-27
For example in healthcare, the inability to apply evidence-based research to the practice of injury prevention demonstrated a theory-practice gap.28 In the education field, a theory-practice gap was cited when student teachers' felt unprepared for their teaching internships.29 Similarly, student nurses in a graduate program reported their clinical supervisors' administration of intramuscular injections was inconsistent with the techniques learned in their classes attributable to a theory-practice gap.30 This divergence from learned practice confused them about the correct methodology for injections. Engineering students reported problems when implementing telecommunication wireless standards, which is a common engineering task. The telecom standards had complex and cryptic implementation documentation which was unfamiliar to students leading to a theory-practice gap.31
Focusing on the healthcare workplace, we found few studies considering the theory-practice gap and guidance related to curriculum development. However, it is important for educators to prepare students to apply the workplace skills, tools and technologies most commonly used by healthcare employers. This is the first step in reducing the theory-practice gap.32, 33
Research Questions
Given the number of required skills and knowledge needed to operate in the big data environment and the reports of theory and practice gaps in the workplace, the following big data research questions were developed:
What is the overall usage level of big data tools in industry and academia?
Which skills are needed for big data analysis in the workplace and by educators?
What database skills are used by industry and in academia?
What data science tools used in the workplace and by educators?
We developed a methodology to explore these research questions using a survey of industry professionals and educators.
Methodology
The aim of this study was to identify if a theory practice gap existed in the healthcare big data environment. The study originated at a large university in the southern United States after an Internal Review Board approval process. A survey was created by the researchers to measure the desired variables and data were collected during the summer and fall of 2018. After cleaning the survey data an analysis took place using SPSS 25. Demographics and descriptive statistics were then generated from respondent data.
Participants
The researchers obtained approval from the American Health Information Management Association (AHIMA) to survey their professional members. AHIMA assisted with the study by providing the email link to the survey to their professional members. Specifically, the link was emailed to members having job titles that reflected potential knowledge of big data skills, tools, and technologies usage. Survey respondents who failed to complete the entire survey were excluded from analysis, leaving a total of 492 participants' responses that were analyzed.
Instrument
The survey was designed to determine perceptions of big data skills and the frequency of use. Appendix 1 provides the questions used in this measure. The survey used Likert scale questions with responses ranging from very frequently to never. Other questions asked participants how frequently they used big data skills, what types of relational and non-relational databases were used, what statistical and data visualization software they used or planned to use in the future. Response data were split into two groups—Educator and Workplace (i.e. all non-educator professional responses). Both groups were analyzed in SPSS to determine the frequency and percentages of the usage of big data skill, tools, and technologies and the gap between workplace and educators was examined. Demographic questions on participant's education level, years of healthcare education experience, job level, job setting, and work role were analyzed.
Results
Demographics
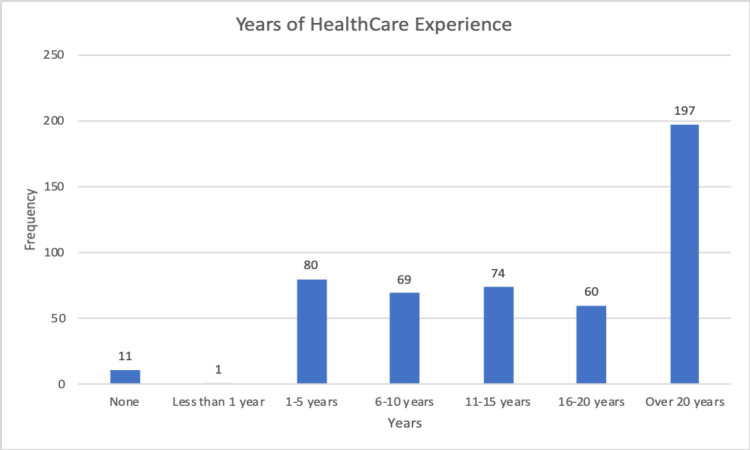
There were 492 respondents in the study providing a good range of responses. The educational levels reported were master's degree (67 percent), doctorate (13 percent), baccalaureate (12 percent), and associate degrees (8 percent). The years of healthcare education experience varied, responses included none (n=11), less than 1 year (n=1), 1-5 years (n=80), 6-10 years (n=69), 11-5 years (n=74), 16-20 years (n=60), and over 20 years (n=197). Figure 2 charts the respondent's years of healthcare experience.
Figure 1.
Years of Healthcare Experience
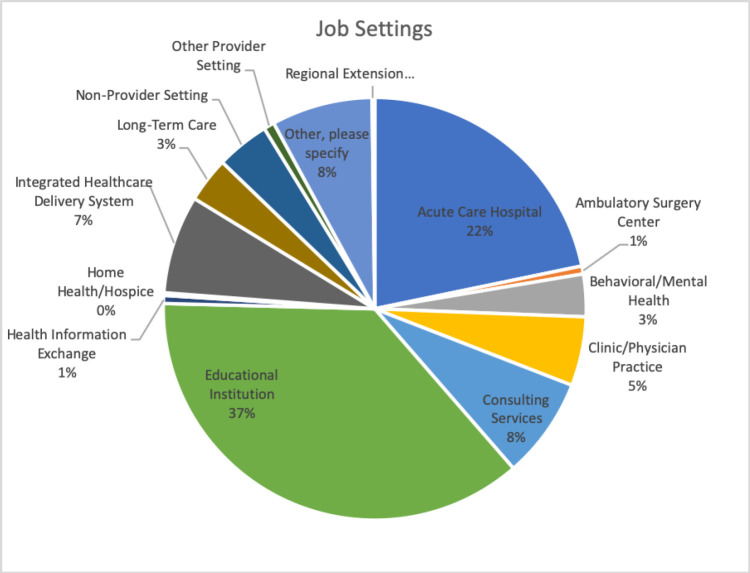
Respondents were typically employed in acute-care hospitals (22 percent), clinic/physician practices (5 percent), consulting services (8 percent), or integrated healthcare delivery systems (7 percent).
Figure 3: Job Settings of Respondents
Participant job settings are displayed in Figure 3 Educators made up the greatest number of respondents at 37 percent. Table 1 list the Job Setting, Count and Percentage of respondents.
Figure 1.
Job Settings of Respondents
Table 1.
Respondent's Job Setting
| Job Settings (n=492) | Count | Percent |
|---|---|---|
| Acute Care Hospital | 107 | 21.7 |
| Ambulatory Surgery Center | 3 | 0.6 |
| Behavioral/Mental Health | 16 | 3.3 |
| Clinic/Physician Practice | 26 | 5.3 |
| Consulting Services | 38 | 7.7 |
| Educational Institution | 181 | 36.8 |
| Health Information Exchange | 3 | 0.6 |
| Home Health/Hospice | 1 | 0.2 |
| Integrated Healthcare Delivery System | 37 | 7.5 |
| Non-Provider Setting | 20 | 4.1 |
| Other Provider Settings | 4 | 0.8 |
We also collected information about respondents' Job Level in order to classify whether they were working in industry or academia. The job levels were predominantly Educator (39.2 percent), Director (19.2 percent), or Manager/Supervisor (19.4 percent). Other job levels denoted were clinician, consultant, executive/president/vice president, and technology role.
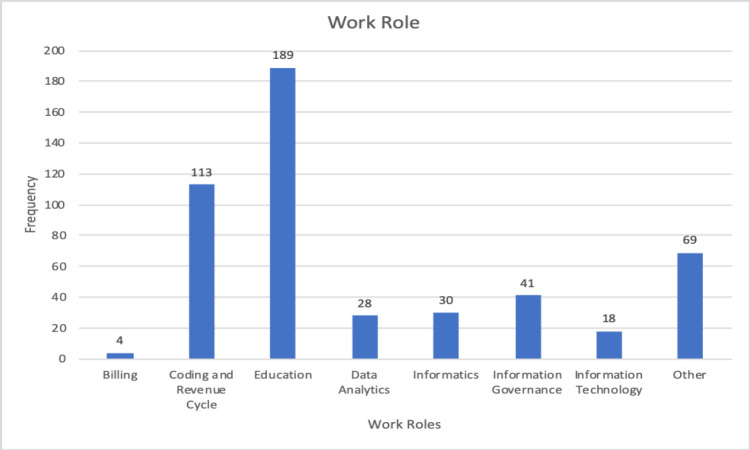
The primary work roles were Education (n=189) and Coding and Revenue Cycle (n=113). To divide the data based on education and workplace, we considered job settings. Those classified as educators, versus workplace respondents who designated non-educational job settings. Workplace respondents (63 percent) outnumbered educators (37 percent) nearly two to one.
Figure 4: Respondent's Work Role
Current Level of Usage
Participants were first asked about the current level of big data analytics usage in their organization. Respondents rated the level of overall big data technology usage as Very frequently (daily), Frequently (1-2 times a week), Occasionally (a few times a month), Rarely (a few times every three months (i.e., every quarter), and Never (not used at all). Twenty four percent of all respondents had high usage levels, which we defined as very frequent use.
Frequency of Use
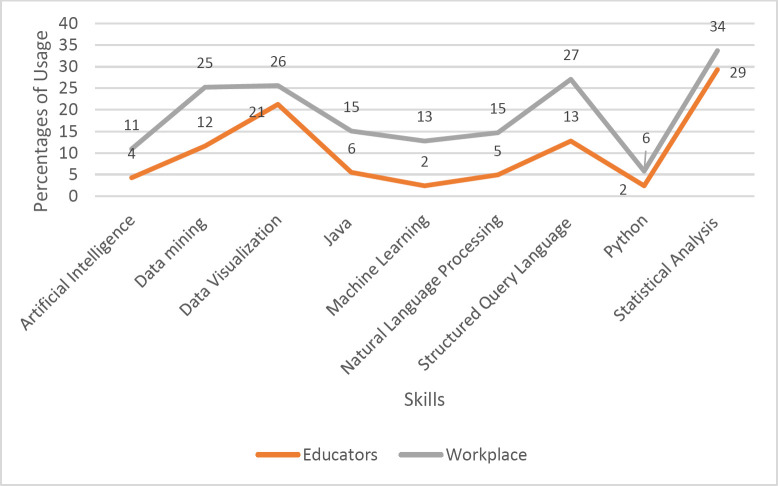
Next, participants were asked about how frequently big data skills were used at their organization. These skills included artificial intelligence, data mining, data visualization, java, machine learning, natural language processing, structured query language, python, and statistical analysis. Considering the most commonly used workplace skills shows a distinct gap between educators and workplace percentages of use. Figure 5presents big data skill.
Figure 1.
Big Data Skills
Across the board, workplace usage exceeded education: artificial intelligence (Workplace 10.9 percent, Educators 4.3 percent), data mining (Workplace 25.2 percent, Educators 11.6 percent), data visualization (Workplace 25.6 percent, Educators 21.3 percent), java, (Workplace 15.1 percent, Educators 5.5 percent), machine learning (Workplace 12.8 percent, Educators 2.4 percent), natural language processing (Workplace 14.7 percent, Educators 4.9 percent), structured query language (Workplace 27.1 percent, Educators 12.8 percent), python (Workplace 5.8 percent, Educators 2.4 percent), statistical analysis (Workplace 33.7 percent, Educators 29.3 percent.
In terms of the skills gap, Table 2 list the differences between the Workplace and Educators.
Table 2.
Respondent's Job Level
| Job Levels (n=490) Characteristic | Number | Percentage |
|---|---|---|
| Clinician | 13 | 2.7 |
| Consultant | 47 | 9.6 |
| Director | 94 | 19.2 |
| Educator | 192 | 39.2 |
| Executive/President/Vice President | 22 | 4.5 |
| Technology Role | 27 | 5.5 |
| Manager/Supervisor | 95 | 19.4 |
Relational Database Skills
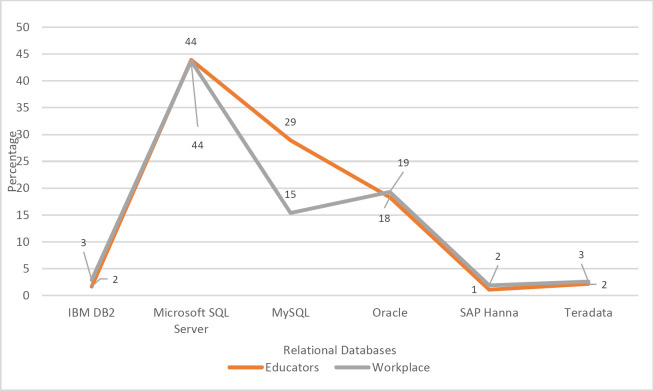
Next, we considered which relational databases were very frequently used. The relational databases included IBM DB2, Microsoft SQL Server, MySQL, Oracle database, SAP HANA, Teradata and other. Figure 6 displays relational databases skills reported as very frequently used. These included IBM DB2 (Workplace 2.9 percent, Educators 1.7 percent), Microsoft SQL Server (Workplace 43.7 percent, Educators 43.9 percent), MySQL (Workplace 15.4 percent, Educators 28.9 percent,) or Oracle (Workplace 19.3 percent, Educators 18.3 percent), SAP HANA (Workplace 1.9 percent, Educators 1.1 percent), and Teradata (Workplace 2.6 percent, Educators 2.2 percent). Figure 6 shows relational database skill differences between the workplace and educators.
Figure 1.
Relational Database Skill Differences
Here the workplace and educator usage are similar for all relational databases, except for the much larger levels for MySQL among Educators. Table 3 shows the difference in percentage reporting frequent use by relational database.
Table 3.
Relational Database Usage Difference
| Relational Database | Difference |
|---|---|
| MySQL | 14 percent |
| IBM DB2 | 1 percent |
| Oracle | 1 percent |
| SAP HANA | 1 percent |
| Teradata | 0.4 percent |
| Microsoft SQL Server | 0.2 percent |
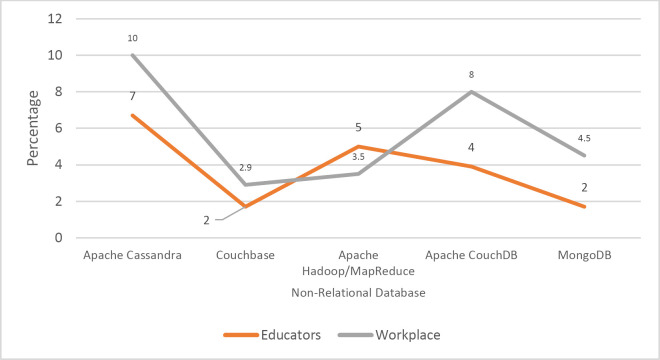
Nonrelational databases are used in big-data environments. Figure 7 displays non-relational, databases skills with high usage. The most commonly used nonrelational databases were: Apache Cassandra (Workplace 10.0 percent, Educators 6.7 percent), Couchbase (Workplace 2.9 percent, Educators 1.7 percent), Apache Hadoop (Workplace 5.0 percent, Educators 3.5 percent), and Apache CouchDB (Workplace 8.0 percent, Educators 3.9 percent).
Figure 1.
Non-Relational Database Usage
Here the workplace and educator use are similar, with the exception that educators having higher use of Apache Hadoop/MapReduce and lower usage of the remaining listed databases. Table 4 shows the differences between Workplace and Educators for nonrelational databases.
Table 4.
Non-Relational Database Usage Difference
| Non-Relational Database | Difference |
|---|---|
| Apache CouchDB | 4 percent |
| Apache Cassandra | 3 percent |
| MongoDB | 3 percent |
| Apache Hadoop/Map Reduce | 2 percent |
| Couchbase | 1 percent |
Data Science Tools
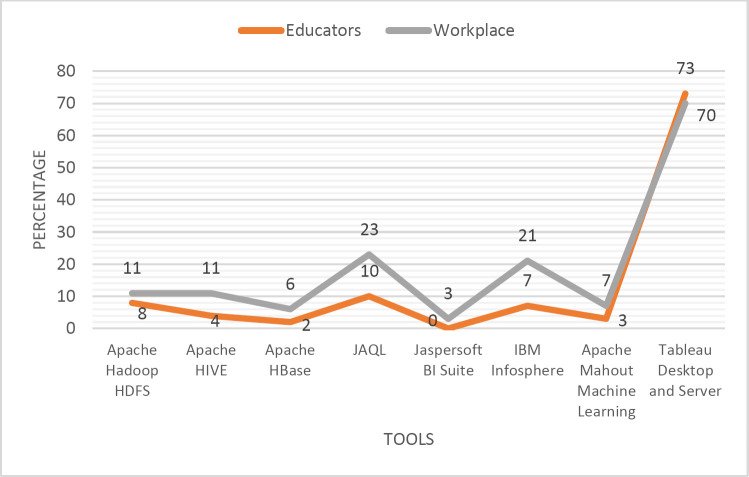
Data analysis is an important function directly tied to big data. Figure 8displays data science tools results. The frequency of use reported for these data science tools were: Apache Hadoop HDFS (Workplace 11 percent, Educators 8 percent), Apache Hive (Workplace 11 percent, Educators 4 percent), Apache HBase (Workplace 6 percent, Educators 2 percent), JAQL (Workplace 23 percent, Educators 10 percent,) Jaspersoft BI Suite (Workplace 3 percent, Educators 0 percent), or IBM Infosphere (Workplace 21 percent, Educators 7 percent),
Figure 1.
Data Science Tools Differences
Apache Mahout Machine Learning (Workplace 7 percent, Educators 3 percent) and the most frequently used Tableau Desktop and Server (Workplace 70 percent, Educators 73 percent). The differences between the Workplace and Educators is detailed in Table 5.
Table 5.
Data Science Tool Usage Differences
| Data Science Tools | Difference |
|---|---|
| IBM Infosphere | 14 percent |
| JAQL | 13 percent |
| Apache Hive | 7 percent |
| Apache HBase | 4 percent |
| Apache Mahout Machine Learning | 4 percent |
| Apache Hadoop HDFS | 3 percent |
| Jaspersoft BI Suite | 3 percent |
| Tableau Desktop and Server | 3 percent |
Here the Workplace and Educator use are lower, except for Tableau software. Table 5 shows the percent difference between Workplace and Educators with regard to data science tools.
Statistical Tools
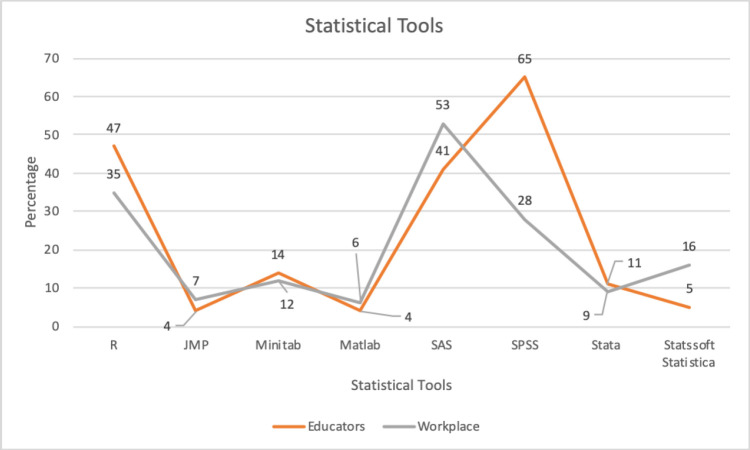
Statistical tools provide needed data transformation and analysis. Expertise in statistical analysis is required of data scientist dealing with big data. Figure 9 displays the frequency of use of statistical tools with R (Workplace 35 percent, Educators 47 percent), JMP (Workplace 35 percent, Educators 41 percent), Minitab (Workplace 12 percent, Educators 14 percent), Matlab (Workplace 6 percent, Educators 4 percent), SAS (Workplace 53 percent, Educators 41 percent), SPSS (Workplace 28 percent, Educators 65 percent), Stata (Workplace 9 percent, Educators 11 percent), and Statssoft Statistica (Workplace 16 percent, Educators 16 percent). Table 6 shows the percent difference between Workplace and Educators.
Figure 1.
Statistical Tool Usage Differences
Table 6.
Respondent's Statistical Tool Differences
| Statistical Tool | Difference |
|---|---|
| SPSS | 37 percent |
| R Statistical Software | 12 percent |
| SAS | 12 percent |
| JMP | 6 percent |
| Minitab | 2 percent |
| Matlab | 2 percent |
| Stata | 2 percent |
| Statssoft Statistica | 0 percent |
Data Mining and Analysis
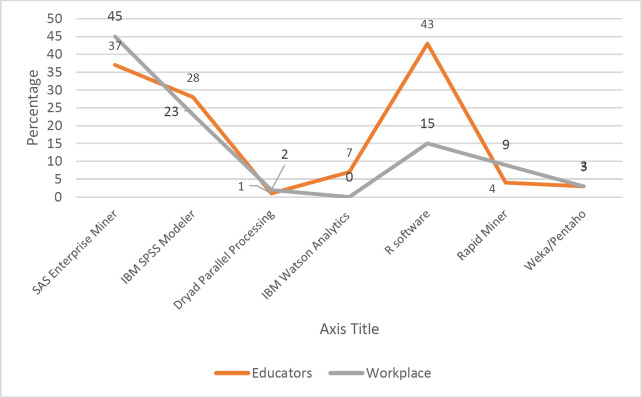
Big data provides an opportunity to dig into data and perform analyses. Figure 10 presents data mining and analysis tools.
Figure 1.
Data Mining Tools Usage
Figure 10: Data Mining Tools Usage
The most commonly used were: SAS Enterprise Miner (Workplace 45 percent, Educators 37 percent,), IBM SPSS Modeler (Workplace 23 percent, Educators 28 percent), Dryad Parallel Processing (Workplace 1 percent, Educators 2 percent), IBM Watson Analytics (Workplace 7 percent, Educators 0 percent), R Software (Workplace 15 percent, Educators 43 percent), Rapid Miner (Workplace 9 percent, Educators 4 percent) and Weka/Pentaho (Workplace 0 percent, Educators 3 percent). Table 7 shows the data mining and analysis tools differences.
Table 7.
Data Mining Tools Differences
| Data Mining Tools | Difference |
|---|---|
| R Software | 28 percent |
| SAS Enterprise Miner | 8 percent |
| IBM Watson Analytics | 7 percent |
| IBM SPSS Modeler | 5 percent |
| Rapid Miner | 5 percent |
| Weka/Pentaho | 3 percent |
| Dryad Parallel Processing | 1 percent |
Data Visualization
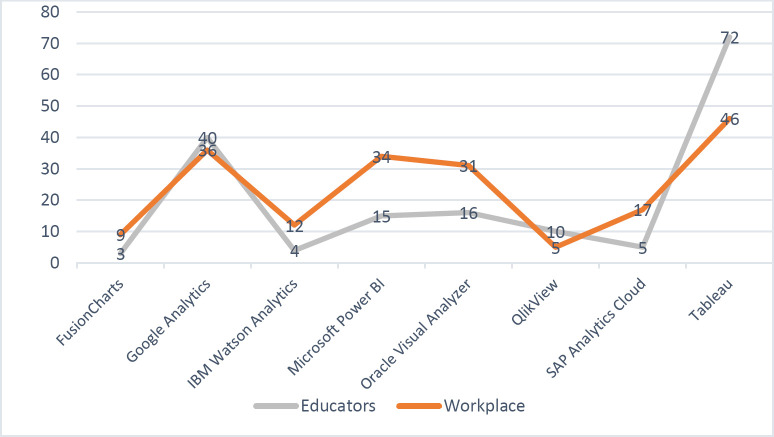
To extract meaning from big data, many data scientist use data visualization tools. Figure 11 shows the frequency of data visualization tools.
Figure 1.
Data Visualization Tool Usage
The tools included Fusion Charts (Workplace 9 percent, Educators 3 percent), Google Analytics (Workplace 36 percent, Educators 40 percent), IBM Watson Analytics (Workplace 12 percent, Educators 4 percent), Microsoft Power BI (Workplace 34 percent, Educators 15 percent), Oracle Visual Analyzer (Workplace 31 percent, Educators 16 percent), QlikView (Workplace 5 percent, Educators 10 percent), SAP Analytics Cloud (Workplace 17 percent, Educators 5 percent), Tableau (Workplace 46 percent, Educators 72 percent) shown in Table 7.
| Data Visualization Tools | Difference |
|---|---|
| Tableau | 26 percent |
| Microsoft Power BI | 19 percent |
| Oracle Visual Analyzer | 15 percent |
| SAP Analytics Cloud | 12 percent |
| IBM Watson Analytics | 8 percent |
| FusionCharts | 6 percent |
| QlickView | 5 percent |
| Google Analytics | 4 percent |
Discussion
To close the theory-practice gap, educators work to produce more data scientists with the workplace skills needed by industry. This theory-practice gap study informs healthcare educator's capacity building for big-data education to maximize their limited human and financial capital. Interestingly, we discovered that the theory-practice gap can be forged in one of two ways. Either Workplace use can be ahead of Educator use or the reverse situation may exist where Educator use is ahead of Workplace use. In either case, better alignment might equate to better qualified new data scientist.
Overall, results of this study showed higher Workplace use of big data and data science tools. In four of the seven big-data tools examined - Data Analytics, Non-Relational Database, Data Science Tools, and Data Visualization Tools, industry perceptions of usage exceed academic perceptions of usage. This is not surprising given the utility and newness of big-data tools and the perception of strategic advantage achievable with large data sets. Skills across the board are more highly regarded in industry and a gap does exist with relation to education. An average eight and half percent skills difference gap exists across the board for Artificial Intelligence, Data Mining, Data Visualization, Java, Machine Learning, Natural Language Processing, Structured Query Language, Python and Statistical Analysis skills with industry ahead of academia.
Not surprisingly, perceptions of Relational Database skills are very similar between workplace and educators. For IBM DB2, only a 1.2 percent difference exists and this is similar with Microsoft SQL Server, Oracle, SAP HANA and Teradata. The major difference is MySQL showing a 13.5 percent gap with academia far ahead of industry. One reason for this might be low cost and greater adoption by educators looking for inexpensive technical solutions for the classroom.
Non-relational database skills are newer than relational database skills and in this case the workplace is more advanced than education. For all non-relational database tools except Apache Hadoop/MapReduce, industry perceives greater usage than education. With regard to Apache Hadoop/MapReduce use, educators are 1.5 percent ahead of the workplace.
Perceived usage of data science tools in the workplace is greater than educator's perceptions but not by a lot. On average there is only a 6.4 percent difference with IBM Infosphere being the greatest difference at 14 percent. Still the frequency of use is relatively low for all data science tools except Tableau which is used by 73 percent of educator and 70 percent of industry respondents. These numbers indicate close alignment between industry and academia.
With regard to Statistical Tool usage, education seems to be ahead of industry usage. On average there is a 9.1 percent difference with education scoring higher in percent of use for R, SPSS and STATA. Industry has an edge in use of SAS. Given that R is a free statistical tool, we thought that usage in academia would be greater than industry and this is the case, however SPSS is used more in education in spite of its costs. Schools do get a price break which might be driving usage but there is a 37 percent gap for SPSS and only an 8 percent gap for R. Possibly R is gaining ground in industry as a standard because of its compatibility to Python and large library of free code. Interestingly, SAS is the strongest of the statistical tools in the workplace with 53 percent reporting usage.
There are a number of quality data mining tools and in our survey and there appears to be greater usage in academia than industry. The use of R software for data mining purposes is high in education at 43 percent but only 15 percent for industry. Also, IBM SPSS Modeler and IBM Watson are stronger in education however, SAS Enterprise Miner Dryad Parallel Processing and Rapid Miner see more usage in the workplace. There is an obvious gap of 28 percent in R software tool usage in academia.
Data Visualization software has become more available and easier to use with industry a little ahead of education for Fusion Charts, IBM Watson, Microsoft Watson, Oracle Visual Analyzer and SAP Analytics but education is much stronger in the use of Google Analytics and Tableau. Here again these differences may be due to low cost acquisition for schools. Overall there is an average of 11.9 percent difference in data visualization tool usage.
In summary, the largest theory-practice gap exists in the areas of data visualization, statistical tools, big-data skills and data mining tools. Given high educational and industry usage of data visualization and statistical tools, these areas may require greater attention in academia to facilitate alignment as new graduates enter the marketplace.
Limitations
As with all research, there are several limitations. First, there were 492 respondents, but there were more workplace respondents (63 percent) than educators (37 percent). Still the number of respondents in each group provides good insight into perceptions of usage. Second, all respondents were members of a healthcare professional organization, thus a survey of a different population could produce different results. In addition, educators who responded to the survey will naturally focus on technologies available and used in their classes and may not have been aware of the full range of data science tools and technologies at their facility.
Future Studies
Future research should include a wider range of industries to determine big-data technology use. There may be specific tools used in different organizations. Another approach to this research would be to interview employers to gain insight into the knowledge or skills gaps they are seeing with newly hired data scientist graduates. In addition, future research may look at job postings to see what big data and data science skills are in demand in industry.
Conclusion
This paper explored the classroom to workplace skills gap for big-data scientists using theory-practice gap. Reducing this gap is a two-pronged approach. First, surveying the big-data skills that employers want can help bridge the gap between what schools teach and what employers need. Schools could then adapt their curriculum to more closely fit the needs of industry. Second, educators must provide real world big-data activities so that new graduates are better prepared to use what the learned at university. Results from this study should inform curriculum development and provide valuable information for academics and industry leaders who hire new data talent. When creating course content, professors must be frugal and careful with their software choices. Certainly, there exists free commercial software for Microsoft SQL Server Express and Oracle
Express and education licenses for SAS. These products are easy to install and use.34, 35 However, the ASF software suite (e.g. Apache Hadoop, MapReduce) is the most used big-data software and it runs on a distributed computer system. To setup such a system in a complex, requires a collaborative effort between educators, management and IT. In many cases, the faculty provide debugging support and performs installations for these data science systems. Professors should contact data science employers and document their needs. Faculty could visit the employer's sites to see demonstrations of software for potential course development. Data scientists could visit campuses for guest lectures which builds enthusiasm and shares knowledge among faculty and students. To develop experience-based learning, classroom simulation and application building could be employed. Internship programs with big-data employers would provide students with realistic experiential learning.
The addition of problem-solving assignments and mentoring of faculty and students should be evaluated to prepare students for employment.36, 37 Professional data science organizations could be encouraged to mentor data science students to help close the theory-practice gap.
Authors
Diane Dolezel, EdD, RHIA, CHDA (dd30@txstate.edu) is assistant profession at the HIM Department of Texas State University in San Marcos.
Alexander McLeod, Ph.D. (am@txstate.edu) is an associate professor and department chair at the HIM Department of Texas State University in San Marcos.
Appendix 1 Survey Instrument
What is the current overall level of big data analytics usage at your company? Very Frequently, Frequently, Occasionally, Rarely, or Never.
How frequently are these big data skills used at your organization? Please answer with Very Frequently, Frequently, Occasionally, Rarely, or Never.
Artificial Intelligence
Data Mining
Data Visualization
Java
Machine learning
Natural Language Processing
Structured Query Language
Python
Statistical Analysis
Indicate which relational databases are in use at your organization. Select all that apply.
IBM DB2
Microsoft SQL Server
MySQL
Oracle database
SAP Hanna
Teradata
Other please specify
Indicate which NoSQL non-relational databases are in use at your organization. Select all that apply.
Apache Cassandra
Couchbase
ArangoDB
Apache Hadoop MapReduce
Apache CouchDB – document db
Apache Hbase
MongoDB – document db
Other
Indicate which big data tools are in use at your organization. Select all that apply.
Apache Hadoop HDFS distributed file system
Apache Hive Query Language
Apache HBase column-oriented database
JAQL query language
Jaspersoft BI Suite
IBM InfoSphere
Apache Mahout machine learning
Tableau Desktop and Server
Other
Indicate which data analysis tools are in use at your organization. Select all that apply.
Microsoft Dryad
IBM SPSS Modeler
IBM Watson Analytics
R Statistical Software
RapidMiner
SAS Enterprise Miner
Weka/Pentaho
Other
Indicate which statistical analysis tools are in use at your organization. Select all that apply.
R
JMP
Minitab
Matlab
SAS
SPSS
Stata
Statsoft Statistica
Other please specify
Indicate which data visualization tools are in use at your organization. Select all that apply.
FusionCharts
Google Analytics
IBM Watson Analytics
Microsoft Power BI
Oracle Visual Analyzer
Qlikview
SAP Analytics Cloud
Tableau
Other
Figure 1.
Respondent's Work Role
Contributor Information
Diane Dolezel, (dd30@txstate.edu) is assistant profession at the HIM Department of Texas State University in San Marcos..
Alexander McLeod, (am@txstate.edu) is an associate professor and department chair at the HIM Department of Texas State University in San Marcos..
References
- 1.Dresner Advisory Services (2017) Big data adoption: State of the market. accessed.
- 2.Asamoah D.S.R., Zadeh A., Kalgotra P. Preparing a Data Scientist: A Pedagogic Experience in Designing a Big Data Analytics Course. Decision Sciences Journal of Innovative Education. (2017);15((2)):161–190. [Google Scholar]
- 3.Watson H.J. Update Tutorial: Big Data Analytics: Concepts, Technology, and Applications. Communications of the Association for Information Systems. (2019);44((21)):364–379. [Google Scholar]
- 4.LinkedIn LinkedIn's 2017 U.S. Emerging Jobs Report. (2017). accessed.
- 5.Columbus L. Data Scientist Is the Best Job In America According Glassdoor's 2018 Rankings. (2018). accessed.
- 6.www.indeed.com (2019) Data Scientist Job Postings. accessed,
- 7.Alharthi A., Krotov V., Bowman M. Addressing barriers to big data. Business Horizons (2017) (2017);60:285–292. [Google Scholar]
- 8.How long to become a good data scientist poll. KDnuggets. (2013) [Google Scholar]
- 9.Irizarry R. The role of academia in data science. Simply Statistics. (2018). [DOI] [PMC free article] [PubMed]
- 10.Asamoah D.S.R., Zadeh A., Kalgotra P. Preparing a Data Scientist: A Pedagogic Experience in Designing a Big Data Analytics Course. Decision Sciences Journal of Innovative Education. (2017);15((2)):161–190. [Google Scholar]
- 11.Greenway K., Butt G., Walthall H. What is a theory-practice gap? An exploration of the concept. Nurse Education in Practice. (2019);34:1–6. doi: 10.1016/j.nepr.2018.10.005. [DOI] [PubMed] [Google Scholar]
- 12.Gartner (2018) Big Data. accessed,
- 13.Feldman B., Martin E., Skotnes T. Big data in healthcare hype and hope. Technical Report Dr. Bonnie 360. (2012) October 2012;:1–53. [Google Scholar]
- 14.Amazon Web Service (2018) What is Streaming Data? Amazon.
- 15.Gewirtz D. Volume, velocity, and variety: Understanding the three V's of big data. ZDNet. (2018).
- 16.IBM (2018) The Four Vs of Big Data. accessed,
- 17.Gewirtz D. Volume, velocity, and variety: Understanding the three V's of big data. ZDNet. (2018).
- 18.Apache Software Foundation (2016) The Apache Software Foundation. accessed,
- 19.Apache Software Foundation (2019b) Apache Hadoop. accessed,
- 20.Apache Software Foundation (2019c) Hadoop Wiki. accessed.
- 21.Apache Software Foundation (2019b) Apache Hadoop. accessed.
- 22. Ibid.
- 23.Apache Software Foundation Apache Cassandra. (2019a). accessed,
- 24.Greenway K., Butt G., Walthall H. What is a theory-practice gap? An exploration of the concept. Nurse Education in Practice. (2019);34((2019)):1–6. doi: 10.1016/j.nepr.2018.10.005. [DOI] [PubMed] [Google Scholar]
- 25.Mallonee S., Fowler C., Istre G. R. Bridging the gap between research and practice: a continuing challenge. (2006);12:357–359. doi: 10.1136/ip.2006.014159. [DOI] [PMC free article] [PubMed] [Google Scholar]
- 26.Kinyaduka B. D. Why Are We Unable Bridging Theory-Practice Gap in Context of Plethora of Literature on Its Causes, Effects and Solutions? Journal of Education and Practice. (2017);8((6)):102–105. [Google Scholar]
- 27.Purssell E. Using GRADE to reduce the theory-practice gap. Nurse Education Today. (2019);74((2019)):82–84. doi: 10.1016/j.nedt.2018.12.008. [DOI] [PubMed] [Google Scholar]
- 28.Mallonee S., Fowler C., Istre G. R. Bridging the gap between research and practice: a continuing challenge. (2006);12:357–359. doi: 10.1136/ip.2006.014159. [DOI] [PMC free article] [PubMed] [Google Scholar]
- 29.Kinyaduka B. D. Why Are We Unable Bridging Theory-Practice Gap in Context of Plethora of Literature on Its Causes, Effects and Solutions? Journal of Education and Practice. 8((6)):102–105. [Google Scholar]
- 30.Greenway K., Butt G., Walthall H. What is a theory-practice gap? An exploration of the concept. Nurse Education in Practice. (2019);34((2019)):1–6. doi: 10.1016/j.nepr.2018.10.005. [DOI] [PubMed] [Google Scholar]
- 31.Gelonch-Bosch A., Marojevic V., Gomez I. Teaching Telecommunication Standards: Bridging the Gap between Theory and Practice. IEEE Communications Magazine. (2017);55((5)):145–153. [Google Scholar]
- 32.World Health Organization Capacity building and initiatives. (2006).
- 33.Taylor M. J., McNicholas C., Nicolay C., Darzi A., Bell D., Reed J. E. Systematic review of the application of the plan–do–study–act method to improve quality in healthcare. BMJ Quality & Safety. (2013);23:290–298. doi: 10.1136/bmjqs-2013-001862. [DOI] [PMC free article] [PubMed] [Google Scholar]
- 34.Microsoft SQL Server 2017 Express edition. (2019).
- 35.Oracle Free Oracle Database for Everyone. (2019).
- 36.Kessler T. A., Alverson E. M. Mentoring Undergraduate Nursing Students in Research. Nursing Education Perspectives. (2014);35((4)):262–264. doi: 10.5480/11-555.1. [DOI] [PubMed] [Google Scholar]
- 37.Yayli D. Mentor Support to Pre-service Teachers on Theory-Practice Gap in Practicum: An Online Practice. ATEE Annual Conference 2018 in Gavle, Sweden. (2018):590–601. [Google Scholar]


