

Abstract
Background
One of the priorities and important current problem in public health research globally is modeling of neonatal mortality and its risk factors in using the appropriate statistical methods. It is believed that multiple risk factors interplay to increase the risk of neonatal mortality. To understand the risk factors of neonatal mortality in Ghana, the current study carefully evaluated and compared the predictive accuracy and performance of two classification models.
Methods
This study reviewed the birth history data collected on 5884 children born in the 5 years preceding the 2014 Ghana Demographic and Health Survey (GDHS). The 2014 GDHS is a cross‐sectional nationally representative household sample survey. The relevant variables were selected using leaps‐and‐bounds method, and the area under curves were compared to evaluate the predictive accuracy of unweighted penalized and weighted single‐level multivariable logistic regression models for predicting neonatal mortality using the 2014 GDHS data.
Results
The study found neonatal mortality prevalence of 2.8%. A sample of 4514 children born in the 5 years preceding the 2014 GDHS was included in the inferential analysis. The results of the current study show that for the unweighted penalized single‐level multivariable logistic model, there is an increased risk of neonatal death among babies born to mothers who received prenatal care from non‐skilled worker [OR: 3.79 (95% CI: 2.52, 5.72)], multiple births [OR: 3.10 (95% CI: 1.89, 15.27)], babies delivered through caesarian section [OR: 2.24 (95% CI: 1.30, 3.85)], and household with 1 to 4 members [OR: 5.74 (95% CI: 3.16, 10.43)], respectively. The predictive accuracy of the unweighted penalized and weighted single‐level multivariable logistic regression models was 82% and 80%, respectively.
Conclusion
The study advocates that prudent and holistic interventions should be institutionalized and implemented to address the risk factors identified in order to reduce neonatal death and, by large, improve child and maternal health outcomes to achieve the SDG target 3.2.
Keywords: Ghana, neonatal mortality, risk factors, under‐five mortality, unweighted penalized multivariable logistic regression, weighted multivariable logistic regression
Abbreviations
- AUC
area under the receiver operating characteristic curve
- DHS
Demographic and Health Surveys
- EAs
enumeration areas
- GDHS
Ghana Demographic and Health Survey
- MICS
Multiple Indicator Cluster Survey
- PSU
primary sampling unit
1. BACKGROUND
One of the priorities and important current problem in public health research globally is modeling of neonatal mortality and its risk factors using the appropriate statistical methods to inform targeted child health policy and intervention strategies. To model and understand the associated factors and variation in child mortality in Ghana, household surveys such as the Multiple Indicator Cluster Surveys (MICS) and the Demographic and Health Surveys (DHS), which ask about survival of children, have been carried out over the years. 1
It is critical to note that the most vulnerable time for a child's survival is the first 28 days of life (the neonatal period). Globally, children face the highest risk of dying in their first month of life at an average rate of 18 deaths per 1000 live births in 2017. 2 In 2018, an estimated 2.5 million newborns died worldwide during the first 28 days of life. 3 Similarly, a review of the literature indicates that 2.6 million babies die every year worldwide before turning 1 month old. 4 There are approximately 7000 newborn deaths every day, amounting to 47% of all child deaths under the age of 5 years, up from 40% in 1990. 3 Every year globally, approximately 30 million newborns are at risk, and those who are born too soon or too small, or who become sick, are at the greatest risk of death and disability and need specialized care to survive. 5
UNICEF indicated in a new report on newborn mortality that global deaths of newborn babies among the world's poorest countries remain alarmingly high. 6 It was highlighted in the report that 8 of the 10 most dangerous places to be born are in sub‐Saharan Africa, where pregnant women are much less likely to receive assistance during delivery due to poverty, conflict, and weak institutions.
It is evident that data from 2014 GDHS show a marginal decline in neonatal mortality by 3% over the 15‐year period preceding the survey, from 30 to 29 deaths per 1000 live births. On the contrary, there were substantial declines in post‐neonatal, infant, and under‐5 mortality over the same 15‐year period (41%, 21%, and 31%), respectively. 7
Achieving the SDG target 3.2 more specifically on neonatal mortality requires deeper understanding of the risk factors. A review of the literature indicates that implementing evidence‐based interventions for the reduction of neonatal mortality requires that factors which influence the neonatal mortality should be investigated. 8 A case‐control study was conducted in Maceió, Northeastern Brazil to determine risk factors of neonatal mortality. The logistic regression analysis applied by the researchers of the study identified the following as determining factors for neonatal mortality: mothers with a history of previous children who died in the first year of life (OR = 3.08), hospitalization during pregnancy (OR = 2.48), inadequate prenatal care (OR = 2.49), lack of ultrasound examination during prenatal care (OR = 3.89), transfer of the newborn to another unit after birth (OR = 5.06), admittance of the newborn at the ICU (OR = 5.00), and low birth weight (OR = 2.57). 9 Multivariate analyses performed in another study conducted in Pakistan showed that living in Punjab province (Adj HR = 2.10, P = .015), belonging to the poorest household wealth index quintile (Adj HR = 1.95, P = .035), male infants (Adj HR = 1.57, P = .014), first rank baby (Adj HR = 1.59, P = .049), smaller than average birth size (Adj HR = 1.61, P = .023), and mothers with delivery complications (Adj HR = 1.93, P = .001) had significantly higher hazards of neonatal death. 10
A regression model was developed to predict the risk of neonatal death with characteristics known at (a) the start of pregnancy, (b) start of delivery, and (c) 5 minutes post‐partum in South Asia. The researchers assessed the models' discriminative ability by the area under the receiver operating characteristic curve (AUC), using cross‐validation between sites. The study found that the predictors of neonatal deaths at the start of the pregnancy were low maternal education and economic status, short birth interval, primigravida, and young and advanced maternal age. The predictors at the start of delivery as identified by the study were prematurity and multiple pregnancy. And lastly, multiple birth, prematurity, and a poor condition of the infant at 5 minutes were identified as strong predictors. 11
In order to understand the functional relationship between neonatal mortality and the risk factors, and to also explore the unit of change for the risk factors, 10 statistical models such as unweighted penalized and weighted single‐level multivariable logistic regression models were applied to the 2014 GDHS data. Thus, in this paper, we compared the performance of unweighted penalized and weighted single‐level multivariable logistic regression models for predicting neonatal mortality.
2. METHODS
2.1. Study population
The required data for the current study were extracted from the 2014 Ghana Demographic and Health Survey (GDHS) dataset created and archived by Ghana Statistical Service, UNICEF, and the DHS program. The 2014 GDHS is a nationally representative household sample survey. The 2014 GDHS successfully interviewed 11 385 occupied households, of which 9396 women aged 15 to 49 were interviewed, and 4388 identified men aged 15 to 49 were successfully interviewed. However, this study reviewed the birth history data collected using the children under 5 years questionnaire, which obtained data on 5884 children born in the 5 years preceding the 2014 GDHS. 12 The inferential analysis for the current study was performed on a reduced sample of 4514 children born in the 5 years preceding the 2014 GDHS due to the fact that some key variables such as child size and preceding birth interval had missing data values or no data values were recorded for some observations. The 2010 population and Housing census frame was used for the selection of enumeration areas (EAs). The survey design employed a two‐stage sampling technique, where the first stage of sampling involved the selection of EAs within each rural and urban areas, and the second stage involved systematic selection of households (secondary sampling units) from each cluster (EAs) at random. 13
2.2. Outcome variable
The outcome variable is neonatal mortality. Neonatal mortality is defined as death of the infant within 28 completed days. Neonates who died within 28 days were categorized as “dead” and coded as “1”, and those survived 28 days were categorized as alive and coded as “0”.
2.3. Independent variables
The selection of predictor variables that influence neonatal mortality was based on the conceptual framework for the study of child survival in developing countries and predictor variables used in previous studies 14 , 15 , 16 and available in the 2014 GDHS datasets. The explanatory variables selected for the analysis included sex of child, birth type, birth interval, health insurance status of mother, size of child, maternal age, ever terminated pregnancy, mode of delivery, maternal marital status, parity, household size, maternal religion, wealth index, and prenatal care assistance.
2.4. Statistical analysis
Data cleaning and validation were done to ensure data quality before analysis was carried out using STATA version 14. The categorical variables were checked for possible errors due to collection and data entry. These checks were done to ensure that the categories were mutually exclusive and exhaustive, and their corresponding frequencies were accurate. Quantitative variables were checked for outliers using histogram.
Since the design of the GDHS is complex, “svyset” command implemented in STATA was used to declare survey design characteristics for the dataset, incorporating all information about the primary sampling unit (PSU), sampling weight, and stratification in the “svyset” syntax. The “svyset” command in STATA was designed especially for analyzing data from complex sample surveys to adjust for sampling weights. 17 Thus, the first part of the analysis was performed on demographic variables using descriptive statistics such as weighted simple frequency to display and summarize categorical variables while weighted mean and SD were used to summarize the quantitative variables.
Additionally, in the descriptive analysis, decimal values were recorded for neonatal death and neonate alive because weights applied to each sampling unit (k) was used to obtain the weighted estimate of the parameters. Therefore, estimating parameters such as population total using mathematical expression: where yk is a variable of interest for unit k, produces decimal values. The second part of the analysis focused on inferential statistics. The models examined to determine the magnitude of the association between risk factors and neonatal mortality were unweighted penalized and weighted single‐level multivariable logistic regression models. To describe standard (unweighted) single‐level multivariable logistic regression model, let yi represent a binary outcome variable (neonatal death) and predictor variables x1, x2, …, xp. Thus, the logistic function or model is defined as follows:
where xi = x1, x2, …xp, Pr(yi = 1| xi) is the probability of neonates dying within 28 days of life conditional on the predictor variables xi, β0, β1, …βp, which are the model parameters that are determined using maximum likelihood methods. 18
In order to make a valid statistical inference from the complex survey data, there is the need to enforce some adjustments to the standard single‐level logistic regression model that compensates for the survey design due to clustering, stratification, and unequal probability sampling. Thus, the parameters were estimated in logistic regression model by incorporating adjusted weights.
The information criterion‐based procedures such as Akaike Information Criterion (AIC), the Bayes Information Criterion (BIC), and the Log‐Likelihood (LL) were displayed for the best regressions at each predictor quantity. 19 A lower AIC or BIC value indicates a better fit. To evaluate the predictive accuracy of the unweighted penalized and weighted single‐level multivariable logistic regression models, the area under curves (AUC) were compared. The model with the highest AUC score was selected as the best performing model that fits the data well. The fit of the models was also tested using McFadden's adjusted R 2, and a model with a value between 0.2 and 0.4 is considered an excellent fit. The dataset was divided into training (80%) and validation (20%) sets. The predictive ability of the model was compared using AUC on the training and the validation datasets. Additionally, calibration plot and Hosmer‐Lemeshow goodness of fit (GOF) test were performed to assess the fit of the model on the training and validation dataset. The discrimination ability of the unweighted penalized and weighted single‐level multivariable logistic models were evaluated using diagnostic metrics such as sensitivity, specificity, false positive, and false negative rates.
2.5. Ethics approval
The 2014 GDHS protocol was reviewed and approved by the Ghana Health Service Ethical Review Committee and the Institutional Review Board of ICF International.
3. RESULTS
3.1. Sample characteristics
Data on a total number of 5694.90 (weighted) children under 5 years extracted from 2014 GDHS database were included in the descriptive analysis. The prevalence of neonatal mortality estimated was 159.6 (2.8%).
Table 1 shows the distribution of association between neonatal death and the risk factors. It is observed that neonatal deaths recorded among the male and female neonates were 88.8 (3.0%) and 70.8 (2.6), respectively. The multiple birth neonates recorded the highest neonatal death (10.1%), while only 2% of neonatal death occurred in the single birth category. Variation in the neonatal deaths across maternal factors was observed in Table 1. For instance, approximately 43.4 (3.0%) neonatal deaths were recorded among infants born to mothers who had ever terminated pregnancy relative to those who never terminated pregnancy, 116.2 (2.7%). The findings also revealed that the highest neonatal mortality occurred within the birth interval of less than 24 months, 27.5 (4.9%), while the lowest occurred in 48 or more month's category. Additionally, babies born by caesarean section, 35.3 (4.9), are more likely to die within 28 days of life than those born via vaginal delivery, 124.3 (2.5).
TABLE 1.
Weighted percentage distribution of neonatal mortality by risk factors selected for births within 5 years preceding the 2014 Ghana Demographic and Health Survey (0‐59 months)
| Neonatal death | ||||||||
|---|---|---|---|---|---|---|---|---|
| Weighted frequency | Dead | Alive | Total | |||||
| n | (%) | n | (%) | n | % | N | % | |
| Characteristics | 159.6 | 2.8 | 5535.30 | 97.2 | 5694.90 | 100 | ||
| Neonatal factors | ||||||||
| Sex of child | ||||||||
| Male | 2970 | 52.2 | 88.8 | 3.0 | 2881.0 | 97.0 | 2970.0 | 100 |
| Female | 2725 | 47.8 | 70.8 | 2.6 | 2654.0 | 97.4 | 2725.0 | 100 |
| Size of child | ||||||||
| Average/large | 4799 | 84.3 | 116.6 | 2.4 | 4682.0 | 97.6 | 4799.0 | 100 |
| Small | 895.5 | 15.7 | 43.0 | 4.8 | 852.5 | 95.2 | 895.5 | 100 |
| Low birth weight | ||||||||
| No | 3107 | 90.5 | 21.1 | 0.7 | 3085.0 | 99.3 | 3107.0 | 100 |
| Yes | 327.6 | 6.1 | 9.2 | 2.8 | 318.4 | 97.2 | 327.6 | 100 |
| Type of birth | ||||||||
| Single birth | 5403 | 94.9 | 130.0 | 2.4 | 5273.0 | 97.6 | 5403.0 | 100 |
| Multiple birth | 291.8 | 5.1 | 29.6 | 10.1 | 262.2 | 89.9 | 291.8 | 100 |
| Maternal factors | ||||||||
| Birth interval | ||||||||
| <24 months | 561.5 | 13.0 | 27.5 | 4.9 | 534.0 | 95.1 | 561.5 | 100 |
| 24‐47 | 2203 | 51.1 | 72.6 | 3.3 | 2130.0 | 96.7 | 2203.0 | 100 |
| 48+ months | 1544 | 35.8 | 20.4 | 1.3 | 1524.0 | 98.7 | 1544.0 | 100 |
| Covered by health insurance | ||||||||
| No | 1847 | 32.4 | 32.8 | 1.8 | 1815.0 | 98.2 | 1847.0 | 100 |
| Yes | 3847 | 67.6 | 126.8 | 3.3 | 3721.0 | 96.7 | 3847.0 | 100 |
| Ever terminated pregnancy | ||||||||
| No | 4235 | 74.4 | 116.2 | 2.7 | 4118.0 | 97.3 | 4235.0 | 100 |
| Yes | 1460 | 25.6 | 43.4 | 3.0 | 1417.0 | 97.0 | 1460.0 | 100 |
| Mode of delivery | ||||||||
| No caesarean section | 4966 | 87.2 | 124.3 | 2.5 | 4842.0 | 97.5 | 4966.0 | 100 |
| Caesarean section | 728.7 | 12.8 | 35.3 | 4.9 | 693.3 | 95.1 | 728.7 | 100 |
| Children ever born | ||||||||
| 1 | 944 | 16.6 | 16.3 | 1.7 | 927.6 | 98.3 | 944.0 | 100 |
| 2 | 1213 | 21.3 | 24.6 | 2.0 | 1188.0 | 98.0 | 1213.0 | 100 |
| 3 | 1108 | 19.5 | 28.0 | 2.5 | 1080.0 | 97.5 | 1108.0 | 100 |
| 4 | 827.2 | 14.5 | 28.6 | 3.5 | 798.6 | 96.5 | 827.2 | 100 |
| 5+ | 1603 | 28.1 | 62.0 | 3.9 | 1541.0 | 96.1 | 1603.0 | 100 |
| Prenatal care by | ||||||||
| Non‐skilled worker | 1664 | 29.2 | 101.8 | 6.1 | 1562.0 | 93.9 | 1664.0 | 100 |
| Skilled worker | 4031 | 70.8 | 57.8 | 1.4 | 3973.0 | 98.6 | 4031.0 | 100 |
| Sociodemographic factors | ||||||||
| Maternal marital status | ||||||||
| Single | 436.6 | 7.7 | 11.1 | 2.6 | 425.5 | 97.4 | 436.6 | 100 |
| Currently married | 4879 | 85.7 | 141.2 | 2.9 | 4738.0 | 97.1 | 4879.0 | 100 |
| Formally married | 379.4 | 6.7 | 7.3 | 1.9 | 372.2 | 98.1 | 379.4 | 100 |
| Maternal age | ||||||||
| 15‐24 | 1175 | 20.6 | 29.0 | 2.5 | 1146.0 | 97.5 | 1175.0 | 100 |
| 25‐34 | 2839 | 49.9 | 70.4 | 2.5 | 2768.0 | 97.5 | 2839.0 | 100 |
| 35‐49 | 1681 | 29.5 | 60.2 | 3.6 | 1621.0 | 96.4 | 1681.0 | 100 |
| Household Wealth Index | ||||||||
| Poor | 2459 | 43.2 | 69.3 | 2.8 | 2390.0 | 97.2 | 2459.0 | 100 |
| Medium | 1114 | 19.6 | 25.8 | 2.3 | 1088.0 | 97.7 | 1114.0 | 100 |
| Rich | 2122 | 37.3 | 64.5 | 3.0 | 2057.0 | 97.0 | 2122.0 | 100 |
| Maternal highest level of education | ||||||||
| No education | 1561 | 27.4 | 39.2 | 2.5 | 1522.0 | 97.5 | 1561.0 | 100 |
| Primary education | 1141 | 20.0 | 36.8 | 3.2 | 1104.0 | 96.8 | 1141.0 | 100 |
| Secondary Education | 2739 | 48.1 | 80.1 | 2.9 | 2659.0 | 97.1 | 2739.0 | 100 |
| Higher education | 253.9 | 4.5 | 3.4 | 1.4 | 250.5 | 98.6 | 253.9 | 100 |
| Maternal occupation | ||||||||
| Employed | 4679 | 82.4 | 135.9 | 2.9 | 4543.0 | 97.1 | 4679.0 | 100 |
| Unemployed | 1002 | 17.6 | 23.4 | 2.3 | 978.5 | 97.7 | 1002.0 | 100 |
| Household size | ||||||||
| 1‐4 members | 2118 | 37.2 | 73.1 | 3.4 | 2045.0 | 96.6 | 2118.0 | 100 |
| 5‐7 members | 2634 | 46.3 | 60.3 | 2.3 | 2574.0 | 97.7 | 2634.0 | 100 |
| 8+ members | 943.1 | 16.6 | 26.2 | 2.8 | 916.9 | 97.2 | 943.1 | 100 |
| Maternal religion | ||||||||
| No religion | 238.6 | 4.2 | 2.0 | 0.8 | 236.6 | 99.2 | 238.6 | 100 |
| Christian | 4303 | 75.6 | 129.6 | 3.0 | 4174.0 | 97.0 | 4303.0 | 100 |
| Islam | 969.8 | 17.0 | 26.8 | 2.8 | 943.0 | 97.2 | 969.8 | 100 |
| Traditional | 183.4 | 3.2 | 1.1 | 0.6 | 182.2 | 99.4 | 183.4 | 100 |
3.2. Variable selection for the model
Table 2 depicts the variable selection process and its associated statistics. It is observed that out of the 14 variables under study, the model with 8 predictor variables was favored by AIC, while the model with 6 predictor variables was favored by BIC. As a remedy, one can select between these 6 and 8 predictors. We consider the eight predictor model as the most prudent choice in our case. Thus, the effect of the eight predictor variables (ie, child size, prenatal care assistants, household size, parity, type of birth, preceding birth interval, mode of delivery, and health insurance status of mother) selected by AIC was investigated using unweighted penalized and weighted single‐level multivariable logistic regression models.
TABLE 2.
Optimal models for variable selection
| No. of predictors | Optimal models | ||
|---|---|---|---|
| LL | AIC | BIC | |
| 1 | −504.85 | 1013.70 | 1026.53 |
| 2 | −491.53 | 989.06 | 1008.31 |
| 3 | −476.58 | 961.16 | 986.82 |
| 4 | −465.00 | 940.00 | 972.07 |
| 5 | −459.52 | 931.05 | 969.54 |
| 6 | −454.15 | 922.29 | 967.20 |
| 7 | −451.54 | 919.08 | 970.41 |
| 8 | −450.13 | 918.25 | 975.99 |
| 9 | −449.33 | 918.65 | 982.80 |
| 10 | −448.71 | 919.43 | 989.99 |
| 11 | −448.23 | 920.45 | 997.43 |
| 12 | −448.08 | 922.16 | 1005.56 |
| 13 | −448.03 | 924.05 | 1013.86 |
| 14 | −447.98 | 925.95 | 1022.18 |
Note: Bold values are the lower AIC and BIC values that indicate better fit. This means that the optimal model with 8 predictors was favored by AIC because the lowest AIC score was 918.25. Also the optimal model with 6 predictors was selected by the lowest BIC (967.20) value.
Abbreviations: AIC, Akaike's Information Criterion; BIC, Bayesian Information Criterion; LL, Log‐likelihood.
3.3. Evaluation of model fit on training and validation datasets
The calibration test for the training data was tested using Hosmer‐Lemeshow goodness of fit (GOF) test (H‐L = 1.41, P = .18) (Table 3). The model fits very well on the training set, thus there is no evidence of lack of fit. The AUC for the fitted model applied to the training set to evaluate predictive ability was 79.4%. On the other hand, the predictive accuracy for the validation data was higher (AUC = 82.30%) than the AUC score (79.4%) for the training data (see Figures 1 and 2).
TABLE 3.
Area under operating characteristic curve (AUC‐ROC), calibration plot ad Hosmer‐Lemeshow goodness of fit test for comparing training and validation set
| Data set | n | ROC | Calibration belt (plot) | Goodness of fit | ||
|---|---|---|---|---|---|---|
| Test statistics | P value | H‐L (F) | P value | |||
| Training data | 3605 | 0.794 | 1.72 | .190 | 1.41 | .181 |
| Validation data | 909 | 0.823 | 2.41 | .120 | 1570.48 | <.0001 |
Abbreviation: H‐L, Hosmer‐Lemeshow test.
FIGURE 1.

Area under the ROC curve comparing the predictive accuracy of training and validation set
FIGURE 2.

Calibration plot for training and validation test
3.4. Model comparison between the unweighted penalized and weighted single‐level multivariable logistic regression models
The McFadden's adjusted R 2 for unweighted penalized and weighted single‐level multivariable logistic regression models are 0.13 and 0.15, respectively, indicating that the weighted logistic model explained higher variability in neonatal death compared with the unweighted penalized logistic model. Also, the McKelvey and Zavoina's R 2, Cragg and Uhler's R 2 AIC, BIC values, and other model fit statistic favored the weighted logistic model (Table 4). Thus, for the risk factor identification, the weighted single‐level multivariable logistic model is preferred over the unweighted penalized single‐level multivariable logistic model.
TABLE 4.
Model comparison between the unweighted penalized and weighted single‐level multivariable logistic regression model
| Model | Model 1 | Model 2 | Difference |
|---|---|---|---|
| N | 4514 | 4514 | 0 |
| Log‐likelihood intercept only | −543.43 | −517.34 | 26.09 |
| Log‐likelihood full model | −452.40 | −419.98 | 32.42 |
| McFadden's R 2 | 0.17 | 0.19 | 0.02 |
| McFadden's Adj R 2 | 0.13 | 0.15 | 0.02 |
| Cragg and Uhler's R 2 | 0.18 | 0.21 | 0.03 |
| McKelvey and Zavoina's R 2 | 0.27 | 0.33 | 0.06 |
| AIC | 940.80 | 0.19 | −940.61 |
| BIC | 1056.319 | −36 993.60 | −38 049.92 |
Note: Model 1 = unweighted penalized single‐level multivariable logistic model, Model 2 = weighted single‐level multivariable logistic model.
3.5. Risk factors influencing neonatal mortality
Table 5 compares the results from unweighted penalized and weighted single‐level multivariable binary logistic regression models for predicting the odds of neonate dying within 28 days of life. The results show that multiple birth babies are more likely to die within 28 days of life relative to a single birth babies in the unweighted penalized single‐level multivariable logistic model [OR: 3.10 (95% CI: 1.89, 15.27)] and weighted single‐level multivariable logistic model [OR: 1.65 (95% CI: 0.67, 4.05)].
TABLE 5.
Unweighted penalized and weighted single‐level multivariable logistic regression models for predicting the odds of neonate dying within 28 days of life
| Variable | Model 1 | Model 2 |
|---|---|---|
| OR (95% CI) | OR (95% CI) | |
| Neonatal factors | ||
| Size of child | ||
| Large | 1.00 (Reference) | 1.00 (Reference) |
| Small | 1.42 (0.90, 2.23) | 1.64 (0.83, 3.24) |
| Type of birth | ||
| Single births | 1.00 (Reference) | 1.00 (Reference) |
| Multiple births | 3.10 (1.89, 15.27) | 1.65 (0.67, 4.05) |
| Maternal factors | ||
| Birth interval | ||
| <24 months | 2.45 (1.36, 4.42) | 3.73 (1.75, 7.00) |
| 24‐47 | 1.99 (1.24, 3.20) | 2.93 (1.61, 5.34) |
| 48+ month | 1.00 (Reference) | 1.00 (Reference) |
| Covered by health insurance | ||
| No | 1.00 (Reference) | 1.00 (Reference) |
| Yes | 1.85 (1.18, 2.89) | 2.60 (1.45, 4.69) |
| Parity | 1.33 (1.21, 1.46) | 1.36 (1.21, 1.53) |
| Mode of delivery | ||
| No caesarean section | 1.00 (Reference) | 1.00 (Reference) |
| Caesarean section | 2.24 (1.30, 3.85) | 2.84 (1.24, 6.54) |
| Prenatal care by | ||
| Skilled worker | 1.00 (Reference) | 1.00 (Reference) |
| Non‐skilled worker | 3.79 (2.52, 5.72) | 4.56 (2.44, 8.52) |
| Sociodemographic factors | ||
| Household size | ||
| 5‐7 members | 1.47 (0.86, 2.50) | 1.57 (0.78, 3.18) |
| 1‐4 members | 5.74 (3.16, 10.43) | 6.47 (2.84, 14.70) |
| 8+ members | 1.00 (Reference) | 1.00 (Reference) |
Note: Model 1 = unweighted penalized single‐level multivariable logistic model, Model 2 = weighted single‐level multivariable logistic model.
Additionally, for the unweighted penalized single‐level multivariable logistic model, there is an increased risk of neonatal death among babies born to mothers who received prenatal care from non‐skilled worker [OR: 3.79 (95% CI: 2.52, 5.72)], babies delivered through caesarian section [OR: 2.24 (95% CI: 1.30, 3.85)], and household with 1 to 4 members [OR: 5.74 (95% CI: 3.16, 10.43)], respectively. Comparatively, the weighted single‐level multivariable logistic model shows that there is a higher risk of neonatal death among babies born to mothers who received prenatal care from non‐skilled worker [OR: 4.56 (95% CI: 2.44, 8.52)], babies delivered through caesarian section [OR: 2.84 (95% CI: 1.24, 6.54)], and household with 1 to 4 members [OR: 6.47 (95% CI: 2.84, 14.70)], respectively. Generally, the results from both models differ slightly in terms of the odds ratios.
3.6. Assessing the predictive performance of the unweighted penalized and weighted single‐level multivariable logistic models
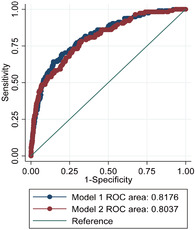
The results in Table 6 showed an evaluation of the performance of unweighted penalized and weighted single‐level multivariable logistic models using AUC scores. The AUC score associated with the unweighted penalized single‐level multivariable logistic regression model was 0.818, which is higher than AUC score (0. 804) for weighted logistic regression model. On the other hand, AUC = 0.818 means that the unweighted penalized single‐level multivariable logistic regression model had 81.78% chance of accurately predicting neonatal mortality and AUC = 0.804 means that there was 80.4% likelihood that the weighted single‐level logistic regression model would accurately predict neonatal mortality. The significant test indicated that both models differ significantly in their predictive accuracy (χ 2 = 6.10, P = .014).
TABLE 6.
Models evaluation using area under the receiver operating characteristic (ROC) curves
| Model | N | ROC (AUC) | SE | 95% CI | Chi‐square | P value | |
|---|---|---|---|---|---|---|---|
| Model 1 | 4514 | 0.818 | 0.021 | 0.778 | 0.858 | 6.10 | .014 |
| Model 2 | 4514 | 0.804 | 0.021 | 0.762 | 0.845 |
Note: Model 1 = unweighted penalized single‐level multivariable logistic model, Model 2 = weighted single‐level multivariable logistic model.
Figure 3 shows that the AUC for the unweighted penalized single‐level multivariable logistic model is slightly larger than AUC for the weighted single‐level multivariable logistic model. This indicates that the unweighted penalized single‐level multivariable logistic model has a slightly better predictive accuracy than the weighted single‐level multivariable logistic model.
FIGURE 3.

Area under the ROC curve comparing the predictive accuracy of unweighted penalized and weighted single‐level multivariable logistic regression model
Table 7 shows that the proportion of neonate alive being classified as dead by the unweighted penalized single‐level multivariable logistic model was 49.70%, which was almost the same as the false positive rate (49.55) for the weighted logistic model. The false negative rates for the unweighted penalized single‐level multivariable logistic model and weighted single‐level multivariable logistic model were 18.8% and 18.23%, respectively. The sensitivity rates for the unweighted penalized (81.22%) and weighted (81.77%) single‐level multivariable logistic models were good but the specificity rates (50.30% and 50.45% respectively) recorded were poor. Both models were not very good because of low values of true negative (specificity). Additionally, the false positive values for both models were a bit high, indicating where the models wrongly classified neonatal deaths and neonates alive in the dataset.
TABLE 7.
Diagnostic metric for model validation
| Diagnostic metrics | Model 1 | Model 2 |
|---|---|---|
| Sensitivity | 81.22 | 81.77 |
| Specificity | 50.30 | 50.45 |
| False positive | 49.70 | 49.55 |
| False negative | 18.78 | 18.23 |
Note: Model 1 = unweighted penalized single‐level multivariable logistic model, Model 2 = weighted single‐level multivariable logistic model.
4. DISCUSSION
4.1. Principal findings
The current study analyzed data on a sample of 4514 children born in the 5 years preceding GDHS to specifically examined factors associated with neonatal mortality in Ghana using both unweighted penalized and weighted single‐level multivariable logistic regression models. The evaluation of the models indicated that the predictive accuracy rates of the unweighted penalized and weighted single‐level multivariable logistic models were 82% and 80%, respectively. The results of the current study showed that for the unweighted penalized single‐level multivariable logistic model, the major risk factors such as type of birth, preceding birth interval, health insurance status of mothers, mode of delivery, prenatal care assistance, parity, and household size were found to have positive association with neonatal mortality.
4.2. Interpretation
The neonatal mortality estimated in the 5 years preceding 2014 GDHS in this study was 2.8%. This means that 28 per 1000 newborns in the period under consideration died within 28 days of life. A similar study carried out using 2008 Nigeria Demographic and Health Survey (NDHS) dataset suggested that the probability of neonatal death was 3.3%. 20 This finding is similar to our current study. Another previous study conducted in Myanmar using Myanmar Demographic and Health Survey 2015 to 2016 data indicated that the overall probability of neonatal death was 1.4%, and this is about half the prevalence obtained in the current study. 21 It is worthwhile to note that child mortality is a key indicator not only for child health and well‐being, but for overall progress toward the Sustainable Development Goals (SDGs). 22 However, the decline in neonatal mortality from 1990 to 2017 has been slower than that of post‐neonatal under‐5 mortality (51% compared with 62% globally). 23
Statistical models such as unweighted penalized and weighted single‐level multivariable logistic regression models were evaluated to investigate the influence of risk factors on neonatal mortality. These two models were compared to determine the one that fits the data well using McFadden's R 2 and other model fit statistic such as the McKelvey and Zavoina's R 2, Cragg and Uhler's R 2 AIC, BIC values. The weighted single‐level multivariable logistic regression fit the data well with adjusted McFadden's adjusted R 2 value of 15% compared to McFadden's adjusted R 2 value of 13% for unweighted penalized single‐level multivariable logistic regression model. The remaining model fit statistic also favored the weighted single‐level multivariable logistic model. The AUC were compared to evaluate the predictive accuracy of the unweighted penalized and weighted single‐level multivariable logistic regression models. The model evaluation using AUC scores revealed that the unweighted penalized single‐level logistic regression model had the highest AUC score (AUC = 82%) and improved predictive ability better than the weighted logistic regression model (AUC = 80%). This implies that even though the data used in this study emanated from a complex survey design, there was no need to incorporate design effects such as sampling weight, clustering, and stratification in the model for the examination of predictive accuracy in our case. This confirms a remark made in an article that no analytical tool is more superior in all circumstances. 24 Thus, the discussion of the results in Table5 basically focused on the unweighted penalized single‐level multivariable logistic regression model. The model results were used to understand the contribution of the relevant risk factors to predicting the odds of neonatal mortality.
The current study showed that type of birth, birth interval, health insurance status of mothers, mode of delivery, prenatal care assistance, parity, and household size were found to be the major risk factors that were positively associated with neonatal mortality. Findings from a similar study were consistent with the results of the current study. 25
The unweighted penalized single‐level multivariable logistic modeling of the risk factors of neonatal mortality revealed that a small body size baby was more likely to increase the risk of neonatal mortality (Table 5). Similarly, the results of previous studies 19 , 26 intimated that a small body size baby had a higher risk of neonatal death. There is the need to put in place measures to avert the risk of having a small body size baby, which in a long run will reduce the risk of neonates dying.
Additionally, the current study revealed that multiple births were found to increase the risk of neonatal mortality relative to single births in the current study [OR: 3.10 (95% CI: 1.89, 15.27)]). On the contrary, the effect size obtained in the current study is lower than what was obtained in a previous study. 27 Babies born multiple births have been identified in the literature as a major risk factor of low birth weight and preterm, which are highly associated with neonatal mortality.
Furthermore, the unweighted penalized single‐level multivariable logistic regression model showed that prenatal care assisted by non‐skilled worker was found to increase the risk of neonatal mortality four times the risk of prenatal care assisted by skilled worker in the current study. The findings reported in the current study agreed with the findings of a previous study. 28 A review of an article indicated that antenatal (ANC) services include risk identification; prevention and management of pregnancy‐related or concurrent diseases; and health education and health promotion. 29 Although estimates of coverage of skilled attendance at birth and institutional delivery in Ghana were 79% and 80%, respectively, in 2017, 30 the burden of neonatal mortality remains high.
In the current study, the odds of babies delivered by caesarean section dying within 28 days of life is 2.24 times the odds of babies who were delivered through the vagina. The results of the current study confirm the findings reported by References 31, 32, 33 regarding the influence of caesarean section on neonatal mortality. A review of the literature shows that most of caesarean sections were done as a result of pregnancy complications. 34
The odds of a neonate dying within 28 days of life among a household of 1 to 4 members were 5.74 times the odds of a neonate dying among a household of eight or more members. It is observed that household size was inversely related to neonatal mortality in the current study. The results of this study were consistent with the results of a previous study. 35 More so, the results showed that a short preceding birth interval (<24 months) and preceding birth intervals between 24 and 47 months increased neonatal mortality risk. The results of the current study agreed with the findings of previous studies. 23 , 36 A shorter birth interval or even a preceding birth interval of 47 months or less are key predictors of neonatal mortality. The possible reasons adduced for this could be that mothers whose previous birth (baby) did not survive resumed sex and eventually became pregnant again, even though they did not recover completely from previous birth.
4.3. Strengths of the study
The use of 2014 GDHS dataset, which is a cross‐sectional nationally representative household sample survey, and a large sample size are strengths of the current study. Another important strength of the current study is declaring survey design characteristics for the dataset by incorporating all information about the primary sampling unit (PSU), sampling weight, and stratification since the dataset used for the analysis emanated from a complex design.
4.4. Limitations of the data
Some of the major limitations to the data such as recall bias and other data that were contingent on the memory of past events were considered. Ghana to date remains without a fully functioning vital registration system to accurately record all births and deaths. 1 Thus, the current study used the 2014 GDHS dataset; however, it is fraught with quality issues and as a result some relevant variables such as birth weight and hemoglobin or anemic status of mothers recorded substantial missing values and could not be included in the analysis.
5. CONCLUSION
The predictive accuracy rates of unweighted penalized and weighted single‐level multivariable logistic regression models were examined using AUC scores and the unweighted penalized single‐level multivariable logistic regression model recorded the highest AUC score (82%) and was selected as the best model for predicting neonatal mortality. We recommend that researchers explore both weighted and unweighted logistic regression models for datasets with complex survey designs for their merit and demerit so as to identify the “best” model in their research work.
The risk of neonatal mortally was found to increase among babies delivered by caesarean section, prenatal care assisted by non‐skilled worker, a small body size baby, multiple births, a household of 1 to 4 members, a short preceding birth intervals (<24 months), and preceding birth intervals between 24 and 47 months. Achieving the SDG target 3.2 on neonatal mortality requires in‐depth understanding of the risk factors and renewed commitment toward achieving these goals by way of mapping out strategies that will enhance further and rapid reduction in neonatal mortality.
FUNDING
The authors declare that this study received no outside funding.
CONFLICT OF INTEREST
All authors report no conflict of interest in this study.
AUTHOR CONTRIBUTIONS
Conceptualization: Wisdom Kwami Takramah, Justice Moses K. Aheto
Data Curation: Wisdom Kwami Takramah, Justice Moses K. Aheto
Formal Analysis: Wisdom Kwami Takramah, Justice Moses K. Aheto
Investigation: Wisdom Kwami Takramah, Justice Moses K. Aheto
Methodology: Wisdom Kwami Takramah, Justice Moses K. Aheto
Project Administration: Wisdom Kwami Takramah, Justice Moses K. Aheto
Resources: Wisdom Kwami Takramah, Justice Moses K. Aheto
Supervision: Justice Moses K. Aheto
Validation: Wisdom Kwami Takramah, Justice Moses K. Aheto
Visualization: Wisdom Kwami Takramah, Justice Moses K. Aheto
Writing—Original Draft Preparation: Wisdom Kwami Takramah, Justice Moses K. Aheto
Writing—Review & Editing: Wisdom Kwami Takramah, Justice Moses K. Aheto
All authors were involved in revising the manuscript and approved the final version of the manuscript.
The corresponding author, Wisdom Kwami Takramah, has access to all of the data in this study and takes complete responsibility for the integrity of the data and the accuracy of the data analysis.
TRANSPARENCY STATEMENT
I, Wisdom Kwami Takramah, affirm that this manuscript is an honest, accurate, and transparent account of the study being reported; that no important aspects of the study have been omitted; and that any discrepancies from the study as planned (and, if relevant, registered) have been explained.
ACKNOWLEDGMENTS
Special thanks go to DHS program for providing access to the datasets used in the current study. We thank Prof. Adanu and Prof. Yawson for their insights.
Takramah WK, Aheto JMK. Predictive model and determinants of odds of neonates dying within 28 days of life in Ghana. Health Sci Rep. 2021;4:e248 10.1002/hsr2.248
DATA AVAILABILITY STATEMENT
The GDHS datasets are available on the Demographic and Health Surveys (DHS) program website (https://dhsprogram.com/data/Registration‐Rationale.cfm) and can be accessed at no cost. However, registration is required for access to the data files.
REFERENCES
- 1. UNICEF . Newborn mortality. 2015, pp. 1‐2.
- 2. Hosmer DW, Lemeshow S. Applied logistic regression New York: John Wiley & Sons, Inc; 2000, pp. 1‐375.
- 3. UNICEF . Global distribution of deaths among children under age 5, neonatal by cause, 2016. 2018.
- 4. WHO . Newborns: reducing mortality. September 2019: Fact sheet N°178. (Updated 2018 February, Cited November 4, 2019). Available from https://www.unicef.org/indonesia/reports/every-child-alive-urgent-need-end-newborn-deaths.
- 5. UNICEF . Every child alive: the urgent need to end newborn deaths. 2018.
- 6. World Health Organization . Nearly 30 million sick and premature newborns in dire need of treatment every year. [Internet]. (Updated December 13, 2018, Cited November 4, 2019); 2018. Available from https://www.who.int/news‐room/detail/13‐12‐2018‐nearly‐30‐million‐sick‐and‐premature‐newborns‐in‐dire‐need‐of‐treatment‐every‐year.
- 7.UNICEF. World is failing newborn babies. (Updated February 20, 2018, Cited November 18, 2019); 2018. Available from: https://www.unicef.org/media/media_102677.html
- 8. Ghana Statistical Service . Demographic and Health Survey 2014: key indicators. 2014.
- 9. Kassar SB, Melo AMC, Coutinho SB, Lima MC, Lira PIC. Determinants of neonatal death with emphasis on health care during pregnancy, childbirth and reproductive history. J Pediatr (Rio J). 2013;89(3):269‐277. [DOI] [PubMed] [Google Scholar]
- 10.Bin NY, Dibley MJ. Determinants of neonatal mortality in Pakistan: secondary analysis of Pakistan Demographic and Health Survey 2006 – 07 Vol. 14. BMC Public Health; 2014. p. 663. [DOI] [PMC free article] [PubMed]
- 11. Houweling TAJ, Van Klaveren D, Das S, et al. A prediction model for neonatal mortality in low‐ and middle‐income countries: an analysis of data from population surveillance sites in India, Nepal and Bangladesh. Int J Epidemiol. 2019;48(1):186‐198. [DOI] [PMC free article] [PubMed] [Google Scholar]
- 12. Ghana Statistical Service (GSS) Ghana Health Service (GHS), ICF International , . Demographic and Health Survey 2014. Rockville, MD: GSS, GHS, and ICF International; 2015. [Google Scholar]
- 13. Ghana Statistical Service (GSS), Ghana Health Service (GHS) and II . Demographic and Health Survey 2014. 2015.
- 14. Mosley HW, Chen CL. Analytical framework for the study of child survival in developing countries. Bull World Health Organ. 2003;81:140‐145. [PMC free article] [PubMed] [Google Scholar]
- 15. Aheto JMK. Predictive model and determinants of under‐five child mortality: evidence from the 2014 Ghana demographic and health survey. BMC Public Health. 2019;19(1):64. [DOI] [PMC free article] [PubMed] [Google Scholar]
- 16. Tagoe ET, Agbadi P, Nakua EK, Duodu PA, Nutor JJ, Aheto JMK. A predictive model and socioeconomic and demographic determinants of under‐five mortality in Sierra Leone. Heliyon. 2020;6(3):e03508. [DOI] [PMC free article] [PubMed] [Google Scholar]
- 17. StataCorp . Stata survey data reference manual [Internet]. (Updated 2013, Cited February 18, 2020); 2013. Available from https://www.stata.com/manuals13/svy.pdf.
- 18.Bourne M. Area Under a Curve by Integration [Internet]. (Updated January 18, 2020, Cited March 21, 2020); 2020. p. 2–5. Available from: https://www.intmath.com/applications‐integration/2‐area‐under‐curve.php
- 19. Lindsey C, Sheather S. Best subsets variable selection in nonnormal regression models. Stata J. 2015;15(4):1046‐1159. [Google Scholar]
- 20. Ezeh OK, Agho KE, Dibley MJ, Hall J, Page AN. Determinants of neonatal mortality in Nigeria: evidence from the 2008 demographic and health survey. BMC Public Health. 2014;14(1):521. [DOI] [PMC free article] [PubMed] [Google Scholar]
- 21. Ko Zaw K, Myo Mon M, MacQuarrie KLD. Use of maternal and neonatal health services associated with neonatal death in Myanmar: further analysis of the Myanmar Demographic and Health Survey 2015‐16. 2019. (Report no. 125). (Updated April 2019, Cited April 15, 2020), Available from https://dhsprogram.com/pubs/pdf/FA125/FA125.pdf.
- 22. UNICEF . Levels & trends in child mortality. 2017.
- 23. Rutstein SO. Effects of preceding birth intervals on neonatal, infant and under‐five years mortality and nutritional status in developing countries: evidence from the demographic and health surveys. Int J Gynecol Obstet. 2005;89(Suppl 1):2004. [DOI] [PubMed] [Google Scholar]
- 24. Klein KJ. A multilevel approach to theory and research in organizations: contextual, temporal, and emergent processes. March 2016.
- 25. Adewuyi EO, Zhao Y, Lamichhane R, et al. Socioeconomic, bio‐demographic and health/behavioral determinants of neonatal mortality in Nigeria: a multilevel analysis of 2013 demographic and health survey. 2016;3(2):311‐323. [Google Scholar]
- 26. Ogbo FA, Ezeh OK, Awosemo AO, et al. Determinants of trends in neonatal, post‐neonatal, infant, child and under‐five mortalities in Tanzania from 2004 to 2016. BMC Public Health. 2019;19(1):1‐12. [DOI] [PMC free article] [PubMed] [Google Scholar]
- 27. NICSWELL . Twins ‘more likely to die before first birthday’. (Updated June 22, 2012, Cited March 4, 2020); 2012; 1‐4. Available from https://www.nicswell.co.uk/health‐news/twins‐more‐likely‐to‐die‐before‐first‐birthday.
- 28. Roy S, Haque MA. Effect of antenatal care and social well‐being on early neonatal mortality in Bangladesh. BMC Pregnancy Childbirth. 2018;18(1):4‐9. [DOI] [PMC free article] [PubMed] [Google Scholar]
- 29. World Health Organization (WHO) . WHO recommendations on antenatal care for a positive pregnancy experience. (Updated January 1, 2016, Cited July 6, 2020); 2016, p. 1 Available from https://apps.who.int/iris/bitstream/handle/10665/250796/9789241549912‐eng.pdf;jsessionid=5BEF067CBB7A43190344A5572BB79616?sequence=1. [PubMed]
- 30. Ghana Statistical Service (GSS) . Ghana Multiple Indicator Cluster Survey 2017/18: snapshots of key findings. 2019.
- 31. Ezeh OK. Trends and population‐attributable risk estimates for predictors of early neonatal mortality in Nigeria, 2003–2013: a cross‐sectional analysis. 2017, pp. 2003–2013. [DOI] [PMC free article] [PubMed]
- 32. MacDorman MF, Declercq E, Menacker F, Malloy MH. Infant and neonatal mortality for primary cesarean and vaginal births to women with “no indicated risk,” United States, 1998–2001 birth cohorts. MCN Am J Matern Nurs. 2006;33:175‐182. [DOI] [PubMed] [Google Scholar]
- 33. Signore C, Klebanoff M. Neonatal morbidity and mortality after elective cesarean delivery. Clin Perinatol. 2008;35(2):361‐371. [DOI] [PMC free article] [PubMed] [Google Scholar]
- 34. Moore TR. Cesarean delivery. Fischer's Mastery Surg (6th ed.). 2012;1:3‐7. [Google Scholar]
- 35. Kaldewei C. Determinants of infant and under‐five mortality – the case of Jordan. Tech Note. 2010;2010:1‐31. [Google Scholar]
- 36. Kozuki N, Walker N. Exploring the association between short/long preceding birth intervals and child mortality: using reference birth interval children of the same mother as comparison. BMC Public Health. 2013;13(Suppl 3):S6. [DOI] [PMC free article] [PubMed] [Google Scholar]
Associated Data
This section collects any data citations, data availability statements, or supplementary materials included in this article.
Data Availability Statement
The GDHS datasets are available on the Demographic and Health Surveys (DHS) program website (https://dhsprogram.com/data/Registration‐Rationale.cfm) and can be accessed at no cost. However, registration is required for access to the data files.