Abstract
Objectives:
Endoscopic pancreatic function tests are used to diagnose pancreatic diseases and are a viable source for the discovery of biomarkers to better characterize pancreatic disorders. However, pancreatic fluid (PF) contains active enzymes that degrade biomolecules. Therefore, we tested how preservation methods and time to storage influences the integrity and quality of proteins and nucleic acids.
Methods:
We obtained PF from 9 subjects who underwent an endoscopic pancreatic function test. Samples were snap frozen at the time of collection, after 1, 2, 4 hours on ice, or after storage overnight at 4°C with or without RNase or protease inhibitors. Electrophoresis and mass spectrometry analysis determined protein abundance and quality while nucleic acid integrity values determined DNA and RNA degradation.
Results:
Protein degradation increased after 4 hours on ice and DNA degradation after 2 hours on ice. Adding protease inhibitors delayed degradation. RNA was significantly degraded under all conditions compared to the snap frozen samples. Isolated RNA from PF-derived exosomes exhibited similar poor quality as RNA isolated from matched PF samples.
Conclusions:
Adding protease inhibitors immediately after collecting PF and processing the fluid within 4 hours of collection maintains the protein and nucleic acid integrity for use in downstream molecular analyses.
Keywords: sample degradation, pancreatic fluid, pancreatitis, pancreatic cancer, biomarkers
Introduction
The Consortium for the Study of Chronic Pancreatitis, Diabetes, and Pancreas Cancer (CPDPC) has a major research objective to develop diagnostic and prognostic biomarkers for pancreatic diseases, such as chronic pancreatitis and pancreatic cancer.1 The mechanisms of chronic pancreatitis and pancreatic cancer remain poorly understood and there are no accurate disease biomarkers that could assist in early diagnosis.2–4 For chronic pancreatitis, the clinical presentation of early disease has subtle imaging features and often requires invasive procedures to achieve at best a “probable” diagnosis.4–7 As a result, there is a pressing need for biomarkers that will improve early diagnosis, staging, and guide interventions to decrease the pain and suffering associated with chronic pancreatitis.8, 9 Moreover, accurate biomarkers of pancreatic diseases might also limit unnecessary surgical procedures or endoscopic interventions, enhancing the overall care of patients by providing better information regarding the stage and possible natural history of the disease.
Pancreatic fluid (PF) is a proximal body fluid enriched with proteins, nucleic acids, and other molecular analytes representative of the steady state and pathophysiologic condition of the pancreas.6 Pancreatic fluid is the ideal biological specimen that can be used for the discovery of biomarkers for pancreatic diseases. Identification and validation of appropriate biomarkers would certainly assist in the definitive diagnosis and staging of various pancreatic diseases, including acute and chronic pancreatitis, pancreatogenic diabetes mellitus, and pancreatic ductal adenocarcinoma (PDAC). Since PF is rich in proteins shed by pancreatic ductal cells it is particularly well-suited as a source of disease biomarkers. By utilizing the secretin-stimulated endoscopic pancreatic function test (ePFT), tens of milliliters of PF can be collected from patients during standard endoscopy.6, 10 The PF can then be used for investigating possible disease biomarkers as an alternative to more invasive approaches of sample collection.11–16 A recent National Institute of Diabetes and Digestive and Kidney Diseases Workshop reported that PF would be an ideal biofluid for the verification of biomarkers identified from studying more distal biofluids, such as blood, urine, or saliva.17 However, substantial differences in the collection of biofluids, delays in processing, addition of preservatives, and sample storage methods can introduce a large amount of error in the interpretation and validation of biomarker studies. These differences can be magnified in the enzyme rich milieu of PF. Variations in the handling of biofluids and storage delays in ultralow temperatures could trigger molecular changes that can significantly impact the molecular components within these biofluids. Certainly, these important variables might obscure or confound disease-related molecular patterns for accurate disease detection or the understanding of disease physiology. Therefore, it is essential that the collection, handling, and storage of biospecimen be standardized and carefully documented for every study, especially the collection of PF when seeking to develop robust diagnostic and prognostic biomarkers for pancreatic diseases.
Currently, the standard for collection and storage procedure of PF biospecimen to be used for protein and nucleic acid analysis is to immediately freeze the sample and store at −80°C until analysis; however, this is often difficult to achieve in a standard endoscopy unit.18 Therefore, the goals of this study were to 1) establish the variability in protein abundance and 2) determine the degree of protein and nucleic acid degradation present in PF due to delayed sample processing and methods of sample preservation immediately following collection and prior to storage at ultralow temperatures. The ultimate aim is to standardize PF sample collection, handling, and storage for biomarker discovery.19
Methods
Study subject selection
The study protocol was approved by The Ohio State University Wexner Medical Center’s Institutional Review Board (IRB). Adults subjects (>18 years of age) (n = 9) were enrolled from March 2017 to May 2018 who were undergoing clinically indicated comprehensive pancreas testing using magnetic resonance imaging and ePFT.
Pancreas fluid - ePFT collection method, processing, and storage
Pancreatic fluid samples from all subjects who underwent an ePFT were collected at serial time points following secretin administration (Figure 1A). The PF samples collected at 0–10 minutes and 10–20 minutes were aliquotted, then snap frozen (SF) in liquid nitrogen at the time of collection, after 1, 2, 4 hours on ice, and after storage overnight (O/N) at 4°C prior to storage in an ultralow temperature (−80°C freezer). Additional aliquots were treated with either an RNase inhibitor (RI) cocktail (SUPERase-In Rnase Inhibitor 20 U/μL; Ambion, Austin, Texas) a protease inhibitor (PI) cocktail (cOmplete Protease Inhibitor Cocktail Tablets in EASYpacks 04693116001; Roche, Mannheim, Germany), or no preservative (NP) added (Figure 1B) and centrifuged at 1200xg for 10 minutes at 4°C prior to storage in a −80°C freezer. Pancreatic fluid collected at 30–45 minutes and 45–60 minutes was immediately SF in liquid nitrogen without centrifugation prior to storage in a −80°C freezer.
Figure 1: ePFT collection time points and study scheme to test various preservation methods and delays in storage times.
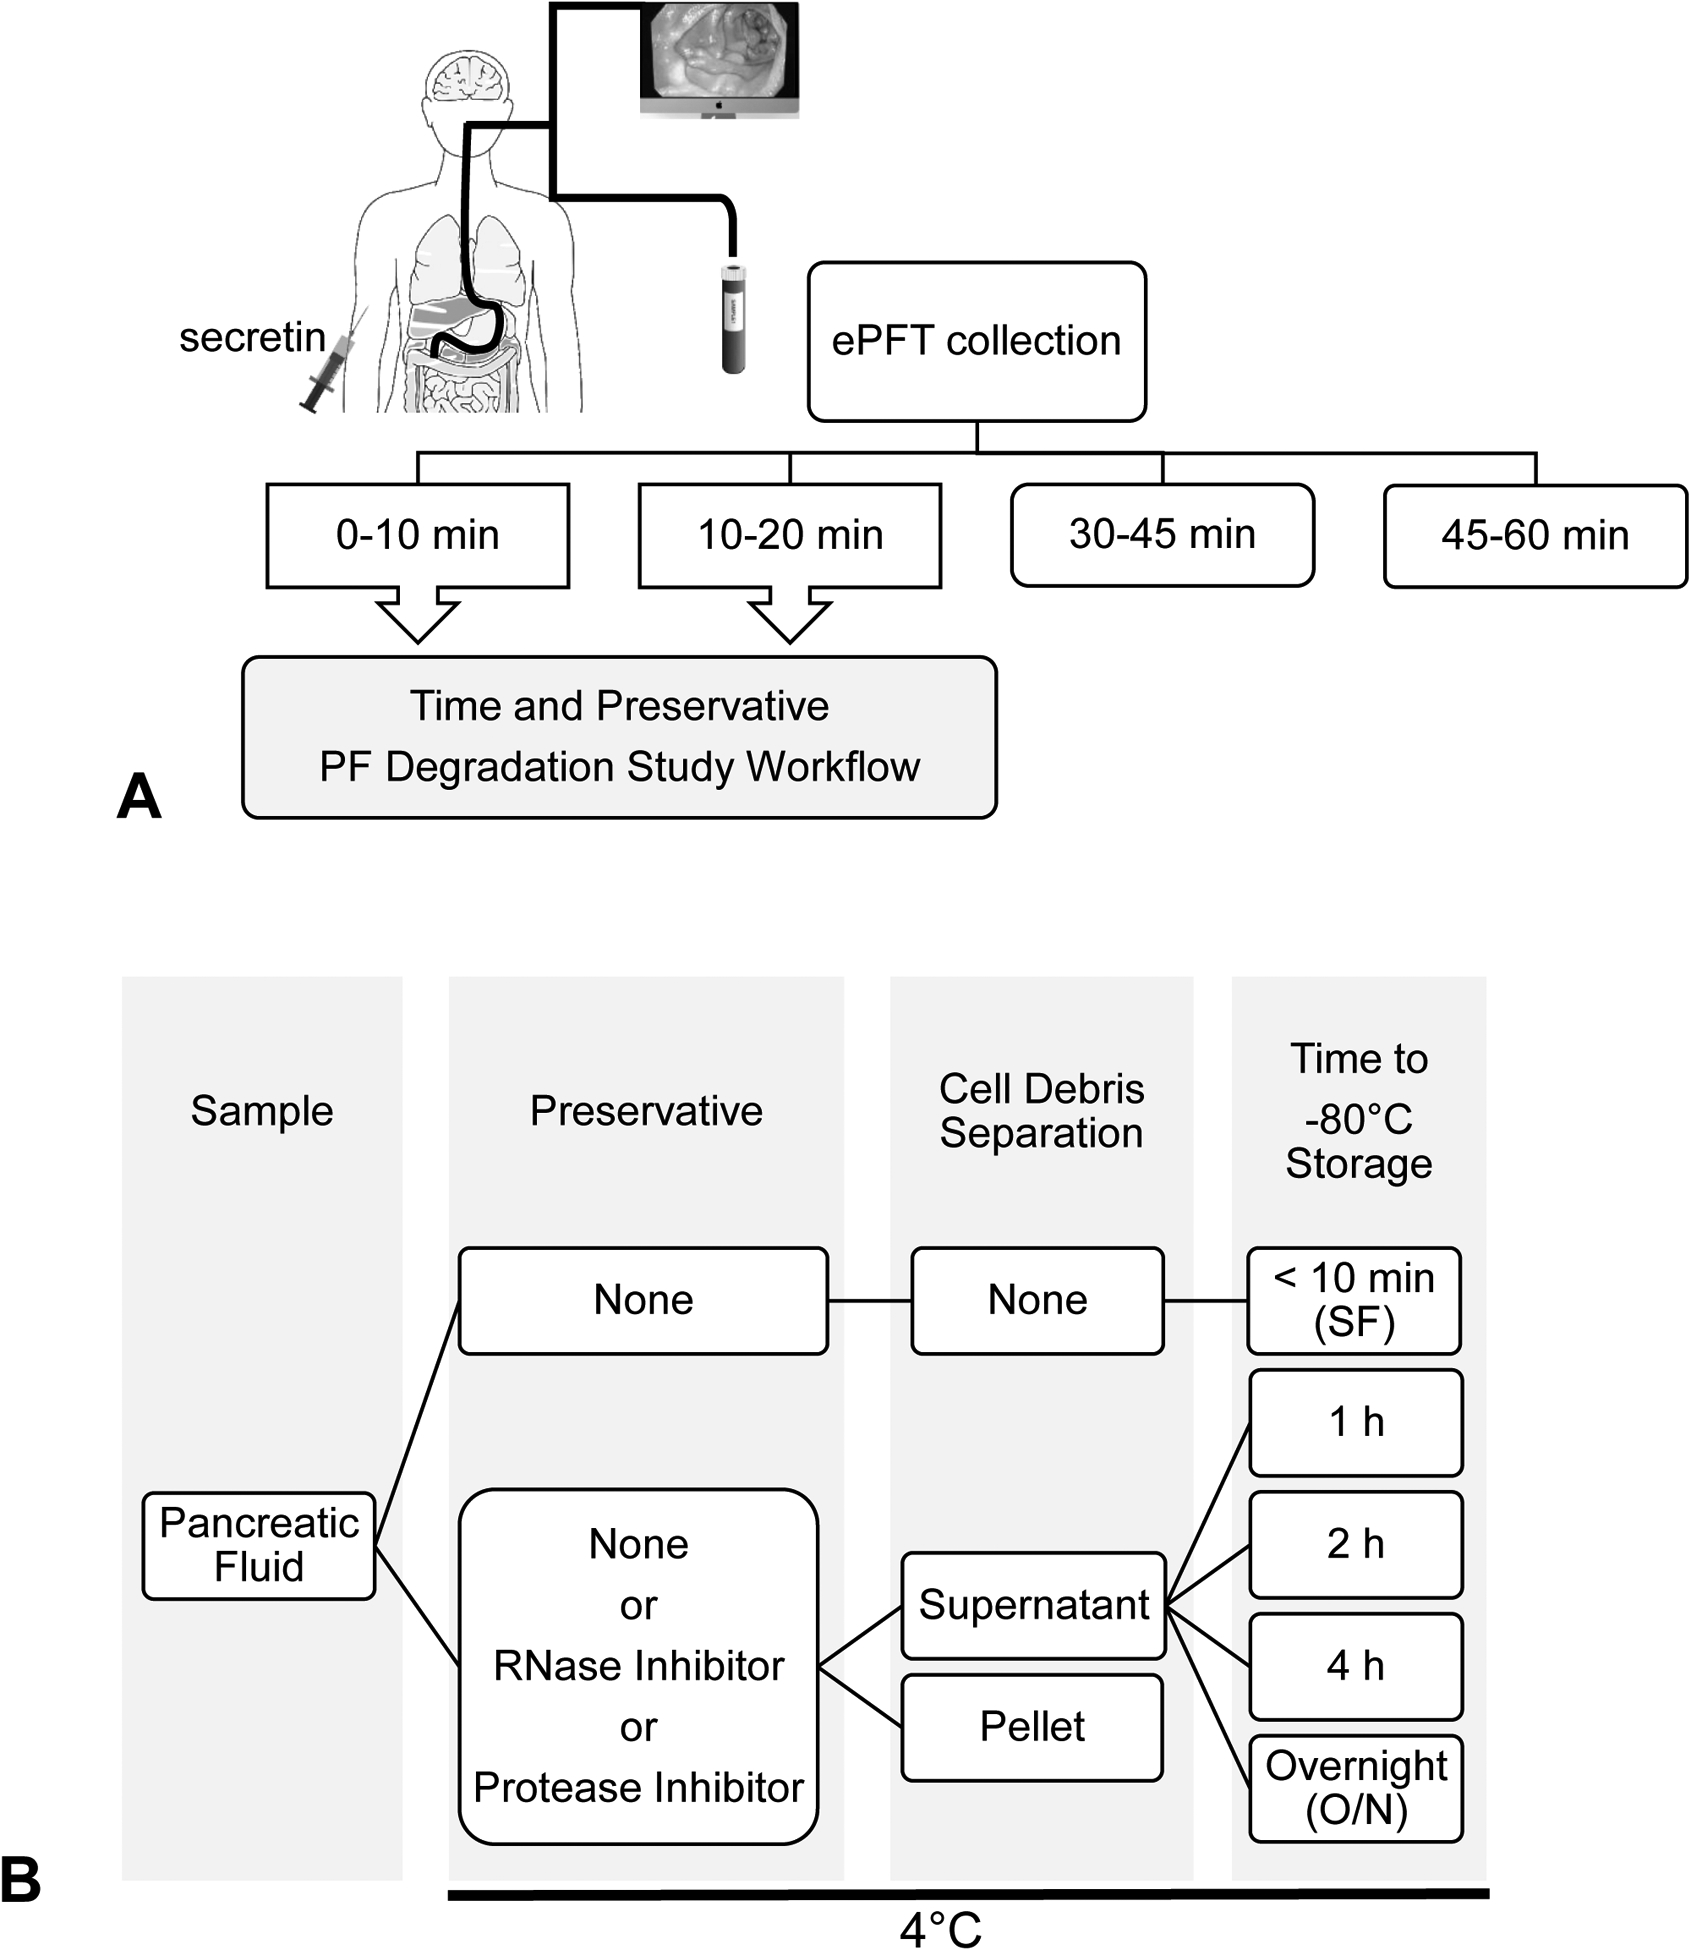
(A) All subjects underwent an ePFT and PF samples were collected at various time points. (n = 9). (B) Scheme shows the various processing conditions tested for the PF collected at 0–10 min and 10–20 min following subject secretin administration.
TCA precipitation
Twenty-eight μL of ice-cold 100% trifluoroacetic acid (TCA, Sigma Aldrich, St. Louis, Mo.) was added to 200 μL PF (final concentration of 14% TCA). Samples were vortexed prior to incubation at 4°C for 2 hours and then centrifuged at 20,000×g at 4°C for 30 minutes. The supernatants were carefully aspirated to avoid disturbing protein pellets. Pellets were washed by adding 1 mL of 100% ice-cold acetone (Fisher Scientific, Fair Lawn, N.J.) and briefly vortexing prior to another incubation at 20°C for 1 hour. Protein pellets were isolated by centrifugation at 20,000×g at 4°C for 30 minutes followed by a second acetone wash. Final protein pellets were allowed to air dry at room temperature before further polyacrylamide gel electrophoresis was performed.
Sodium dodecyl sulfate–polyacrylamide gel electrophoresis (SDS-PAGE)
The precipitated protein pellets were re-dissolved in 50 μL Laemmli buffer containing 10 mM Dithiothreitol (DTT) as a reducing agent. Samples were heated to 56°C for one hour followed by alkylation with 1% acrylamide at room temperature for 30 minutes. Sample (20 μL) was loaded onto a 15-well 4–12% NUPAGE Bis-Tris SDS PAGE gel (Thermo Fisher, Carlsbad, Calif.) and ran at 200V for 45 minutes using 3-(N-Morpholino) propane sulfonic acid (MOPS) MOPS-SDS running buffer. Resulting gels were stained with SimplyBlue Coomassie stain (Thermo Fisher) for 3 hours, de-stained in deionized water overnight, and imaged.
Proteomic analysis
Protein concentration was determined and a TCA precipitation performed to remove small molecule contaminants as described above. Precipitated protein samples were reduced with DTT, alkylated with iodoacetamide, and then digested with trypsin overnight. For the liquid chromatography with tandem mass spectrometry (LC-MS/MS), we used a Thermo Q Exactive plus equipped with an EASY-Spray™. Sources operated in positive ion mode. Samples were separated on an easy spray nano column (PepmapTM RSLC, C18 3μm 100A, 75μm X150mm Thermo Scientific, Germering, Germany) using a 2D RSLC HPLC system from Thermo Scientific and ran using the 5-hour method. Results were obtained by performing a semi-tryptic database search against the UniProt human database using MyriMatch, Comet and X!Tandem search algorithms.20–22 Search engine scores were adjusted to posterior error probabilities and target-decoy false discovery rates (FDR)23 were determined using the TOPP tools in OpenMS.24 Peptides were filtered at the 1% FDR and exported as mzTab and csv. Protein inference was performed using FIDO25 and protein spectral counts were summed for each protein and reported separately for each search engine. The result matrix containing the spectral counting values for each protein in every sample was then exported into the Perseus software (v1.6.6.0, MaxPlanck Institute, Planegg, Germany) to perform the principal component analysis (PCA).
Nucleic acid isolation, quality, and integrity assessment
Nucleic acids were extracted directly from frozen 250 μL aliquots of PF from subjects. DNA was extracted using the Maxwell 16 LEV Blood DNA Kit (Promega, Madison, Wis.) (DNA Method 1) following the manufacturer recommendations or the DNeasy Blood and Tissue Kit (Qiagen, Germantown, Md.) (DNA Method 2) following the cultured cells protocol recommended by the manufacturer. RNA was extracted using the Maxwell 16 LEV simplyRNA Blood Kit (Promega) (RNA Method 1) or guanidinium thiocyanate-phenol-chloroform TRIzol Reagent (Invitrogen, Carlsbad, Calif.) (RNA Method 2) following the manufacturer recommendations. Due to the low volumes of PF utilized, for better separation and transfer of the aqueous phase during the TRIzol RNA isolation process, we used Phasemaker Tubes (Invitrogen). The extracted DNA and RNA concentrations and A260/A280 ratios were measured using the NanoDrop ONE (Thermo Scientific, Wilmington, Del.). Samples that had an A260/A280 ratio of 1.8 – 2.0 were considered pure. The integrity of the nucleic acids were evaluated by measuring the DNA integrity number (DIN) and the RNA integrity number (RIN) through the Agilent 2200 Tapestation or the 2100 Bioanalyzer (Agilent Technologies, Santa Clara, Calif.), respectively. The 2200 TapeStation Analysis Software assesses DNA fragmentation to generate a DIN, which is a quantitative measure of the gDNA integrity ranging from 1 to 10. The Agilent 2100 Bioanalyzer utilizes electrophoresis to provide a RIN, which is similarly a quantitative measure of RNA integrity ranging from 1 to 10. For both DINs and RINs, an integrity of 1, represents the most degradation and 10 represents the least degradation.
Quantitative Reverse Transcription Polymerase Chain Reaction (qRT-PCR)
Complementary DNA (cDNA) was synthesized from the TRIzol- and Maxwell-isolated total RNA using the Verso cDNA Synthesis Kit (Thermo Scientific). For synthesis, 0.02 μg of Maxwell RNA was added per sample and 0.2 μg for TRIzol RNA. The cDNA generated from the Maxwell-isolated RNA was not diluted for qRT-PCR, while the cDNA generated from the TRIzol-isolated RNA was diluted at a 1:10 ratio. All of the qRT-PCR analyses were performed using SensiFAST Probe Hi-ROX Master Mix and conducted at 50°C for 2 minutes, 95°C for 10 minutes, 40 cycles of 95°C for 15 seconds, and 60°C for 1 minute. The cycle threshold values were plotted as the average of triplicates of each sample.
Exosome isolation and characterization
Exosomes from 250 μL of PF collected after 30 min of ePFT were isolated using the Total Exosome Isolation Kit (ThermoFisher) following manufacturer recommendations. Post isolation, exosome size and concentration were characterized via Nanosight (Malvern NanoSight NS300, Westborough, Mass.) and RNA content was isolated using a mirVana miRNA Isolation Kit (ThermoFisher). RNA from an aliquot of 250 μL of PF collected after 30 min of ePFT was also isolated from the same subject and treatment condition with this method as a control.
Statistical analysis
Mixed effects models with fixed effects for inhibitor and time as well as random intercepts for each patient were fit using GraphPad Prism software (GraphPad Prism version 8.1.2, San Diego, Calif.) and or using SAS 9.4 (SAS Inc., Cary, NC). For all analyses, Dunnett’s correction was used to account for multiple comparisons when comparing each time point to the snap frozen. Log transformations of the original data were used for statistical analysis if the assumptions of homoskedasticity or normality appeared to not be met when analyzing Q-Q and residual plots. Log transformations are noted in the figure legends where appropriate. Additionally, interactions between inhibitor and time were investigated; however, none were found to be significant at the 0.05 level and are not included in the final models and are not reported. Differences in ion and enzyme concentrations between the various ePFT times were evaluated using repeated measures ANOVA. Outliers were defined as more than 1.5*(Q75-Q25) greater than Q75 or less than Q25 where Q25 and Q75 are the first and third quartiles of the data, respectively. An extreme outlier was more than 3*(Q75-Q25) greater than Q75 or less than Q25.
Results
Clinical levels of ions and enzymes in ePFT
Ion and enzyme concentrations from the ePFT collection times (Figure 1A) were measured clinically as part of the standard of care. Data from all subjects were combined, and no significant differences were observed in the concentrations of bicarbonate, sodium (Na+) ions, chloride (Cl−) ions, potassium (K+) ions, amylase, or lipase between the different time points at which the PF was collected. (Figure 2A–F) These clinical parameters were examined for subject variability and a trend of increased levels of bicarbonate and sodium ions from the first (0–10 minutes) to the second PF collection (10–20 minutes) was observed in most subjects. (Supplemental Figure 1 – exhibits “classic” constant cation concentrations of K /Na and reciprocal relationship between HC03/Cl). The opposite effect was observed for potassium ions, amylase, and lipase concentrations in some patients that is typical of ePFT results. However, not all patients had the same pattern of changes. (Supplemental Figure 1–2)
Figure 2: ePFT clinical ion and enzyme concentrations.
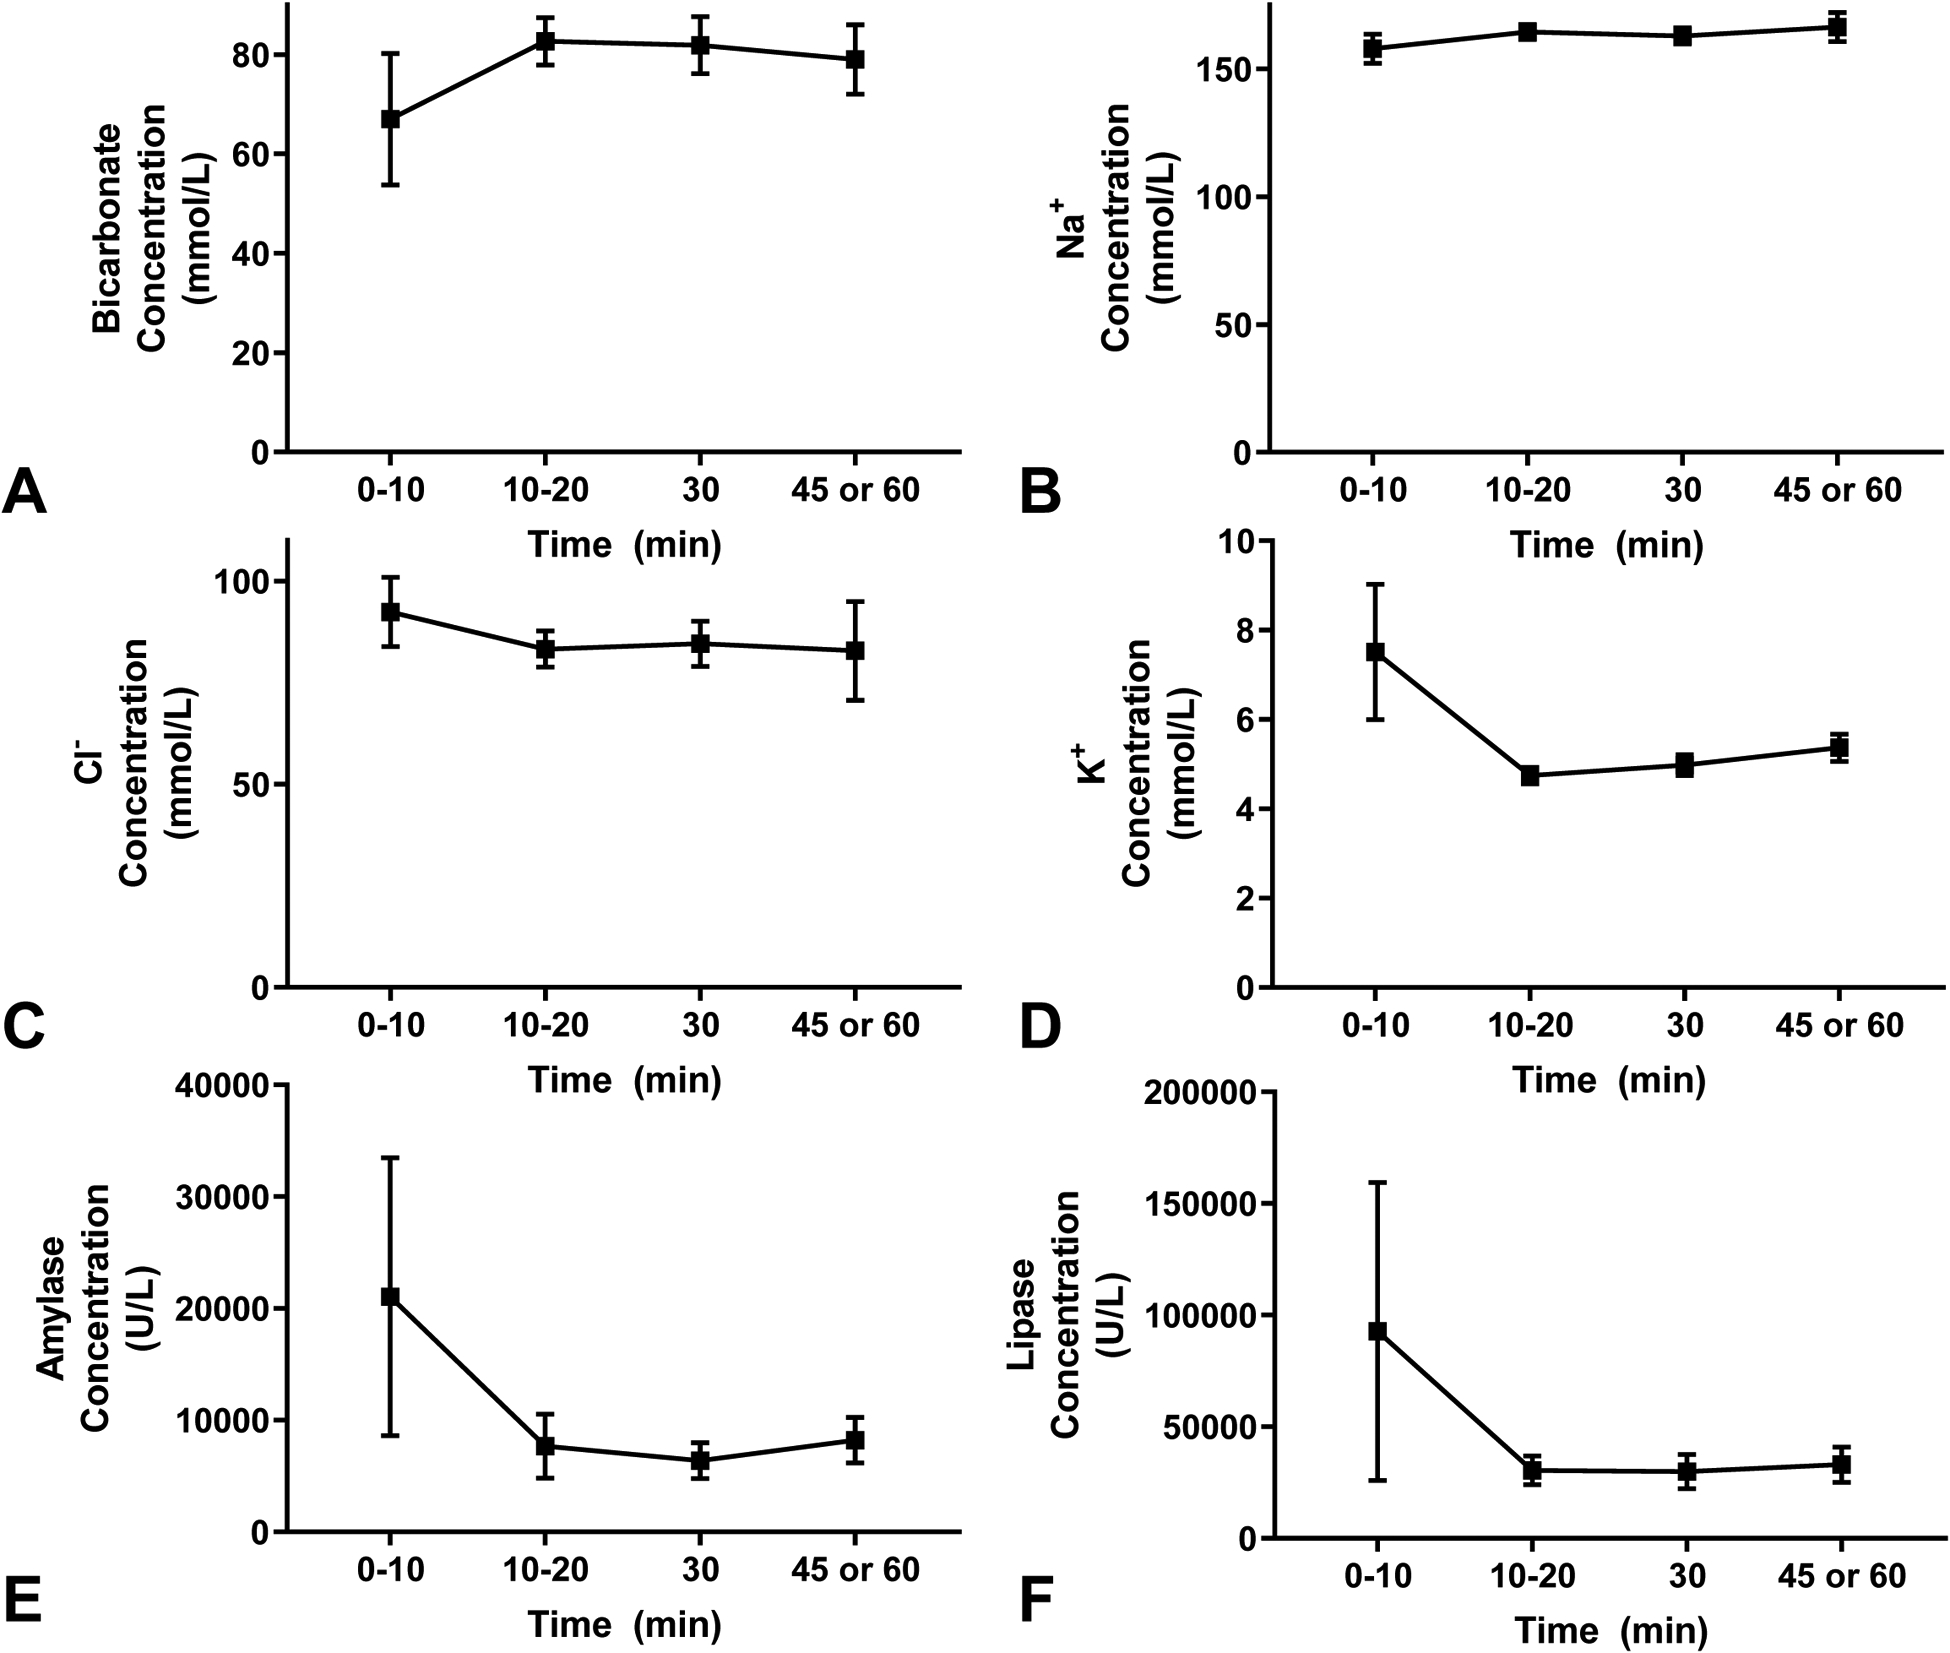
(A-F) The concentrations of ions and enzymes were measured per subject at the various time intervals (min) after secretin administration (A) bicarbonate ion, (B) sodium ion, (C) chloride ion, (D) potassium ion, (E) amylase enzyme, and (F) lipase enzyme concentrations.
Pancreatic fluid protein degradation and abundance are affected by delays in freezing, storage, and preservative utilized
The extent of PF protein degradation in the presence or absence of RI or PI as a result of various delays in storage times to −80° C was assessed by SDS-PAGE (Figure 3A). Reduced and alkylated PF proteins electrophorese cleanly on a standard SDS-PAGE (Figure 3A), while bile-containing samples, which are easily identified based on their color (green/brown), show irregular electrophoresis pattern, rendering SDS-PAGE separation hard to interpret (data not shown). Protein degradation caused by different processing methods was assessed by comparing the Coomassie blue staining intensity and protein band resolution patterns in an SDS-PAGE; for these comparisons samples from a single time point from an individual subject were used as depicted in Figure 1B. The Coomassie blue staining shows that the PF proteins are relatively stable for up to 4 hours at 4°C, regardless of the addition of RI or PI when compared to the SF control aliquot. However, protein degradation is observed if the PF samples are incubated at 4°C overnight, irrespective of the use of a preservative (Figure 3A red arrows) when compared to the SF control aliquot. Although the addition of PI prevented some protein degradation after incubating at 4°C overnight, the addition of an RNase inhibitor cocktail had very little effect on the protein degradation of PF at 4°C overnight. Therefore, the addition of PIs appeared to reduce degradation in the conditions tested when compared to the SF control aliquot from the same subject and ePFT time collection point.
Figure 3: PF protein degradation and abundance.
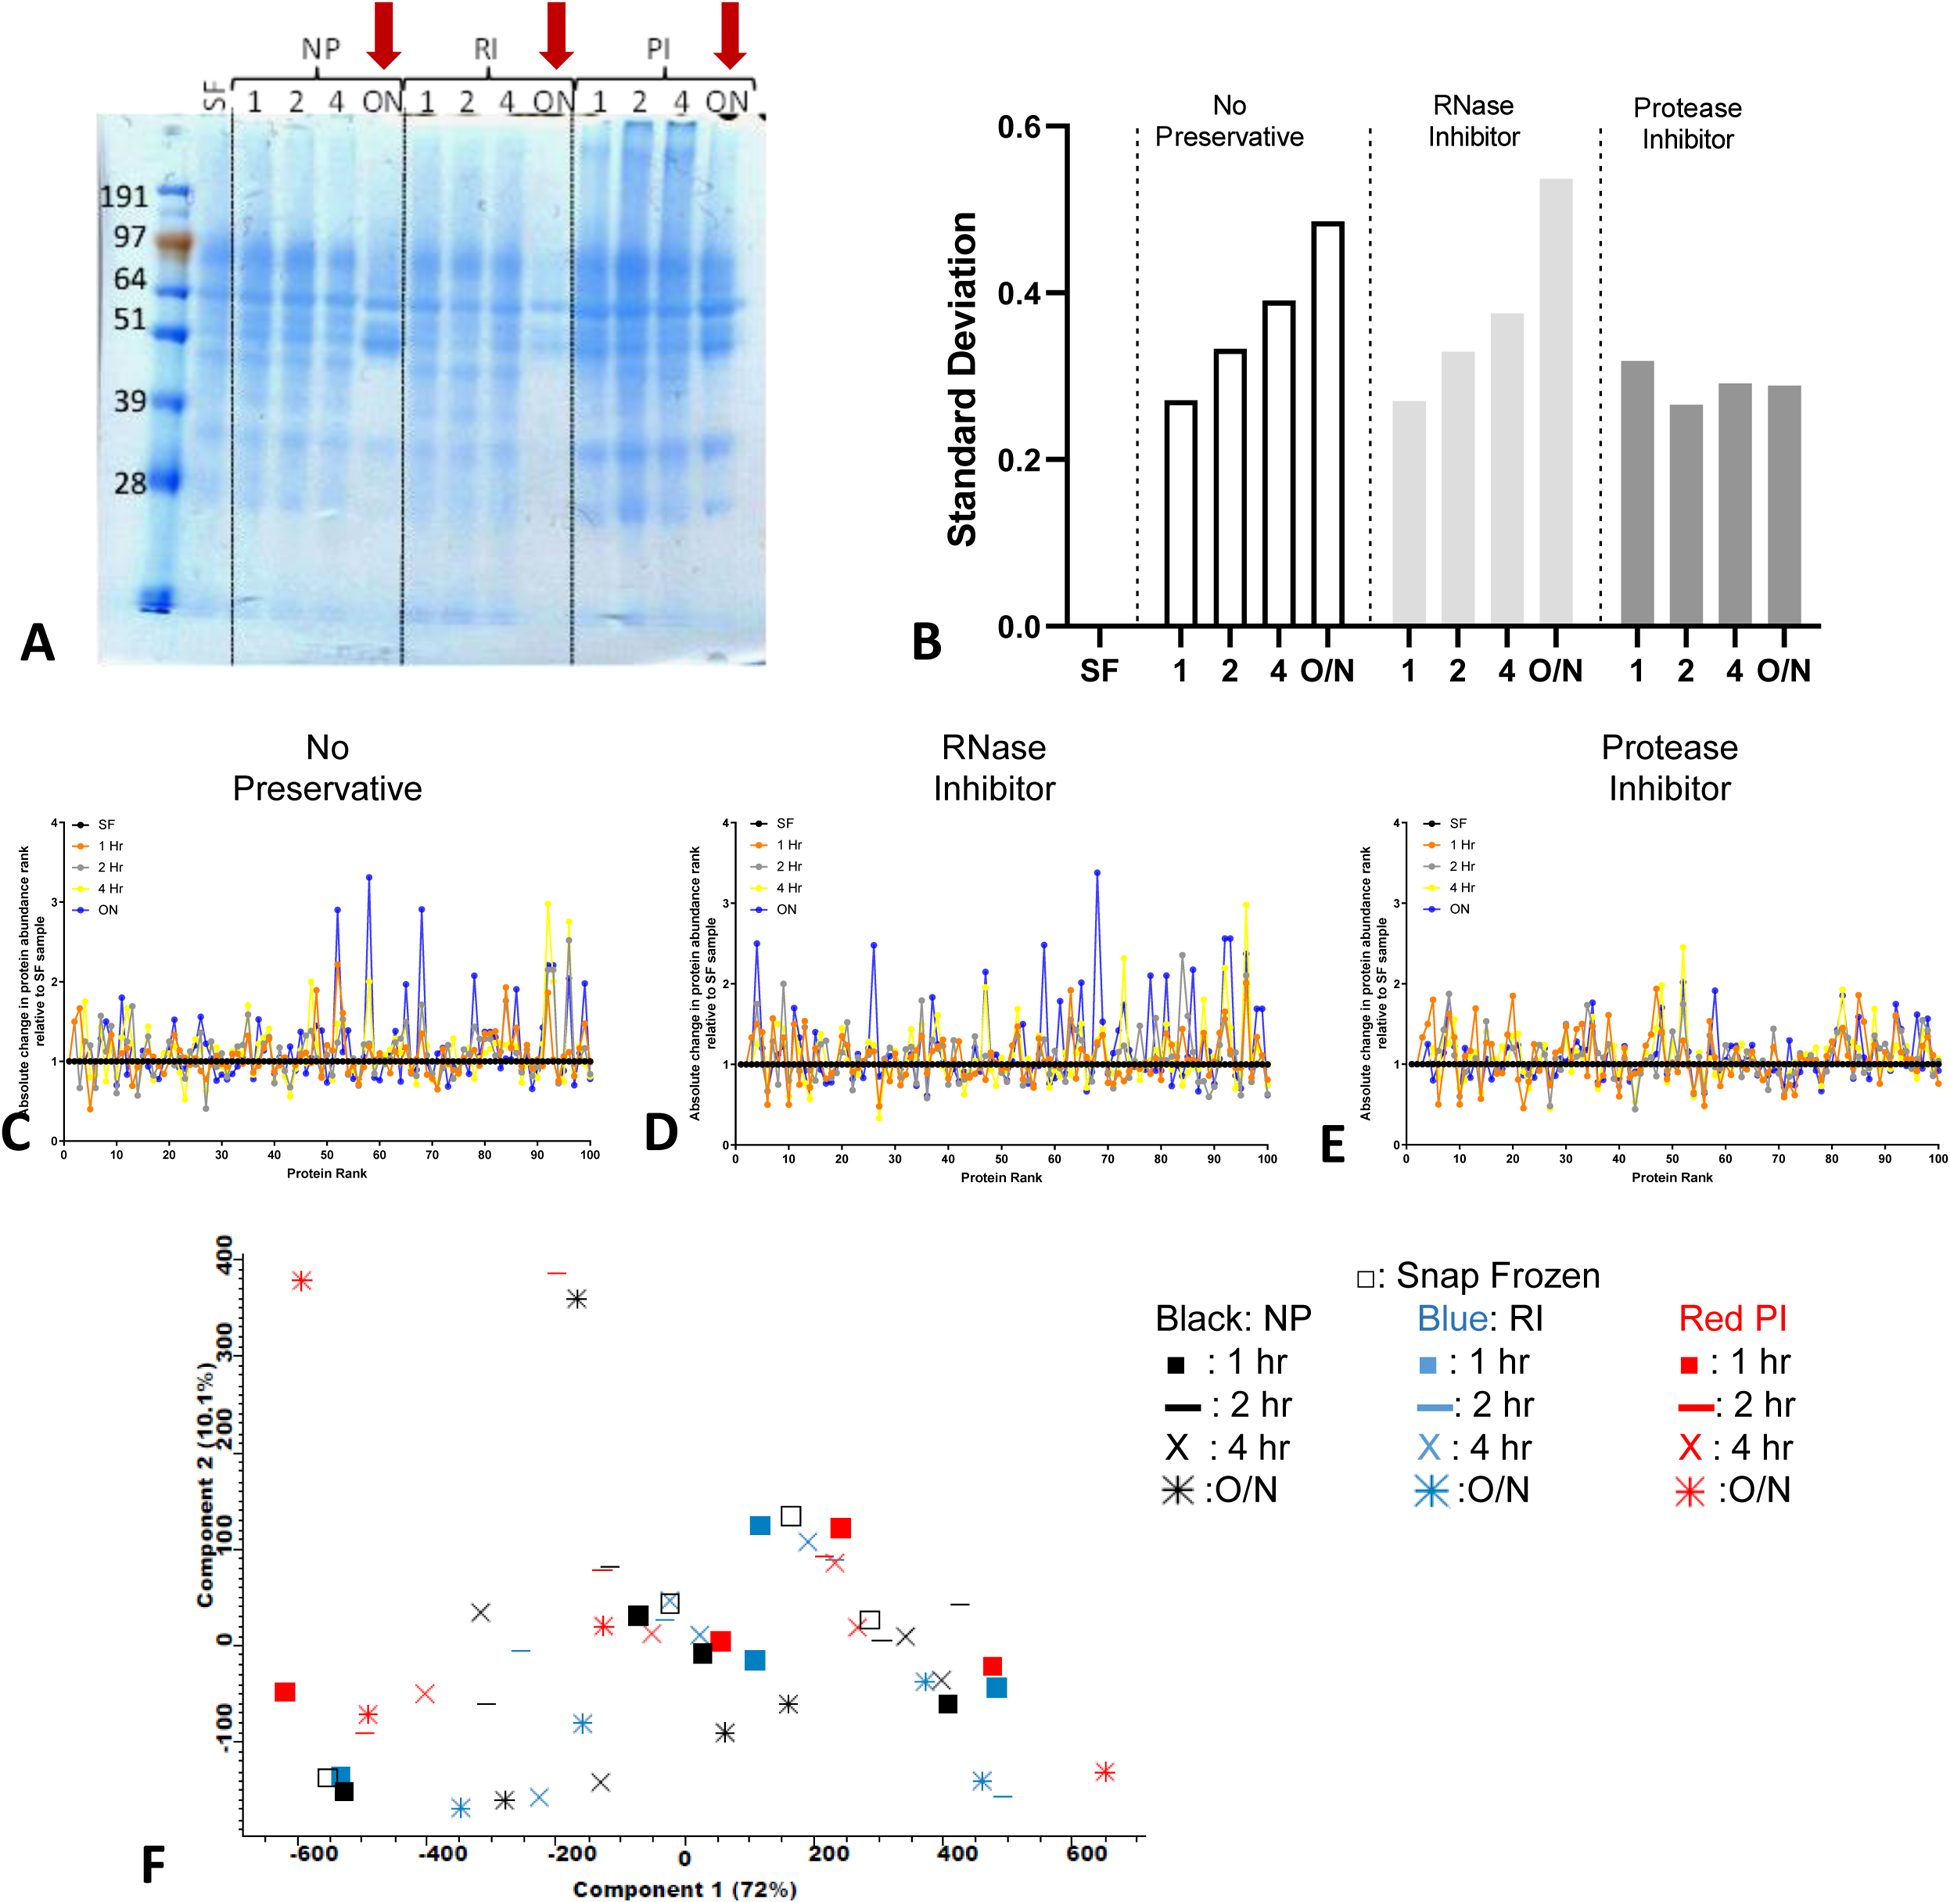
(A) Representative SDS-PAGE coomassie blue stained gel showing sample protein integrity. Red arrow highlights the PF samples left overnight at 4°C. (B) The standard deviation of the changes in (C-E) the rank based on the median spectral count of the SF samples was used as reference. (C-E) The absolute changes in the protein abundance rank (using spectral counting-based protein quantification) for the top 100 proteins identified in the PF incubated at various times at 4°C in the absence of any inhibitors (C) NP, (D) presence of RI and (E) presence of PI. (F) Principal component analysis using all 52 samples conditions from 4 subjects as input.
To explore the protein content variability in the various examined conditions, we performed an in-depth LC-MS/MS proteomic analysis of 0–10 min ePFT collections from four subjects (Figure 3B–F and Supplemental Figure 3). We analyzed the average changes in the rank order of the 100 most abundant proteins present in the SF control sample relative to the SF sample. We compared samples as a function of the incubation time at 4°C prior to freezing at −80°C and the absence or presence of RI or PI for the subject PF tested. Variations were observed when the standard deviation of changes compared to the SF samples were examined (Figure 3B). Fewer changes in the rank order are reflected by a smaller deviation from the horizontal line at a ratio of 1. Increased changes in protein degradation are reflected by increased deviation of the relative rank protein order from the SF control sample. We show increased deviation with increasing incubation times for the untreated sample without preservative (NP) or the sample treated with RI. In contrast, treatment with the PI resulted in less deviation in the rank order of the proteins as compared to the SF control sample (Figure 3C–E).
To account for variability amongst subjects, time points, and inhibitor utilized in our analyses, we performed a principal component analysis (PCA) to investigate whether general trajectories for the different subject samples and treatments are observed (Figure 3F). However, no significant ordering based on time points or inhibitor treatments are apparent in our analyses. The only grouping which is apparent along PC1 and PC2 is by subjects (Supplemental Figure 3), as the samples from each patient cluster together indicating that the intra-subject variation is smaller than the inter-subject variation.
Protease inhibitors preserve the quality and integrity of DNA isolated from PF
Next, we determined how addition of RI and PI inhibitors and time delays to storage at −80°C altered the PF-derived DNA concentration, quality, and integrity. We observed that the various conditions tested did not affect the concentration (Figure 4A) or purity (Figure 4B) of the DNA isolated from PF when compared to the SF sample control. However, the DNA integrity was reduced the longer samples were stored at 4°C compared to the SF control (Figure 4C–D). If PIs were added to the PF samples upon collection prior to storage, the integrity of the DNA isolated was maintained and this was not observed when the PF samples were treated with RI or not treated with a preservative (Figure 4C–D). Some samples from individual subjects were more susceptible to DNA degradation than others as shown in (Supplemental Figure 4)
Figure 4: Concentration, quality, and integrity of DNA isolated from PF Samples.
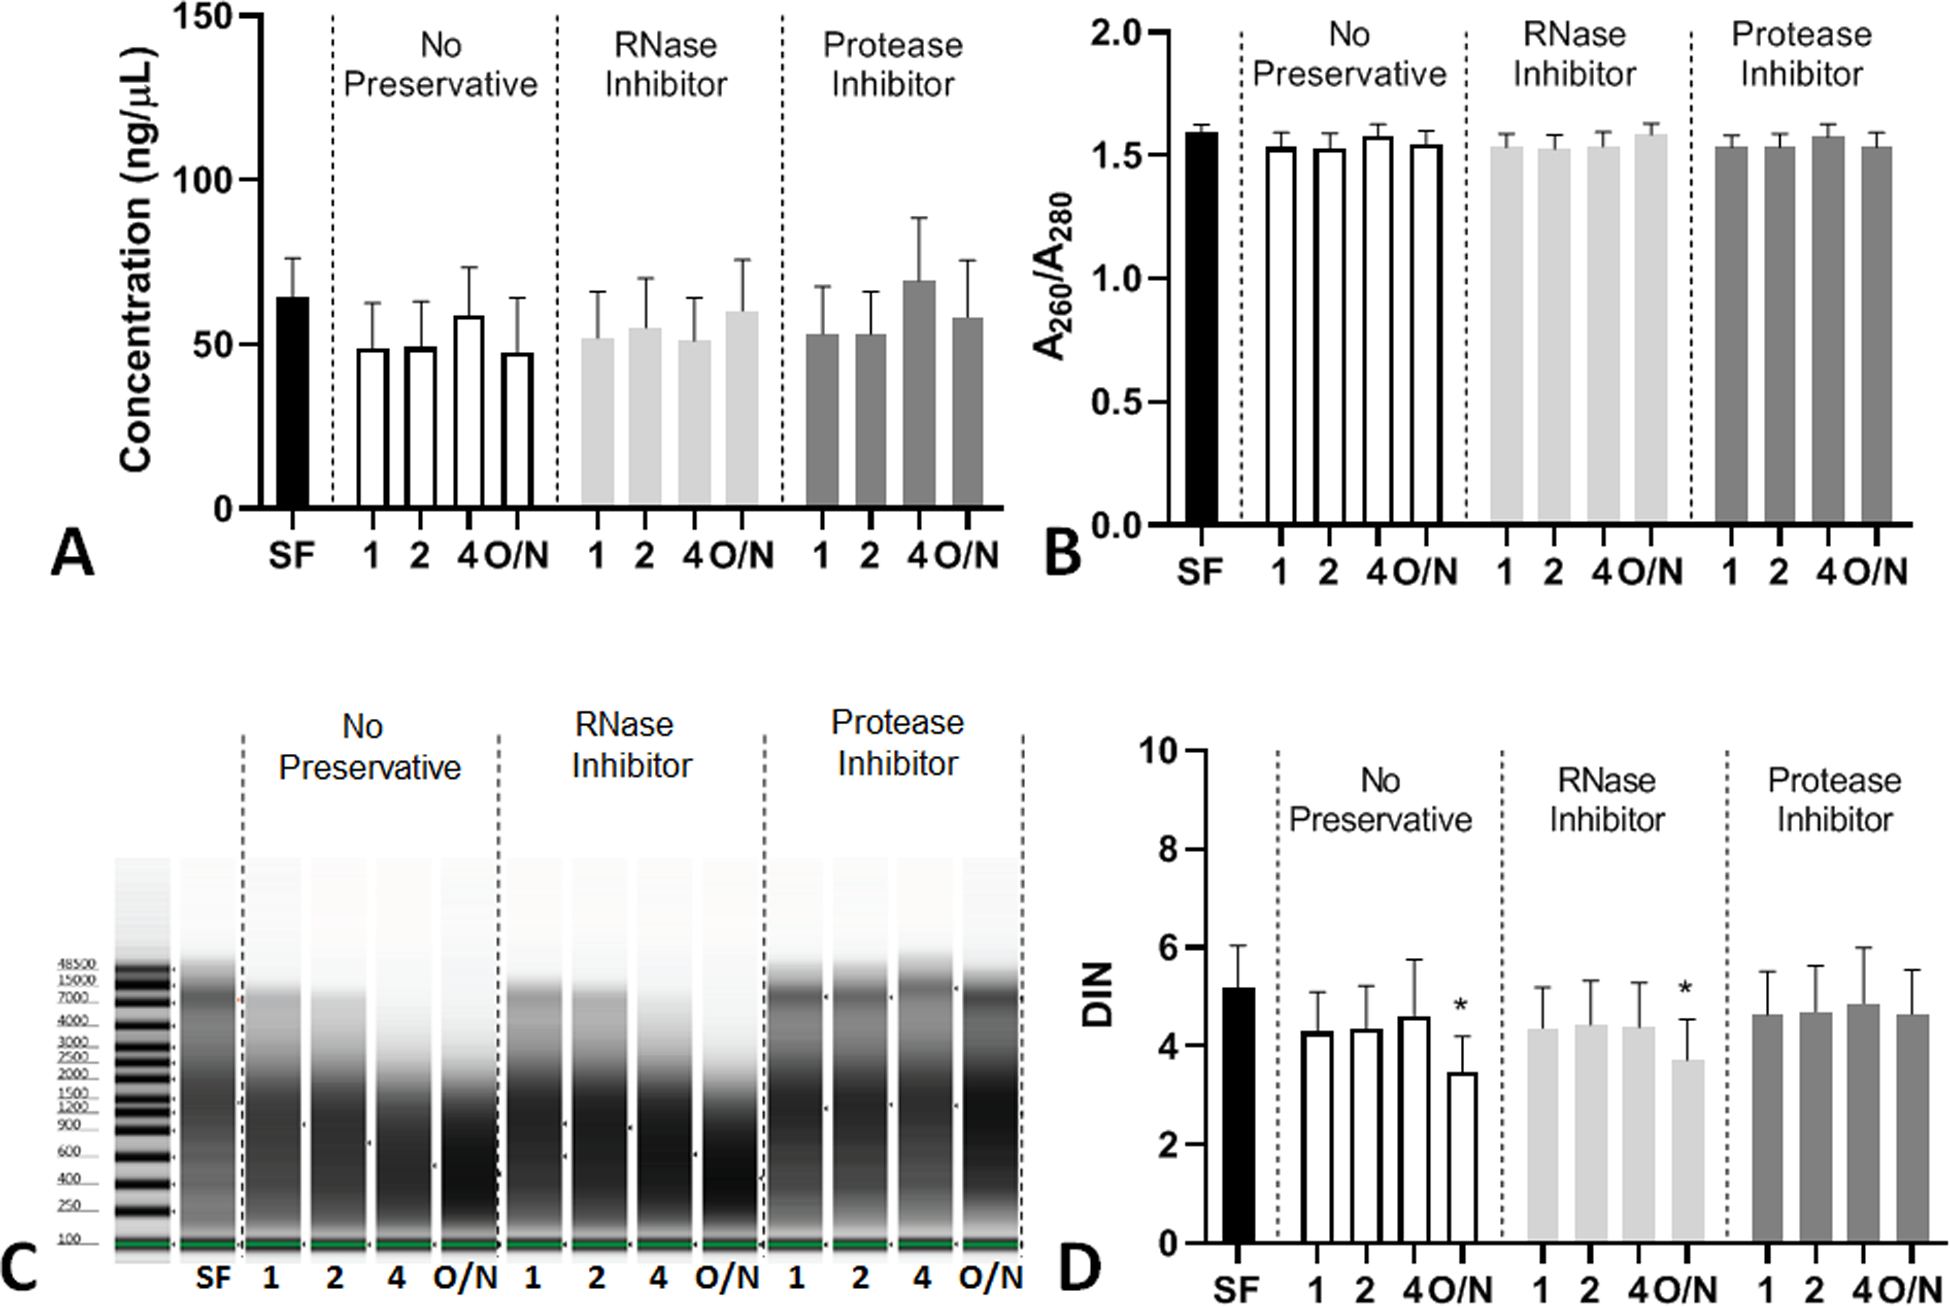
DNA was isolated from PF collected at 0–10 minutes after ePFT and treated with various conditions and measured for (A) DNA concentration (data for this graph was log transformed for statistical analysis), (B) DNA A260/A280 (purity), (C) representative DNA gel from the Bionalyzer utilized, and (D) DNA integrity number (DIN). All graphs are shown as the mean with error bars representing the standard error of the mean (SEM). *P ≤ 0.05 compared to SF.
Preservation of RNA in PF is suboptimal with current techniques
We then assessed alterations in PF-derived RNA concentration, quality, and integrity when compared to RNA isolated from a sample SF immediately after ePFT collection. We found that the concentration, quality, and integrity of the RNA was decreased in most of the studied conditions (Figure 5A–D). PI treatment significantly reduced RNA concentration and quality regardless of the time delay to storage at −80°C (Figure 5A–B). The RNA integrity number analysis showed that RNA degradation was high and variable, with all processing conditions including the SF control sample (Figure 5C–D). We found that time, but not the preservative, was a causative factor for RNA degradation as verified through a mixed effects model and Dunnett’s post-hoc test (P < 0.001). Some samples and conditions were more susceptible to RNA degradation than others as shown in (Supplemental Figure 5).
Figure 5: Concentration, quality, and integrity of RNA isolated from PF Samples.
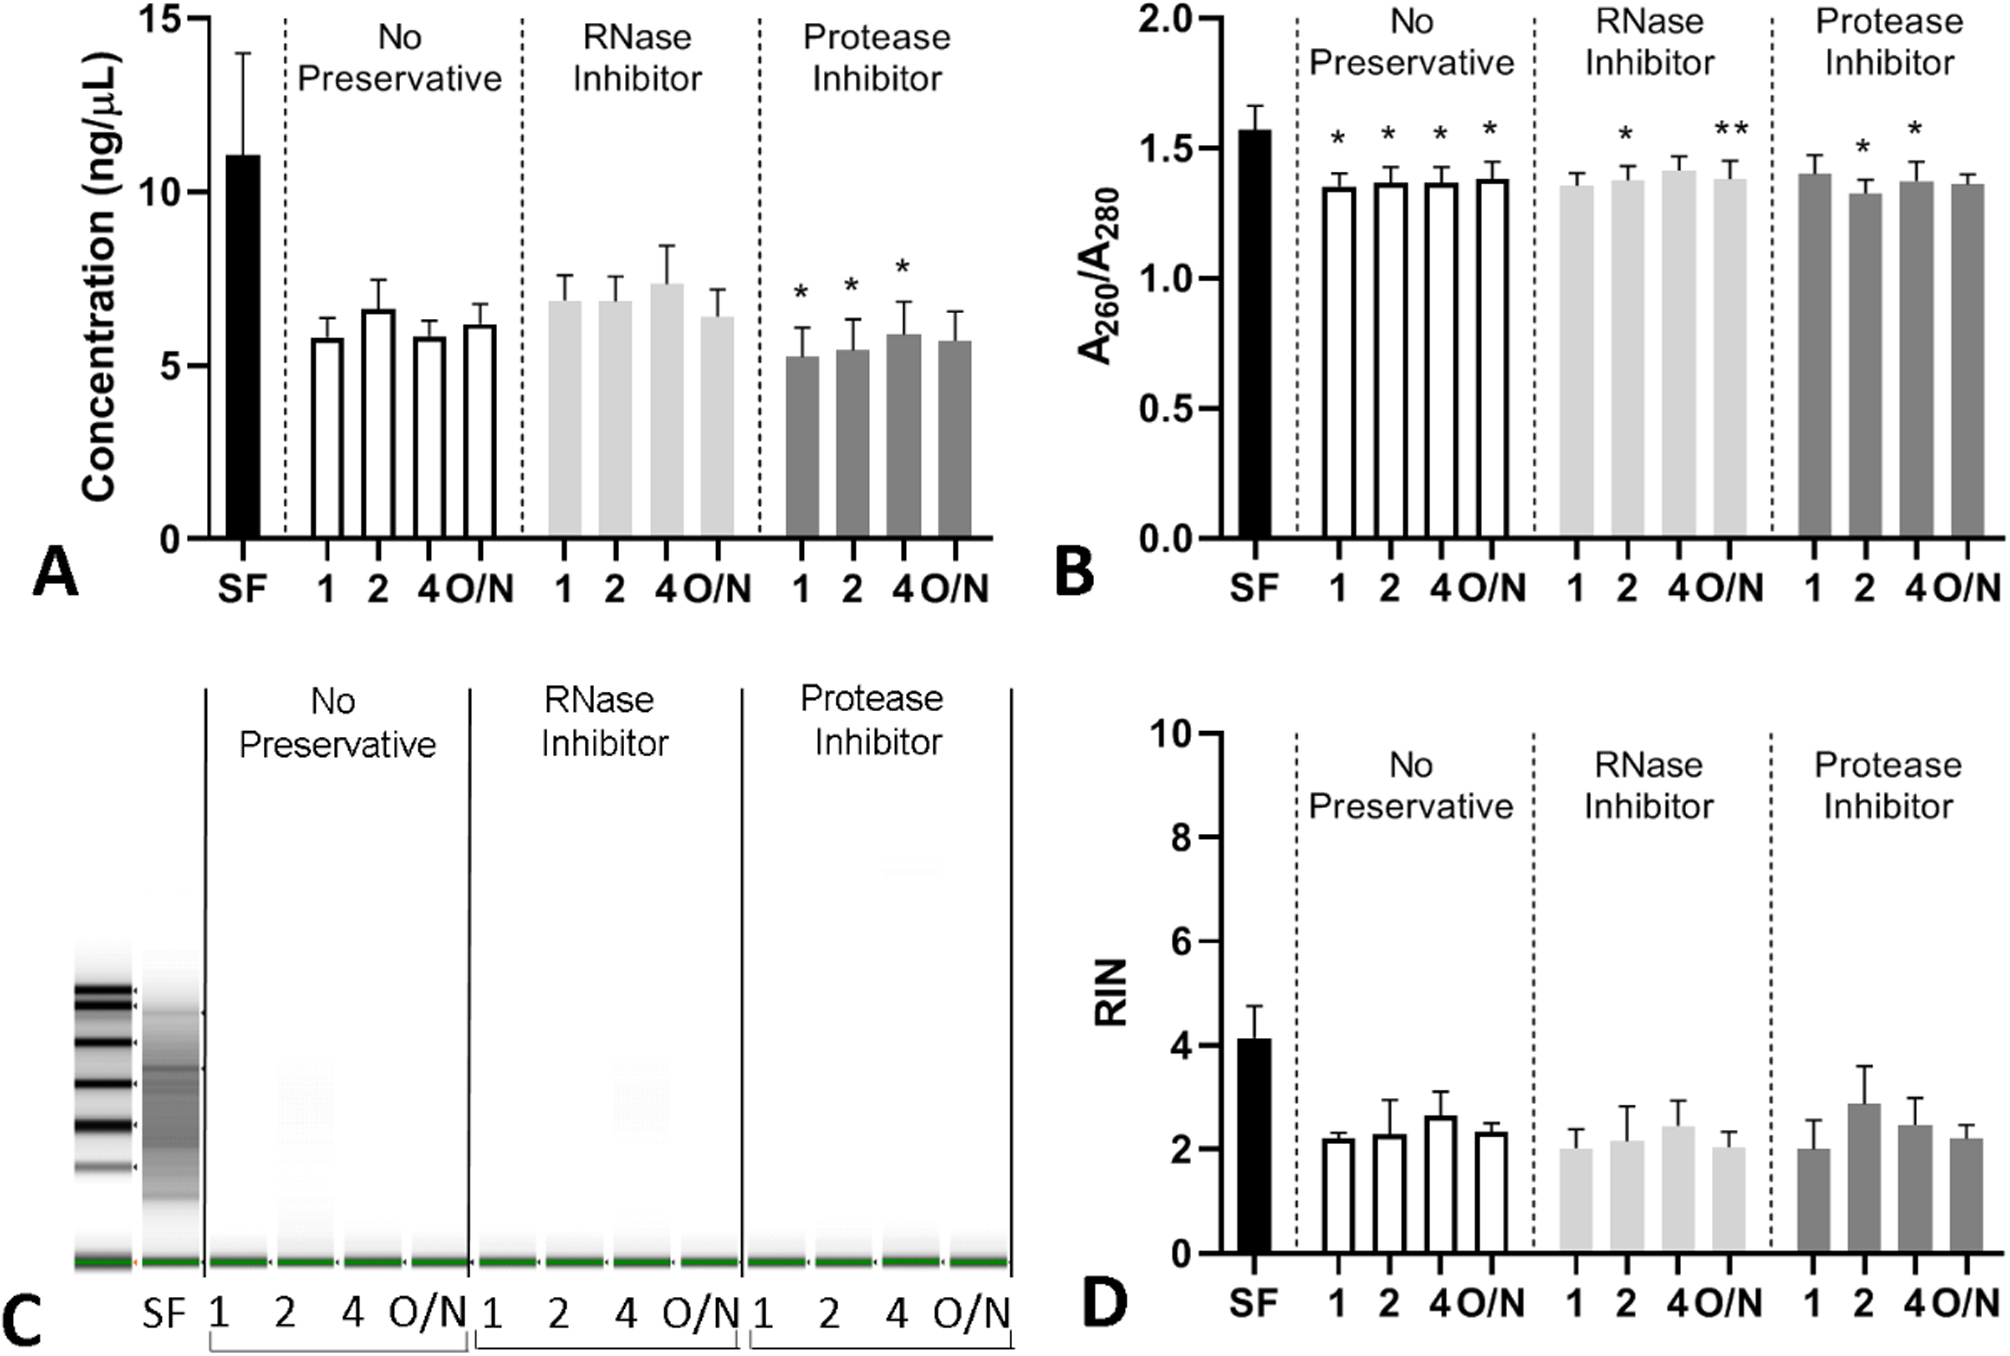
RNA was isolated from PF collected at 0–10 minutes after ePFT and treated with various conditions and measured for (A) RNA concentration (data for this graph was log transformed for statistical analysis), (B) RNA A260/A280 (purity), (C) representative RNA gel from the Bioanalyzer and (D) RNA integrity number (RIN). All graphs are shown as the mean with error bars representing the standard error of the mean (SEM). *P ≤ 0.05, **P ≤ 0.01 compared to SF.
The quality and concentration of the nucleic acids extracted from the PF depends on the method of isolation utilized
The DNA and RNA used in this study were isolated using an automated nucleic acid purification platform. Since this method may not be available in all laboratories and our intention is to provide efficient and economical standards for the analysis of PF, we compared the automated purification platform (Method 1) to a more common method of DNA isolation (Method 2) (Figure 6A–B). For both methods, the DNA quality was not significantly different when compared to the snap frozen control (Figure 6C–D) and was similar to the results observed in (Figure 4B) from the 0–10 minute collection when analyzed using Method 1. When we assessed the mixed effects model analysis, we found that the time to storage had an effect on the concentration of the DNA isolated from the PF for Method 1 (P = 0.006) and for Method 2 (P = 0.003) when one outlier observation from each analysis was excluded. The analysis also indicated that the time to storage may cause a difference in the DNA A260/A280 ratios for Method 1 (P = 0.043) but not Method 2. Preservation with RI or PI may also affect the concentration of DNA as it was close to significant (P = 0.054) for Method 2.
Figure 6: DNA isolation from pancreas fluid method comparison.
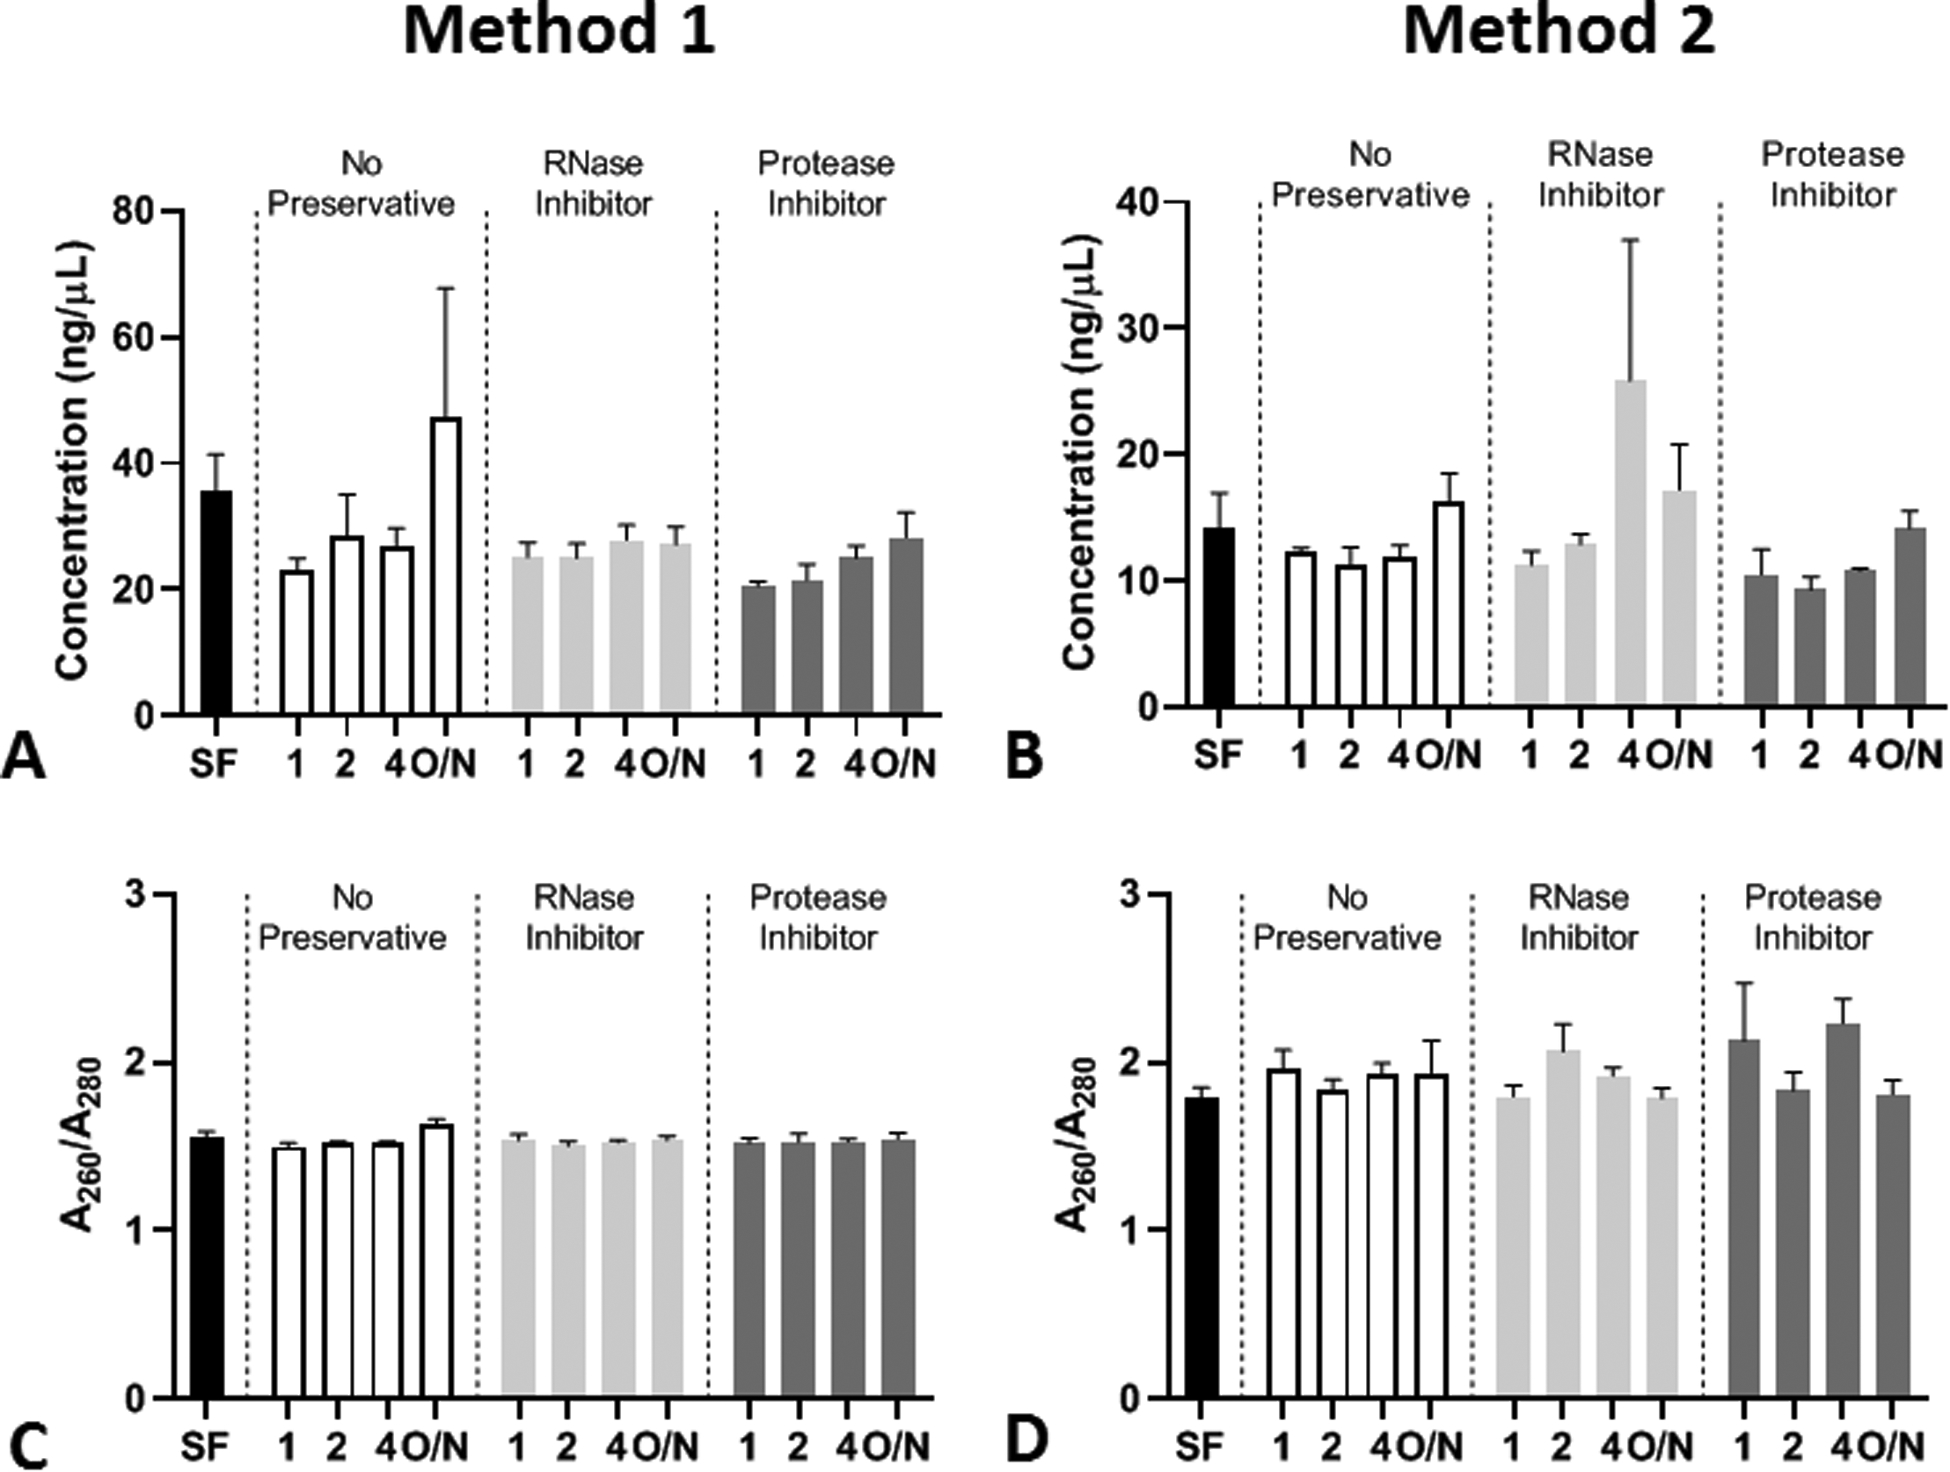
DNA was isolated from PF collected at 10–20 minutes after ePFT and treated with various conditions (n = 3). DNA concentrations using isolation method 1 (A) and method 2 (B). DNA A260/A280 (purity) values using isolation method 1 (C) and method 2 (D). Data presented as mean and error bars represent the standard error of the mean (SEM).
In addition, we compared two RNA isolation methods, one using an automated purification platform, (Method 1) and the other using the standard TRIzol Reagent method, (Method 2). RNA isolated using Method 2 yielded higher RNA concentrations and A260/A280 purity ratios than Method 1 (Figure 7A–D). The mixed effects model analysis indicated that the time to storage may cause a difference in the RNA concentration (P < 0.001), RIN (P = 0.01), and A260/A280 ratios (P < 0.001) regardless of the isolation method utilized. The mixed effects model analysis also indicated that the type of preservative may cause a difference in the A260/A280 ratios for TRIzol-isolated RNA (P = 0.054). Despite the low quality and integrity of the isolated RNA from PF samples, qRT-PCR analysis was still able to detect the levels of RNA transcripts of common housekeeping genes such as 18S ribosomal RNA (18S) (Figure 7E–F) and glyceraldehyde 3-phosphate dehydrogenase (GAPDH) (Figure 7G–H) regardless of the method of isolation utilized. Additionally, we did not see any specific intra-patient patterns in the 18S and GAPDH CT values from the RNA analyzed from 3 different subjects (Supplemental Figure 6). For subject 4, no amplification of 18S or GAPDH was observed in the 4 hr aliquot time point.
Figure 7: RNA isolation from pancreas fluid method comparison.
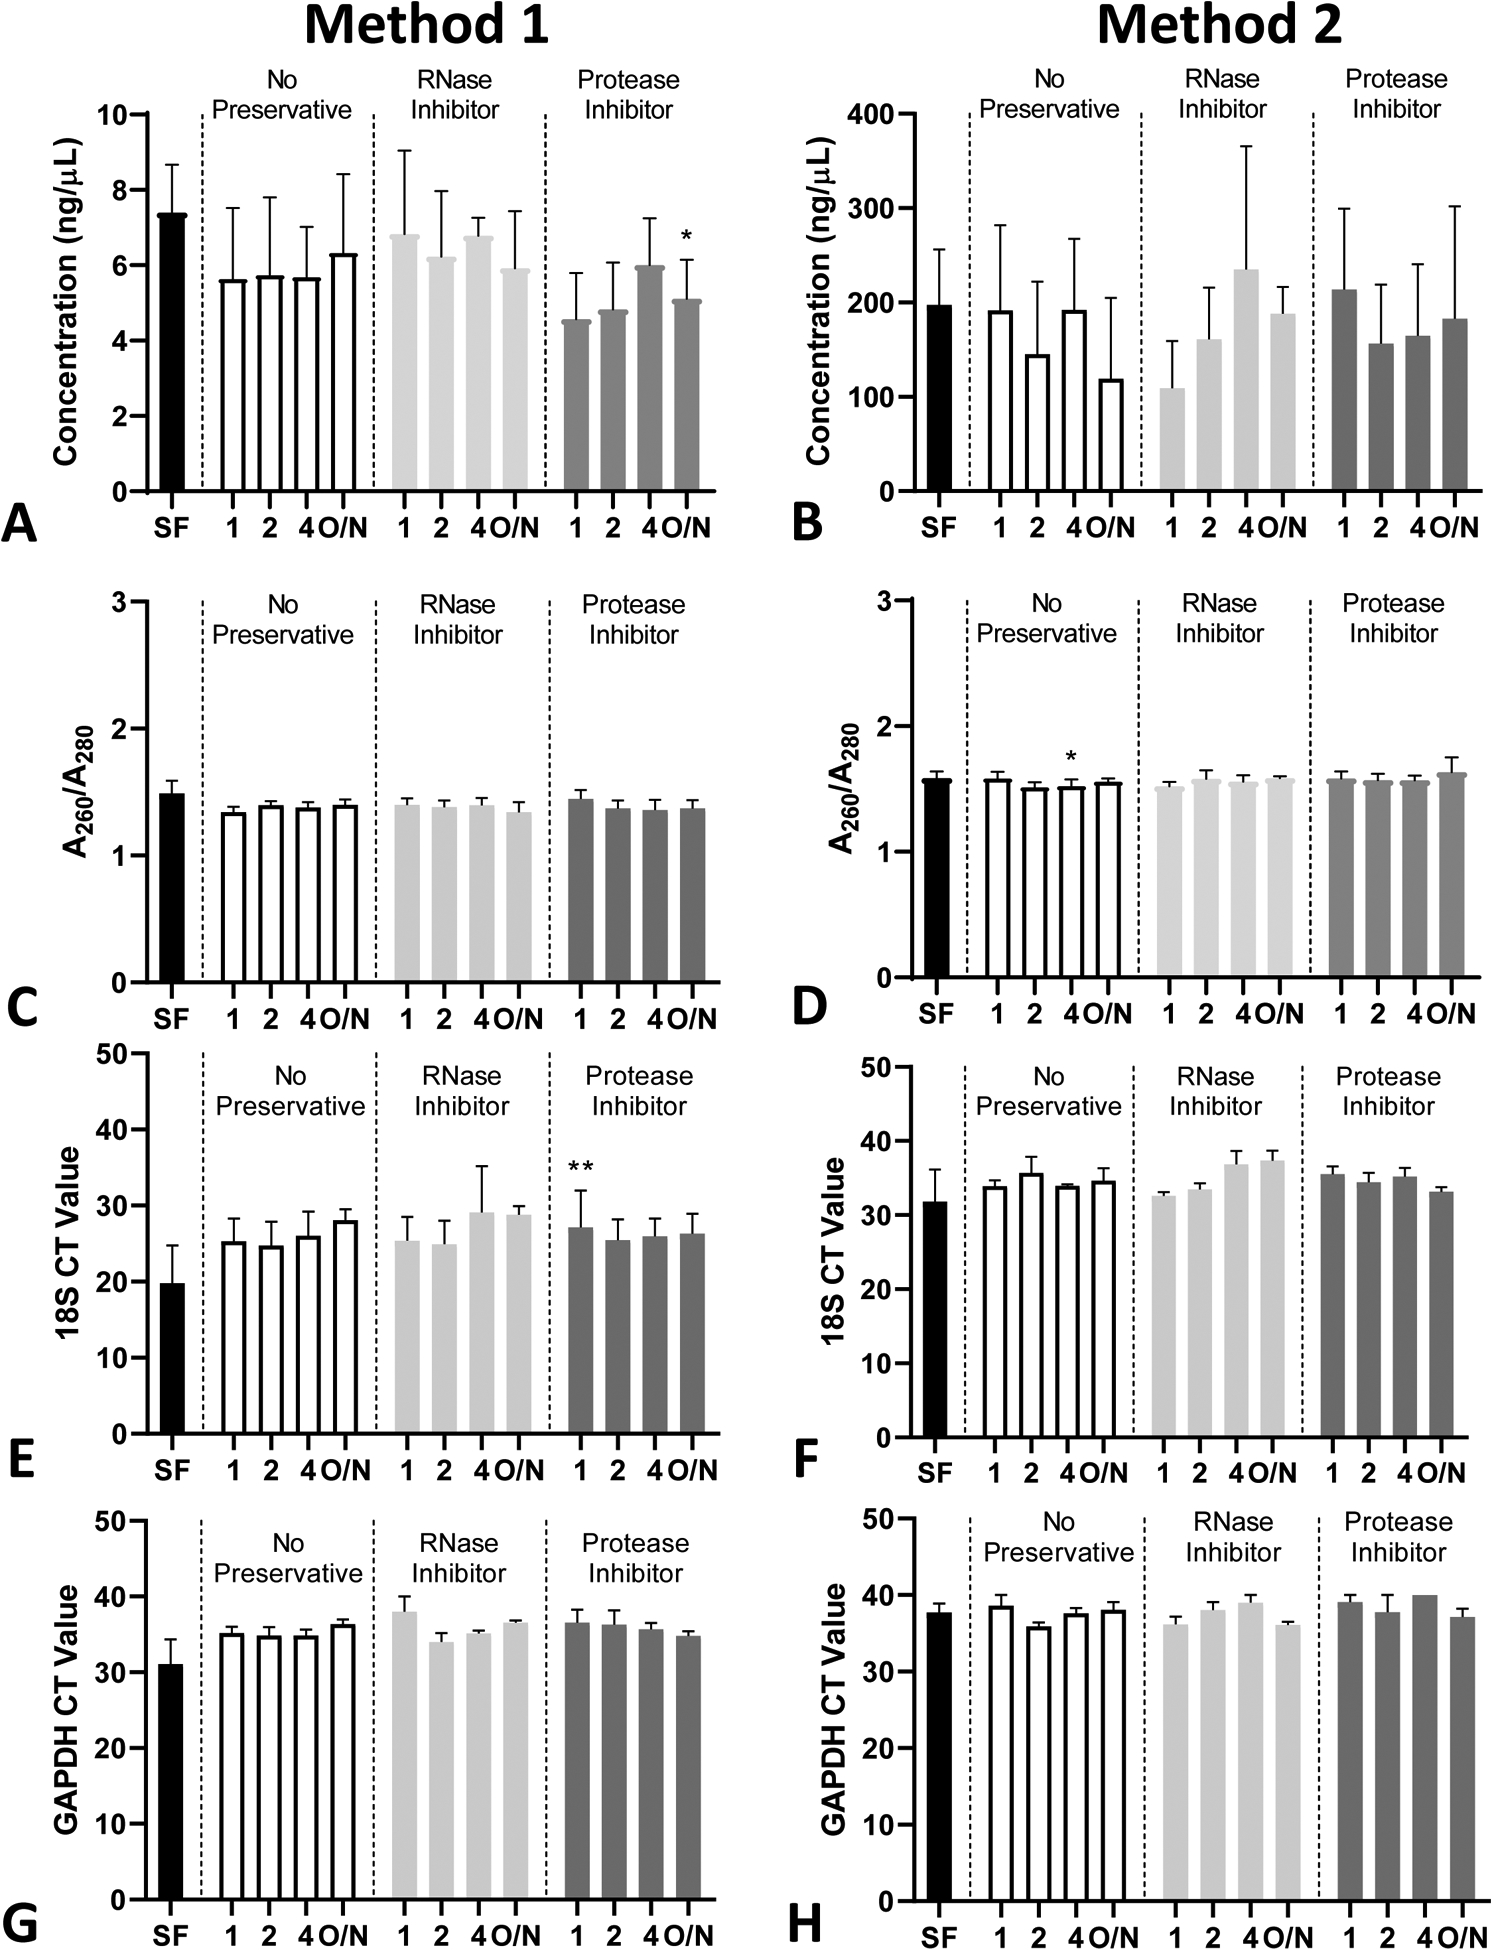
RNA was isolated from PF collected at 10–20 minutes after ePFT and treated with various conditions (n = 3). RNA concentrations using isolation method 1 (A) and method 2 (B). RNA A260/A280 (purity) values using isolation method 1 (C) and method 2 (D). (E-H) qRT-PCR method 1 (E, G) and method 2 (F, H) qRT-PCR for 18S (E, F) and GAPDH (G, H). Data presented as mean CT values and error bars represent the standard error of the mean (SEM) *P ≤ 0.05, **P ≤ 0.01 compared to SF.
Exosomes can be isolated from PF, but do not preserve RNA quality
In this study, the highest RINs (~ 4) from the PF-isolated RNA were observed in the SF conditions (Figure 5D), but this indicates levels of RNA high degradation, which is not compatible with high-throughput genomic analysis such as next-generation RNA sequencing. Therefore, we tested 1) whether exosomes could be isolated from the PF effectively, and 2) whether exosome-derived RNA was better preserved in quality and integrity compared to the RNA derived from the matched samples of total PF. Exosomes were successfully isolated from the PF with an average size of around 200 nm (Figure 8A). Inter-subject variation was observed in the concentration of RNA isolated from the exosomes in the PF (Figure 8B). There was a trend towards decreased concentration of RNA isolated from the exosomes compared to the RNA isolated from the same subject’s total PF sample (Figure 8B). The quality, remained relatively unchanged (Figure 8C and D), although the RIN of the RNA isolated was even lower (~ 2) for both types of RNA than we previously observed (Figure 5D). This could be the result of using a different exosome RNA isolation protocol. However, we used this same protocol to isolate total RNA from the matched PF aliquot control samples to make sure the isolation method was not an additional variable in our exosome RNA study. qRT-PCR analysis indicated successful amplification of housekeeping genes in both the total and the exosome-derived RNA (Figure 8E) despite the poor quality. No significant differences were observed between the RNA isolated from total PF or from the exosomes of the same subject and time point (30 min) of ePFT collection (Figure 1A).
Figure 8: RNA isolation from PF-derived exosomes compared to total fluid.
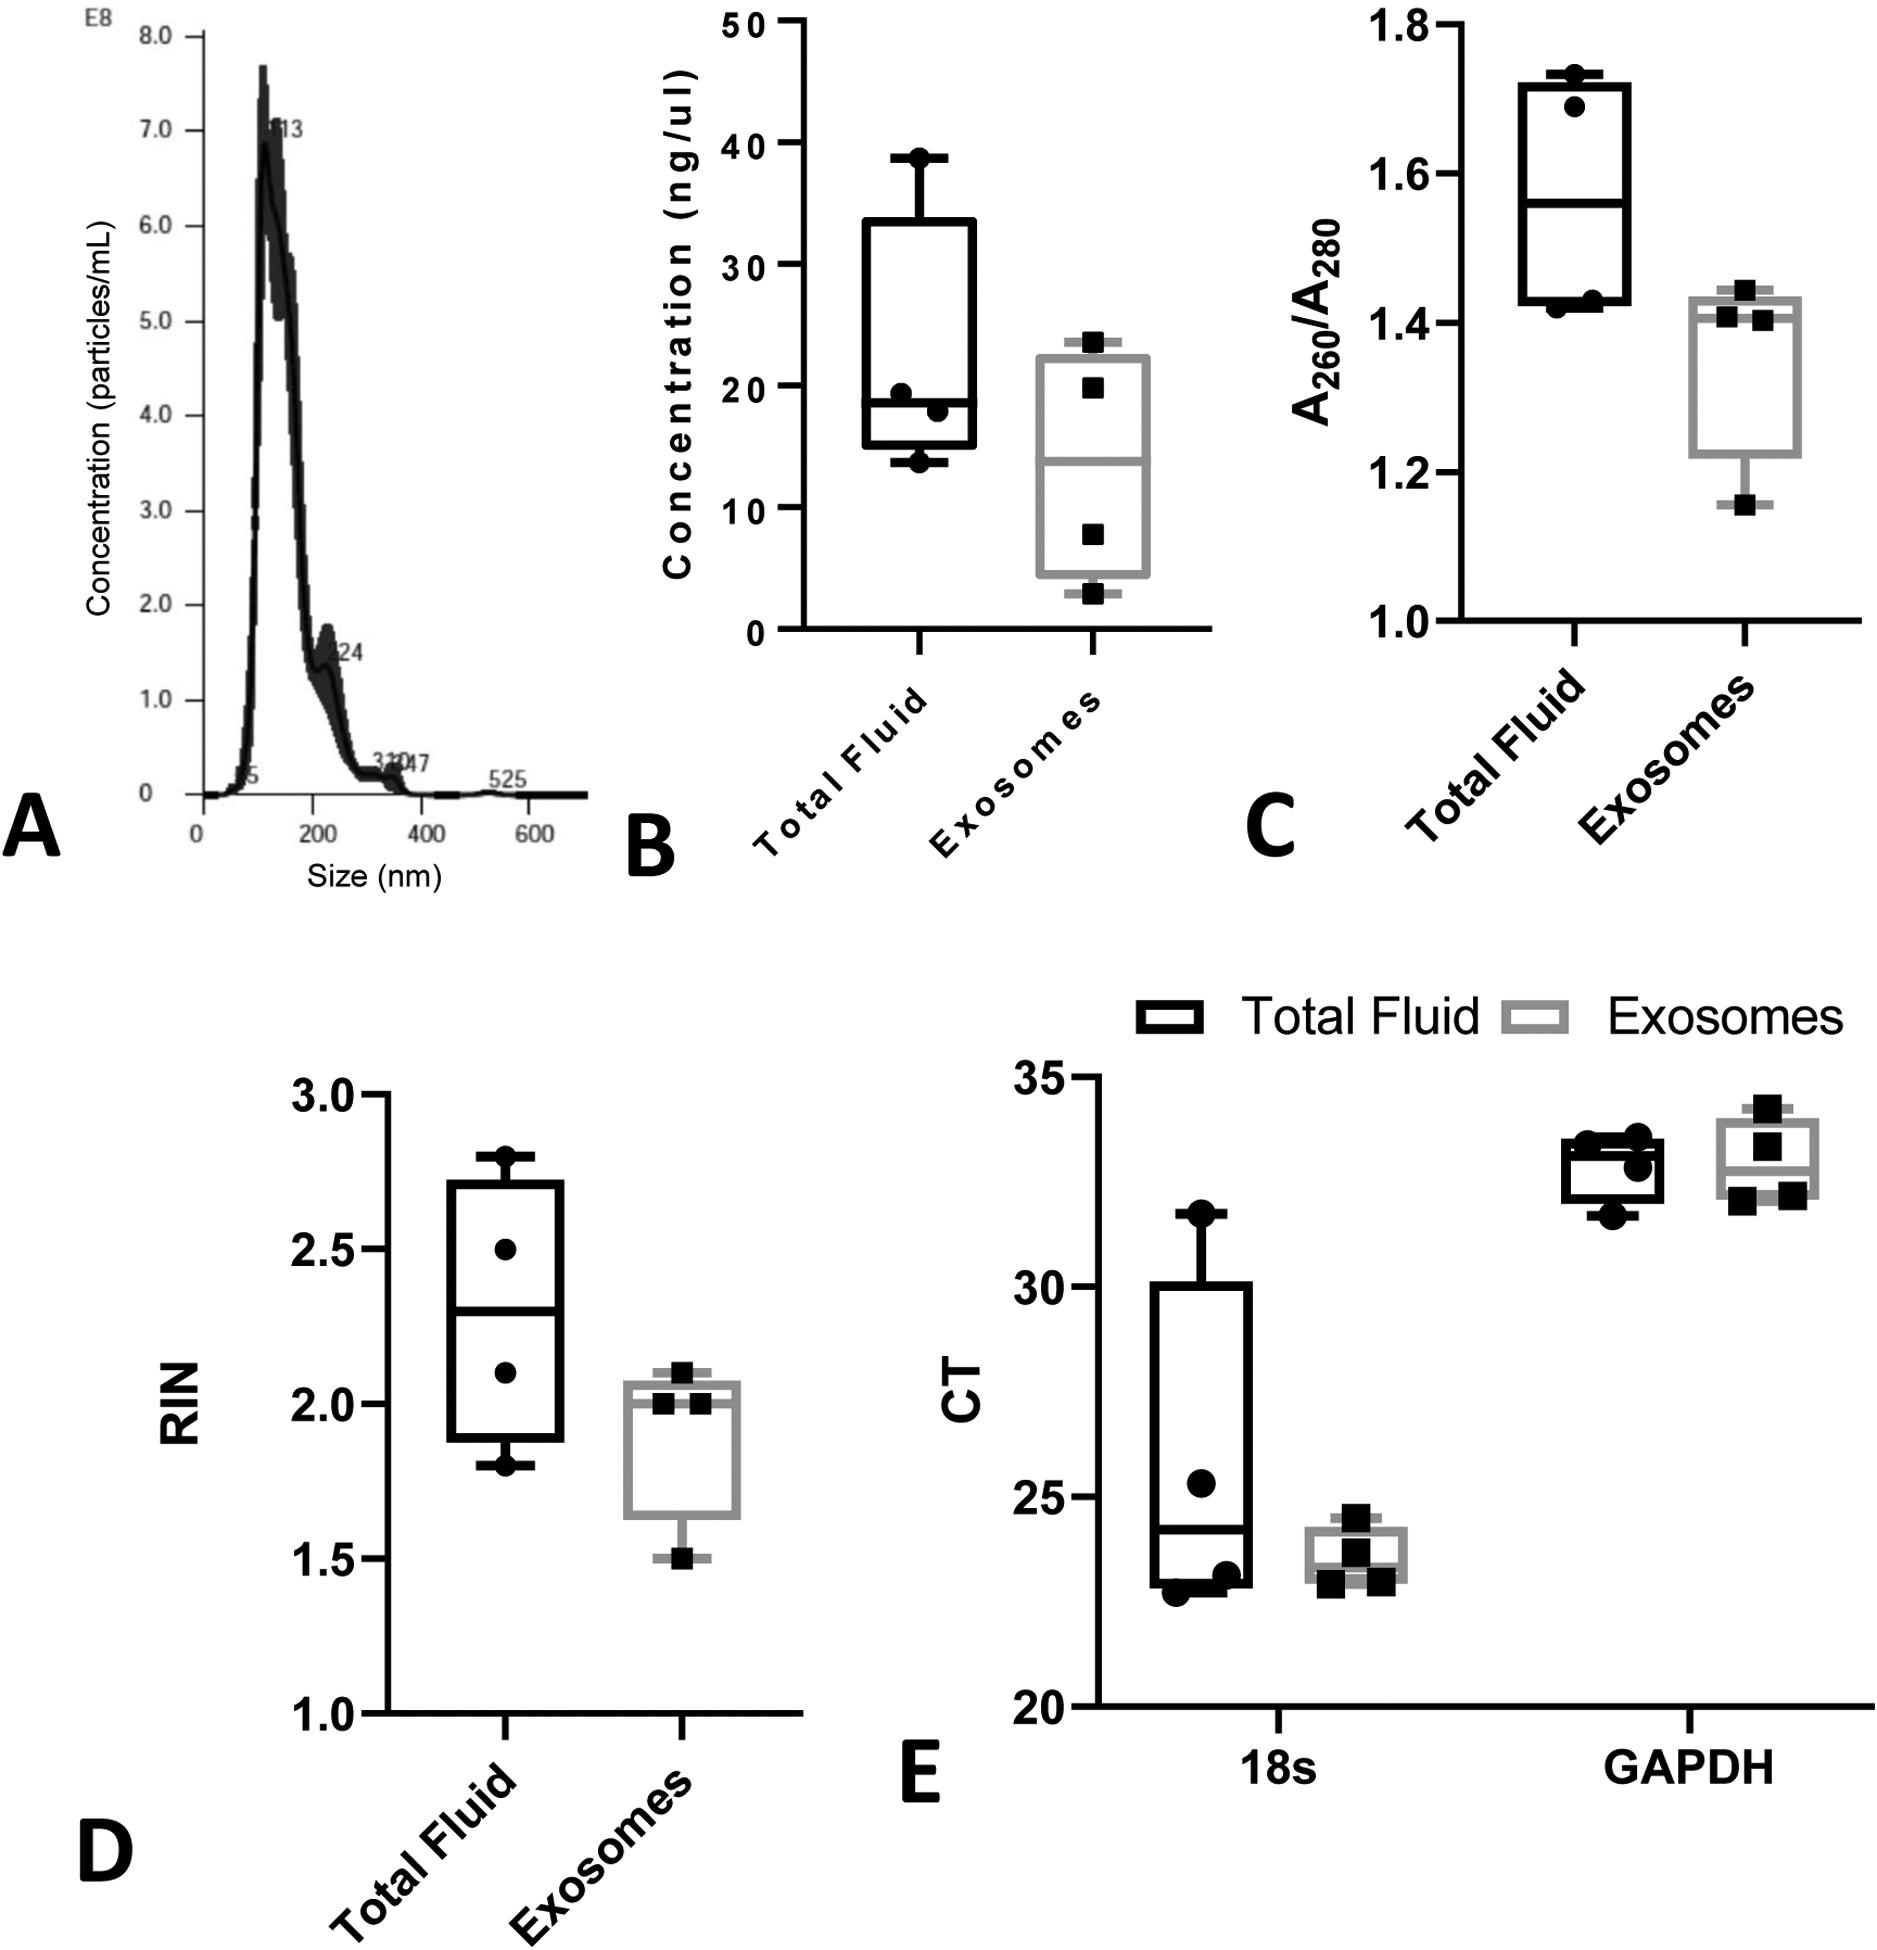
RNA was isolated from exosomes derived from PF and total PF collected at 30 min after ePFT that was SF immediately after collection (n = 4). (A) Presence of exosomes was verified by size characterization. (B) The concentration and (C) quality of RNA obtained was determined. (D) RNA Integrity Number (RIN) and (E) CT values of housekeeping genes 18s and GAPDH was assessed for the usability of RNA in detecting common genes via qRT-PCR.
Discussion
Current collaborative efforts within the Consortium for the Study of Chronic Pancreatitis, Diabetes, and Pancreatic Cancer (CPDPC) have focused on the establishment of a robust biorepository containing a variety of biospecimens, including PF.19, 26 These efforts aimed at improving future research efforts in the identification of potential biomarkers and therapeutic targets for pancreatic diseases, specifically chronic pancreatitis and pancreatic ductal adenocarcinoma. The current study used proteomics and nucleic acid analyses to evaluate the relative merits of preservation, handling, and isolation methods of proteins and nucleic acids from PF samples collected during ePFT to determine if less rigorous methods would compromise the analyses. Overall, we showed the addition of PIs preserved the quality and integrity of proteins and DNA isolated from PF, even after increasing delays in processing times during which samples were kept on ice up to 4 hrs before storage at −80°C. We also compared two nucleic acid isolation methods for both DNA and RNA to determine if one isolation method was better for PF samples. We found that the automated purification method resulted in higher DNA quality and integrity; however, the traditional TRIzol-based method produced the best concentration and quality of RNA.
Proteomics analyses provide a large-scale, unbiased approach to identifying protein changes between samples, such as between healthy subjects and subjects with a particular disease of interest. Previously established PF protein processing recommendations either require immediate storage at −80°C,27 immediate use,28 or, more recently, incubation on ice for up to 8 hours in the presence of PIs followed by TCA precipitation for quality protein based on SDS-PAGE analysis.13, 18, 29 Since some clinicians who perform ePFT do not have immediate access to a −80°C freezer or a proximal laboratory for sample processing, we wanted to verify prior findings and test new conditions related to time limitations and processing delays that could potentially affect the degradation of PF samples in ultralow temperature conditions. We showed that the addition of PIs preserved the protein quality, reducing the differences observed between immediately snap frozen (i.e., the ideal condition) and non-ideal preservation methods of keeping the samples on ice for several hours before storage in ultralow temperature conditions (Figure 1B). Based on LC-MS/MS proteomic analyses, we are confident that the addition of PIs immediately after ePFT collection will reduce inter-sample variability caused by delays in sample processing and −80°C storage, assuming samples remain on ice or at 4°C.
Large-scale nucleic acid analyses like genome-wide association studies (GWAS) and RNA-seq have become popular methods for studying the genetic contributions to a disease.30 However, these bioinformatics studies rely on and assume consistent sample collection and good quality of the sample utilized for the analysis, data mining, and the accurate interpretation of results. However, PF analyses using these novel genomic methods are challenging due to the low quality and integrity of RNA that can be isolated from the PF. Studies using PF have used the more invasive endoscopic retrograde cholangiopancreatography (ERCP) or endoscopic nasopancreatic drainage methods for PF collection with the intent of performing downstream analysis on nucleic acids. However, studies do not always specify the details of how samples were processed and stored before nucleic acid isolation31 or might otherwise require immediate storage at −80°C.32 Here, we used the less invasive ePFT method for collecting PF to study and optimize the processing methods for consistent quality DNA by adding PIs that seem to enhance the stability of the DNA if it cannot be immediately snap-frozen (Figure 4). We attempted to simplify the preservation processing through the addition of broad-spectrum PI and RIs cocktails however, batching PF for protein and DNA may allow for even higher quality and concentration of DNA than the methods recommended herein.
Although PIs preserved protein and DNA quality in our study, these conditions did not preserve RNA quality (Figure 5). This is not surprising as the amount of RNases in the pancreas is significantly high. Other studies on RNA isolation methods from PF tried freezing the samples at −20°C or −80°C, suggesting that this may be the only method for RNA preservation33. Even so, quality and integrity are consistently low among reports.34 In the current study, even though the RNA quality and integrity are low, we were able to obtain qRT-PCR data of common housekeeping genes studied in the field (Figure 7). These results suggest the feasibility of using the poor quality RNA for some assays in pancreatic diseases research. As innovative research platforms for genomic studies are continually developed, new opportunities for usage of lower quality RNA samples may allow for its used.
Previous studies with PF isolated DNA using a standardized column centrifugation method,35, 36 while RNA was isolated using a TRIzol phase separation method.33, 37 In this study, we compared an automated magnetic bead technology processing for both the isolation of DNA and RNA to the more conventional methods. We found the automated magnetic isolation process resulted in a higher concentrated, lower quality DNA (Figure 4), but a lower concentrated, higher quality RNA (Figure 5) from PF when compared to the more standard DNA and RNA isolation protocols.
Since exosome membranes are derived from the cells they emerge from, they may be a unique asset to pancreatic disease biomarker research.38, 39 For example, a group isolated exosomes from PF collected by endoscopic retrograde pancreatography and immediately froze the samples to assess the expression of miRNAs as possible biomarkers of PDAC.40 Since RNA is highly unstable, and since our data suggested snap freezing the sample after ePFT was the only method to generate high-quality RNA consistently, we wanted to test whether exosomes preserved the RNA in PF. Although we were able to isolate exosomes from PF and RNA from those exosomes and use it for qRT-PCR, there was variability in the quality and quantity of the RNA isolated from the exosome present in the PF (Figure 8). Therefore, further studies are needed to determine optimal preservation and processing methods for exosomal RNA isolation from ePFT; in the interim samples are likely only useful if they are immediately snap frozen.
To our knowledge, this is the first study that comprehensively assesses how collection and storage conditions of PF affect the quality and integrity of both protein and nucleic acids isolated from the PF. Based on our data and in conjunction with previous studies on PF in the literature, we recommend that protease inhibitors be added to PF immediately after collection. If this cannot be achieved, then it is recommended that samples are kept on ice (or at 4°C), and stored at ultralow temperatures within 4 hours to minimize the degradation of proteins and nucleic acids. We are hopeful these comparative analyses will help improve the quality of PF sample collection, processing, and storage, to ultimately improve the likelihood of discovering and validating novel biomarkers of pancreatic diseases.41
Supplementary Material
Acknowledgements:
We thank The Ohio State University Genomics Shared Resource (GRS) for the RNA and DNA sample quality control and the Proteomics Shared Resource (PSR) funded by the NCI Cancer Center Support Grant P30 CA016058. We also thank the GHN clinical coordinators who assisted in subject recruitment and regulatory management of this study. This work was also supported by the Pelotonia Fellowship Program. Any opinions, findings, and conclusions expressed in this material are those of the author(s) and do not necessarily reflect those of the Pelotonia Fellowship Program or The Ohio State University.
Grant support: Research in this publication was supported by: The National Pancreas Foundation (ZC-M), The National Cancer Institute (NCI) R01CA223204 (ZC-M), and by the NCI and National Institute of Diabetes and Digestive and Kidney Diseases (NIDDK) under award number U01DK108327 (DC, ZC-M, PH, LL, Krishna, HS), U01DK108306 (DY). This work was also supported in part by the Pelotonia Fellowship Program (Kaul and KD), by grant P30 CA016058 NCI and by the ChiRhoClin Research Institute, Inc. The content is solely the responsibility of the authors and does not necessarily represent the official views of the National Pancreas Foundation, the National Institutes of Health, the Pelotonia Fellowship Program or the ChiRhoClin Research Institute.
Footnotes
Conflict of interest/disclosures: ZC-M, PH, GL, and DH received pilot funds from ChiRhoClin Research Institute, Inc.
Literature Cited
- 1.Serrano J, Andersen DK, Forsmark CE, et al. Consortium for the Study of Chronic Pancreatitis, Diabetes, and Pancreatic Cancer: From Concept to Reality. Pancreas. Nov-Dec 2018;47:1208–1212. [DOI] [PMC free article] [PubMed] [Google Scholar]
- 2.Whitcomb DC, Frulloni L, Garg P, et al. Chronic pancreatitis: An international draft consensus proposal for a new mechanistic definition. Pancreatology. Mar-Apr 2016;16:218–224. [DOI] [PMC free article] [PubMed] [Google Scholar]
- 3.Hasan S, Jacob R, Manne U, et al. Advances in pancreatic cancer biomarkers. Oncol Rev. January 14 2019;13:410. [DOI] [PMC free article] [PubMed] [Google Scholar]
- 4.Forsmark CE. The early diagnosis of chronic pancreatitis. Clin Gastroenterol Hepatol. December 2008;6:1291–1293. [DOI] [PubMed] [Google Scholar]
- 5.Dupuis CS, Baptista V, Whalen G, et al. Diagnosis and management of acute pancreatitis and its complications. Gastrointestinal Intervention. 2013;2:36–46. [Google Scholar]
- 6.Hart PA, Topazian M, Raimondo M, et al. Endoscopic Pancreas Fluid Collection: Methods and Relevance for Clinical Care and Translational Science. Am J Gastroenterol. September 2016;111:1258–1266. [DOI] [PMC free article] [PubMed] [Google Scholar]
- 7.Conwell DL, Lee LS, Yadav D, et al. American Pancreatic Association Practice Guidelines in Chronic Pancreatitis: evidence-based report on diagnostic guidelines. Pancreas. November 2014;43:1143–1162. [DOI] [PMC free article] [PubMed] [Google Scholar]
- 8.Whitcomb DC, Shimosegawa T, Chari ST, et al. International consensus statements on early chronic Pancreatitis. Recommendations from the working group for the international consensus guidelines for chronic pancreatitis in collaboration with The International Association of Pancreatology, American Pancreatic Association, Japan Pancreas Society, PancreasFest Working Group and European Pancreatic Club. Pancreatology. May 21 2018; [DOI] [PMC free article] [PubMed] [Google Scholar]
- 9.Kuhlmann L, Olesen SS, Olesen AE, et al. Mechanism-based pain management in chronic pancreatitis - is it time for a paradigm shift? Expert Rev Clin Pharmacol. March 2019;12:249–258. [DOI] [PubMed] [Google Scholar]
- 10.Wu B, Conwell DL. The endoscopic pancreatic function test. Am J Gastroenterol. October 2009;104:2381–2383. [DOI] [PubMed] [Google Scholar]
- 11.Paulo JA, Kadiyala V, Gaun A, et al. Analysis of endoscopic pancreatic function test (ePFT)-collected pancreatic fluid proteins precipitated via ultracentrifugation. JOP. March 10 2013;14:176–186. [DOI] [PMC free article] [PubMed] [Google Scholar]
- 12.Paulo JA, Kadiyala V, Brizard S, et al. Post-translational modifications of pancreatic fluid proteins collected via the endoscopic pancreatic function test (ePFT). J Proteomics. October 30 2013;92:216–227. [DOI] [PMC free article] [PubMed] [Google Scholar]
- 13.Paulo JA, Lee LS, Wu B, et al. Identification of pancreas-specific proteins in endoscopically (endoscopic pancreatic function test) collected pancreatic fluid with liquid chromatography--tandem mass spectrometry. Pancreas. August 2010;39:889–896. [DOI] [PMC free article] [PubMed] [Google Scholar]
- 14.Conwell DL, Zuccaro G, Morrow JB, et al. Analysis of duodenal drainage fluid after cholecystokinin (CCK) stimulation in healthy volunteers. Pancreas. November 2002;25:350–354. [DOI] [PubMed] [Google Scholar]
- 15.Conwell DL, Zuccaro G Jr., Vargo JJ, et al. An endoscopic pancreatic function test with synthetic porcine secretin for the evaluation of chronic abdominal pain and suspected chronic pancreatitis. Gastrointest Endosc. January 2003;57:37–40. [DOI] [PubMed] [Google Scholar]
- 16.Conwell DL, Zuccaro G, Purich E, et al. The effect of moderate sedation on exocrine pancreas function in normal healthy subjects: a prospective, randomized, cross-over trial using the synthetic porcine secretin stimulated Endoscopic Pancreatic Function Test (ePFT). Am J Gastroenterol. May 2005;100:1161–1166. [DOI] [PubMed] [Google Scholar]
- 17.Uc A, Andersen DK, Bellin MD, et al. Chronic Pancreatitis in the 21st Century - Research Challenges and Opportunities: Summary of a National Institute of Diabetes and Digestive and Kidney Diseases Workshop. Pancreas. November 2016;45:1365–1375. [DOI] [PMC free article] [PubMed] [Google Scholar]
- 18.Paulo JA, Lee LS, Wu B, et al. Optimized sample preparation of endoscopic collected pancreatic fluid for SDS-PAGE analysis. Electrophoresis. July 2010;31:2377–2387. [DOI] [PMC free article] [PubMed] [Google Scholar]
- 19.Fisher WE, Cruz-Monserrate Z, McElhany AL, et al. Standard Operating Procedures for Biospecimen Collection, Processing, and Storage: From the Consortium for the Study of Chronic Pancreatitis, Diabetes, and Pancreatic Cancer. Pancreas. Nov-Dec 2018;47:1213–1221. [DOI] [PMC free article] [PubMed] [Google Scholar]
- 20.Tabb DL, Fernando CG, Chambers MC. MyriMatch: highly accurate tandem mass spectral peptide identification by multivariate hypergeometric analysis. J Proteome Res. February 2007;6:654–661. [DOI] [PMC free article] [PubMed] [Google Scholar]
- 21.Eng JK, Jahan TA, Hoopmann MR. Comet: an open-source MS/MS sequence database search tool. Proteomics. January 2013;13:22–24. [DOI] [PubMed] [Google Scholar]
- 22.Craig R, Beavis RC. TANDEM: matching proteins with tandem mass spectra. Bioinformatics. June 12 2004;20:1466–1467. [DOI] [PubMed] [Google Scholar]
- 23.Elias JE, Gygi SP. Target-decoy search strategy for increased confidence in large-scale protein identifications by mass spectrometry. Nat Methods. March 2007;4:207–214. [DOI] [PubMed] [Google Scholar]
- 24.Rost HL, Sachsenberg T, Aiche S, et al. OpenMS: a flexible open-source software platform for mass spectrometry data analysis. Nat Methods. August 30 2016;13:741–748. [DOI] [PubMed] [Google Scholar]
- 25.Serang O, Noble WS. Faster mass spectrometry-based protein inference: junction trees are more efficient than sampling and marginalization by enumeration. IEEE/ACM Trans Comput Biol Bioinform. May-Jun 2012;9:809–817. [DOI] [PMC free article] [PubMed] [Google Scholar]
- 26.Yadav D, Park WG, Fogel EL, et al. PROspective Evaluation of Chronic Pancreatitis for EpidEmiologic and Translational StuDies: Rationale and Study Design for PROCEED From the Consortium for the Study of Chronic Pancreatitis, Diabetes, and Pancreatic Cancer. Pancreas. Nov-Dec 2018;47:1229–1238. [DOI] [PMC free article] [PubMed] [Google Scholar]
- 27.Gronborg M, Bunkenborg J, Kristiansen TZ, et al. Comprehensive proteomic analysis of human pancreatic juice. J Proteome Res. Sep-Oct 2004;3:1042–1055. [DOI] [PubMed] [Google Scholar]
- 28.Paulo JA, Lee LS, Wu B, et al. Cytokine profiling of pancreatic fluid using the ePFT collection method in tandem with a multiplexed microarray assay. Journal of Immunological Methods. 2011;369:98–107. [DOI] [PMC free article] [PubMed] [Google Scholar]
- 29.Paulo JA, Lee LS, Wu B, et al. Mass spectrometry-based proteomics of endoscopically collected pancreatic fluid in chronic pancreatitis research. Proteomics Clin Appl. April 2011;5:109–120. [DOI] [PMC free article] [PubMed] [Google Scholar]
- 30.Narayanan R Phenome-genome association studies of pancreatic cancer: new targets for therapy and diagnosis. Cancer Genomics Proteomics. Jan-Feb 2015;12:9–19. [PubMed] [Google Scholar]
- 31.Mateos RN, Nakagawa H, Hirono S, et al. Genomic analysis of pancreatic juice DNA assesses malignant risk of intraductal papillary mucinous neoplasm of pancreas. Cancer Medicine. 2019;8:4565–4573. [DOI] [PMC free article] [PubMed] [Google Scholar]
- 32.Ohtsubo K, Watanabe H, Yao F, et al. Preproenkephalin hypermethylation in the pure pancreatic juice compared with p53 mutation in the diagnosis of pancreatic carcinoma. J Gastroenterol. August 2006;41:791–797. [DOI] [PubMed] [Google Scholar]
- 33.Sadakari Y, Ohtsuka T, Ohuchida K, et al. MicroRNA expression analyses in preoperative pancreatic juice samples of pancreatic ductal adenocarcinoma. JOP. November 9 2010;11:587–592. [PubMed] [Google Scholar]
- 34.Ohuchida K, Mizumoto K, Ogura Y, et al. Quantitative assessment of telomerase activity and human telomerase reverse transcriptase messenger RNA levels in pancreatic juice samples for the diagnosis of pancreatic cancer. Clin Cancer Res. March 15 2005;11:2285–2292. [DOI] [PubMed] [Google Scholar]
- 35.Hilmer AJ, Jeffrey RB, Park WG, et al. Cholestyramine as a promising, strong anion exchange resin for direct capture of genetic biomarkers from raw pancreatic fluids. Biotechnology and Bioengineering. 2017;114:934–938. [DOI] [PMC free article] [PubMed] [Google Scholar]
- 36.Choi MH, Mejlaender-Andersen E, Manueldas S, et al. Mutation analysis by deep sequencing of pancreatic juice from patients with pancreatic ductal adenocarcinoma. BMC Cancer. January 5 2019;19:11. [DOI] [PMC free article] [PubMed] [Google Scholar]
- 37.Wang J, Raimondo M, Guha S, et al. Circulating microRNAs in Pancreatic Juice as Candidate Biomarkers of Pancreatic Cancer. J Cancer. 2014;5:696–705. [DOI] [PMC free article] [PubMed] [Google Scholar]
- 38.Melo SA, Luecke LB, Kahlert C, et al. Glypican-1 identifies cancer exosomes and detects early pancreatic cancer. Nature. 2015;523:177–182. [DOI] [PMC free article] [PubMed] [Google Scholar]
- 39.Nuzhat Z, Palma C, Rice GE, et al. Exosomes in pancreatic juice as valuable source of biomarkers for early diagnosis of pancreatic cancer. Translational Cancer Research. October 2017;6:S1339–S1351. [Google Scholar]
- 40.Nakamura S, Sadakari Y, Ohtsuka T, et al. Pancreatic Juice Exosomal MicroRNAs as Biomarkers for Detection of Pancreatic Ductal Adenocarcinoma. Ann Surg Oncol. July 2019;26:2104–2111. [DOI] [PubMed] [Google Scholar]
- 41.Pepe MS, Feng Z, Janes H, et al. Pivotal evaluation of the accuracy of a biomarker used for classification or prediction: standards for study design. J Natl Cancer Inst. October 15 2008;100:1432–1438. [DOI] [PMC free article] [PubMed] [Google Scholar]
Associated Data
This section collects any data citations, data availability statements, or supplementary materials included in this article.


