

Abstract

Amyloids are broadly investigated protein misfolding products with characteristic β-sheet assemblies that have an important role in neurodegenerative diseases (e.g., Alzheimer’s disease). While they are usually visualized by staining with Thioflavin-T, Congo Red, or other fluorescent markers, it still arouses a controversy over possible staining molecule influence on the amyloid structure or aggregation process. In this work we present, for the first time, the polarization analysis of two-photon excited autofluorescence of amyloids and confirm that polarization dependence of the observed emission can be correlated with the orientation of fibrils. We show the potential of two-photon excited autofluorescence for resolution of molecular organization of fibrils within amyloid superstructures. This label-free method is compatible with two-photon imaging already applied in investigation of neurodegeneration model in mice.
Amyloids are insoluble aggregates of misfolded proteins, rich in β-sheet structures forming filaments and fibers. They are the hallmark of Alzheimer’s disease (AD), Parkinson’s disease (PD), and a range of other neurodegenerative disorders as well as amyloidoses affecting various organs and systemic conditions with amyloid deposits in multiple organs.1,2 Diagnosing of the disease and investigation of the origins of amyloidogenesis require imaging in vivo and needs to be performed for complex, densely packed biosystems. Optical fluorescence microscopy is a method of choice in such cases. Dyes such as Thioflavin-T (ThT) and Congo Red have been widely used as selective fluorescent labels for amyloid formation studies as they exhibit distinct intermolecular interaction with β-sheet-rich, mature fibrils and only weak binding to the oligomeric intermediates.3−5 Specific ordering of ThT on amyloid fibrils allowed application of polarization sensitive techniques to study amyloids organization, as was shown by Brasselet et al.6 However, the presence of a label may affect the aggregation processes or structural properties of amyloids. As was shown for ThT, the presence of the dye interferes with the aggregation process and this arouses controversy over fiber-binding modes.7−9 Moreover, a multitude of factors affects ThT molecule binding to amyloids.5 Thus, analysis of the fiber structure based on a label-free technique would be beneficial. Interestingly, autofluorescence characterized by emission maxima located between 340 and 450 nm, dependent on the excitation wavelength, with lifetimes of approximately 1–3 ns was reported as an intrinsic optical property of amyloid fibers for a variety of amyloidogenic proteins (e.g., Aβ1–42, α-synuclein, insulin).10−12 It should be emphasized that the phenomenon does not require the presence of multiple covalent bonds conjugation or the presence of aromatic residues necessary for traditional fluorescent molecular systems.10,11,13,14 The origin of this luminescence of amyloids is still poorly understood and several explanations have been discussed, which point at the delocalization of electrons through hydrogen bonds or proton transfer as possible mechanisms.15 Recently, Grisanti et al. showed by numerical simulations that the main contribution to excitation bands of autofluorescence of amyloids lacking aromatic amino acids comes from stabilization of nπ* states with excitation localized on amide groups.14 Simultaneously, rigidity of the fibrils introduced by cross β-sheet structure enhances the radiative decay channel, which results in blue-green fluorescence.10 However, the determination of what contributes to autofluorescence in real amyloids, with various side chains, is still a challenge. Nevertheless, amyloids autofluorescence utility in in vivo imaging of amyloid deposits was already confirmed.16
Here, we demonstrate, for the first time, that amyloids autofluorescence presents incident light polarization-dependent excitation and emission, which can be correlated with the orientation of amyloid fibrils. We study amyloid structures under polarization-sensitive two-photon excited fluorescence microscope (ps-TPFM). Two-photon excitation provides deeper optical penetration, lower scattering, and lower phototoxicity of imaging, in comparison to the one-photon based excitation microscopy,17,18 and its advantages were already successfully implemented in in vivo imaging of amyloids deposits in AD mouse models, stained with two-photon absorbing fluorophores.19 Moreover, the two-photon excitation presents reduced angular photoselection of fluorophores, which results in higher precision in determination of molecular organization in a sample, as was shown with ps-TPFM in artificial lipid vesicles and cell membranes imaging.20 Further, we explore the application of two-photon excited autofluorescence to resolve the three-dimensional organization of fibrils in higher order amyloid structures in aqueous environment. The ps-TPFM was already used by our group in the studies of DNA strands organization and proved to provide detailed information on local ordering of DNA helices in various self-organized liquid crystal phases.21−23 Here, we image amyloid spherulites: larger-scale and β-sheet rich aggregates, which are seen in the post-mortem brains of Parkinson’s and Alzheimer’s patients.24 Such spherical structures are also found in, e.g., Creutzfeldt–Jackob disease, but their exact origin and biological importance is yet to be discovered.25,26 Johansson et al. reported that spherulitic amyloid deposits can be detected on the basis of their intrinsic optical properties, including nonlinear optical processes such as second harmonic generation (SHG).27 We show that ps-TPFM can provide additional information about local orientation of fibrils in a spherulite. Finally, we compare the information provided by two-photon excited autofluorescence (2PAF) with two-photon excited fluorescence imaging of amyloids labeled with ThT and see clear differences of labeling various components of amyloid systems.
We obtained amyloid spherulites from bovine insulin powder in denaturing conditions, as described in the Supporting Information section. Spherulites were imaged under a polarized light microscope with crossed polarizers, and characteristic anisotropic patterns with Maltese crosses were observed (Figure 1a). Such patterns arise due to the regular and radially growing arrangement of amyloid fibrils.25 Moreover, spherulites present a disordered/isotropic core, with the size dependent on the overall size of a spherulite. When imaged under scanning electron microscope (SEM), the spherulites reveal cracking, due to the dehydration, with organized radial lines from the periphery to the disordered center of a spherulite (Figure 1b).
Figure 1.

(a) Polarized light optical microscopy image of different sizes of spherulites with crossed polarizers. Scale bar 100 μm. (b) SEM image of dehydrated and cracked spherulites. Scale bar 10 μm..
The one-photon excited emission spectra of spherulite solution were measured (Figure S1a) and identified as the amyloid autofluorescence with the maxima at 425 nm observed for 375 nm excitation, in agreement with previous reports.11 Samples were then excited by a femtosecond mode-locked Ti-sapphire laser with the excitation wavelength set to 810 nm. We observed an approximately quadratic dependence of two-photon excited fluorescence (2PEF) on the incident laser power (Figure S1b), which confirms the two-photon character of the observed processes. The presence of two-photon excited autofluorescence of label-free spherulites enabled their imaging in which we illuminated them with varying directions of the incident light polarization and analyzed the direction of 2PEF polarization (Figure 2). In detail, we performed raster scans with the polarization angle of incident light, α, aligned with the Y or X axis in the sample plane, as denoted with EX white arrows in the respective plots. The second white arrow, denoted as EM, corresponds to the direction of emission components (horizontally and vertically polarized emission components). A comprehensive description of our microscope setup and the imaging process is available in the Supporting Information (Figure S2).
Figure 2.
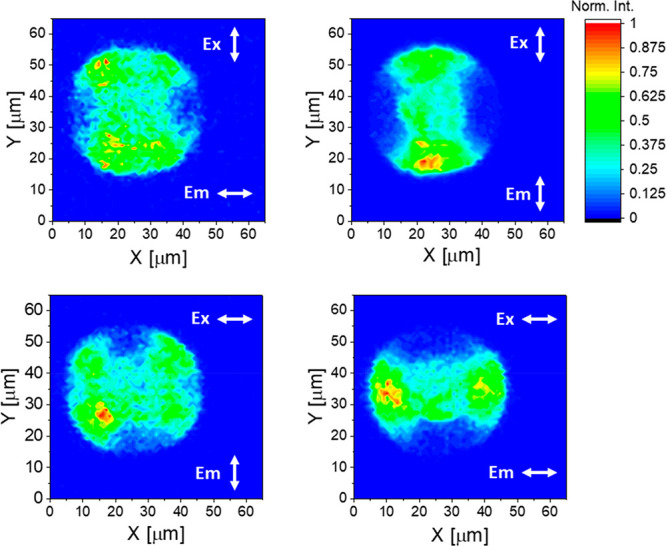
Two-photon autofluorescence intensity raster scans of a label-free insulin spherulite. Polarization of the excitation beam (Ex) and emission (Em) is denoted with white arrows, and the excitation wavelength was set to 810 nm. The same spherulite imaged under polarized light microscope with crossed polarizers is available in the Supporting Information (Figure S3).
Regions of the strongest two-photon excited luminescence were observed to be arranged in patterns corresponding to the excitation beam polarization angle α. The maximum 2PEF intensity was observed when EX and EM are parallel, which confirms that the absorption and emission transition dipole moments are parallel. Localization of the highest 2PEF intensities for respective scans in Figure 2 confirm radial organization of emitting dipoles. Comparison with Figure 1 and the described radial growth of fibrils from the spherulite core27,28 leads to a conclusion that both absorption and emission transition dipole moments are parallel to the long axis of amyloid fibrils. Characteristic features of amorphous core surrounded by highly ordered radial structures, observed under standard polarized light microscope (see Figure S3) were also visible under TPFM. However, weak autofluorescence was collected also from the full area of the nonbirefringent core, where high ordering is not expected.
Several spots on selected spherulites were chosen to perform a full polarization analysis, where horizontally and vertically polarized emission dependence on the excitation beam polarization angle α were collected: Ix(α) and Iy(α), respectively (Figure 3). Due to the photoselection and with an assumption that absorption and emission angles of the molecular transition dipoles are collinear, the highest emission intensity is observed when the transition dipole moment of the molecule is aligned parallel to the polarization of the incident light. Simultaneous detection of X and Y components of 2PF enables us to reveal information about molecular ordering as in isotropic samples X and Y components should be perpendicular to each other, whereas for a defined orientation of emitting molecules they should be parallel to the direction of emitting dipoles. To reveal information about molecular order of amyloid spherulites and interpret the angular dependence of Ix(α) and Iy(α), we adapted the mathematical model introduced previously to describe ps-2PEF of dyes labeling biological membranes and DNA structures.21,29,30 Two-photon excited fluorescence intensity of a single molecule is proportional to the probability of two-photon excitation and emission collection. The excitation probability depends on |μ⃗abs × E⃗|4, where μ⃗abs is the absorption transition dipole moment and E⃗ is the polarization of incident light field. The probability of the emission is defined by |μ⃗em × μ⃗I|2, where μ⃗em and μ⃗I correspond to the emission dipole and the analysis axis (detection polarization), respectively. Analysis of the X and Y components of two-photon excited fluorescence intensity is then performed with the equation:
where the intensity is integrated over the orientation distribution of μ⃗abs(Ω) and μ⃗em(Ω) of emitters, where Ω is the solid angle. The open cone distribution describes orientational distribution of a fluorophore on a fiber. It is characterized by the following parameters: half aperture of a cone, Ψ, with a variable thickness ΔΨ, and its orientation angle Φ in a XY sample frame, which is collinear with a long axis of an amyloid fibril, as shown in Figure 4a. In the fitting procedure we took into account the polarization distortions introduced by a dichroic mirror and high numerical aperture objective. All the details of the measurement and fitting of angular dependence of 2PF are given in the Supporting Information.
Figure 3.

2PEF XY raster scan of label-free spherulite excited with vertically polarized light and polar graphs from spots denoted on the scan. Experimental data are presented as dots (Ix, red; Iy, blue), and solid lines present the fitting of the angular dependence of two-photon excited emission. Polarization of the excitation beam (Ex) and emission (Em) are denoted with white arrows. The excitation wavelength was set to 810 nm.
Figure 4.
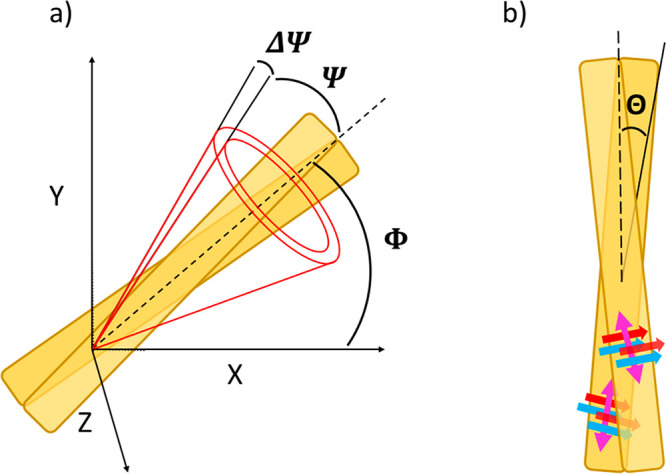
(a) Open cone model of the conical distribution of the emission dipole of the dye (half angle, Ψ) in respect to the long fibril axis (dashed line). Rotation of the fibril in the XY microscope sample plane is described by the Φ angle. Aberrations of Ψ due to the molecular rotations in filaments are described by ΔΨ. (b) Schematic amyloid fibril model where red and blue arrows represent the β-sheets oriented perpendicularly to the long axis of the protofilament. Emitting dipole binding sites are denoted with pink double-headed arrow. Θ stands for the angular distribution of the protofilaments that build a fibril (maximal deviation from the long axis of the fibril).
The high organization of amyloid fibrils near the spherulites periphery allows us to determine autofluorescence transition dipole moments with respect to the long axis of a fibril. We performed fitting of Ix(α) and Iy(α) collected from highly organized regions of several spherulites (an example is given in Figure 3, spots 1, 2, 3, 4) and obtained Ψ and ΔΨ values. The average relative angle between the long fibril axis and the transition dipole moment of autofluorescence Ψ was equal to 29°, with ΔΨ = 6°. It should be emphasized that mature amyloid fibrils are composed of several protofilaments that envelope one another in rope-like structure giving rise to helical twist and diverse amyloid morphology.31 The number of the coiled protofilaments determines the overall fibril cross-sectional width and rigidity.32 The angular distribution of the protofilaments that build a fibril can be described with angle Θ, which specifies maximal deviation from the long axis of the mature fibril, as presented schematically in Figure 4b. Therefore, the Θ angle contributes to the measured value of Ψ, together with Ψ0, which expresses the deviation of the dye from the long axis of the protofilament. In order to estimate values of θ we prepared individual insulin fibrils grown in similar conditions as fibrils in spherulites (details available in Supporting Information) and performed their imaging under atomic force microscope (AFM). The AFM images (Figures S5a,c and S6a,b) clearly demonstrate the presence of a twisted ribbon conformation with the pitch distance within the range 85–134 nm, width of 22.4 ± 5.3 nm, and height of 3.8 ± 1.5 nm (Figures S5a,c and S6a,b, Table S1). The angle Θ determined for such fibrils was in the ∼7–18° range, which corresponds with previous reports.6 The 2PAF distribution angle Ψ = 29° determined in our studies for fibrils packed within a spherulite is higher than θ of individual fibrils; therefore, within the spherulite the Ψ0 value can be estimated to fall into the ∼11–22° range. Of note is that the final morphology of amyloids is strongly dependent on the growth conditions. In order to test the influence of salt concentration, we incubated insulin at varying salt concentrations, i.e., 0, 50, and 100 mM NaCl (more details in Supporting Information). AFM analysis revealed that ionic strength impacts on fibrils morphology, especially on the twist pitch distance (Figure S5, Table S1). With the increase of salt concentration, the pitch distance tends to increase and, finally, at 100 mM NaCl, fibrils form untwisted morphology. These results further imply that the salt concentration may alter the final distribution angle Ψ of grown spherulites.
In order to explain the 2PEF angular distribution, we decided to compare it with superstructures of similar size and incubation conditions, but labeled with broadly studied Thioflavin-T (ThT) dye. Regions of the strongest two-photon excited luminescence observed in both ThT-labeled spherulites and label-free samples presented surprisingly similar patterns for corresponding α and 2PF polarizations (see Figure S7 for ThT-labeled spherulites, compare with Figure 2). As was seen previously,6,33 due to the highly anisotropic structure of amyloids and specific binding of ThT perpendicular to β-strands of a fibril, ThT can reproduce the orientation of the fibrils. As ThT was previously applied in polarization-sensitive imaging of amyloids,6 we adapted the molecular orientation of the dye being perpendicular to the long axis of the protofilaments. Similarly as in the case of 2PAF, we obtained Ψ and ΔΨ values by fitting Ix(α) and Iy(α) collected from highly organized regions of several ThT-labeled spherulites (see Figure S8, spots 1, 2, 3, 4). The average relative angle between the long fibril axis and the transition dipole moment of ThT molecules Ψ was equal to 30° and was almost the same as Ψ determined for 2PAF. Thus, we confirmed that highly polarized 2PEF corresponds to the arrangement of fibrils within spherulites. The average value of Ψ contains information about internal structure of a fibril, with specific coiling of protofilaments, as denoted by the θ angle. On the basis of a protofibril mean cross-section equal 30 × 40 Å, reported by Saibil et al., fibrils composed of up to 6–10 protofilaments enveloping each other were estimated to have θ values in range ∼7–18°, which is also expected to be observed for fibrils in spherulites.31
The polarization dependence of amyloid autofluorescence resolved in our work leads to better understanding of the origin of that process. Alignment of autofluorescence transition dipole moments parallel to the long fibril axis (with discussed deviation due to the helical structure of fibrils) supports the photophysical mechanism of amyloid autofluorescence proposed by Grisanti et al.14 Their theoretical analysis pointed at the deplanarization of amide groups and extended carbonyl bonds as a main contribution to red-shifted excitation bands in amyloid autofluorescence, as well as to the H-bond structure of the cross β arrangement in amyloids as responsible for restriction of nonradiative decay channels of autofluorescence. Both of these effects may be valid for the explanation of the highly polarized autofluorescence within amyloid superstructures.
We show that two-photon excited autofluorescence of amyloids is highly polarized and distributed within ∼30° around the long axis of the fibrils. Comparison with polarization analysis of two-photon excited fluorescence of ThT bound to similar fibrils shows the same conical distribution of fluorophores. Thus, the observed distribution may be dependent on protofibril conformation in amyloid fibrils. Two-photon excitation assures the restriction of excitation to the focal point of the objective; thus, two-photon excited autofluorescence will enable label-free, yet precise, localization of amyloids. Moreover, the determination of relative angle between the long axis of amyloid fibrils and autofluorescence transition dipole moments presented in our work allows for application of autofluorescence for determination of local organization of amyloid fibrils in various structures. The presented results provide therefore a contribution toward new methods to image amyloids organization and broaden our knowledge about amyloids autofluorescence.
Acknowledgments
We thank Paweł Cwynar for his initial work on ThT-stained amyloids fibrils. We thank Andrzej Żak for help with SEM imaging.
Glossary
Abbreviations
- PD
Parkinson’s disease
- AD
Alzheimer’s disease
- ThT
Thioflavin-T
- ps-TPFM
polarization-sensitive two-photon microscopy
- SHG
second harmonic generation
- 2PEF
two-photon excited fluorescence
- SEM
scanning electron microscope
- 2PF
two-photon fluorescence.
- AFM
atomic force microscope
Supporting Information Available
The Supporting Information is available free of charge at https://pubs.acs.org/doi/10.1021/acs.jpclett.0c03511.
Information about reagents and vendors, spherulite incubation conditions; microscope sample preparation; microscope setup and description of the fitting model; emission spectra and power dependence measurements of ThT-stained and label-free spherulites; atomic force microscopy analysis of fibrils’ morphology; two-photon microscopy of ThT-stained spherulites: raster scans and full polarization analysis (PDF)
Author Contributions
The manuscript was written through contributions of all authors. All authors have given approval to the final version of the manuscript.
This work was supported by the NONA project (First TEAM/2017-3/27) carried out within the First Team program of the Foundation for Polish Science and cofinanced by the European Union under the European Regional Development Fund and by a statutory activity subsidy from the Polish Ministry of Science and Higher Education for the Faculty of Chemistry of Wrocław University of Science and Technology. M.S. acknowledges funding from the National Science Centre under grant 2016/22/M/ST4/00275.
The authors declare no competing financial interest.
Supplementary Material
References
- Iadanza M. G.; Jackson M. P.; Hewitt E. W.; Ranson N. A.; Radford S. E. A new era for understanding amyloid structures and disease. Nat. Rev. Mol. Cell Biol. 2018, 19 (12), 755–773. 10.1038/s41580-018-0060-8. [DOI] [PMC free article] [PubMed] [Google Scholar]
- Ke P. C.; Zhou R.; Serpell L. C.; Riek R.; Knowles T. P. J.; Lashuel H. A.; Gazit E.; Hamley I. W.; Davis T. P.; Fändrich M.; Otzen D. E.; Chapman M. R.; Dobson C. M.; Eisenberg D. S.; Mezzenga R. Half a century of amyloids: past, present and future.. Chem. Soc. Rev. 2020, 49 (15), 5473–5509. 10.1039/C9CS00199A. [DOI] [PMC free article] [PubMed] [Google Scholar]
- Biancalana M.; Koide S. Molecular mechanism of Thioflavin-T binding to amyloid fibrils. Biochim. Biophys. Acta, Proteins Proteomics 2010, 1804 (7), 1405–1412. 10.1016/j.bbapap.2010.04.001. [DOI] [PMC free article] [PubMed] [Google Scholar]
- Frieg B.; Gremer L.; Heise H.; Willbold D.; Gohlke H. Binding modes of thioflavin T and Congo red to the fibril structure of amyloid-β(1–42). Chem. Commun. 2020, 56 (55), 7589–7592. 10.1039/D0CC01161D. [DOI] [PubMed] [Google Scholar]
- Arad E.; Green H.; Jelinek R.; Rapaport H. Revisiting thioflavin T (ThT) fluorescence as a marker of protein fibrillation – The prominent role of electrostatic interactions. J. Colloid Interface Sci. 2020, 573, 87–95. 10.1016/j.jcis.2020.03.075. [DOI] [PubMed] [Google Scholar]
- Duboisset J.; Ferrand P.; He W.; Wang X.; Rigneault H.; Brasselet S. Thioflavine-T and Congo Red Reveal the Polymorphism of Insulin Amyloid Fibrils When Probed by Polarization-Resolved Fluorescence Microscopy. J. Phys. Chem. B 2013, 117 (3), 784–788. 10.1021/jp309528f. [DOI] [PubMed] [Google Scholar]
- Xue C.; Lin T. Y.; Chang D.; Guo Z. Thioflavin T as an amyloid dye: fibril quantification, optimal concentration and effect on aggregation. R. Soc. Open Sci. 2017, 4 (1), 160696. 10.1098/rsos.160696. [DOI] [PMC free article] [PubMed] [Google Scholar]
- Sulatsky M. I.; Sulatskaya A. I.; Povarova O. I.; Antifeeva I. A.; Kuznetsova I. M.; Turoverov K. K. Effect of the fluorescent probes ThT and ANS on the mature amyloid fibrils. Prion 2020, 14 (1), 67–75. 10.1080/19336896.2020.1720487. [DOI] [PMC free article] [PubMed] [Google Scholar]
- Groenning M. Binding mode of Thioflavin T and other molecular probes in the context of amyloid fibrils-current status. J. Chem. Biol. 2010, 3 (1), 1–18. 10.1007/s12154-009-0027-5. [DOI] [PMC free article] [PubMed] [Google Scholar]
- Pinotsi D.; Grisanti L.; Mahou P.; Gebauer R.; Kaminski C. F.; Hassanali A.; Kaminski Schierle G. S. Proton Transfer and Structure-Specific Fluorescence in Hydrogen Bond-Rich Protein Structures. J. Am. Chem. Soc. 2016, 138 (9), 3046–3057. 10.1021/jacs.5b11012. [DOI] [PubMed] [Google Scholar]
- Chan F. T. S.; Kaminski Schierle G. S.; Kumita J. R.; Bertoncini C. W.; Dobson C. M.; Kaminski C. F. Protein amyloids develop an intrinsic fluorescence signature during aggregation. Analyst 2013, 138 (7), 2156–2162. 10.1039/c3an36798c. [DOI] [PMC free article] [PubMed] [Google Scholar]
- Shukla A.; Mukherjee S.; Sharma S.; Agrawal V.; Radha Kishan K. V.; Guptasarma P. A novel UV laser-induced visible blue radiation from protein crystals and aggregates: scattering artifacts or fluorescence transitions of peptide electrons delocalized through hydrogen bonding?. Arch. Biochem. Biophys. 2004, 428 (2), 144–153. 10.1016/j.abb.2004.05.007. [DOI] [PubMed] [Google Scholar]
- Niyangoda C.; Miti T.; Breydo L.; Uversky V.; Muschol M. Carbonyl-based blue autofluorescence of proteins and amino acids. PLoS One 2017, 12 (5), e0176983 10.1371/journal.pone.0176983. [DOI] [PMC free article] [PubMed] [Google Scholar]
- Grisanti L.; Sapunar M.; Hassanali A.; Došliċ N. Toward understanding optical properties of amyloids: a reaction path and nonadiabatic dynamics study. J. Am. Chem. Soc. 2020, 142, 18042. 10.1021/jacs.0c07134. [DOI] [PubMed] [Google Scholar]
- Sirangelo I.; Borriello M.; Irace G.; Iannuzzi C. Intrinsic blue-green fluorescence in amyloyd fibrils. AIMS Biophysics 2018, 5, 155. 10.3934/biophy.2018.2.155. [DOI] [Google Scholar]
- Pansieri J.; Josserand V.; Lee S.-J.; Rongier A.; Imbert D.; Sallanon M. M.; Kövari E.; Dane T. G.; Vendrely C.; Chaix-Pluchery O.; Guidetti M.; Vollaire J.; Fertin A.; Usson Y.; Rannou P.; Coll J.-L.; Marquette C.; Forge V. Ultraviolet–visible–near-infrared optical properties of amyloid fibrils shed light on amyloidogenesis. Nat. Photonics 2019, 13 (7), 473–479. 10.1038/s41566-019-0422-6. [DOI] [Google Scholar]
- Svoboda K.; Yasuda R. Principles of Two-Photon Excitation Microscopy and Its Applications to Neuroscience. Neuron 2006, 50 (6), 823–839. 10.1016/j.neuron.2006.05.019. [DOI] [PubMed] [Google Scholar]
- Zipfel W. R.; Williams R. M.; Webb W. W. Nonlinear magic: multiphoton microscopy in the biosciences. Nat. Biotechnol. 2003, 21 (11), 1369–77. 10.1038/nbt899. [DOI] [PubMed] [Google Scholar]
- Chen C.; Liang Z.; Zhou B.; Li X.; Lui C.; Ip N. Y.; Qu J. Y. In Vivo Near-Infrared Two-Photon Imaging of Amyloid Plaques in Deep Brain of Alzheimer’s Disease Mouse Model. ACS Chem. Neurosci. 2018, 9 (12), 3128–3136. 10.1021/acschemneuro.8b00306. [DOI] [PubMed] [Google Scholar]
- Ferrand P.; Gasecka P.; Kress A.; Wang X.; Bioud F.-Z.; Duboisset J.; Brasselet S. Ultimate use of two-photon fluorescence microscopy to map orientational behavior of fluorophores. Biophys. J. 2014, 106 (11), 2330–2339. 10.1016/j.bpj.2014.04.011. [DOI] [PMC free article] [PubMed] [Google Scholar]
- Mojzisova H.; Olesiak J.; Zielinski M.; Matczyszyn K.; Chauvat D.; Zyss J. Polarization-sensitive two-photon microscopy study of the organization of liquid-crystalline DNA. Biophys. J. 2009, 97 (8), 2348–2357. 10.1016/j.bpj.2009.07.053. [DOI] [PMC free article] [PubMed] [Google Scholar]
- Olesiak-Banska J.; Mojzisova H.; Chauvat D.; Zielinski M.; Matczyszyn K.; Tauc P.; Zyss J. Liquid crystal phases of DNA: evaluation of DNA organization by two-photon fluorescence microscopy and polarization analysis. Biopolymers 2011, 95 (6), 365–75. 10.1002/bip.21583. [DOI] [PubMed] [Google Scholar]
- Olesiak-Banska J.; Gordel M.; Matczyszyn K.; Shynkar V.; Zyss J.; Samoc M. Gold nanorods as multifunctional probes in a liquid crystalline DNA matrix. Nanoscale 2013, 5 (22), 10975–10981. 10.1039/c3nr03319h. [DOI] [PubMed] [Google Scholar]
- Exley C.; House E.; Collingwood J. F.; Davidson M. R.; Cannon D.; Donald A. M. Spherulites of amyloid-beta42 in vitro and in Alzheimer’s disease. J. Alzheimer's Dis. 2010, 20 (4), 1159–1165. 10.3233/JAD-2010-091630. [DOI] [PMC free article] [PubMed] [Google Scholar]
- Krebs M. R. H.; Bromley E. H. C.; Rogers S. S.; Donald A. M. The Mechanism of Amyloid Spherulite Formation by Bovine Insulin. Biophys. J. 2005, 88 (3), 2013–2021. 10.1529/biophysj.104.051896. [DOI] [PMC free article] [PubMed] [Google Scholar]
- Cannon D.; Eichhorn S. J.; Donald A. M. Structure of Spherulites in Insulin, β-Lactoglobulin, and Amyloid β. ACS. Omega 2016, 1 (5), 915–922. 10.1021/acsomega.6b00208. [DOI] [PMC free article] [PubMed] [Google Scholar]
- Johansson P. K.; Koelsch P. Label-free imaging of amyloids using their intrinsic linear and nonlinear optical properties. Biomed. Opt. Express 2017, 8 (2), 743–756. 10.1364/BOE.8.000743. [DOI] [PMC free article] [PubMed] [Google Scholar]
- Krebs M. R. H.; MacPhee C. E.; Miller A. F.; Dunlop I. E.; Dobson C. M.; Donald A. M. The formation of spherulites by amyloid fibrils of bovine insulin. Proc. Natl. Acad. Sci. U. S. A. 2004, 101 (40), 14420. 10.1073/pnas.0405933101. [DOI] [PMC free article] [PubMed] [Google Scholar]
- Le Floc’h V.; Brasselet S.; Roch J.-F.; Zyss J. Monitoring of Orientation in Molecular Ensembles by Polarization Sensitive Nonlinear Microscopy. J. Phys. Chem. B 2003, 107 (45), 12403–12410. 10.1021/jp034950t. [DOI] [Google Scholar]
- Brasselet S.; Ferrand P.; Kress A.; Wang X.; Ranchon H.; Gasecka A.. Imaging Molecular Order in Cell Membranes by Polarization-Resolved Fluorescence Microscopy. In Fluorescent Methods to Study Biological Membranes; Mély Y., Duportail G., Eds.; Springer Berlin Heidelberg: Berlin, Heidelberg, 2013; pp 311–337. [Google Scholar]
- Jiménez J. L.; Nettleton E. J.; Bouchard M.; Robinson C. V.; Dobson C. M.; Saibil H. R. The protofilament structure of insulin amyloid fibrils. Proc. Natl. Acad. Sci. U. S. A. 2002, 99 (14), 9196–9201. 10.1073/pnas.142459399. [DOI] [PMC free article] [PubMed] [Google Scholar]
- Serpell L. C.; Sunde M.; Benson M. D.; Tennent G. A.; Pepys M. B.; Fraser P. E. The protofilament substructure of amyloid fibrils. J. Mol. Biol. 2000, 300 (5), 1033–9. 10.1006/jmbi.2000.3908. [DOI] [PubMed] [Google Scholar]
- Shaban H. A.; Valades-Cruz C. A.; Savatier J.; Brasselet S. Polarized super-resolution structural imaging inside amyloid fibrils using Thioflavine T. Sci. Rep. 2017, 7 (1), 12482. 10.1038/s41598-017-12864-9. [DOI] [PMC free article] [PubMed] [Google Scholar]
Associated Data
This section collects any data citations, data availability statements, or supplementary materials included in this article.