

Abstract
Objectives
We aimed to gain an understanding of the paradox of the immunity in COVID‐19 patients with T cells showing both functional defects and hyperactivation and enhanced proliferation.
Methods
A total of 280 hospitalised patients with COVID‐19 were evaluated for cytokine profiles and clinical features including viral shedding. A mouse model of acute infection by lymphocytic choriomeningitis virus (LCMV) was applied to dissect the relationship between immunological, virological and pathological features. The results from the mouse model were validated by published data set of single‐cell RNA sequencing (scRNA‐seq) of immune cells in bronchoalveolar lavage fluid (BALF) of COVID‐19 patients.
Results
The levels of soluble CD25 (sCD25), IL‐6, IL‐8, IL‐10 and TNF‐α were higher in severe COVID‐19 patients than non‐severe cases, but only sCD25 was identified as an independent risk factor for disease severity by multivariable binary logistic regression analysis and showed a positive association with the duration of viral shedding. In agreement with the clinical observation, LCMV‐infected mice with high levels of sCD25 demonstrated insufficient anti‐viral response and delayed viral clearance. The elevation of sCD25 in mice was mainly contributed by the expansion of CD25+CD8+ T cells that also expressed the highest level of PD‐1 with pro‐inflammatory potential. The counterpart human CD25+PD‐1+ T cells were expanded in BALF of COVID‐19 patients with severe disease compared to those with modest disease.
Conclusion
These results suggest that high levels of sCD25 in COVID‐19 patients probably result from insufficient anti‐viral immunity and indicate an expansion of pro‐inflammatory T cells that contribute to disease severity.
Keywords: CD25+PD‐1+ CD8+ T cell, COVID‐19 patients, disease severity, SARS‐CoV‐2, soluble CD25
High levels of soluble CD25 in COVID‐19 patients were found being associated with severe disease and prolonged viral shedding. We discovered that the elevation of sCD25 was caused by the insufficient anti‐viral T‐cell immune response and the resulting expansion of CD25+PD−1+CD8+ T cells. CD25+PD−1+CD8+ T cells that expressed CD38 and Ki‐67 participated pro‐inflammatory response and drove disease severity.

Introduction
Coronavirus disease 2019 (COVID‐19), caused by SARS‐CoV‐2, is characterised by pneumonia and hyper‐inflammatory immune response with a cytokine storm. Most patients present with mild to moderate illness followed by recovery but a substantial number of patients develop severe disease characterised by acute respiratory distress syndrome (ARDS) and lead to elevated mortality.1, 2 Like infections of other highly pathogenic human coronaviruses, disease severity in COVID‐19 increases during virus clearance, suggesting that the severe illness is mainly caused by the host immune response. 3 Clinical studies have reported various dysregulation of the immune system in COVID‐19, but the underlying immune mechanism for severe illness remains to be elucidated. 4 The mixed phenotype of T cells represents a major paradox of immune response to SARS‐CoV‐2 infection.4, 5 Lymphopenia is a common feature of patients with severe COVID‐19, and several studies reported reduced cytotoxicity and polyfunctionality of T cells with upregulated expression of exhaustion markers in patients with severe disease6, 7, 8, 9 while other studies revealed the association of enhanced activation and proliferation of T cells with severe illness.10, 11
In this study, we assembled 280 hospitalised patients admitted with COVID‐19 and found that soluble CD25 (sCD25), unique among a panel of cytokine markers, was selectively associated with disease severity, organ injuries and prolonged viral shedding. Using a mouse model of acute viral infection, we discovered that the elevation of sCD25 was caused by the insufficient anti‐viral T‐cell immune response and the resulting expansion of CD25+PD‐1+ CD8+ T cells, which participated in pro‐inflammatory response drove disease severity. Enhanced expansion of CD25+PD‐1+ T cells was also recorded in bronchoalveolar lavage fluid (BALF) of COVID‐19 patients with severe disease compared to moderate disease. These results suggest that a divergence between anti‐viral and pro‐inflammatory T‐cell responses drives COVID‐19 severity.
Results
Soluble CD25 is associated with severe illness in patients with COVID‐19
We conducted a retrospective study of pro‐inflammatory cytokine profiles in 280 hospitalised patients admitted with COVID‐19 at Tongji Hospital, Huazhong University of Science and Technology in Wuhan from 27 January to 5 February 2020. 12 According to 2019 clinical practice guideline from IDSA and ATS for diagnosis and treatment of adults with community‐acquired pneumonia, 13 they were categorised into severe (139/280, 49.6%) and non‐severe (141/280, 50.4%) groups within 15 days after admission. Epidemiological, demographic and clinical characteristics of patients with COVID‐19 are shown in Table 1 and 2.
Table 1.
Epidemiological, demographic and clinical characteristics of patients with COVID‐19
| All patients (n = 280) | Non‐severe (n = 141) | Severe (n = 139) | P‐value | |
|---|---|---|---|---|
| Age, years | 58.0 (47.0–66.8) | 53.0 (42.0–64.0) | 62.0 (53.0–70.0) | < 0.001 |
| Sex | ||||
| Female | 135/280 (48.2%) | 76/141 (53.9%) | 59/139 (42.4%) | 0.055 |
| Male | 145/280 (51.8%) | 65/141 (46.1%) | 80/139 (57.6%) | |
| Body mass index, kg/m-2 | 24.7 (22.7–26.6) | 24.5 (22.8–25.9) | 25.4 (22.5–27.6) | 0.381 |
| Source of infections | ||||
| Community‐acquired infection | 252/279 (90.3%) | 123/140 (87.9%) | 129/139 (92.8%) | 0.162 |
| Hospital‐acquired infections | 27/279 (9.7%) | 17/140 (12.1 %) | 10/139 (7.2%) | |
| Smoking history | ||||
| Never smokers | 233/279 (83.5%) | 123/141 (87.2%) | 110/138 (79.7%) | 0.211 |
| Former smokers | 20/279 (7.2%) | 7/141 (5.0%) | 13/138 (9.4%) | |
| Current smokers | 26/279 (9.3%) | 11/141 (7.8%) | 15/138 (10.9%) | |
| Underlying comorbidity | ||||
| Chronic obstructive pulmonary disease | 8/280 (2.9%) | 1/141 (0.7%) | 7/139 (5.0%) | 0.070 |
| Asthma | 3/280 (1.1%) | 1/141 (0.7%) | 2/139 (1.4%) | 0.990 |
| Tuberculosis | 4/280 (1.4%) | 4/141 (2.8%) | 0/139 (0%) | 0.135 |
| Diabetes | 47/280 (16.8%) | 17/141 (12.1%) | 30/139 (21.6%) | 0.033 |
| Hypertension | 80/280 (28.6%) | 29/141 (20.6%) | 51/139 (36.7%) | 0.003 |
| Coronary heart disease | 17/280 (6.1%) | 5/141 (3.5%) | 12/139 (8.6%) | 0.075 |
| Hepatitis B | 2/280 (0.7%) | 1/141 (0.7%) | 1/139 (0.7%) | 1.000 |
| Chronic kidney disease | 3/279 (1.1%) | 2/140 (1.4%) | 1/139 (0.7%) | 1.000 |
| Tumor | 12/266 (4.5%) | 5/134 (3.7%) | 7/132 (5.3%) | 0.537 |
| Previously used drugs | ||||
| ACEI/ARB | 23/278 (8.3%) | 13/141 (9.2%) | 10/137 (7.3%) | 0.561 |
| Systemic corticosteroids | 3/280 (1.1%) | 3/141 (2.1%) | 0/139 (0%) | 0.251 |
| Inhaled corticosteroid | 5/280 (1.8%) | 3/141 (2.1%) | 2/139 (1.4%) | 1.000 |
| Antibiotics | 2/280 (0.7%) | 1/141 (0.7%) | 1/139 (0.7%) | 1.000 |
| Anticoagulants | 7/279 (2.5%) | 4/140 (2.9%) | 3/139 (2.2%) | 1.000 |
| Immunosuppressant drugs | 3/280 (1.1%) | 2/141 (1.4%) | 1/139 (0.7%) | 1.000 |
| Anti‐viral drugs | 1/280 (0.4%) | 1/141 (0.7%) | 0/139 (0%) | 1.000 |
| Symptoms | ||||
| Fever of pre‐admission | 191/259 (73.7%) | 86/129 (66.7%) | 105/130 (80.8%) | 0.010 |
| Highest temperature | 37.8 (37.1–38.5) | 37.5 (37.0–38.5) | 38.0 (37.3–38.8) | 0.001 |
| Duration, days | 2 (0–4) | 1 (0–4) | 2 (1–5) | 0.014 |
| Cough | 230/280 (82.1%) | 120/141 (85.1%) | 110/139 (79.1%) | 0.192 |
| Dyspnoea | 167/280 (59.6%) | 64/141 (45.4%) | 103/139 (74.1%) | < 0.001 |
| Fatigue | 115/280 (41.1%) | 57/141 (40.4%) | 58/139 (41.7%) | 0.825 |
| Chest tightness | 72/211 (34.1%) | 37/116 (31.9%) | 35/95 (36.8%) | 0.451 |
| Chest pain | 25/280 (8.9%) | 13/141 (9.2%) | 12/139 (8.6%) | 0.863 |
| Sore throat | 15/280 (5.4%) | 12/141 (8.5%) | 3/139 (2.2%) | 0.018 |
| Dizziness | 26/280 (9.3%) | 14/141 (9.9%) | 12/139 (8.6%) | 0.709 |
| Confusion | 2/280 (0.7%) | 1/141 (0.7%) | 1/139 (0.7%) | 1.000 |
| Headache | 38/280 (13.6%) | 21/141 (14.9%) | 17/139 (12.2%) | 0.515 |
| Myalgia | 66/280 (23.6%) | 31/141 (22%) | 35/139 (25.2%) | 0.529 |
| Vomiting | 24/280 (8.6%) | 11/141 (7.8%) | 13/139 (9.4%) | 0.643 |
| Diarrhoea | 90/280 (32.1%) | 44/141 (31.2%) | 46/139 (33.1%) | 0.735 |
| Abdominal pain | 7/280 (2.5%) | 1/141 (0.7%) | 6/139 (4.3%) | 0.121 |
| Treatment | ||||
| Systemic corticosteroids | 160/280 (57.1%) | 67/141 (47.5%) | 93/139 (66.9%) | 0.001 |
| Duration, days | 4 (0–10) | 0 (0–9.5) | 5 (0–11) | 0.012 |
| Cumulative dose (prednisone‐equivalent dose), mg | 165.0 (0–435.0) | 0 (0–400.0) | 240.0 (0–476.9) | 0.006 |
| Anti‐viral drugs | ||||
| Arbidol | 205/280 (73.2%) | 110/141 (78.0%) | 95/139 (68.3%) | 0.068 |
| Oseltamivir | 106/280 (37.9%) | 65/141 (46.1%) | 41/139 (29.5%) | 0.004 |
| Lopinavir and ritonavir | 79/280 (28.2%) | 42/141 (29.8%) | 37/139 (26.6%) | 0.556 |
| Ribavirin | 10/280 (3.6%) | 5/141 (3.5%) | 5/139 (3.6%) | 1.000 |
Data are median (IQR) or n/N (%), where N is the total number of patients with available data. P‐values were calculated by the Mann–Whitney U‐test, χ2 test or Fisher’s exact test, as appropriate.
ACEI/ARB, angiotensin‐converting enzyme inhibitors or angiotensin II receptor blockers.
Table 2.
Radiographic and laboratory findings of patients with COVID‐19
| All patients (n = 280) | Non‐severe (n = 141) | Severe (n = 139) | P‐value | |
|---|---|---|---|---|
| CT findings pre‐admission | ||||
| Unilobar lesion | 8/225 (3.6%) | 5/108 (4.6%) | 3/117 (2.6%) | 0.634 |
| Multilobar lesion | 217/225 (96.4%) | 103/108 (95.4%) | 114/117 (97.4%) | |
| SpO2, % | ||||
| ≤ 93 | 75/280 (26.8%) | 11/141 (7.8%) | 64/139 (46.0%) | < 0.001 |
| Blood leucocyte count, × 10⁹ L−1 | 5.2 (3.9–6.8) | 5.0 (3.7–6.0) | 5.6 (4.1–7.9) | 0.001 |
| < 4 | 77/278 (27.7%) | 43/141 (30.5%) | 34/137 (24.8%) | 0.006 |
| 4–10 | 182/278 (65.5%) | 95/141 (67.4%) | 87/137 (63.5%) | |
| > 10 | 19/278 (6.8%) | 3/141 (2.1%) | 16/137 (11.7%) | |
| Neutrophil count, × 10⁹ L−1 | 3.8 (2.6–5.3) | 3.3 (2.4–4.3) | 4.4 (2.9–6.6) | < 0.001 |
| > 7.5 | 30/278 (10.8%) | 6/141 (4.3%) | 24/137 (17.5%) | < 0.001 |
| Lymphocyte count, × 10⁹ L−1 | 0.9 (0.7–1.2) | 1.0 (0.7–1.3) | 0.8 (0.6–1.0) | < 0.001 |
| < 0.8 | 117/278 (42.1%) | 46/141 (32.6%) | 71/137 (51.8%) | 0.001 |
| Platelet count, × 10⁹ L−1 | 194.5 (144.0–250.8) | 205.0 (158.5–255.0) | 176.0 (134.0–248.0) | 0.025 |
| < 100 | 13/276 (4.7%) | 5/141 (3.5%) | 8/135 (5.9%) | 0.351 |
| Alanine aminotransferase, U L−1 | 23.0 (14.0–37.0) | 21.0 (13.5–35.0) | 23.0 (15.0–40.8) | 0.192 |
| > 40 | 63/279 (22.6%) | 29/141 (20.6%) | 34/138 (24.6%) | 0.416 |
| Aspartate aminotransferase, U L−1 | 30.0 (22.0–46.0) | 25.0 (20.0–37.0) | 36.0 (24.0–49.3) | < 0.001 |
| > 40 | 87/279 (31.2%) | 29/141 (20.6%) | 58/138 (42.0%) | < 0.001 |
| Globulin, g L−1 | 33.4 (30.7–36.7) | 32.6 (30.5–35.7) | 34.1 (31.3–37.5) | 0.009 |
| > 35 | 96/278 (34.5%) | 40/141 (28.4%) | 56/137 (40.9%) | 0.028 |
| Albumin, g L−1 | 34.2 (31.4–37.2) | 35.0 (32.4–38.8) | 33.0 (30.2–36.0) | < 0.001 |
| < 35 | 159/279 (57.0%) | 68/141 (48.2%) | 91/138 (65.9%) | 0.003 |
| Total bilirubin, μmol L−1 | 9.0 (6.5–11.9) | 8.5 (6.0–10.90) | 9.4 (7.4–12.6) | 0.014 |
| > 17.1 | 18/279 | 7/141 | 11/138 | 0.307 |
| Conjugated bilirubin, μmol L−1 | 4.1 (2.9–5.8) | 3.7 (2.6–5.3) | 4.6 (3.3–6.2) | 0.001 |
| > 6.8 | 38/279 (13.6%) | 14/141 (9.9%) | 24/138 (17.4%) | 0.069 |
| Blood urea nitrogen, mmol L−1 | 4.1 (3.0–5.5) | 3.8 (2.9–4.8) | 4.5 (3.4–6.6) | < 0.001 |
| > 7.1 | 37/278 (13.3%) | 6/140 (4.3%) | 31/138 (22.5%) | < 0.001 |
| Creatinine, μmol L−1 | ||||
| Female | 56.0 (48.0–65.0) | 55.0 (47.3–62.0) | 58.0 (49.0–68.0) | 0.177 |
| > 84 | 12/135 (8.9%) | 5/76 (6.6%) | 7/59 (11.9%) | 0.284 |
| Male | 83.0 (71.0–98.0) | 84.0 (71.3–97.8) | 83.0 (71.0–100.0) | 0.992 |
| > 104 | 29/143 (20.3%) | 11/64 (17.2%) | 18/79 (22.8%) | 0.408 |
| Lactate dehydrogenase, U L−1 | 298.5 (234.0–432.0) | 256.0 (217.0–319.0) | 355.0 (265.5–495.5) | < 0.001 |
| > 250 | 184/276 (66.7%) | 74/139 (53.2%) | 110/137 (80.3%) | < 0.001 |
| Hypersensitive cardiac troponin I, pg mL−1 | 5.4 (2.6–14.0) | 3.7 (2.0–9.3) | 7.4 (3.8–23.4) | < 0.001 |
| > 15.6 | 42/184 (22.8%) | 8/81 (9.9%) | 34/103 (33.0%) | < 0.001 |
| N‐terminal pro‐brain natriuretic peptide, pg mL−1 | 141.5 (46.8–472.5) | 69.0 (26.0–241.0) | 250.0 (90.0–582.5) | < 0.001 |
| > 500 | 40/178 (22.5%) | 11/77 (14.3%) | 29/101 (28.7%) | 0.022 |
| D‐dimer, mg L−1 | 0.8 (0.5–1.6) | 0.6 (0.4–1.2) | 1.1 (0.7–2.1) | < 0.001 |
| > 0.5 | 186/266 (69.9%) | 76/136 (55.9%) | 110/130 (84.6%) | < 0.001 |
| High‐sensitive C‐reactive protein, mg L−1 | 44.9 (16.0–86.7) | 27.0 (9.2–61.7) | 64.6 (33.3–100.9) | < 0.001 |
| > 10 | 227/275 (82.5%) | 99/137 (72.3%) | 128/138 (92.8%) | < 0.001 |
| Procalcitonin, ng mL−1 | 0.1 (0–0.2) | 0 (0–0.1) | 0.1 (0.1–0.2) | < 0.001 |
| > 0.5 | 20/240 (8.3%) | 1/122 (0.8%) | 19/118 (16.1%) | < 0.001 |
| Erythrocyte sedimentation rate, mm h−1 | 35.0 (19.0–58.0) | 35.5 (17.0–57.5) | 35.0 (20.3–59.5) | 0.520 |
| > 20 | 197/272 (72.4%) | 95/136 (69.9%) | 102/136 (75.0%) | 0.342 |
| Ferritin, μg L−1 | 657.8 (410.0–1330.9) | 537.2 (319.0–784.0) | 915.2 (524.8–1715.8) | < 0.001 |
| > 400 | 203/270 (75.2%) | 90/135 (66.7%) | 113/135 (83.7%) | 0.001 |
| IL‐1β, ng L−1 | 5.0 (5.0–5.0) | 5.0 (5.0–5.0) | 5.0 (5.0–5.0) | 0.228 |
| > 5 | 46/280 (16.4%) | 27/141 (19.1%) | 19/139 (13.7%) | 0.216 |
| sCD25, U mL−1 | 732.0 (529.8–1033.3) | 663.0 (502.0–873.5) | 853.0 (583.0–1185.0) | < 0.001 |
| > 710 | 148/280 (52.9%) | 60/141 (42.6%) | 88/139 (63.3%) | 0.001 |
| IL‐6, ng L−1 | 19.9 (5.3–48.6) | 10.4 (3.7–30.1) | 35.5 (13.7–62.5) | < 0.001 |
| > 7 | 198/280 (70.7%) | 84/141 (59.6%) | 114/139 (82.0%) | < 0.001 |
| IL‐8, ng L−1 | 16.2 (10.1–25.9) | 13.2 (9.6–22.3) | 17.8 (11.8–27.2) | 0.004 |
| > 62 | 19/280 (6.8%) | 8/141 (5.7%) | 11/139 (7.9%) | 0.456 |
| IL‐10, ng L−1 | 5.3 (5.0–9.5) | 5.0 (5.0–7.7) | 6.4 (5.0–13.5) | < 0.001 |
| > 9.1 | 75/280 (26.8%) | 28/141 (19.9%) | 47/139 (33.8%) | 0.008 |
| TNF‐α, ng L−1 | 8.7 (7.0–10.9) | 8.0 (6.9–10.6) | 9.3 (7.5–11.9) | 0.006 |
| > 8.1 | 162/280 (57.9%) | 69/141 (48.9%) | 93/139 (66.9%) | 0.002 |
| Proteinuria | 94/168 (56.0%) | 43/94 (45.7%) | 51/74 (68.9%) | 0.003 |
Data are median (IQR) or n/N (%), where N is the total number of patients with available data. P‐values were calculated by the Mann–Whitney U‐test, χ2 test or Fisher’s exact test, as appropriate.
IL, Interleukin; TNF, Tumor necrosis factor.
Similar to other reports,1, 2, 4, 14 we found serum levels of sCD25, interleukin (IL)‐6, IL‐8, IL‐10 and tumor necrosis factor (TNF‐α) were higher in severe cases than in non‐severe cases (P < 0.01), whereas the levels of IL‐1β showed no difference between two groups (P = 0.228) (Figure 1a and Table 2). We took the advantage of this reasonably sized cohort and conducted univariable binary logistic regression analysis. Older age, hypertension, diabetes, elevated levels of sCD25, IL‐6, IL‐10 and TNF‐α were all positively associated with severe illness (P < 0.05) (Table 3). However, multivariable binary logistic regression analysis including these seven variables only identified age and sCD25 as independent risk factors for disease severity (Table 3). Since sCD25 was measured at hospital admission, we next examined the predictive value of sCD25 for disease severity, which was evaluated by the highest activity during the disease course. The combination of age and sCD25 in the multivariable binary logistic model resulted in 0.713 area under the receiver operating characteristic (ROC) curve, with a cut‐off value of 0.519 (sensitivity, 0.633; specificity, 0.752; positive predictive value (PPV), 71.5%; negative predictive value (NPV), 67.5%) (Figure 1b and Supplementary table 1).
Figure 1.
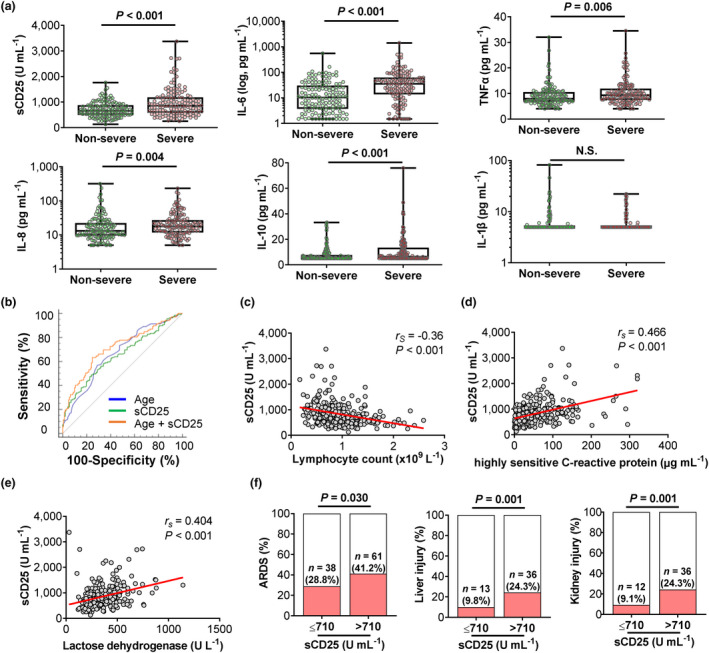
Soluble CD25 (sCD25) is associated with severe illness in patients with COVID‐19. Retrospective analysis of 280 patients with COVID‐19 including 139 cases with severe disease according to 2019 clinical practice guideline from American Thoracic Society and Infectious Diseases Society of America for diagnosis and treatment of adults with community‐acquired pneumonia. Epidemiological, demographic and clinical characteristics shown in the Supplementary tables. (a) Box and whisker plots with individual values showing comparisons of sCD25 and indicated cytokines between non‐severe (N = 141) and severe (N = 139) cases. (b) Receiver operating characteristic (ROC) curves of age, sCD25, and multivariable binary logistic model (age and sCD25 combination) in predicting severe COVID‐19. (c–e) Scatter plots with individual values and regression lines showing correlations between sCD25 with lymphocyte count (c), high‐sensitive C‐reactive protein (d) and lactate dehydrogenase (e) in COVID‐19 patients. (f) Bar graphs showing comparisons of the incidences for organ injuries in the lung (ARDS), liver and kidney between normal sCD25 (N = 132) and excessive sCD25 (> 710 U mL−1, N = 148) groups. P‐values were calculated by the Mann–Whitney U‐test (a), Spearman's rank correlation test (c–e) and χ2 test (f). P‐values < 0.05 are considered to be statistically significant.
Table 3.
Risk factors associated with severity of COVID‐19
|
Univariable OR (95% CI) |
P‐value |
Multivariable OR (95% CI) |
P‐value | |
|---|---|---|---|---|
| Age, years a | 1.045 (1.027–1.065) b | < 0.001 | 1.036 (1.017–1.056) b | < 0.001 |
| Diabetes a | 2.008 (1.050–3.839) | 0.035 | ||
| Hypertension a | 2.238 (1.311–3.820) | 0.003 | ||
| Systemic corticosteroids | 2.233 (1.376–3.622) | 0.001 | ||
| Blood leucocyte count, × 10⁹ L−1 | 1.222 (1.100–1.357) b | < 0.001 | ||
| Neutrophil count, × 10⁹ L−1 | 1.306 (1.161–1.469) b | < 0.001 | ||
| Lymphocyte count, × 10⁹ L−1 | 0.274 (0.146–0.516) b | < 0.001 | ||
| Aspartate aminotransferase, U L−1 | 1.011 (1.001–1.020) b | 0.027 | ||
| Globulin, g L−1 | 1.063 (1.011–1.118) b | 0.017 | ||
| Albumin, g L−1 | 0.902 (0.854–0.952) b | < 0.001 | ||
| Total bilirubin, μmol L−1 | 1.052 (1.005–1.102) b | 0.029 | ||
| Creatinine, μmol L−1 | 1.011 (1.002–1.019) b | 0.013 | ||
| Lactate dehydrogenase, U L−1 | 1.006 (1.004–1.008) b | < 0.001 | ||
| D‐dimer, mg L−1 | 1.176 (1.064–1.300) b | 0.001 | ||
| High‐sensitive C‐reactive protein, mg L−1 | 1.012 (1.007–1.018) b | < 0.001 | ||
| Ferritin, μg L−1 | 1.001 (1.001–1.001) b | < 0.001 | ||
| sCD25, U mL−1 a | 1.002 (1.001–1.002) b | < 0.001 | 1.001 (1.001–1.002) b | < 0.001 |
| IL‐6, ng L−1 a | 1.011 (1.005–1.018) b | 0.001 | ||
| IL‐8, ng L−1 | 1.003 (0.996–1.010) b | 0.440 | ||
| IL‐10, ng L b | 1.063 (1.022–1.106) b | 0.003 | ||
| TNF‐α, ng L b | 1.074 (1.013–1.139) b | 0.016 |
Odds ratios and the 95% confidence intervals were calculated using univariable and multivariable binary logistic regression analysis.
CI, confidence interval; IL, interleukin; OR, odds ratio; TNF, tumor necrosis factor.
Factors chosen for forward stepwise multivariable binary logistic regression analysis.
Present as per one‐unit increase.
The levels of sCD25 negatively correlated with lymphocyte counts (lymphopenia, 51.8% in severe vs 32.6% in non‐severe, P = 0.001) and positively correlated with the levels of high‐sensitive C‐reactive protein (hsCRP, 92.8% in severe vs 72.3% in non‐severe, P < 0.001) and lactate dehydrogenase (LDH, 80.3% in severe vs 53.2% in non‐severe, P < 0.001) (Figure 1c–e and Table 2). As markers for systemic inflammation and organ injury, lymphopenia and increased hsCRP and LDH are common clinical features of severe COVID‐19.12, 15 In line with strong correlations between sCD25 and these indicators, COVID‐19 patients with higher than normal sCD25 with upper limit (reference value, 710 U mL−1) showed higher incidences of multiple organ damages including ARDS (28.8% in sCD25‐normal vs 41.2% in sCD25‐high, P = 0.030), liver injury (9.8% in sCD25‐normal vs 24.3% in sCD25‐high, P = 0.001) and kidney injury (9.1% in sCD25‐normal vs 24.3% in sCD25‐high, P < 0.001) (Figure 1f and Supplementary table 2).
Soluble CD25 is associated with prolonged shedding of SARS‐CoV‐2 in patients with COVID‐19
Patients were followed up from the date of admission to March 24, 2020 when a total of 215 patients had achieved no viral shedding (Figure 2a). This was defined as SARS‐CoV‐2 nucleic acid test turned negative for two consecutive tests with a minimum of 24‐h sampling interval. Duration of viral shedding was calculated as the period from the illness onset to the date of the first negative result of nucleic acid tests. Notably, among tested pro‐inflammatory cytokine markers, sCD25 was the only marker that showed a positive association with duration of viral shedding (Figure 2b), suggesting prolonged viral persistence and/or defective anti‐viral immunity in patients with high levels of sCD25. Together, these data from COVID‐19 patients suggest that, among elevated cytokine markers, sCD25 is associated with disease severity and a potential inefficiency in viral clearance.
Figure 2.
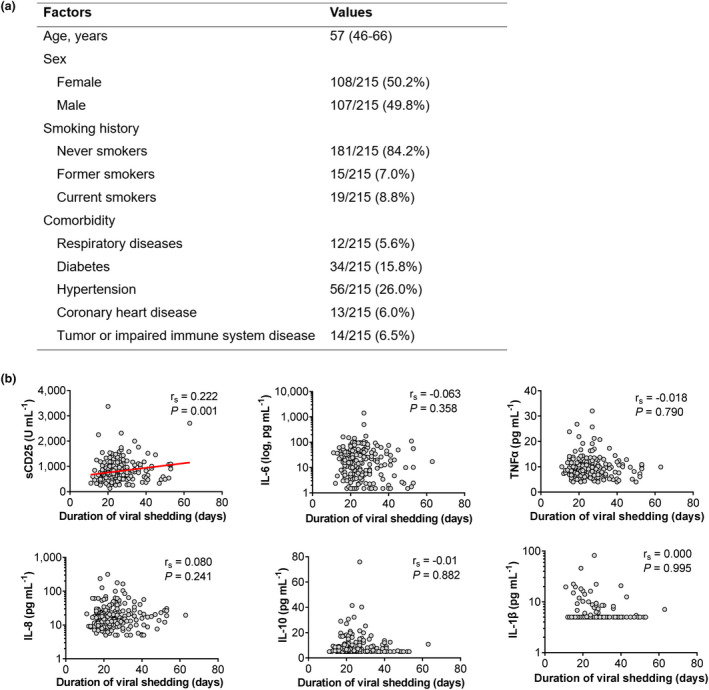
Soluble CD25 (sCD25) is associated with prolonged shedding of SARS‐CoV‐2 in patients with COVID‐19. (a) Epidemiological, demographic and clinical characteristics of 215 COVID‐19 patients for the viral shedding study which was defined as SARS‐CoV‐2 nucleic acid test turned negative for two consecutive tests with a minimum of 24‐h sampling interval. Data are expressed as median (IQR), n/N (%), where N is the total number of patients with available data. (b) Scatter plots with individual values showing correlations between indicated cytokines and the duration of viral shedding. P‐values were calculated by Spearman's rank correlation test. P‐values < 0.05 are considered to be statistically significant.
Soluble CD25 is derived from the surface expression of CD25 via proteolytic cleavage. 16 It is detectable at low levels in blood of healthy individuals. As CD25 is upregulated in autoimmune and inflammatory diseases, infections and certain types of cancers such as B and T‐cell neoplasia, elevated concentrations of sCD25 are found in the serum of patients with these pathological conditions associated with increased CD25 expression. 17 Elevated sCD25 in blood can result from the upregulation of CD25 expression on activated immune cells and/or enhanced proteolytic cleavage of membrane CD25 under inflammation. Contrasting with high concentrations of sCD25 in COVID‐19, sFasL and sCD62L were reported being decreased, 18 indicating there was no ubiquitous enhancement of proteolytic cleavage activity. Therefore, the elevation of sCD25 in COVID‐19 is probably primarily driven by the upregulation of surface CD25 expression on activated immune cells.
LCMV‐infected mice with high levels of sCD25 and CD25 expression on CD8+ T cells demonstrate insufficient anti‐viral response and delayed viral clearance
To better understand the immunological mechanism underlying the increase of sCD25 in COVID‐19 and its association with prolonged viral shedding and severe illness, we set up a mouse model of infection with lymphocytic choriomeningitis virus (LCMV) Armstrong, which induces acute infection and causes inflammation and multi‐organ damage. 19 LCMV infection was reported to induce lung injury, severe weight loss, vascular leakage and pulmonary oedema and cytokine storm. Viral dose and host genetic background determine the kinetics and magnitude of host immune response and result in different pathogenic outcomes from mild symptom to severe illness including mortality.20, 21, 22, 23 Therefore, LCMV infection can be used to model certain features of host immunity and inflammatory response to SARS‐CoV‐2 infection in humans.
The most severe illness in infected mice was recorded at day 7 or 8 post‐infection, showing significant but variable changes in weight (Figure 3a). At day 8 post‐infection, sCD25 in infected mice was about ~1.5‐fold higher than that of uninfected controls (Figure 3b). We analysed splenic immune cell populations and detected the upregulation of CD25 expression on CD8+ T cells, NK cells, B cells and eosinophils, but not on CD4+ T cells, monocyte/macrophages and dendritic cells (Figure 3c and Supplementary figure 1a and b). In line with the rapid upregulation of CD25 by CD8+ T cells upon activation (Supplementary figure 2), sCD25 showed a selective and strong correlation with CD25 expression on CD8+ T cells among immune cell types with CD25 upregulation (Figure 3d and Supplementary figure 1c), suggesting that the elevation of sCD25 in viral infection was significantly attributed to the upregulation of CD25 in activated immune cells, especially recently activated CD8+ T cells.
Figure 3.
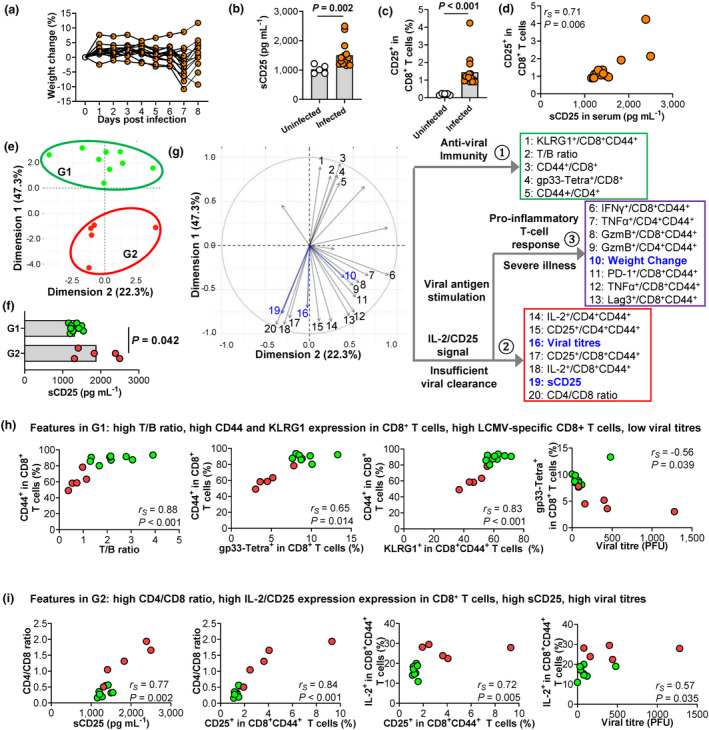
LCMV‐infected mice with high levels of sCD25 and CD25 expression on CD8+ T cells demonstrate insufficient anti‐viral response and delayed viral clearance. Mice were intraperitoneally injected with LCMV Armstrong and analysed at day 8 post‐infection. (a) Individual weight changes of infected mice (N = 14). (b) Comparison of sCD25 in blood, measured by ELISA between uninfected (N = 5) and infected (N = 14) mice. (c, d) Comparison of the CD25 expression on splenic CD8+ T cells analysed by flow cytometry at day 8 post‐infection between uninfected and infected mice (c) and its correlation with sCD25 in infected mice (d). (e) Principal component analysis (PCA) based on 21 immune variables (Supplementary table 3) segregates infected mice in Group 1 (G1, in green) and Group 2 (G2, in red). (f) Comparison of sCD25 between G1 (N = 9) and G2 (N = 5) mice. (g) Principal component analysis (PCA) plot indicating contributions of individual immune variables (Supplementary table 3), which are clustered into three modules by hierarchical clustering analysis. sCD25, viral titres and weight change are projected to the PCA space. (h, i) Correlations between immune variables in modules (g) for anti‐viral T‐cell response (h) and IL‐2/CD25 signal and insufficient viral clearance (i). Individual mice in G1 and G2 (e) are labelled in green and red, respectively. Data are representative of two or three independent experiments. P‐values were calculated by the Mann–Whitney U‐test (b, c) and Spearman's rank correlation test (d, h and i). P‐values < 0.05 are considered to be statistically significant.
To analyse the overall function of T cells in LCMV‐infected mice, we applied principal component analysis (PCA) of 21 variables for T‐cell activation, differentiation and function gained by flow cytometry (Supplementary table 3). The total of 14 mice with LCMV infection were segregated into two clusters (Figure 3e) with a significantly higher sCD25 in Group 2 (red, n = 5) than in Group 1 (green, n = 9) (Figure 3f). To understand the relationship between sCD25 levels, T‐cell function, viral clearance and disease severity, we projected sCD25, viral titres and weight change to the PCA space generated by T‐cell functional variables and found these total 24 variables forming three major modules by hierarchical clustering (Figure 3g). Compared to Group 2 with higher sCD25, Group 1 with lower sCD25 was featured in the first module, composed of variables indicating strong activation of T cells (high T/B ratio and high activation marker CD44) and, furthermore, the generation of viral‐specific short‐lived effector CD8+ T cells (KLRG1 and LCMV‐specific gp33 tetramer) (Figure 3g and h). The effective anti‐viral immunity, indicated by higher frequencies of gp33‐tetramer+ CD8+ T cells, was associated with viral clearance (Figure 3h). In contrast, mice in Group 2 with higher sCD25 were featured by the second module consisting of a disparity of CD4+ and CD8+ T cells (Figure 3i), which agreed with the negative relationship between sCD25 concentrations and the frequencies of CD8+ but not CD4+ T cells reported in COVID‐19 patients. 24 Mice in Group 2 also showed enhanced IL‐2/CD25 expression in both CD4+ and CD8+ T cells and higher viral loads (Figure 3g and i). The expression of CD25 is upregulated in T cells in response to antigen and IL‐2. 24 Based on our results, high levels of sCD25 and increased expression of CD25 on CD8+ T cells in viral infection were likely to be caused by insufficient anti‐viral immunity, which resulted in sustained antigen stimulation and enhanced IL‐2 signalling. This notion supports the observation in COVID‐19 patients that high sCD25 positively correlated with prolonged duration of viral shedding (Figure 2b).
CD25+CD8+ T cells in LCMV‐infected mice express the highest level of PD‐1 and associate with CD8+ T‐cell‐mediated pro‐inflammatory immune response
Noticeably, in infected mice, CD25‐expressing CD8+ T cells also showed the highest level of PD‐1 expression. Again, the frequencies of CD25+PD‐1high population were higher in Group 2 than those in Group 1 (Figure 4a). PCA and hierarchical clustering analysis revealed that PD‐1 as a variable was part of the third module which composed of variables associated with the expression of pro‐inflammatory cytokines and effector molecules in T cells and also weight change in infected mice (Figure 3g). At day 8 post‐infection, weight changes in mice ranged from 10% loss to 5% gain (Figure 3a), indicating mild to severe illness. Although showing no direct associations with either viral titres or general activation of CD4+ or CD8+ T cells (Supplementary figure 3), weight changes correlated with the expression of PD‐1 and Granzyme B (Figure 4b). To test whether CD8 T cells indeed drove disease severity, we infected mice with the genetic ablation of CD8+ T cells (CD8‐KO). The lack of CD8+ T cells reduced sCD25 levels (Figure 4c) and protected mice from weight loss and organ damages caused by acute viral infection (Figure 4d and e). These results suggested that T cells from mice with insufficient anti‐viral immunity might cause sustained antigen stimulation and enhanced IL‐2/CD25 signalling which enhanced PD‐1 expression and the pro‐inflammatory feature of T cells, probably contributing to more severe disease.
Figure 4.

CD25+CD8+ T cells in LCMV‐infected mice express the highest level of PD‐1 and associate with CD8+ T‐cell‐mediated pro‐inflammatory immune response. Mice were intraperitoneally injected with LCMV Armstrong and analysed at day 8 post‐infection. (a) Flow cytometric plots showing representative CD25+PD‐1+ expression on splenic CD8+ T cells from mice of the indicated group (left) and statistics between G1 and G2 mice from Figure 3e (right). (b) Correlations between immune variables in the module for pro‐inflammatory T‐cell response and weight changes. Individual mice in G1 and G2 from Figure 3e are labelled in green and red respectively. (c–e) Wild‐type (WT, N = 5–8) and CD8‐deficient (CD8‐KO, N = 3–8) mice were intraperitoneally injected with LCMV Armstrong and analysed at day 8 post‐infection. Serum sCD25 of individual mice are shown (c). Weight changes of the indicated group shown as mean ± SD (d). Comparisons of tissue histopathology by haematoxylin and eosin (H&E) staining showing lower cellularity of infiltrated cells, reduced necrosis and better tissue integrity in CD8‐KO mice as compared to WT mice (e). Data are representative of two or three independent experiments. P‐values were calculated by the Mann–Whitney U‐test (a) and Spearman's rank correlation test (b). P‐values < 0.05 are considered to be statistically significant.
Characteristics of CD25+PD‐1+ CD8+ T‐cell subset in bronchoalveolar lavage fluid from COVID‐19 patients
To investigate the relationship between CD25+PD‐1+ CD8+ T cells and severe illness in COVID‐19, we re‐analysed BALF immune cell profiles from patients with varying severity of COVID‐19 generated by single‐cell RNA sequencing (scRNA‐seq). 10 Dimensional reduction by UMAP identified three major T‐cell clusters (Cluster 6, Cluster 9 and Cluster 14) in BALF (Figure 5a). 10 Cluster 6 was enriched for the expression IL7R and KLF2, the markers for naïve or resting memory T cells whereas Clusters 9 and 14 were effector or effector memory T cells (Figure 5b). In contrast to IL‐2Rβ (CD122) was expressed in all three clusters (Figure 5c), IL2RA (CD25) was selectively upregulated in Cluster 14, which also expressed PDCD1(PD‐1) (Figure 5d). Therefore, CD25+PD‐1+ T cells were highly enriched in Cluster 14 of T cells in BALF from COVID‐19 patients. Notably, Cluster 14 co‐expressed CD38 and MKI67(Ki67) (Figure 5d). A recent study comprehensively analysed T‐cell and B‐cell subsets in COVID‐19 patients and found that PD‐1+CD38+Ki67+ T cells were increased in blood of patients with more severe disease. 11
Figure 5.

Characteristics of CD25+PD‐1+ CD8+ T‐cell subset in bronchoalveolar lavage fluid from COVID‐19 patients. (a) Uniform Manifold Approximation and Projection (UMAP) presentation of single‐cell RNA‐seq analysis of bronchoalveolar lavage fluid (BALF) immune cells from healthy individuals and COVID‐19 patients 10 showing three major clusters (C6, C9, C14) for T cells. (b–g) Expression of indicated functional markers shown by UMAP and violin plots. (h) Scatter plots showing comparisons of frequencies for each T‐cell clusters in total T cells between samples from moderate (N = 3) and severe (N = 6) COVID‐19 patients. P‐values were calculated by the Mann–Whitney U‐test (f). P‐values < 0.05 are considered to be statistically significant.
Compared to Cluster 9, Cluster 14 demonstrated higher expression of survival marker BCL2, inflammatory cytokine IFNG and key molecules constituting the IL‐2 signalling pathway including STAT5A and PRDM1 (Blimp1) (Figure 5e). 16 Although both effector T‐cell clusters expressed significant levels of GZMB (Granzyme B) (Figure 5f), Cluster 9 showed stronger expression of cytotoxic molecules PRF1 (Perforin) and FASLG (Fas ligand) than Cluster 14, accompanied by increased expression of ID2, the transcription factor supporting effector T‐cell differentiation 25 (Figure 5g). These results suggested that Cluster 9 displayed a phenotype associated with short‐lived effector cells whereas CD25+PD‐1+ Cluster 14 had certain features of effector memory cells showing enhanced survival and proliferation. 25
We then compared the percentages of different clusters in samples from patients with moderate or severe COVID‐19. 10 Cluster 6, as naïve and resting memory T cells, were comparable between moderate and severe patients (Figure 5h). In contrast, Cluster 9, likely to be short‐lived effector T cells, reduced significantly by ~2‐fold while CD25+PD‐1+CD38+Ki67+ Cluster 14, representing effector or effector memory T cells with enhancing survival and proliferation, expanded 3–4 fold in severe illness, despite not reaching a statistical significance due to sample variation (Figure 5h). These analyses of BALF T cells from patient again supported a notion that the better generation of short‐lived effector T cells was associated with enhanced control of the disease while the expansion of CD25+PD‐1+ T cells with pro‐inflammatory function and better proliferation and survival might drive disease severity, echoing the observation in the mouse model (Figure 4). Since PD‐1+CD38+Ki67+ T cells, closely related to CD25+PD‐1+CD38+Ki67+ Cluster 14, were found increased in blood of patients with more severe disease, 11 further studies are required to investigate the relationship between CD25+PD‐1+CD38+Ki67+ T cells in BALF and disease severity or viral shedding.
Discussion
The dysregulated CD8+ T‐cell function has been frequently reported to be associated with COVID‐19 severity but there is a puzzling paradox.4, 5 On the one hand, lymphopenia and functional defects, especially the preferential impact on CD8+ T cells, were reported to be associated with severe disease.6, 7, 8, 9 On the other hand, patients with severe illness show hyperactivation and enhanced proliferation of CD8+ T cells.10, 11 We revealed that there was a selective association between elevated sCD25 and COVID‐19 severity.
Using increased concentrations of sCD25 in mouse models of acute viral infection as a clue, we revealed that the evaluation of sCD25 was driven by the delayed clearance of virus and the expansion of CD25+PD‐1+ CD8+ T cells with pro‐inflammatory function. Importantly, CD25+PD‐1+ T cells were also found expanding in BALF of patients with severe COVID‐19 compared with modest patients. These results support a model whereby patients with severe disease might mount insufficient anti‐viral immunity so that persistent viral stimulation, IL‐2 signalling and other factors drive excessive pro‐inflammatory T‐cell response, providing a possible explanation to reconcile the mixed phenotype of T cells in patients with severe COVID‐19. The molecular mechanism underlying the distinction between the cytolytic and pro‐inflammatory function of T cells is not fully understood. However, a recent study revealed that the alternation of TCR signalling via modulating CD3 subunits can maintain the killing function while reducing the production of pro‐inflammatory cytokines IL‐2, IFN‐γ and TNFα, 26 which were found to be associated with CD25+PD‐1+ T cells in this study.
The tilted balance between anti‐viral vs non‐specific pro‐inflammatory CD8+ T cells responses in severe disease are also supported by the observation of greater TCR clonality of T cells in peripheral blood and BALF from patients with mild vs severe COVID‐19,10, 27 implying a bias towards bystander activation and homeostatic proliferation of non‐specific T cells rather than antigen‐driven activation of virus‐specific T cells in severe COVID‐19. 11 Previous studies indicated the failure to elicit an early type I IFN (IFN‐I) response correlated with the severity of disease in SARS‐CoV and MERS‐CoV infection. 4 Since severe and critical COVID‐19 patients also showed highly impaired IFN‐I response, 14 it is plausible to speculate that impaired IFN‐I signalling, at least partially, causes insufficient anti‐viral immunity due to weak immune priming and results in delayed viral clearance and severe illness in patients. In the mouse model of infection with SARS‐CoV, the augmentation of anti‐viral T‐cell responses could enhance viral clearance and ameliorate lung pathology, thus preventing otherwise uniformly lethal infection in aged mice. 28
The divergence between anti‐viral and pro‐inflammatory T‐cell responses implies a two‐stage therapeutic strategy. The initial therapy should aim to enhance anti‐viral immunity to reduce viral loads while, at the second stage of excessive inflammation, the treatment should target non‐specific activation of the immune system, including CD8+ T cells. The identification of elevated sCD25 levels and the expansion of CD25+PD‐1+ CD8+ T cells provided potential biomarkers to determine the imbalance of anti‐viral vs pro‐inflammatory T‐cell responses in acute viral infection. This should be validated in additional patient cohorts using pseudotime analysis. Notably, respiratory syncytial virus infections in children showed infants with severe bronchiolitis had increased serum levels of sCD25.29, 30, 31 Similarly, patients with severe H1N1 infections had elevated levels of sCD25 compared to patients with mild infections. 32 By examining monitoring immune signatures of hospitalised patients infected with A/H7N9 influenza virus, rapid and robust anti‐viral T‐cell responses were found in patients with early recoveries while delayed and diminished responses were associated with prolonged hospital or fatal outcomes. 33 Together, these results from different viral infections in multiple human studies suggest that a divergence between anti‐viral and pro‐inflammatory T‐cell responses might represent a common mechanism that drives the illness, with sCD25 as a potential biomarker.
Mouse models can be used to validate the correlations observed in human cohort studies. However, there is a considerable difference between SARS‐CoV‐2 and LCMV infections. Although results from the LCMV model used in this study revealed the dysregulated T‐cell function underlying severe illness, such results need to be validated in animal models of SARS‐CoV‐2 infection. In recent reports of mouse models of SARS‐CoV‐2 based on the exogenous expression of human angiotensin‐converting enzyme 2 (hACE2) by adeno‐associated virus (AAV‐hACE2) 34 or driven by the epithelial cell cytokeratin‐18 (K18) gene promoter (K18‐hACE2), 35 highly activated T cells infiltrated in the lungs upon SARS‐CoV‐2 infections. Future studies are required to test whether the hyperactivation of T cells drives inflammatory responses and exacerbates the illness in mice.
Methods
Clinical study design and participants
This retrospective study was conducted on hospitalised patients with COVID‐19 enrolled at Sino‐French New City Branch of Tongji Hospital, Huazhong University of Science and Technology in Wuhan from 27 January to 5 February 2020. 88.6% (248 of 280) of cases enrolled in this study were tested positive for SARS‐CoV‐2 by real‐time reverse‐transcriptase polymerase chain reaction (RT‐PCR) of nasopharyngeal or pharyngeal swab specimens 36 37 and 11.4% (32 of 280) of cases were clinically diagnosed according to the diagnostic and treatment guideline for COVID‐19 issued by Chinese National Health Committee (version 5). In total, 280 cases with a complete cytokine profile for IL‐1β, sCD25/sIL‐2Rα, IL‐6, IL‐8, IL‐10 and TNF‐α, measured at hospital admission, were included for analysis. Severe COVID‐19 was defined according to 2019 clinical practice guideline from American Thoracic Society (ATS) and Infectious Diseases Society of America (IDSA) for diagnosis and treatment of adults with community‐acquired pneumonia. 13 The classification remained the same using the WHO criteria for severe COVID‐19 which includes severe pneumonia, ARDS, sepsis and septic shock. 37 Patients were followed up from the date of admission to 24 March 2020. No viral shedding was defined as SARS‐CoV‐2 nucleic acid test turned negative for two consecutive tests with a minimum of 24‐h sampling interval. Duration of viral shedding was calculated as the period from the illness onset to the date of the first negative result of nucleic acid tests. This study was approved by the Institutional Review Board of Tongji Hospital, Huazhong University of Science and Technology. Oral instead of written consents were obtained to reduce the risk of virus transmission. The study was in line with World Medical Association Declaration of Helsinki and ICH‐GCP guidelines.
Patient data collection
Epidemiological and demographic data were obtained through face‐to‐face or telephone interview. Clinical symptoms, laboratory results, treatment and outcome data were extracted from electronic medical records. Data were cross‐checked before entering into the database.
Mice
Wild‐type, CD8a‐deficient (CD8‐KO) and Foxp3‐GFP reporter mice on a C57BL/6 background were sourced from the Animal Resources Centre (Perth, Australia) or The Jackson Laboratory (Bar Harbor, Maine, USA). All experimental mice were maintained in a specific pathogen‐free facility at the Translational Research Institute Biological Research Facility (TRI‐BRF), the University of Queensland or the Australian Phenomics Facility, the Australian National University, Australia. All procedures were approved by the Animal Ethics Committees of the University of Queensland and Australian National University.
Virus propagation, titration and infection
Lymphocytic choriomeningitis virus Armstrong was propagated on BHK‐21 cells and tittered on Vero E6 cells as described 38 with modification. Briefly, ten‐fold serial dilutions of stock or serum were co‐cultured with Vero E6 cells. After 60 min of incubation at 37°C, 5% CO2, 5% complete DMEM medium containing 0.3% carboxymethylcellulose was added. After 5 days, cells were fixed in 1% formaldehyde in phosphate buffered saline (1% PFA/PBS) overnight and stained with 0.1% toluidine blue solution to determine plaque numbers. Plaques were manually counted using a light microscope. Virus titre was calculated by multiplying the number of plaques by the dilution factor and ratio of volume plated in 1 mL per sample to determine virus titre. Twelve to fourteen weeks old wild‐type or CD8‐KO female mice were intraperitoneally infected with LCMV Armstrong at a dose of 2 × 10⁵ plaque forming units. Weight was measured daily until endpoint at day 8. Weight change as percentage was calculated by subtracting weight at day 8 from the maximum weight from day 0 to 7 and dividing by maximum weight from day 0 to 7.
Quantification of sCD25 in serum
Soluble CD25 levels in serum were measured with commercial ELISA kits (DY2438; R&D Systems, Minneapolis, Minnesota, USA) according to the manufacturer's instructions. In brief, 96‐well high‐binding plates (Costar, Lowell, Massachusetts, USA) were coated overnight with the diluted capture antibody (1:200) in 100 µL of PBS at 4°C. After washing, the plates were blocked with reagent diluent (1% BSA in PBS), and then 1:10 dilutions of serum or standards were applied to the plates and incubated at room temperature for 60 min. After washing, detection antibody was added and incubated for 2 h at room temperature, followed by Streptavidin‐HRP. After washing, the plates were incubated with TMB substrate (Abcam, Cambridage, UK) at 37°C for 15 min, and 5% sulphuric acid was added to stop the reaction. Absorbance was measured at 450 nm with Infinite M200 Pro microplate reader (TECAN, Männedorf, Switzerland). A standard curve was generated to calculate the concentration of sCD25.
Cell culture
Naïve CD4+ T cells (B220−CD3+Foxp3−CD4+CD44−CD62L+), naïve CD8+ T cells (B220−CD3+Foxp3−CD8+CD44−CD62L+) and primed CD8+ T cells (B220−CD3+Foxp3−CD8+CD44+) were purified from Foxp3‐GFP reporter mice by flow cytometry sorting (FACSAria III; BD, San Jose, California, USA). Sorted cells (1 × 10⁵ cells/well of 96‐well plate) were cultured in complete RPMI medium with the stimulation of plate‐bound anti‐CD3/CD28 (2 µg mL−1) and incubated for 24 or 48 h. The cultured cells were then analysed for the expression of CD25 and CD69 by flow cytometry.
Flow cytometry
Mice splenocytes were incubated with Fc‐receptor blocking antibodies (2.4G2; BD Biosciences) for 10 min on ice to block non‐specific staining. For surface staining, fluorophore‐conjugated anti‐mouse antibodies were incubated in PBS containing 2% heat‐inactivated foetal bovine serum (Gibco, Carlsbad, California, USA) for 30 min. For staining of intracellular cytokines, whole splenocytes were stimulated with PMA and ionomycin (500 ng mL−1; eBioscience, San Diego, California, USA) in the presence of monensin and brefeldin A (1:1000; eBioscience) for 4 h at 37°C. Stimulated cells were washed twice after surface staining and permeabilised using Cytofix/Cytoperm (BD Bioscience) for 30 min at 4°C. Antibodies specific for intracellular cytokines were incubated with cells for 30 min at 4°C. Isotype controls were used as negative controls. To detect endogenous LCMV‐specific CD8+ T cells, APC‐conjugated H‐2Db‐gp33‐tetramer (MBL, TS‐M512‐P) was used. The stained cells were analysed using a BD LSRFortessa™ X‐20 (BD Bioscience) instrument and FlowJo software (TreeStar, Ashland, OR, USA).
Tissue histology
To evaluate histopathology in organs, mice were ethically sacrificed at endpoint day and lung, kidney, liver tissues were collected for histology staining. All samples were fully fixed with 4% paraformaldehyde, paraffin‐embedded, and cut into 5‐μm sections, then stained with haematoxylin and eosin (H&E). Sections were permeabilised with xylene and mounted with neutral balsam. Images were collected with microscope (NIKON ECLIPSE CI, Amsterdam, Netherlands) and morphological evaluations were determined at the magnification of 50 or 400× in a series of blindly and randomly selected tissue sites from lung, liver and kidney.
Principal component analysis
Principal component analysis on 21 variables for T‐cell function (Table S5) was performed by using R function prcomp. Additional variables of sCD25, viral titres and weight change were then projected to the PCA space. R function fviz_pca_ind and fviz_pca_var were used to plot individual samples and illustrate variables in the PCA space. Variables were clustered using the hclust package in R.
Single‐cell RNA‐seq processing
The scRNA‐seq data set for immune cells in BALF from COVID‐19 patients (GSE145926) were generated and analysed as described. 10 We took results (http://cells.ucsc.edu/?ds=covid19‐balf) to analyse gene expression in T‐cell clusters (C6, C9 and C14). Cell numbers for each T‐cell clusters (C6, C9 and C14) in individual samples from moderate or severe patients were extracted from results (http://cells.ucsc.edu/covid19‐balf/nCoV.rds) to calculate percentages in total T cells. Violin plots of indicated functional biomarkers were generated by R function VlnPlot in Seurat package.
Statistical analysis
Continuous variables were expressed as median and interquartile range (IQR) and different groups were compared with the Mann–Whitney U‐test. Categorical variables were expressed as number (%) and compared by the χ2 test or Fisher’s exact test between severe and non‐severe groups. To explore the risk factors associated with severity of COVID‐19, multivariable binary logistic regression model was used. Considering the total number of severe patients (n = 139), seven factors, age, diabetes, hypertension, sCD25, IL‐6, IL‐10 and TNF‐α were chosen for forward stepwise multivariable binary logistic regression analysis from the clinical characteristics and cytokine profiles on the basis of univariable binary logistic regression analysis. ROC analysis was carried out, and area under the curve (AUC) was compared to evaluate the predicting ability of age and sCD25. Sensitivity, specificity, PPV and NPV were calculated based on the cut‐off values. A Z‐test was used for comparing AUCs between different curves. Spearman’s correlation analysis was used to analyse the correlation between sCD25 and lymphocyte count, lactate dehydrogenase, high‐sensitive C‐reactive protein and duration of viral shedding in patients, and correlations between immune variables in mice. A two‐side α of < 0.05 was considered statistically significant. Statistical analyses were done using SPSS 25.0 statistical software package (SPSS Inc, Chicago, IL, USA), MedCalc 19.1 software (Acacialaan, Ostend, Belgium) and GraphPad Prism (version 8.1; GraphPad Software, San Diego, California, USA).
Conflict of interest
The authors declare no conflict of interest.
Author contributions
Conceptualization: MX and DY; Data curation: XM, JY, YYao, JShi, SX, MZ., MY, KW, YT, YT, YZ, XLi, XLiu, XY and ZL; Formal Analysis: XM, JY, YYao, JShi, YYang; Methodology by AM; Supervision by JSprent; Visualization Writing – original draft by JY, YY and JShi; Writing – review & editing by MX and DY. All authors approved the manuscript.
Supporting information
Acknowledgments
We acknowledge the Biological Resources Facility and Cytometry Facility (Translational Research Institute). This work was supported by the Australian National Health and Medical Research Council (GNT1147769), Eureka TechIN special grant for Immunology and Virology of COVID‐19, the Bellberry‐Viertel Senior Medical Research Fellowship to DY, and Natural Science Foundation of Shandong Province (Major Basic Program, ZR2020ZD41) to YW.
Contributor Information
Min Xie, Email: xie_m@126.com.
Di Yu, Email: di.yu@uq.edu.au.
Data availability statement
Further information and requests for resources and reagents should be directed to and will be fulfilled by the Lead Contact, Di YU (di.yu@uq.edu.au).
References
- 1. Huang C, Wang Y, Li X et al Clinical features of patients infected with 2019 novel coronavirus in Wuhan, China. Lancet 2020; 395: 497–506. [DOI] [PMC free article] [PubMed] [Google Scholar]
- 2. Guan WJ, Ni ZY, Hu Y et al Clinical characteristics of coronavirus disease 2019 in China. N Engl J Med 2020; 382: 1708–1720. [DOI] [PMC free article] [PubMed] [Google Scholar]
- 3. Sariol A, Perlman S. Lessons for COVID‐19 immunity from other coronavirus infections. Immunity 2020; 53: 248–263. [DOI] [PMC free article] [PubMed] [Google Scholar]
- 4. Vabret N, Britton GJ, Gruber C et al Immunology of COVID‐19: current state of the science. Immunity 2020; 52: 910–941. [DOI] [PMC free article] [PubMed] [Google Scholar]
- 5. Chen Z, Wherry EJ. T cell responses in patients with COVID‐19. Nat Rev Immunol 2020; 20: 529–536. [DOI] [PMC free article] [PubMed] [Google Scholar]
- 6. Zheng HY, Zhang M, Yang CX et al Elevated exhaustion levels and reduced functional diversity of T cells in peripheral blood may predict severe progression in COVID‐19 patients. Cell Mol Immunol 2020; 17: 541–543. [DOI] [PMC free article] [PubMed] [Google Scholar]
- 7. Zheng M, Gao Y, Wang G et al Functional exhaustion of antiviral lymphocytes in COVID‐19 patients. Cell Mol Immunol 2020; 17: 533–535. [DOI] [PMC free article] [PubMed] [Google Scholar]
- 8. Diao B, Wang C, Tan Y et al Reduction and functional exhaustion of T Cells in patients with coronavirus disease 2019 (COVID‐19). Front Immunol 2020; 11: 827. [DOI] [PMC free article] [PubMed] [Google Scholar]
- 9. Mazzoni A, Salvati L, Maggi L et al Impaired immune cell cytotoxicity in severe COVID‐19 is IL‐6 dependent. J Clin Invest 2020; 130: 4694–4703. [DOI] [PMC free article] [PubMed] [Google Scholar]
- 10. Liao M, Liu Y, Yuan J et al Single‐cell landscape of bronchoalveolar immune cells in patients with COVID‐19. Nat Med 2020; 26: 842–844. [DOI] [PubMed] [Google Scholar]
- 11. Mathew D, Giles JR, Baxter AE et al Deep immune profiling of COVID‐19 patients reveals distinct immunotypes with therapeutic implications. Science 2020; 369: eabc8511. [DOI] [PMC free article] [PubMed] [Google Scholar]
- 12. Li X, Xu S, Yu M et al Risk factors for severity and mortality in adult COVID‐19 inpatients in Wuhan. J Allergy Clin Immunol 2020; 146: 110–118. [DOI] [PMC free article] [PubMed] [Google Scholar]
- 13. Metlay JP, Waterer GW, Long AC et al Diagnosis and treatment of adults with community‐acquired pneumonia. An Official Clinical Practice Guideline of the American Thoracic Society and Infectious Diseases Society of America. Am J Respir Crit Care Med 2019; 200: e45–e67. [DOI] [PMC free article] [PubMed] [Google Scholar]
- 14. Hadjadj J, Yatim N, Barnabei L et al Impaired type I interferon activity and inflammatory responses in severe COVID‐19 patients. Science 2020; 369: 718–724. [DOI] [PMC free article] [PubMed] [Google Scholar]
- 15. Chen G, Wu D, Guo W et al Clinical and immunological features of severe and moderate coronavirus disease 2019. J Clin Invest 2020; 130: 2620–2629. [DOI] [PMC free article] [PubMed] [Google Scholar]
- 16. Boyman O, Sprent J. The role of interleukin‐2 during homeostasis and activation of the immune system. Nat Rev Immunol 2012; 12: 180–190. [DOI] [PubMed] [Google Scholar]
- 17. Rubin LA, Nelson DL. The soluble interleukin‐2 receptor: biology, function, and clinical application. Ann Intern Med 1990; 113: 619–627. [DOI] [PubMed] [Google Scholar]
- 18. Buszko M, Park JH, Verthelyi D, Sen R, Young HA, Rosenberg AS. The dynamic changes in cytokine responses in COVID‐19: a snapshot of the current state of knowledge. Nat Immunol 2020; 21: 1146–1151. [DOI] [PubMed] [Google Scholar]
- 19. Zhou X, Ramachandran S, Mann M, Popkin DL. Role of lymphocytic choriomeningitis virus (LCMV) in understanding viral immunology: past, present and future. Viruses 2012; 4: 2650–2669. [DOI] [PMC free article] [PubMed] [Google Scholar]
- 20. Puglielli MT, Browning JL, Brewer AW et al Reversal of virus‐induced systemic shock and respiratory failure by blockade of the lymphotoxin pathway. Nat Med 1999; 5: 1370–1374. [DOI] [PubMed] [Google Scholar]
- 21. Stamm A, Valentine L, Potts R, Premenko‐Lanier M. An intermediate dose of LCMV clone 13 causes prolonged morbidity that is maintained by CD4+ T cells. Virology 2012; 425: 122–132. [DOI] [PMC free article] [PubMed] [Google Scholar]
- 22. Christiaansen AF, Schmidt ME, Hartwig SM, Varga SM. Host genetics play a critical role in controlling CD8 T cell function and lethal immunopathology during chronic viral infection. PLoS Pathog 2017; 13: e1006498. [DOI] [PMC free article] [PubMed] [Google Scholar]
- 23. Oldstone MBA, Ware BC, Horton LE et al Lymphocytic choriomeningitis virus Clone 13 infection causes either persistence or acute death dependent on IFN‐1, cytotoxic T lymphocytes (CTLs), and host genetics. Proc Natl Acad Sci USA 2018; 115: E7814–E7823. [DOI] [PMC free article] [PubMed] [Google Scholar]
- 24. Zhang Y, Wang X, Li X et al Potential contribution of increased soluble IL‐2R to lymphopenia in COVID‐19 patients. Cell Mol Immunol 2020; 17: 878–880. [DOI] [PMC free article] [PubMed] [Google Scholar]
- 25. Kaech SM, Cui W. Transcriptional control of effector and memory CD8+ T cell differentiation. Nat Rev Immunol 2012; 12: 749–761. [DOI] [PMC free article] [PubMed] [Google Scholar]
- 26. Wu W, Zhou Q, Masubuchi T et al Multiple signaling roles of CD3epsilon and its application in CAR‐T cell therapy. Cell 2020; 182: 855–871.e823. [DOI] [PubMed] [Google Scholar]
- 27. Zhang JY, Wang XM, Xing X et al Single‐cell landscape of immunological responses in patients with COVID‐19. Nat Immunol 2020; 21: 1107–1118. [DOI] [PubMed] [Google Scholar]
- 28. Vijay R, Hua X, Meyerholz DK et al Critical role of phospholipase A2 group IID in age‐related susceptibility to severe acute respiratory syndrome‐CoV infection. J Exp Med 2015; 212: 1851–1868. [DOI] [PMC free article] [PubMed] [Google Scholar]
- 29. Smyth RL, Fletcher JN, Thomas HM, Hart CA. Immunological responses to respiratory syncytial virus infection in infancy. Arch Dis Child 1997; 76: 210–214. [DOI] [PMC free article] [PubMed] [Google Scholar]
- 30. Smyth RL, Fletcher JN, Thomas HM, Hart CA, Openshaw PJ. Respiratory syncytial virus and wheeze. Lancet 1999; 354: 1997–1998. [DOI] [PubMed] [Google Scholar]
- 31. Sananez I, Raiden S, Erra‐Diaz F et al Dampening of IL‐2 function in infants with severe respiratory syncytial virus disease. J Infect Dis 2018; 218: 75–83. [DOI] [PubMed] [Google Scholar]
- 32. Bradley‐Stewart A, Jolly L, Adamson W et al Cytokine responses in patients with mild or severe influenza A(H1N1)pdm09. J Clin Virol 2013; 58: 100–107. [DOI] [PubMed] [Google Scholar]
- 33. Wang Z, Wan Y, Qiu C et al Recovery from severe H7N9 disease is associated with diverse response mechanisms dominated by CD8+ T cells. Nat Commun 2015; 6: 6833. [DOI] [PMC free article] [PubMed] [Google Scholar]
- 34. Israelow B, Song E, Mao T et al Mouse model of SARS‐CoV‐2 reveals inflammatory role of type I interferon signaling. J Exp Med 2020; 217: e20201241. [DOI] [PMC free article] [PubMed] [Google Scholar]
- 35. Winkler ES, Bailey AL, Kafai NM et al SARS‐CoV‐2 infection of human ACE2‐transgenic mice causes severe lung inflammation and impaired function. Nat Immunol 2020; 21: 1327–1335. [DOI] [PMC free article] [PubMed] [Google Scholar]
- 36. WHO Organization .Laboratory testing for 2019 novel coronavirus (2019‐nCoV) in suspected human cases. https://wwwwhoint/publications‐detail/laboratory‐testing‐for‐2019‐novel‐coronavirus‐in‐suspected‐human‐cases‐20200117.
- 37. WHO Organization .Clinical management of severe acute respiratory infection when novel coronavirus (nCoV) infection is suspected: interim guidance. https://wwwwhoint/internal‐publications‐detail/clinical‐managementof‐severe‐acute‐respiratory‐infection‐when‐novel‐coronavirus‐(ncov)‐infection‐is‐suspected.
- 38. Welsh RM, Seedhom MO. Lymphocytic choriomeningitis virus (LCMV): propagation, quantitation, and storage. Curr Protoc Microbiol 2008; 8; Chapter 15: Unit 15A 11. [DOI] [PMC free article] [PubMed] [Google Scholar]
Associated Data
This section collects any data citations, data availability statements, or supplementary materials included in this article.
Supplementary Materials
Data Availability Statement
Further information and requests for resources and reagents should be directed to and will be fulfilled by the Lead Contact, Di YU (di.yu@uq.edu.au).