

Abstract
Objective
Cadaveric simulations have shown endonasal drilling and cautery generate aerosols, which is a significant concern for otolaryngologists during the COVID‐19 era. This study quantifies aerosol generation during routine rhinologic surgeries and in‐office procedures in live patients.
Methods
Aerosols ranging from 0.30 to 10.0 μm were measured in real‐time using an optical particle sizer during surgeries and in‐office procedures. Various mask conditions were tested during rigid nasal endoscopy (RNE) and postoperative debridement (POD).
Results
Higher aerosol concentrations (AC) ranging from 2.69 to 10.0 μm were measured during RNE (n = 9) with no mask vs two mask conditions (P = .002 and P = .017). Mean AC (0.30‐10.0 μm) were significantly higher during POD (n = 9) for no mask vs a mask covering the patient's mouth condition (mean difference = 0.16 ± 0.03 particles/cm3, 95% CI 0.10‐0.22, P < .001). There were no discernible spikes in aerosol levels during endoscopic septoplasty (n = 3). Aerosol spikes were measured in two of three functional endoscopic sinus surgeries (FESS) with microdebrider. Using suction mitigation, there were no discernible spikes during powered drilling in two anterior skull base surgeries (ASBS).
Conclusion
Use of a surgical mask over the patient's mouth during in‐office procedures or a mask with a slit for an endoscope during RNE significantly diminished aerosol generation. However, whether this reduction in aerosol generation is sufficient to prevent transmission of communicable diseases via aerosols was beyond the scope of this study. There were several spikes in aerosols during FESS and ASBS, though none were associated with endonasal drilling with the use of suction mitigation.
Level of Evidence
4.
Keywords: aerosol‐generating procedure, airborne, COVID‐19, endonasal drilling, novel coronavirus, SARS‐CoV‐2, sinus surgery, skull base surgery

1. INTRODUCTION
The coronavirus disease 2019 (COVID‐19) is caused by a highly infectious novel viral strain, named as the severe acute respiratory syndrome coronavirus‐2 (SARS‐CoV‐2). The World Health Organization (WHO) has declared the outbreak a pandemic with over 77 million confirmed cases and nearly 1.7 million deaths globally as of December 24, 2020. 1 Initial research suggests that SARS‐CoV‐2 is transmitted not only through large respiratory droplets but also through airborne aerosols smaller than 5 μm, which can remain suspended for several hours. 2 , 3
Endoscopic endonasal procedures have been of particular concern for Otolaryngologists due to the high viral load in the upper airway of infected patients. 4 A droplet analysis study reported only minimal droplet production during functional endoscopic sinus surgery (FESS) with microdebrider and powered endonasal drilling, which resolved with the use of concurrent suction. 5 However, three cadaveric studies have shown that endonasal techniques, including drilling and cautery, generate significant aerosol concentrations (AC) over baseline levels. 6 , 7 , 8
As these previous surgical simulations were performed on cadaver heads, it is certainly plausible that the lack of normal physiologic temperature and blood flow, intranasal secretions, and disease conditions such as nasal polyposis influenced aerosol production and mitigation. Recently, Murr et al reported that although there was no significant aerosol generation with diagnostic nasal endoscopy, there were significant increases in AC during cold instrumentation and with the use of suction during sinonasal debridement. 9 The same group also found that significant increases in AC were attributed to the endonasal use of a microdebrider and drill at the position of the surgeon during endonasal surgery on live patients in the operating room. 10 The present study was designed to further contribute to our knowledge base by quantifying the concentration of generated aerosols during routine rhinologic procedures in clinic with and without mask conditions and surgeries in the operating room (OR) on alive patients using a real‐time aerosol measuring instrument.
2. MATERIALS AND METHODS
2.1. Supplies and equipment
This study was reviewed by the Indiana University School of Medicine Institutional Review Board (IRB) and deemed exempt because it did not involve the collection of any patient protected health information (IRB protocol #2005714775). The recording of aerosol data was performed either in a clinic room if during a procedure conducted during an outpatient clinic visit or the OR if during a surgery requiring general anesthesia. In‐office procedures were performed in clinic rooms of the same size (dimensions: 11 × 10.5 × 8 ft). All septoplasty and FESS with microdebrider surgeries were performed in the same operating room (dimensions: 23 × 26 × 10 ft), and both anterior skull base surgeries were performed in the separate, second, operating room (dimensions: 24.5 × 27 × 10 ft). FESS without powered instrumentation was performed in a separate, third, operating room (dimensions: 21.5 × 19.3 × 10 ft). Operating suites were rated at 20 air changes per hour. A sampling of aerosols was performed using an optical particle sizer (OPS 3330; TSI Inc), which measures particle number concentration by size from 0.30 to 10.0 μm (16 channels per decade). The sampling flow rate through the OPS 3330's 3‐mm inlet port was 1.0 L/min. Table 1 shows the 16 channels separated into 3 particle size ranges: 0.30 to 0.90, 0.90 to 2.69, and 2.69 to 10.0 μm. All clinic and OR procedures were performed by a fellowship‐trained, right‐handed rhinologist (J.Y.T or E.A.I.).
TABLE 1.
Aerosol generation vs baseline levels during rigid nasal endoscopy
| Particle size, μm | Concentration, particles/cm3 | P‐value | |||||
|---|---|---|---|---|---|---|---|
| No mask | Mask | VENT mask | |||||
| Mean (SD) | 95% CI | Mean (SD) | 95% CI | Mean (SD) | 95% CI | ||
| ≥0.30 to <10.0 | −0.143 (0.703) |
−0.258, −0.027 |
−0.0556 (0.317) |
−0.105, −0.006 |
−0.0427 (0.466) |
−0.122, 0.037 |
.21 |
| ≥0.30 to <0.90 | −0.161 (0.695) |
−0.275, −0.046 |
−0.0564 (0.309) |
−0.105, −0.008 |
−0.0370 (0.450) |
−0.114, 0.040 |
.09 |
| ≥0.90 to <2.69 | 0.0130 (0.0851) |
−0.001, 0.027 |
−0.000782 (0.0678) |
−0.011, 0.010 |
0.00920 (0.0800) |
−0.004, 0.023 |
.06 |
| ≥2.69 to <10.0 | 0.00522 (0.042) |
−0.002, 0.012 |
0.00158* (0.0486) |
−0.006, 0.009 |
−0.0149* (0.0535) |
−0.024, −0.006 |
.002 |
Abbreviation: VENT, valved endoscopy of the nose and throat.
Post hoc analysis compared to no mask with P‐value < .05.
2.2. Aerosol sampling during rhinologic procedures in clinic
Prior to each sampling, background aerosol levels were measured once every second for 1 minute, resulting in a total of 60 samples. The OPS 3330's inlet port was positioned 30 cm from the midline columella on the patient's left side. Aerosol levels during each rigid nasal endoscopy (n = 9) and post‐operative sinus debridement (n = 6) were measured once every second for the entire duration of the respective procedure. For rigid nasal endoscopy, the patient was asked to either (a) completely remove their surgical mask for the procedure (n = 3; denoted “no mask”), (b) wear a standard hospital‐issued surgical mask and only lower the mask to uncover the nares directly prior to beginning the procedure (n = 3; denoted “mask”), or (c) wear a valved endoscopy of the nose and throat (VENT) mask 6 for the duration of the procedure (n = 3; denoted “VENT”). For each postoperative sinus debridement, the patient was asked to either (a) completely remove their surgical mask for the procedure (n = 3; denoted “no mask”), or (b) wear a standard hospital‐issued surgical mask and only uncover the nares directly prior to beginning the procedure (n = 3; denoted “mask”).
2.3. Aerosol sampling during rhinologic surgeries in the operating room
Prior to each sampling, background aerosol levels were measured once every second for 1 minute, resulting in a total of 60 samples. The OPS 3330's inlet port was positioned 40 cm from the midline columella on the patient's left side. Aerosol levels were measured once every second for the entire duration of each respective surgery, which included endoscopic septoplasty (n = 3), standard microdebrider (Straightshot M5 microdebrider; 4.3 mm diameter; 5000 rpm; Medtronic) FESS (n = 3), FESS performed with only non‐powered instrumentation (n = 1), trans‐sphenoidal hypophysectomy (TPH; n = 1), and cerebrospinal fluid (CSF) leak repair (n = 1). Measurements began at the start of each case. During the TPH and CSF leak repair, both a rigid suction within the anterior ipsilateral nasal cavity and a flexible tracheal suction within the nasopharynx were maintained during all instances of powered drilling (Pi Drive Motor REF #5407‐100‐000; 4‐mm diamond burr; 75 000 rpm; Stryker) utilizing a 4‐handed technique with two operators including the surgeon and an assistant. Spikes were defined as sustained elevations in AC, which were greater than two SDs above baseline for at least 1 minute.
2.4. Statistical analysis
All statistical analyses were performed using the Statistical Package for Social Sciences (IBM SPSS Statistics for Windows, Version 20.0; IBM Corp., Armonk, New York). One‐way analysis of variance (ANOVA) and Kruskal‐Wallis H‐tests were used to compare mean aerosol concentrations among the three rigid nasal endoscopy conditions. Independent samples t tests and Mann‐Whitney U‐tests were used for post‐hoc testing for each, respectively, with Bonferroni correction for multiple comparisons. A P‐value of <.05 was used to determine statistical significance.
3. RESULTS
3.1. Aerosol concentrations during rigid nasal endoscopy
Endoscopy was performed for a total of 144 seconds with no mask, 160 seconds with the surgical mask, and 135 seconds with the VENT mask. After subtracting background aerosol concentrations measured prior to each procedure, a one‐way ANOVA showed that there was no statistically significant difference in average mean concentrations of 0.30 to 10.0 μm aerosols among groups (F [2, 436] = 1.59, P = .21) (Table 1). There was also no statistically significant difference in mean concentrations of 0.30 to 0.90 μm aerosols (F [2, 436] = 2.49, P = .09) or 0.90 to 2.69 μm aerosols (H (2) = 5.74, P = .06), though the latter was trending toward significance. However, there was a highly significant difference in mean concentrations of 2.69 to 10.0 μm aerosols among groups (H (2) = 12.09, P = .002) with the no mask condition associated with higher concentrations compared to both the surgical mask (P = .004, U = 46.669) and the VENT mask (P = 0.017, U = 42.041); there was no significant difference between the surgical mask and VENT mask (P = 1.00, U = −4.628).
3.2. Aerosol concentrations during postoperative debridement
Aerosols were measured for a total of 1117 seconds with no mask and 1498 seconds with a mask. After subtracting background aerosol concentrations measured prior to each procedure, the mean concentration of 0.30 to 10.0 μm aerosols was statistically significantly higher for debridement performed with no mask (mean difference = 0.16 ± 0.03 particles/cm3, 95% CI 0.10‐0.22, P < .001). The maximum 0.30 to 10.0 μm aerosol concentrations measured at a single point in time were 2.81 particles/cm3 for no mask and 2.54 particles/cm3 for with a mask. There was no statistically significant difference in the 0.30 to 0.90 μm range aerosols, but statistically significant differences were present for particles ≥ 0.90 μm (Table 2).
TABLE 2.
Aerosol generation vs baseline levels during postoperative debridements
| Particle size, μm | Concentration, particles/cm3 | P‐value | |||
|---|---|---|---|---|---|
| No mask | Mask | ||||
| Mean (SD) | 95% CI | Mean (SD) | 95% CI | ||
| ≥0.30 to <10.0 | 0.178 (0.903) |
0.125, 0.231 |
0.0194 (0.649) |
−0.014, 0.052 |
<.001 |
| ≥0.30 to <0.90 | 0.0916 (0.897) |
0.039, 0.144 |
0.0692 (0.647) |
0.036, 0.102 |
.48 |
| ≥0.90 to <2.69 | 0.0765 (0.109) |
0.070, 0.083 |
−0.0266 (0.103) |
−0.032, −0.021 |
<.001 |
| ≥2.69 to <10.0 | 0.00963 (0.0447) |
0.007, 0.012 |
−0.0233 (0.0607) |
−0.026, −0.020 |
<.001 |
3.3. Aerosol concentrations during septoplasty
Mean 0.30 to 10.0 μm aerosol concentrations for every minute of each case are shown in Figure 1. There were no discernible spikes in aerosols during the three cases.
FIGURE 1.

Aerosol concentrations during septoplasty: A, Case 1; B, Case 2; C, Case 3. max = maximum; min = minute
3.4. Aerosol concentrations during functional endoscopic sinus surgery
For the three standard FESS performed with microdebrider (denoted “microdebrider FESS”), mean 0.30‐10.0 μm ACs for every minute of each case are shown in Figure 2. Spikes in ACs occurred in two of the three cases (Figure 2B,C) and were associated with the use of non‐powered instrumentation (NPI; maximum = 0.84 particles/cm3), sphenoid sinus irrigation (SSI; maximum = 1.32 particles/cm3), repositioning of the patient's head (RPH; maximum = 2.70 particles/cm3), and the removal of head drapes following completion of the operation (maximum = 7.57 particles/cm3). Though there were no discernible spikes in aerosols during the first microdebrider FESS (Figure 2A), aerosol concentrations were consistently elevated over mean baseline aerosol levels in all three cases. The maximum aerosol concentrations for each particle size range are shown in Table 3.
FIGURE 2.

Aerosol concentrations during functional endoscopic sinus surgery with microdebrider. A, Case 1; B, Case 2; C, Case 3. Gray indicates timing of microdebrider use. FESS = functional endoscopic sinus surgery; max = maximum; min = minute
TABLE 3.
Maximum aerosol concentrations during functional endoscopic sinus surgery with microdebrider
| Particle size, μm | Aerosol concentration, particles/cm3 | |||||
|---|---|---|---|---|---|---|
| Baseline mean | Non‐powered instrumentation Max | Sphenoid sinus irrigation Max | Head repositioning Max | Drape removal Max | Microdebrider Max | |
| ≥0.30 to <10.0 | 0.0300 | 0.840 | 1.32 | 2.70 | 7.57 | 0.660 |
| ≥0.30 to <0.90 | 0.0170 | 0.420 | 1.02 | 0.780 | 3.42 | 0.420 |
| ≥0.90 to <2.69 | 0.0120 | 0.300 | 0.240 | 1.32 | 2.94 | 0.180 |
| ≥2.69 to <10.0 | 0.00100 | 0.120 | 0.0600 | 0.600 | 1.20 | 0.180 |
Abbreviation: Max, maximum.
An additional FESS was performed solely with non‐powered instrumentation (denoted “cold FESS”). Mean 0.30 to 10.0 μm aerosol concentrations for every minute of this case are shown in Figure 3. There were no discernible spikes in aerosols during the cases.
FIGURE 3.

Aerosol concentrations during functional endoscopic sinus surgery with non‐powered instrumentation. FESS = functional endoscopic sinus surgery; max = maximum; min = minute
3.5. Aerosol concentrations during anterior skull base surgery
Figure 4 shows the mean aerosol concentrations in the range from 0.30 to 10.0 μm for every minute of one TPH (Figure 4A) and one CSF leak repair (Figure 4B). During the TPH, the only spike in aerosols was observed shortly after the utilization of dural sealant spray (maximum = 15.3 particles/cm3). Spikes in aerosol concentrations during the CSF leak repair occurred during the use of non‐powered instrumentation (maximum = 1.74 particles/cm3), needle tip electrocautery (maximum = 11.8 particles/cm3), and coblator (maximum = 14.5 particles/cm3). The maximum aerosol concentrations for each particle size range are shown in Table 4. There were no discernible spikes in aerosols during high‐speed, powered, endonasal drilling in either procedure.
FIGURE 4.
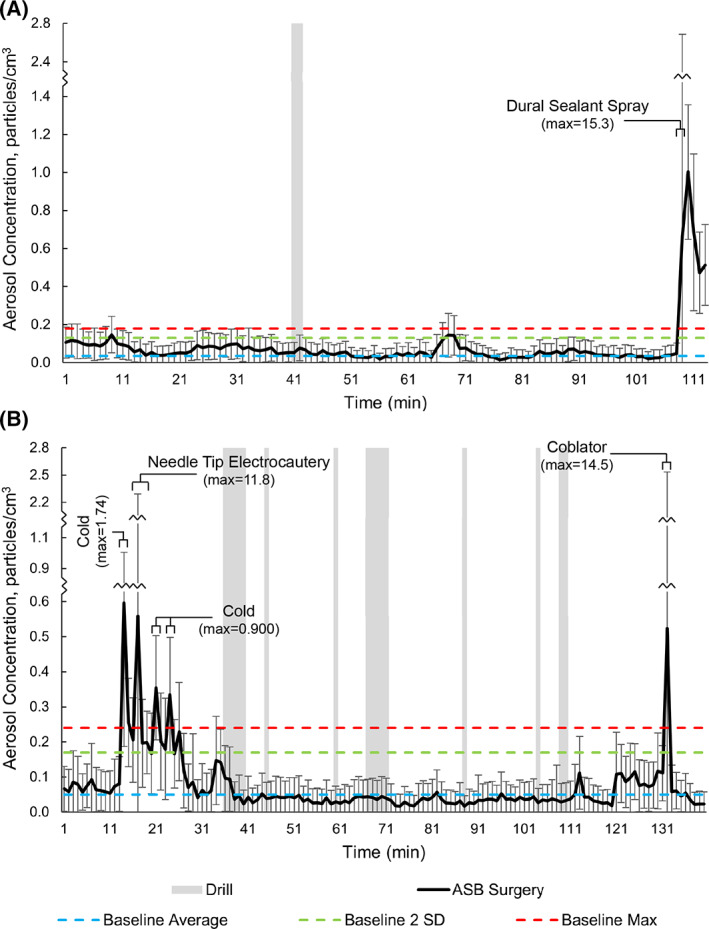
Aerosol concentrations during anterior skull base surgery: A, trans‐sphenoidal hypophysectomy; B, cerebrospinal fluid leak repair. Gray indicates timing of drill use. ASB = anterior skull base; max = maximum; min = minute
TABLE 4.
Maximum aerosol concentrations during anterior skull base surgery
| Particle size, μm | Aerosol Concentration, particles/cm3 | |||||
|---|---|---|---|---|---|---|
| Baseline mean | Dural sealant spray max | Non‐powered instrumentation Max | Needle tip electrocautery Max | Coblator Max | Drill Max | |
| ≥0.30 to <10.0 | 0.0500 | 15.3 | 1.74 | 11.8 | 14.5 | 0.480 |
| ≥0.30 to <0.90 | 0.0280 | 13.1 | 1.26 | 6.31 | 4.87 | 0.300 |
| ≥0.90 to <2.69 | 0.0190 | 2.16 | 0.600 | 4.45 | 2.37 | 0.240 |
| ≥2.69 to <10.0 | 0.00300 | 0.120 | 0.300 | 1.08 | 8.03 | 0.0600 |
Abbreviation: Max, maximum.
4. DISCUSSION
As a gradual increase in clinical activity and return to performing elective surgeries is being undertaken throughout the United States, many questions remain in regards to performing these surgeries while avoiding or minimizing undue risk to providers and patients. Of particular concern is aerosol‐generating procedures, as the airborne particles generated by COVID‐19 patients are a suspected transmission vector for the virus. 11 Rhinologic procedures may warrant special concern, as the nasal cavity has been shown to harbor high viral load in infected patients. 4 Information about which procedures and events are aerosol‐generating and how to mitigate this aerosolization is a critical knowledge gap in the field. The data presented here on both in‐office and operating room rhinologic procedures may help shed some light on these critical issues during a key transition point during an ongoing pandemic.
During routine nasal endoscopy, this study demonstrates no differences in overall (0.30‐10 μm) mean concentrations between the three mask conditions. In comparing the three conditions with respect to different size particles, however, there were significantly higher concentrations of aerosols measured in the range of 2.69 to 10.0 μm in patients who did not wear a mask, though no difference in the range of 0.30 to 2.69 μm. The lack of small particles is reassuring, as larger particles travel less distances, linger for shorter periods, and are less likely to penetrate an N95 mask. 12 The interventions of patients wearing a mask covering their mouth or a VENT mask were both effective in mitigating the aerosols in the range of 2.69 to 10.0 μm with no superiority, which suggests that these larger particles may have been produced via the oral airway. Even though the relative differences in aerosol concentrations between interventions appear small, these results are important in the setting of the current pandemic. The exact infectious potential of these particles and a definitive concentration of aerosol exposure capable of transmission between individuals is unknown, so any realistic intervention capable of mitigating risk, such as utilizing a mask to cover the mouth during in‐office procedures, should be utilized as appropriate.
Interestingly, postoperative debridement of the sinonasal cavities resulted in significantly higher aerosol levels in patients not wearing a mask compared to patients wearing one covering their mouth, specifically in the 0.90 to 10.0 μm range. As the VENT mask only has a single slit for a nasal endoscope, it was deemed not to be a viable option for this in‐office procedure which requires two instruments in the nasal cavity at a time. It is also worth noting that no patients sneezed during any of the in‐office procedures performed for this study. Thus, there could be a higher risk of aerosol generation with patients more sensitive to the procedures. While a recent study also utilizing an optical particle sizer reported increases in aerosols during post‐operative sinonasal debridement, 9 this study is the first to investigate and demonstrate a difference in aerosol exposure with a mask serving as a barrier to the oral cavity.
During FESS, mean ACs were consistently elevated over mean baseline aerosol levels in the three cases during which the microdebrider was utilized as the primary dissection tool. FESS was also performed with entirely non‐powered instrumentation to determine the risks associated with microdebrider dissection, and the mean 0.30 to 10 μm aerosol concentration was significantly higher during cold FESS when compared to microdebrider FESS. This defies the expectation that powered instrumentation should produce greater aerosols. One possible explanation for this is that the suction from the microdebrider was able to mitigate aerosolization, whereas cold, non‐powered instrumentation allows less opportunity to maintain a suction in the nasal cavity, as both the surgeon's hands are occupied.
Brief spikes in ACs following repositioning of the patient's head and the removal of sterile drapes covering the head and face may suggest that aerosols and droplets settling onto fabric during a case may become airborne once again upon manipulation of patient coverings. Though there was a spike in aerosol concentration with a single episode of sphenoid sinus irrigation, there were no spikes with other instances of endonasal irrigation which included both the maxillary and sphenoid sinuses. The spike in aerosols associated with endonasal irrigation is likely multifactorial. Aerosolization of saline seems a likely proponent. It is possible that the walls of the nasal cavity create a confined space in which aerosols generated during dissection or other parts of the surgery become trapped, and irrigation with saline could serve as a force that propels these lingering aerosols out of the nasal cavity. A cadaveric simulation has shown that the use of intranasal suctioning reduces aerosol spread, 7 but the possibility of aerosols remaining in the nasal cavity despite this measure cannot be excluded.
Though several cadaveric simulation studies have been designed to test aerosol generation from the use of a variety of endonasal instruments for limited time periods, 6 , 7 , 8 this study contributes to the rapidly evolving field by measuring it for the entire duration of routine in‐office rhinologic procedures and OR surgeries in live patients. In this study, we confirmed the recently published findings in two cadaver simulations of suction devices mitigating aerosol generation during powered, endonasal drilling 7 , 8 during real‐time surgeries of the anterior skull base. Moreover, Workman et al 7 reported aerosol generation in the 1.0 to 10.0 μm range, however, this study also reports aerosol levels in the submicron range of 0.30 to 1.0 μm utilizing the same OPS in the previously published cadaver simulations. 7 , 8 The presence of these small particles is of particular concern because they are more likely to penetrate an N95 mask. 12
A recent study also investigating aerosol exposure in the operating room during endoscopic sinonasal surgery reported increases in aerosols associated with the microdebrider and drill, 10 which our study did not find. Murr et al measured aerosols during twenty‐second intervals at various timepoints of surgery when different instruments were being used, while our study measured aerosols during the entirety of surgical cases. With these differences in methodology, Murr et al included 2660 seconds of measurements from five cases in the operating room while our study included 32 065 seconds of measurements from five cases. Nonetheless, the reasoning behind these differences is unclear and will require further research to elucidate.
Several limitations to this study merit discussion. The experimental design measures the concentration of aerosols specifically in the range from 0.30 to 10.0 μm, and the OPS does not provide any information regarding the presence of viral particles or the infectious potential of the aerosols measured. Compared to the cadaveric simulations that have been published on this topic, the OPS was positioned further away from the surgical site to not interfere with the operation. Thus, our results from the operating room may underestimate aerosol concentrations in the immediate vicinity of the surgical field. This study was performed in operating rooms of a single health system. Other operating rooms with different air circulation patterns, air change rates, or room pressure may change the behavior of these aerosols. Due to these comparative limitations and the previously published work based on cadaveric simulations, we recommend these data be used to complement rather than discount previously published findings.
5. CONCLUSION
Use of a surgical mask over the patient's mouth during in‐office procedures or a VENT mask during RNE diminished aerosol generation. However, whether this reduction in aerosol generation is sufficient to prevent transmission of communicable diseases via aerosols was beyond the scope of this study. In the operating room, there were several spikes in aerosol levels during microdebrider FESS, which were associated with the use of non‐powered instrumentation, sphenoid sinus irrigation, repositioning of the patient's head, and removal of the drapes following completion of the procedure. There were also several spikes during ASBS, which were associated with the use of dural sealant spray, needle tip electrocautery, and coblator. There were no spikes in aerosol levels during endonasal drilling with the use of suction mitigation.
CONFLICT OF INTEREST
The authors have no conflict of interest to disclose.
Sharma D, Campiti VJ, Ye MJ, et al. Aerosol generation during routine rhinologic surgeries and in‐office procedures. Laryngoscope Investigative Otolaryngology. 2021;6:49–57. 10.1002/lio2.520
BIBLIOGRAPHY
- 1.Coronavirus disease 2019. (COVID‐19) Dashboard; https://covid19.who.int/ Accessed December 24, 2020.
- 2. Bourouiba L. Turbulent gas clouds and respiratory pathogen emissions: potential implications for reducing transmission of COVID‐19. JAMA. 2020;323(18):1837‐1838. [DOI] [PubMed] [Google Scholar]
- 3. van Doremalen N, Bushmaker T, Morris DH, et al. Aerosol and surface stability of SARS‐CoV‐2 as compared with SARS‐CoV‐1. N Engl J Med. 2020;382(16):1564‐1567. [DOI] [PMC free article] [PubMed] [Google Scholar]
- 4. Zou L, Ruan F, Huang M, et al. SARS‐CoV‐2 viral load in upper respiratory specimens of infected patients. N Engl J Med. 2020;382(12):1177‐1179. [DOI] [PMC free article] [PubMed] [Google Scholar]
- 5. Sharma D, Rubel KE, Ye MJ, et al. Cadaveric simulation of endoscopic endonasal procedures: analysis of droplet splatter patterns during the COVID‐19 pandemic. Otolaryngology–Head and Neck Surg. 2020;163(1):145‐150. [DOI] [PMC free article] [PubMed] [Google Scholar]
- 6. Workman AD, Jafari A, Welling DB, et al. Airborne aerosol generation during endonasal procedures in the era of COVID‐19: risks and recommendations. Otolaryngology—Head Neck Surg. 2020;163(3):465‐470. [DOI] [PMC free article] [PubMed] [Google Scholar]
- 7. Workman AD, Xiao R, Feng A, et al. Suction mitigation of airborne particulate generated during sinonasal drilling and cautery. Int Forum Allergy Rhinol. 2020;18(10):22644. [DOI] [PMC free article] [PubMed] [Google Scholar]
- 8. Sharma D, Ye MJ, Campiti VJ, et al. Mitigation of aerosols generated during rhinologic surgery: a pandemic‐era cadaveric simulation. Otolaryngology—Head Neck Surg. 2020;1‐10. 10.1177/2F0194599820951169. [DOI] [PMC free article] [PubMed] [Google Scholar]
- 9. Murr AT, Lenze NR, Gelpi MW, et al. Quantification of aerosol concentrations during endonasal instrumentation in the clinic setting. Laryngoscope. 2020:1‐6. https://pubmed.ncbi.nlm.nih.gov/33017067/. [DOI] [PMC free article] [PubMed] [Google Scholar]
- 10. Murr AT, Lenze NR, Brown WC, et al. Quantification of aerosol concentrations during endoscopic sinonasal surgery in the operating room. Am J Rhinol Allergy. 2020:1‐6. https://pubmed.ncbi.nlm.nih.gov/33012174/. [DOI] [PMC free article] [PubMed] [Google Scholar]
- 11. Wang J, Du G. COVID‐19 may transmit through aerosol. Ir J Med Sci. 2020;189(4):1143‐1144. [DOI] [PMC free article] [PubMed] [Google Scholar]
- 12. Qian Y, Willeke K, Grinshpun SA, Donnelly J, Coffey CC. Performance of N95 respirators: filtration efficiency for airborne microbial and inert particles. Am Ind Hyg Assoc J. 1998;59(2):128‐132. [DOI] [PubMed] [Google Scholar]