Summary
Severe respiratory infections can result in acute respiratory distress syndrome (ARDS)1. There are no effective pharmacological therapeutics that have been shown to improve outcomes for patients with ARDS. Although the host inflammatory response limits spread of and eventually clears the pathogen, immunopathology is a major contributor to tissue damage and ARDS1,2. In this study, we demonstrate that respiratory viral infection induces distinct fibroblast activation states, which we term extracellular matrix (ECM)-synthesizing, damage-responsive, and interferon-responsive. We provide evidence that the exuberant activity of damage-responsive lung fibroblasts drives lethal immunopathology during severe influenza virus infection. By producing ECM remodeling enzymes, in particular the ECM protease ADAMTS-4, and inflammatory cytokines, damage-responsive fibroblasts modify the lung microenvironment to promote robust immune cell infiltration at the expense of lung function. In three human cohorts, the levels of ADAMTS-4 in the lower respiratory tract were associated with the severity of seasonal and avian influenza virus infections. A therapeutic that targets the ECM protease activity of damage-responsive lung fibroblasts could provide a promising approach to preserving lung function and improving clinical outcomes following severe respiratory infections.
Respiratory infections are a leading cause of morbidity and mortality3. These infections can result in acute respiratory distress syndrome (ARDS) with pulmonary edema and hypoxia, ranging from mild to severe respiratory failure1. Much of the lung damage induced by viral infection is a result of infiltrating immune cells, which kill infected and bystander cells4. Defining the mechanisms that alter the balance between pathogen clearance and immunopathology may identify strategies to improve outcomes following ARDS2. Therapeutic targets include components of the lung extracellular matrix (ECM), which provides structural support that is critical for lung function and tissue-specific signals to coordinate immune responses5.
The ECM consists of proteins as well as proteases and glycosidases that degrade or modify the ECM6. Upon lung injury, ECM proteases are upregulated and remodel the ECM, facilitating the migration of immune cells to sites of inflammation5,7. Non-immune lung cells, including epithelial cells, endothelial cells, and fibroblasts, coordinate immune responses and directly mediate lung function8. Through their remodeling activity, specific cell populations can influence the outcome of infection and long-term sequelae, as has been described for myofibroblasts and lung fibrosis9. The role of lung stromal cell populations in coordinating host responses to active respiratory infections has received less attention than their role in late-stage repair following pathogen clearance. While there is extensive literature investigating how immune cells regulate the host response to respiratory viral infection8, there is less information on the heterogeneity and role of non-hematopoietic cells.
Stromal responses to influenza infection
We sorted live, CD45-lung cells from mice 0, 1, 3, and 6 days after influenza virus infection and performed single-cell gene expression profiling (scGEX) identifying three main populations: fibroblasts, epithelial, and endothelial cells (Fig. 1a,b, Extended Data Fig. 1a,b). High levels of viral mRNA, indicative of productive infection, were primarily detected in type-I pneumocytes, ciliated epithelial cells, and type-II pneumocytes (Extended Data Fig. 1c). Fibroblasts were particularly dynamic with multiple transcriptional states emerging following infection (Fig. 1c,d; Extended Data Fig. 1d). To assess the pathways active in each cluster, we performed gene-set enrichment analysis (GSEA) comparing each to a putative baseline cluster (5) that was present prior to infection with few differentially expressed genes (Extended Data Fig. 2a). We identified three primary functional groups based on gene expression: resting, ECM-synthesizing, and inflammatory (Fig. 1c, Extended Data Fig. 2a). ECM-synthesizing fibroblasts (ESFibs) were enriched for genes encoding ECM structural proteins, but lacked inflammatory signatures (Fig. 1d, Extended Data Fig. 2a). Inflammatory fibroblasts had high expression of genes involved in type-I interferon, IL-6, or NFkB signaling, while resting fibroblasts lacked strong enrichment for pathways involved in either inflammatory responses or synthesis of ECM proteins. (Fig. 1e, Extended Data Fig. 2a).
Figure 1. Single-cell gene expression profiling of CD45-cells during severe IAV infection.
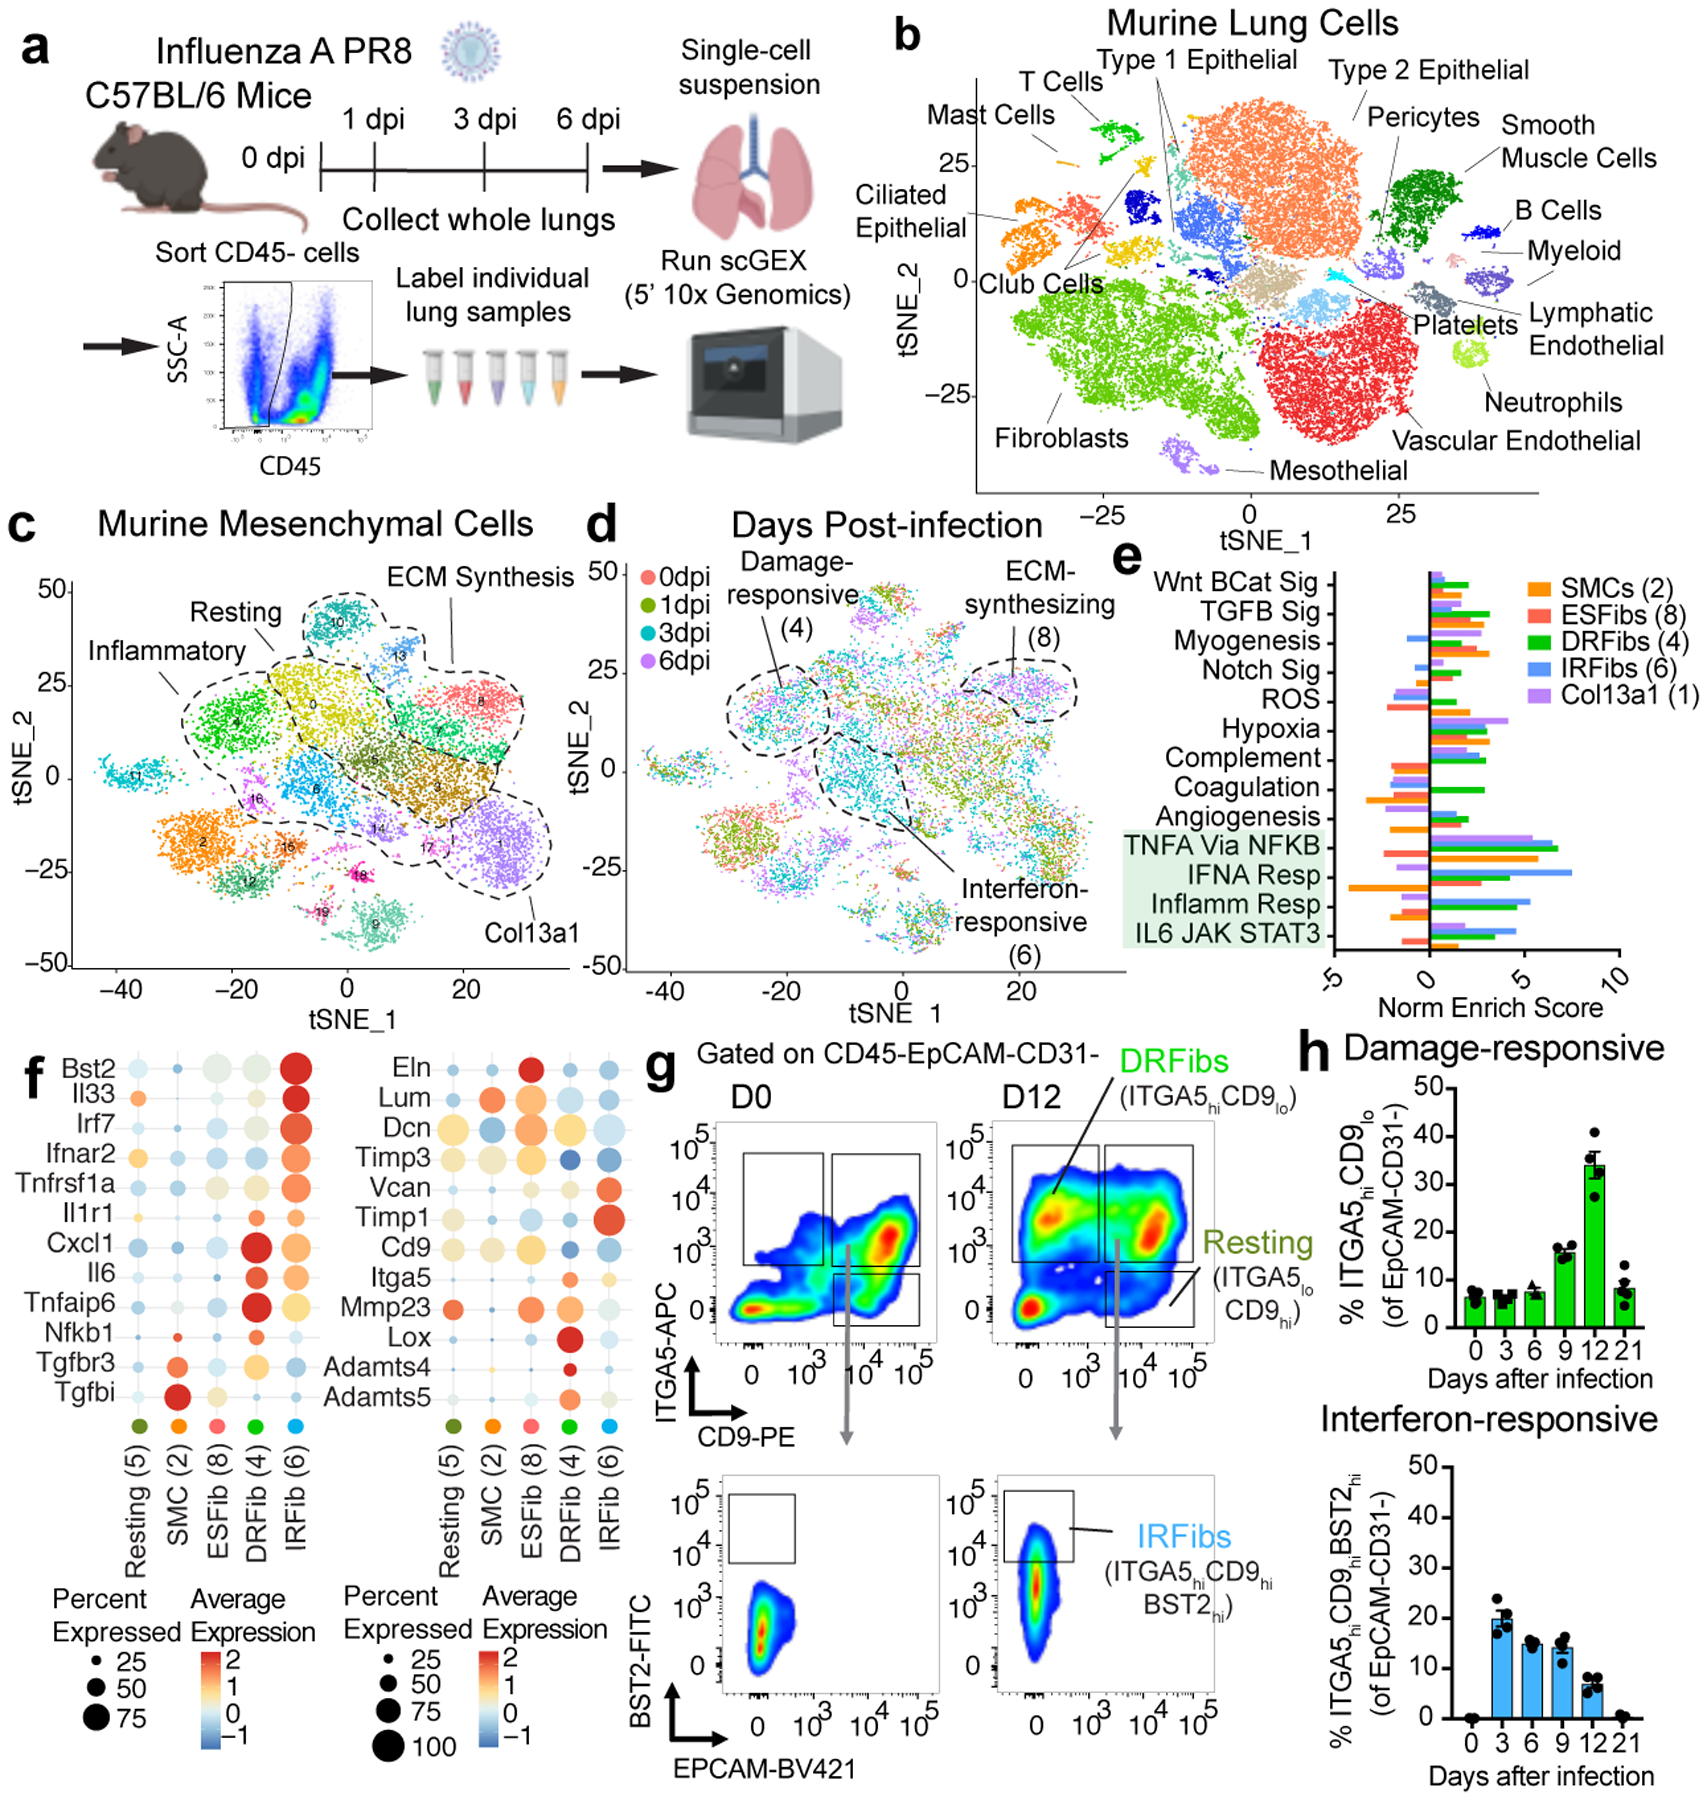
(A) Schematic of sample collection for scGEX. (B) t-SNE projection of murine lung cells based on scGEX. Data from all time points and mice were aggregated (n = 5 for time points 0, 1, and 3 dpi, and n = 4 for 6 dpi). ~40,800 individual cells are represented in the figure. (C) t-SNE projection of murine mesenchymal cells expressing Col1a2. (D) t-SNE projection of murine mesenchymal cells with day post-infection (dpi). (E) Summary of gene-set enrichment analysis (GSEA) comparing all cells in each cluster (1, n = 1188; 2, n = 1123; 4, n = 892; 6, n = 749; 8, n = 681). (F) Expression of key genes in murine lung mesenchymal cells. (G) Kinetics of fibroblast activation states. Representative flow plots of ITGA5/CD49e, CD9, and BST2 staining. (H) Frequency of DRFib and IRFib activation states during infection (0dpi, n = 5; 3dpi, n = 4; 6dpi, n = 3; 9dpi, n = 4; 12dpi, n = 4; 21dpi, n = 5). Error bars indicate standard error of the mean (SEM).
Within inflammatory fibroblasts we identified two distinct activation states, damage-responsive (DRFibs) and interferon-responsive (IRFibs) (Fig. 1d). DRFibs were enriched for pathways involved in tissue-damage responses, including NFkB signaling and hypoxia, whereas IRFibs were enriched for type-I-interferon-responsive pathways (Fig. 1e,f, Extended Data Fig. 2b). Analysis of five human lung biopsies identified fibroblast activation states analogous to those defined in mouse lungs (Extended Data Fig. 2c) with clusters enriched for ECM synthesis, NFkB signaling, and type-I interferon signaling (Extended Data Fig. 2c,d).
To validate these fibroblast activation states, we identified genes encoding surface protein markers enriched in DRFibs and IRFibs across murine and human lungs (Fig. 1f, Extended Data Fig. 2d, 3a,b). Upregulation of Itga5, and downregulation of Cd9 defined the DRFib transcriptional program while upregulation of Bst2, and expression of Cd9, defined IRFibs (Fig. 1g, Extended Data Fig. 3a). In mice, DRFibs increased in frequency and number over the course of infection reaching a peak around 12 days (Fig. 1g,h, Extended Data Fig. 3c,d). IRFibs emerged rapidly, by day 3, and gradually decreased in frequency (Fig. 1h). ITGA5hiCD9lo fibroblasts expressed high levels of DRFib signature genes (Lox, Adamts4), while ITGA5loCD9hi fibroblasts exhibited a resting phenotype with low expression of infection-induced genes (Extended Data Fig. 3e,f). Primary lung fibroblasts stimulated with IL-1 and TNFα, cytokines known to drive NFkB signaling, acquired a surface phenotype with higher ITGA5, indicative of a damage-responsive activation state (Extended Data Fig. 3g). Analysis of human lung biopsies identified fibroblasts that exhibited surface phenotypes strikingly similar to mouse lungs. Activated fibroblasts with a damage-responsive profile (ITGA5hiCD9lo) were present in donors who died of respiratory failure while noticeably absent from healthy controls (Extended Data Fig. 4a,b).
Regulation of fibroblast activation
We next sought to identify the upstream stimuli that regulate fibroblast activation states. We tested whether in vitro infection of normal human bronchial epithelial cells (NHBEs) with human seasonal (H3N2) or avian viruses (H5N6 or H7N9) was sufficient to drive inflammatory transcriptional programs in human lung fibroblasts in co-culture (Fig. 2a). Infection of NHBEs induced expression in fibroblasts of genes enriched in inflammatory states, including cytokines (Il6) and several matrix proteases (Adamts4, Mmp3, Mmp13). We also tested the ability of individual cytokines and influenza viruses to stimulate these transcriptional programs in respiratory cells cultured on their own (Fig. 2a “Monoculture”) comparing them to nasal wash cells from influenza-infected patients, which primarily contain immune cells10. These data demonstrated cell-type specific expression of ECM-related genes (Extended Data Fig. 5a). In contrast to NHBEs, fibroblasts were highly responsive to stimulation with IL-1 cytokines and TNFα, and ECM-related genes were broadly upregulated (Fig. 2a, Extended Data Fig. 5b,c). Nasal wash cells had low levels of expression of ECM-related genes encoding both structural proteins and matrix proteases. However, nasal wash and epithelial cells did exhibit high levels of Il1a, Il1b, and Tnf expression, indicating that they likely provide the immune signals to fibroblasts to regulate ECM-related gene expression (Extended Data Fig. 5a).
Figure 2. ADAMTS-4 is a lung fibroblast-derived ECM protease induced by influenza virus infection.
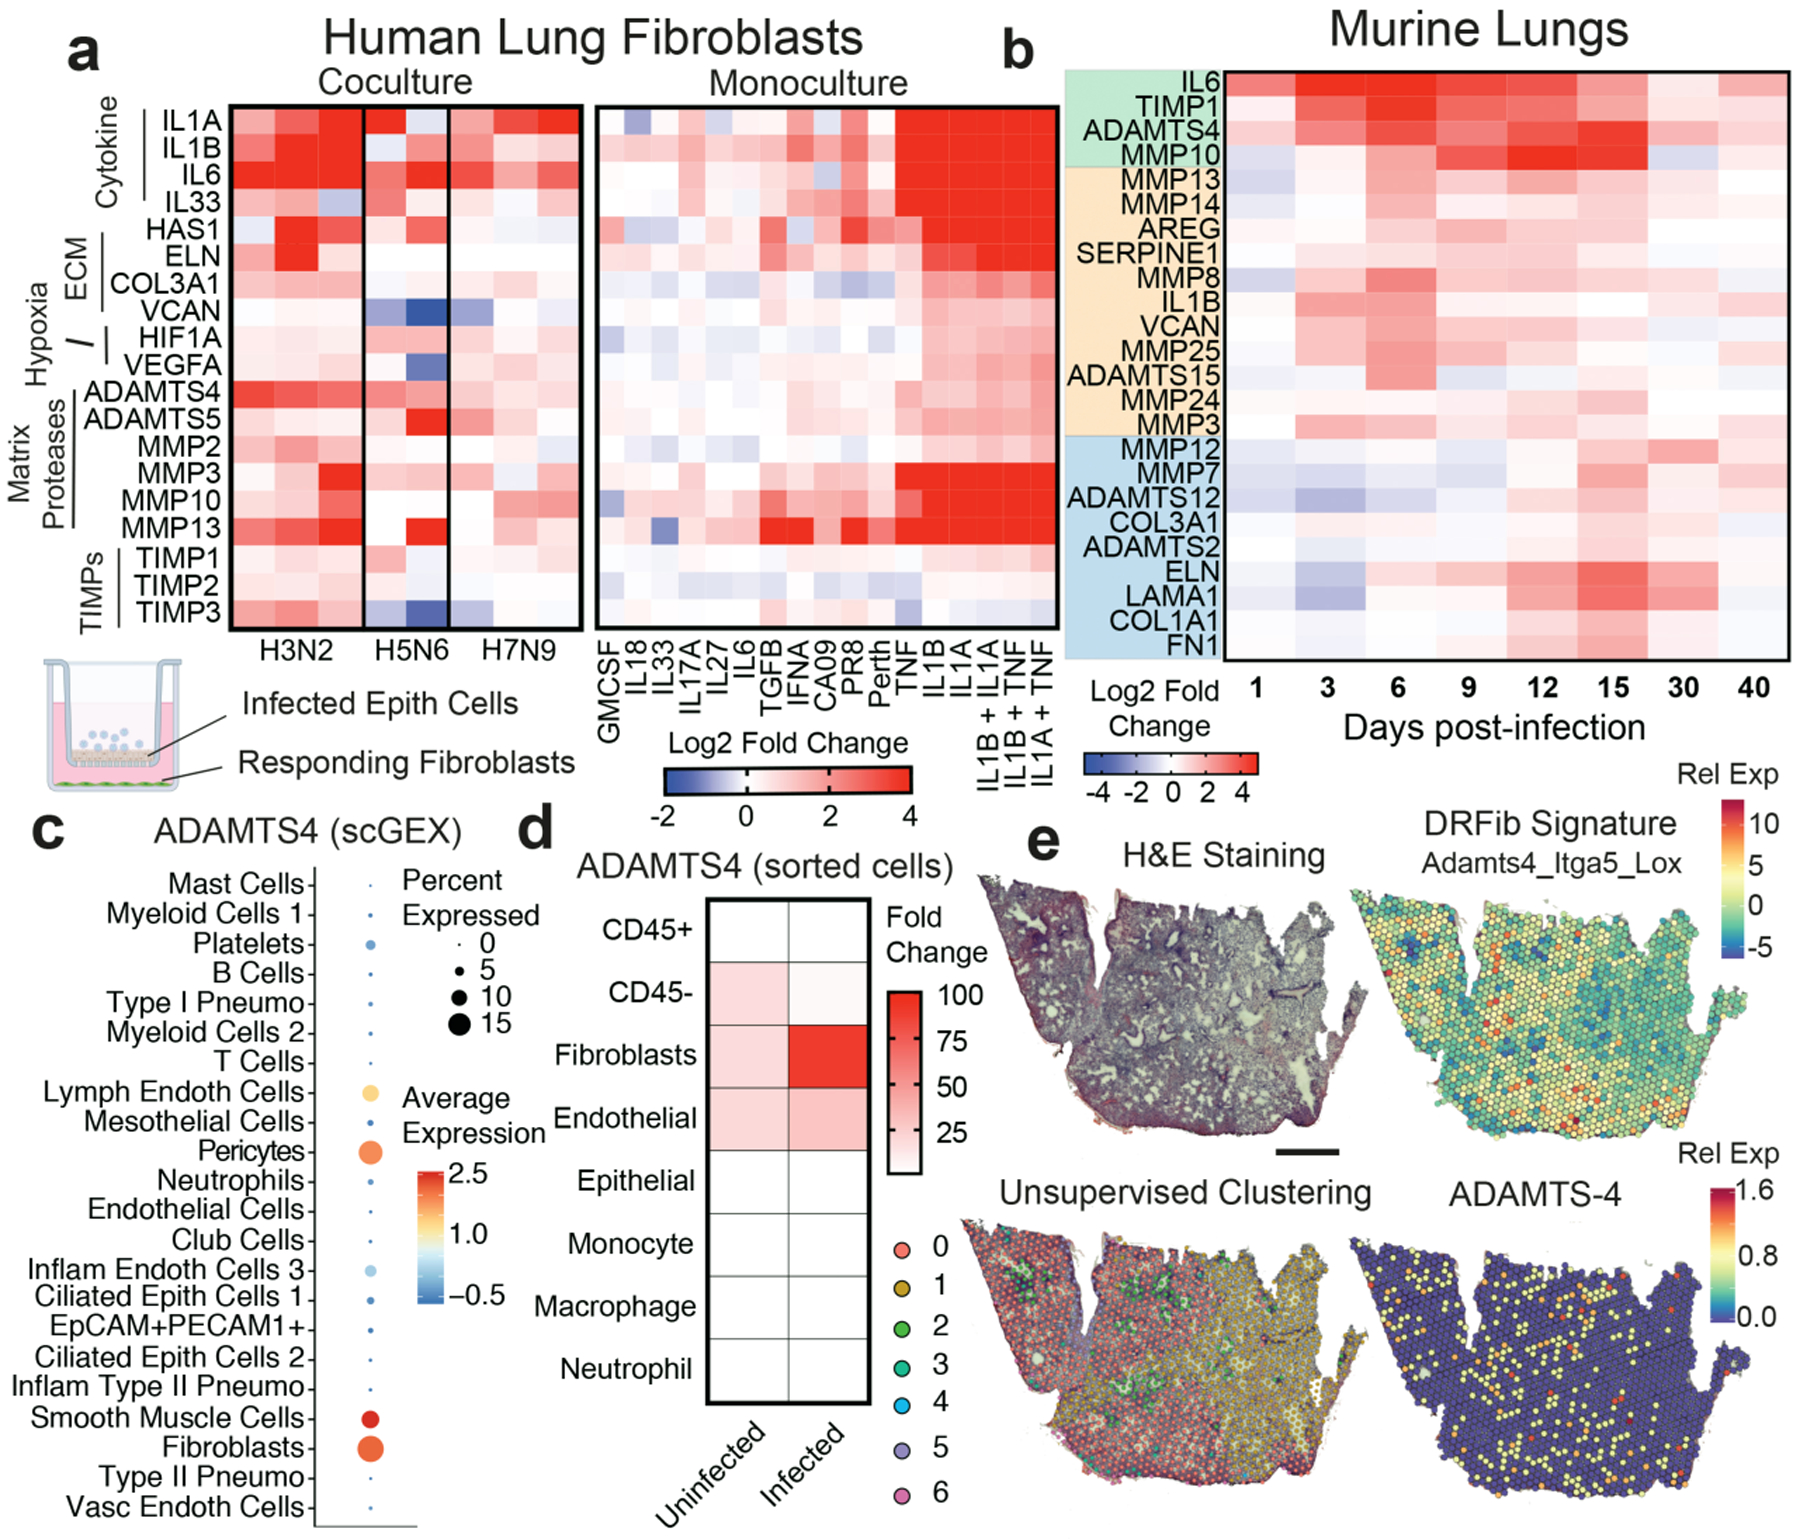
(A) Average log2 fold-change values relative to mock-infected or -treated controls. For co-culture experiments, each column represents a biological replicate. For monoculture experiments, each column represents the average of two independent experiments performed with duplicate stimulations. (B) Average log2 fold-change values in gene expression relative to mock-infected mice (n = 3 – 5 mice per time point) from lung homogenates. (C) Adamts4 expression by cell type from scGEX data. (D) Fold change in Adamts4 gene expression relative to bulk CD45+ cells in cells sorted prior to and 3 days after infection. (E) Spatial transcriptomics of lung tissue collected 10 days after infection. Scale bar = 1 mm.
ECM proteases in activated fibroblasts
We sought to determine if any individual protease played a fundamental effector role underlying productive and nonproductive lung repair. We assessed the regulation of ECM-related genes in mouse lung homogenates collected throughout influenza virus infection (Fig. 2b). Detection of ECM proteases and TIMPs by ELISA in the bronchoalveolar lavage (BAL) fluid corresponded with the kinetics of gene expression in lung homogenates (Extended Data 5d). Among ECM proteases tested, the expression of ADAMTS-4, one of the enzymes that degrade the proteoglycan versican11, was induced earliest and continued through the repair stage (Fig. 2b). Based on scGEX analyses, Adamts4 gene expression was restricted to non-immune, stromal cells (Fig. 2c). We next sorted immune and non-immune populations prior to and after infection. Adamts4 gene expression was restricted to fibroblasts and endothelial cells prior to infection. After infection, a significant upregulation of Adamts4 expression was only observed in fibroblasts, which we conclude constitute the bulk of the expression in infected lungs(Fig. 2d).
To determine the specificity of ADAMTS4 gene expression in human lung disease, we performed a meta-analysis of publicly available scGEX datasets from 7 studies of pulmonary fibrosis12–14, interstitial lung disease15, allergy/asthma16,17, and viral infection (COVID-19)18 (Extended Data 6a). For reference, we included a study of rheumatoid arthritis, a disease driven by inflammatory fibroblasts19. ADAMTS4-positive cells included mesenchymal cells and endothelial cells with a smaller number of epithelial and immune cells (Extended Data Fig. 6b,c). Fibroblasts with the highest per-cell levels of ADAMTS4 exhibited an activated phenotype with enriched expression of genes associated with the DRFibs (Extended Data Fig. 6d). Analysis of a subset of the data from a study by Habermann et al12 indicated that expression of ADAMTS4 increased dramatically in inflammatory lung diseases compared to healthy controls (Extended Data Fig. 6e). Mesenchymal cells expressed the highest levels of ADAMTS4 on a per-cell basis and at least an order of magnitude higher than other cell types, including endothelial cells (Extended Data Fig. 6f). Per-cell levels of ADAMTS4 were low in epithelial and immune cells and did not increase in diseased lungs compared to controls.
To determine how fibroblast responses were anatomically organized, we performed spatial transcriptomics on murine lung sections collected at the peak of respiratory distress (10 dpi). Unsupervised clustering of transcriptional profiles identified areas of the lung (red, 0) that overlapped with regions of interstitial inflammation (Fig. 2e, Extended Data Fig. 7a). DRFib genes, including Itga5, Lox, and Adamts4, were enriched in these regions (Fig. 2e, Extended Data Fig. 7b, c, d). Adamts4 expression was restricted to areas of interstitial inflammation near the alveoli. Expression of DRFib-associated genes was reduced or absent from bronchial regions (green, 2), areas of dense lymphoid infiltration, (teal, 3) and from areas of normal alveolar parenchyma (yellow, 1). Together, these data place DRFibs expressing Adamts4 in the distal airways at a critical inflection point when hosts either begin to recover or their condition worsens.
ADAMTS-4 promotes lethal immunopathology
To determine the contribution of ADAMTS-4 to infection outcome, we challenged ADAMTS-4−/− (KO) and ADAMTS-4+/+ (WT) mice with a lethal dose of IAV. ADAMTS-4−/− mice exhibited improved survival compared to ADAMTS-4+/+ controls, which was independent of the viral burden in the lungs (Fig. 3a,b, Extended Fig.8a,b). Neither the frequency nor total number of infected cells differed significantly between ADAMTS-4−/− and ADAMTS-4+/+ mice, although there were modest cell-type specific differences (Extended Data Fig. 8c). In contrast to WT, ADAMTS-4−/− mice were able to maintain lung function, as measured by arterial oxygen saturation, six days after infection (Fig. 3c). At 9 dpi, ADAMTS-4−/− mice exhibited a significant decrease in immune cell infiltration and alveolar inflammation with less extensive lung tissue damage (Fig. 3d). Consistent with reduced damage, ADAMTS-4−/− mice had less total protein in BAL fluid compared to ADAMTS-4+/+ controls and lower levels of key inflammatory mediators (TNFα and MCP-1) in lung homogenates (Extended Data Fig. 8d,e). These differences in tissue damage translated to improved lung mechanics in ADAMTS-4−/− mice, measured by airway resistance and dynamic lung compliance (Fig. 3e, Extended Data Fig. 8f).
Figure 3. ADAMTS-4 promotes lethal immunopathology during IAV infection in mice.
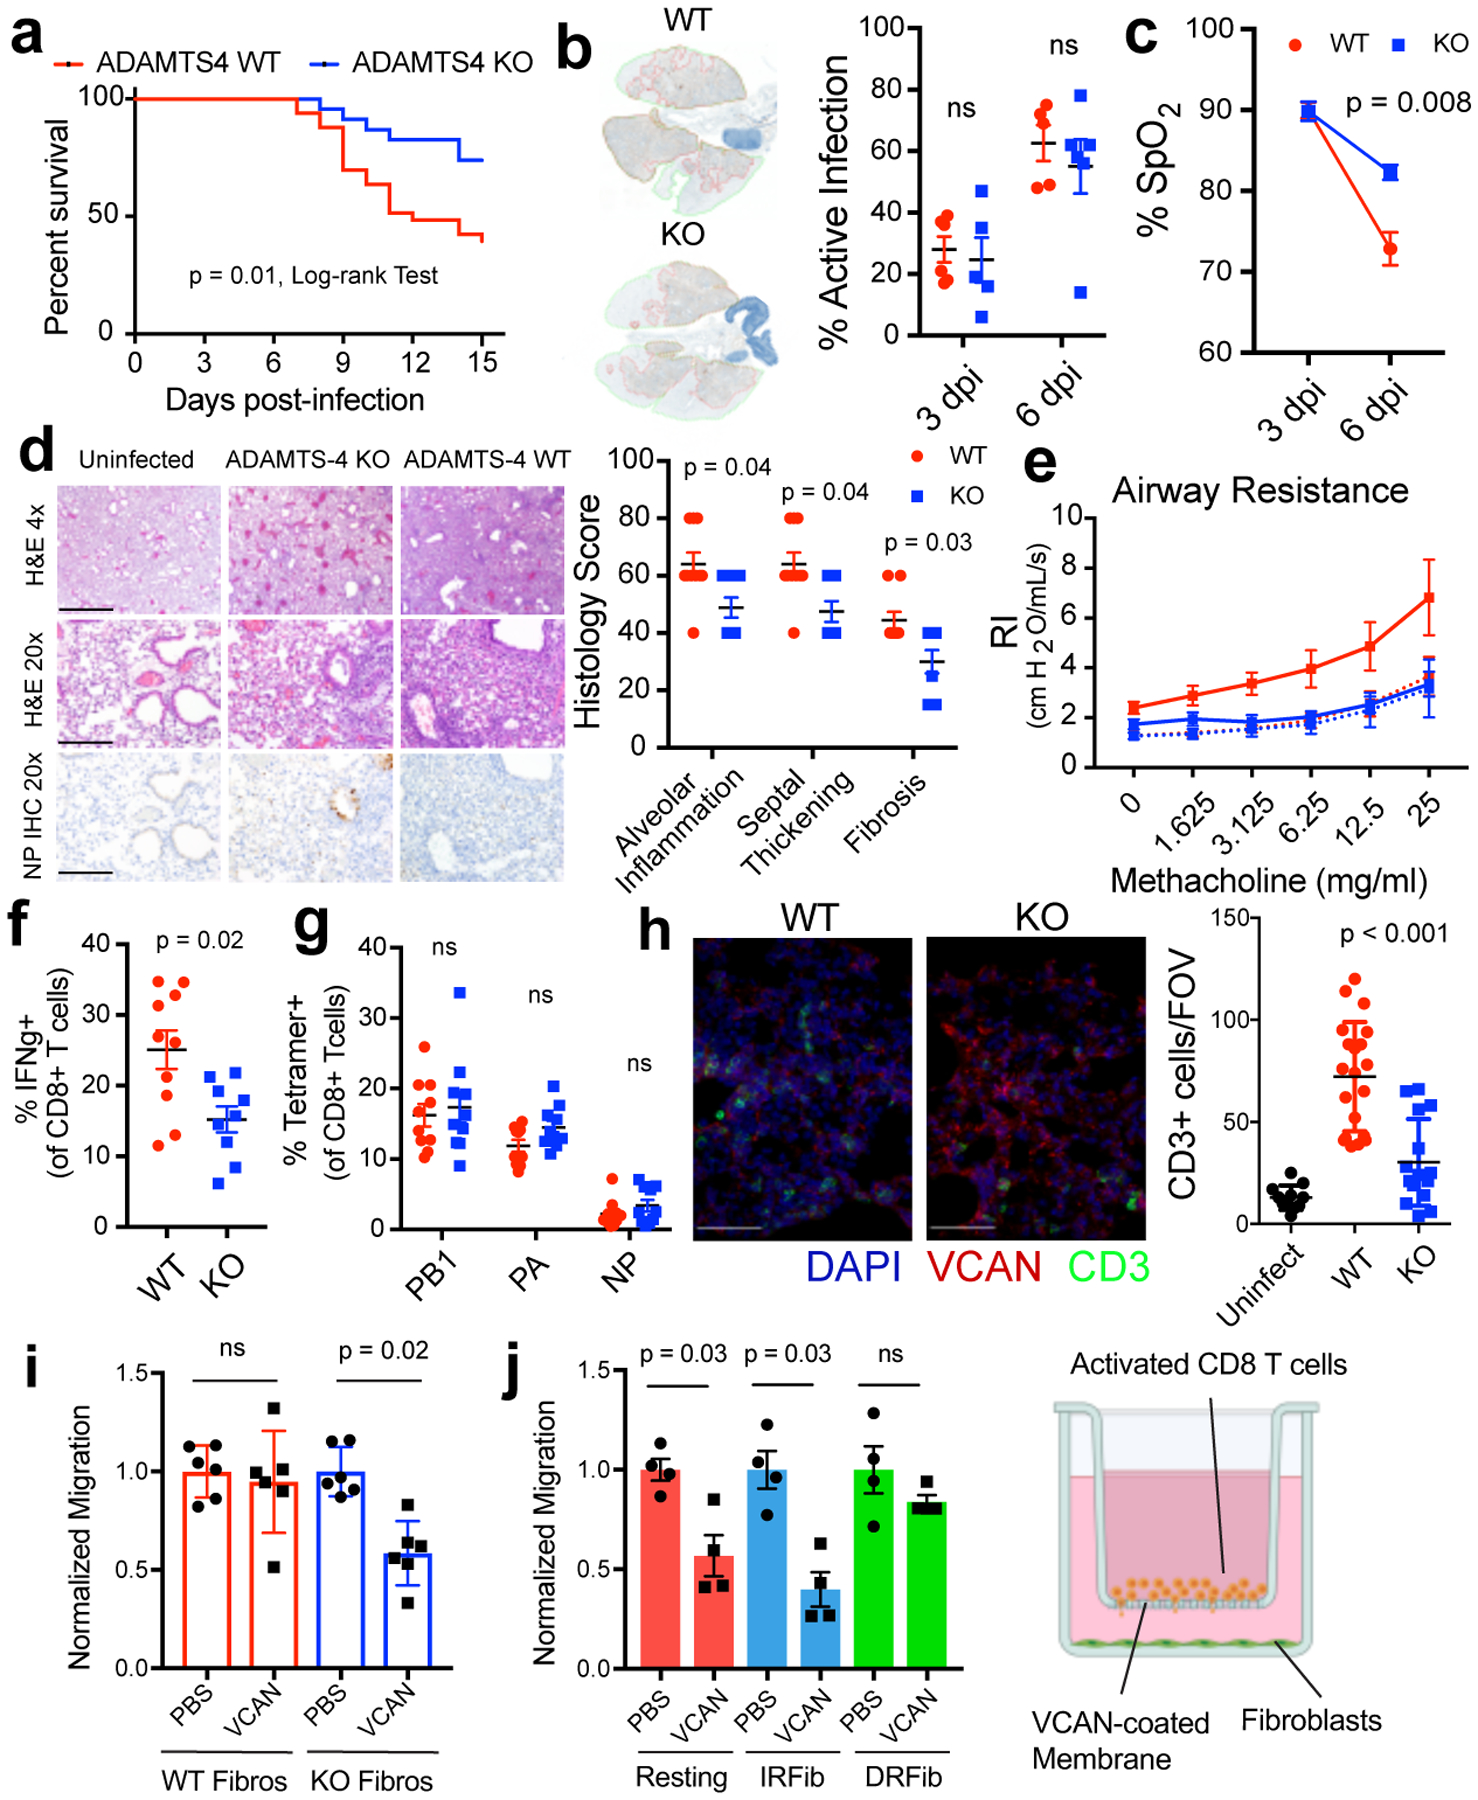
(A) Survival curves following lethal IAV challenge, ADAMTS-4+/+ (WT), n = 33; ADAMTS-4−/− (KO), n = 23. Log-rank Test, two-sided. Data pooled from five independent experiments. (B) Representative lung images and quantification of viral spread. Areas of active infection outlined in red. (3dpi: WT, n = 6; KO, n = 5 and 6dpi: WT, n = 5; KO, n = 6). (C) Arterial oxygen saturation (% SpO2) at 3 and 6 days after infection (WT, n =5; KO, n = 5) (D) Representative images and histological scores at 9 dpi with sublethal challenge (WT, n =9; KO, n = 9). Scale bar, 4x = 1mm, 20x = 200μm. (E) Airway resistance with sublethal challenge (Uninfected: WT, n = 8; KO = 3, Infected: WT n = 8, KO, n = 9). (F) Frequency of IFNg+ CD8+ T cells from lungs collected at 9 dpi (WT, n =10; KO, n = 9). (G) Frequency of tetramer+ CD8+ T cells in the lung at 9 days after infection (WT, n =10; KO, n = 10). (H) Representative images of CD3 (green), intact versican (red), and DAPI (blue) staining in lung sections and quantification of CD3+ cells. Three to four fields of view imaged from each individual mouse (uninfected, n = 3; WT, n = 5; KO, n = 4). Scale bar = 50 μm (I) CD8+ T cell migration in presence of ADAMTS-4 WT and KO fibroblasts. Migrated cells normalized to uncoated control for each genotype (n = 6 biologically independent samples/group) (J) CD8+ T cell migration in presence of fibroblast activation states (n = 4 biologically independent samples/ group). Unless otherwise indicated, data are pooled from two independent experiments. Error bars indicate SEM. For statistical analysis, groups were compared using a two-sided Mann-Whitney U test.
We examined the consequences of ADAMTS-4-deficiency on the levels of a major substrate of ADAMTS-4, veriscan. During inflammation, versican is an important component of the provisional matrix, a loose extracellular network that directs cell migration, proliferation, and differentiation20, and its function depends on its degradation state and interaction with other ECM proteins. Compared to WT animals, ADAMTS-4−/− mice had higher levels of intact versican in areas of lung remodeling after infection (Extended Data Fig. 9a, b). The levels of other known versicanases were not changed even in the ADAMTS-4−/− mice (Extended Data Fig. 9c). As CD8+ T cells are one of the main drivers of immunopathology during IAV infection4,21, we assessed CD8+ T cell responses in the lungs at 9 dpi when we observe peak T cell responses and lung damage. ADAMTS-4−/− mice had a significantly lower percentage of IFNγ producing CD8+ T cells (Fig. 3f, Extended Data Fig. 9d, e). The percentage of IAV-specific CD8+ T cells did not differ, indicating that ADAMTS-4−/− mice were able to mount IAV-specific T cell responses comparable to WT mice (Fig. 3g, Extended Data Fig. 9f). In lung sections, we observed significantly fewer T cells in ADAMTS-4−/− compared to ADAMTS-4+/+ mice with T cells largely absent from areas of high intact versican (Fig. 3h). We next tested whether fibroblast-derived ADAMTS-4 could promote T cell migration across a versican barrier (Fig. 3i). Activated CD8+ T cells migrated across uncoated and versican-coated membranes with nearly identical efficiency in the presence of ADAMTS-4-sufficient fibroblasts. In contrast, migration across a versican-coated membrane was reduced by more than 40% in the presence of ADAMTS-4-deficient fibroblasts. Consistent with DRFibs being the main producers of ADAMTS-4, DRFibs promoted migration across a versican barrier, while migration was inhibited in the presence of resting fibroblasts and IRFibs (Fig. 3j), highlighting distinct functions of fibroblast activation states.
ADAMTS-4 and severe influenza in humans
We next investigated the contribution of ADAMTS-4 in the human respiratory tract to severe influenza virus infections in the Pediatric Intensive Care Influenza (PICFLU) Network. We analyzed endotracheal aspirate (ETA) samples collected within 72 hours of intensive care admission from a multicenter cohort of 84 pediatric patients with influenza virus infection (Extended Data Fig. 10a). Levels of ECM proteases and TIMPs were analyzed in the context of inflammatory mediators that were previously published for these samples22. Controlling for age, ADAMTS-4 was positively correlated with IL1B and TNFA, which we identified as upstream regulators of ADAMTS4 expression, and with IFNG, which was expressed at a higher frequency in CD8+ T cells in ADAMTS-4 sufficient mice during IAV infection (Fig. 4a). We next tested whether levels of ADAMTS-4 in ETA were associated with the severity of influenza-related disease using three indicators: prolonged multiple organ dysfunction syndrome (PrMODS) or death, prolonged acute hypoxic respiratory failure (PrAHRF) or death, and ventilator-free days (VFDS) less than 10 (Extended Data Fig. 10b). In each case, the log10 ADAMTS-4 values were significantly associated with disease severity outcomes after controlling for age, gender, and baseline health status (PrMODS/Death: Odds Ratio = 3.14, p = 0.003; PrAHRF/Death: Odds Ratio = 2.27, p = 0.018; VFDS < 10: Odds Ratio = 2.95, p = 0.027; Fig. 4b, Extended Data Fig. 10c).
Figure 4. ADAMTS-4 levels are associated with severe seasonal and avian influenza infections.
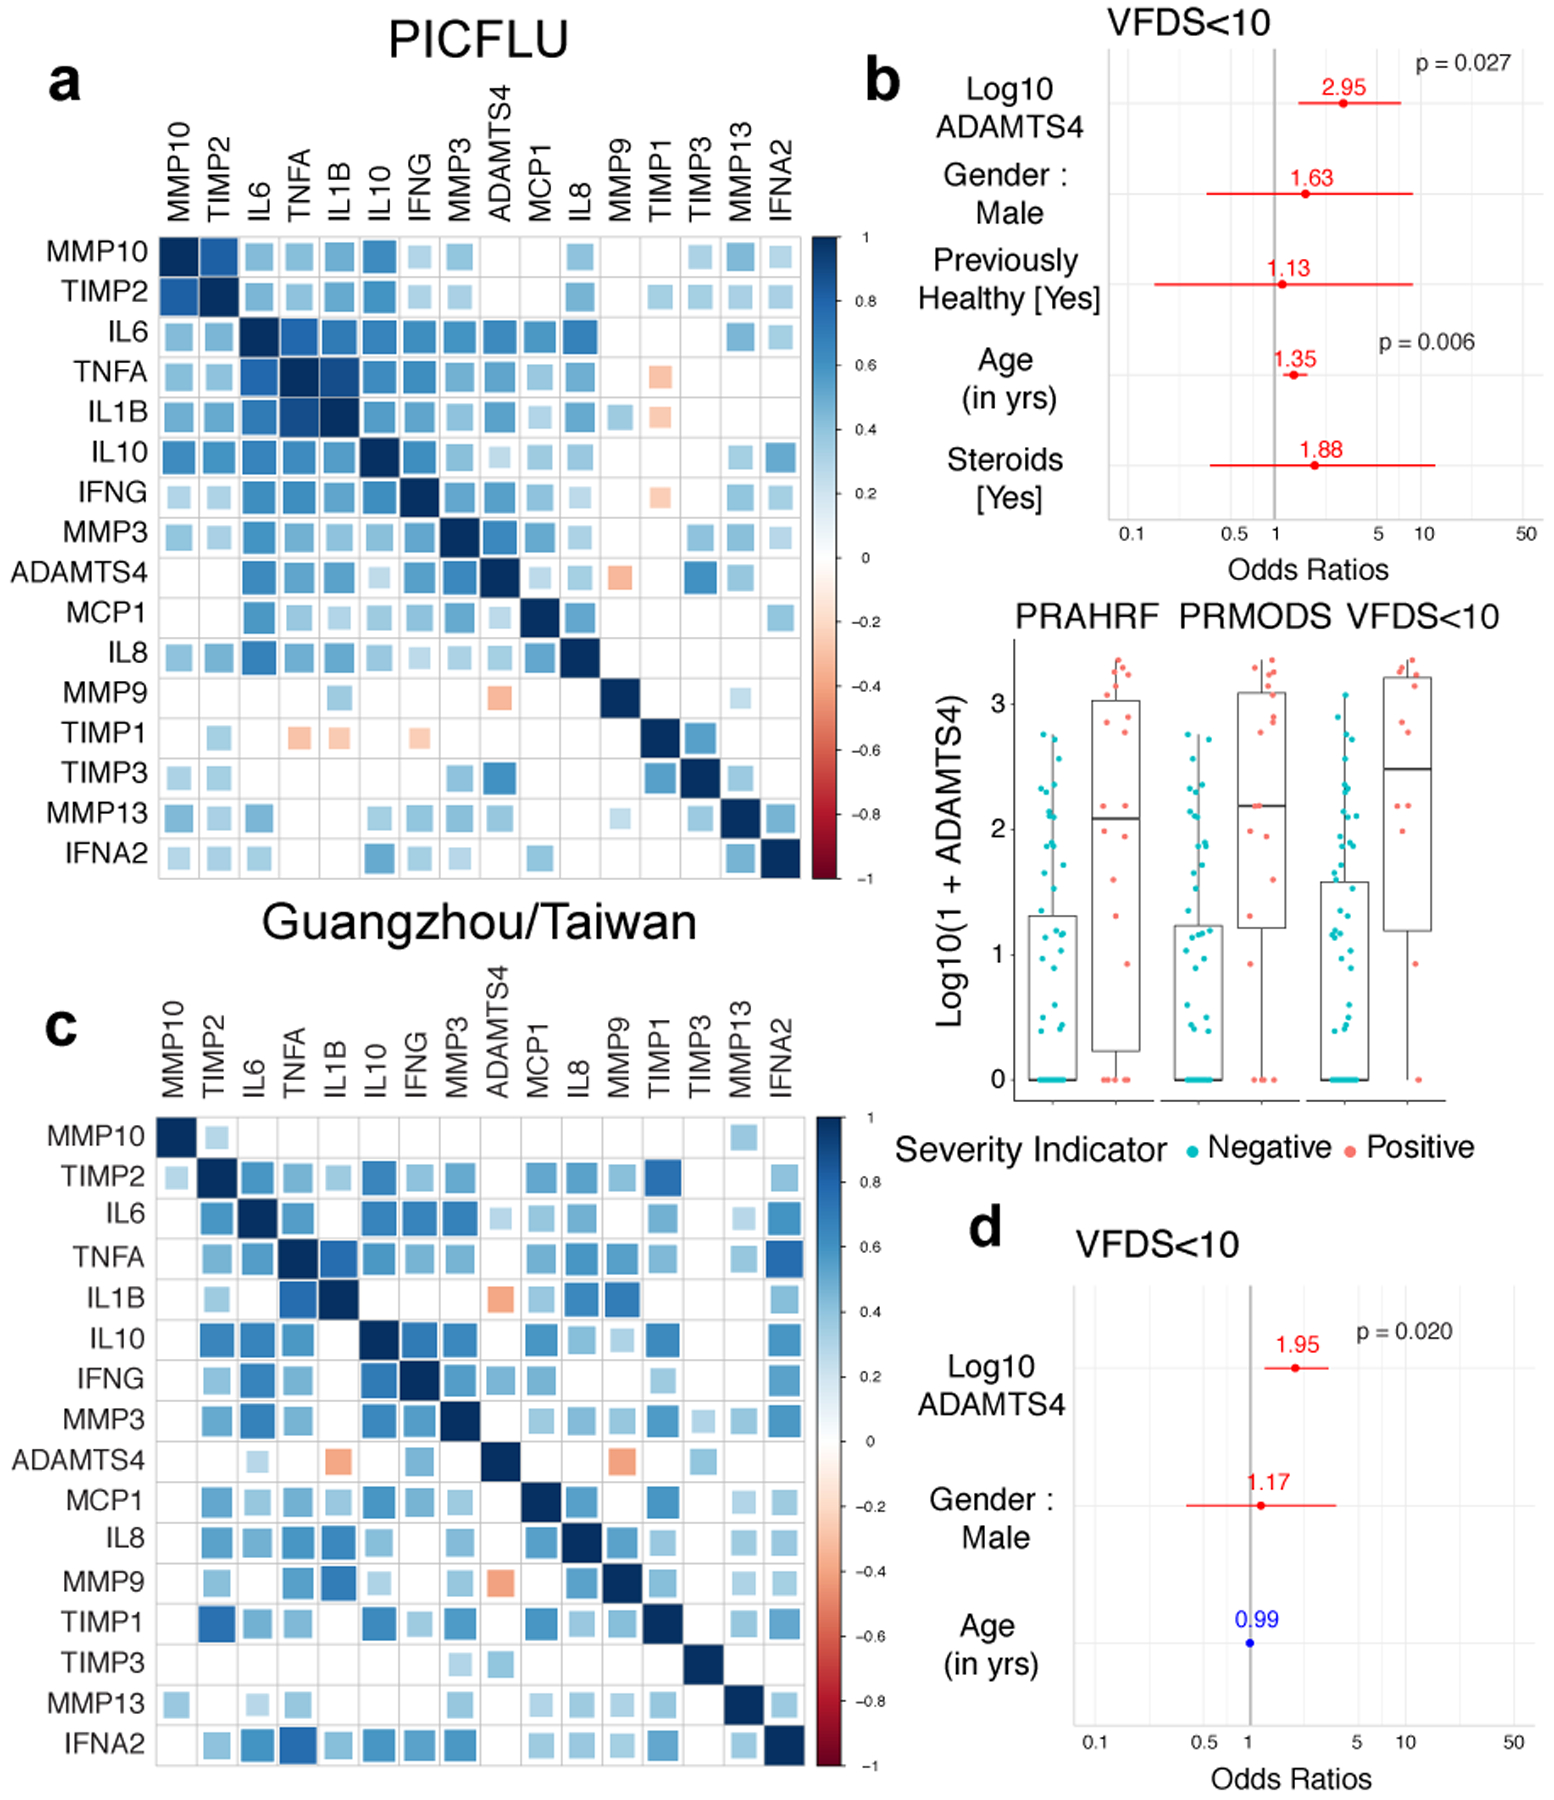
(A) Correlation matrix of analytes for the PICFLU cohort. For each pairwise comparison, color indicates the Spearman correlation coefficient while the size of the box indicates significance level. Analytes are arranged by hierarchical clustering. (B) Odds ratios for VFDS<10 as well as gender, previously healthy, age, and steroids as covariates. Boxplots of log10(1+ADAMTS4) values for each severity indicator (n = 84 samples from individual patients). Center line indicates median, bottom and top of boxes indicate first and third quartiles, whiskers extend to 1.5 times the interquartile range. Positive (red) or negative (blue) association. (C) Correlation matrix of analytes from the first available time point for each patient in Taiwan/Guangzhou cohorts. (D) Odds ratio for VFDS<10, including gender and age as potential covariates. Odds ratios (B, D) determined using logistic regression with FDR adjustments for multiple testing.
To determine whether these findings translated to adults, we analyzed samples from two distinct, primarily adult cohorts: one from Taipei representing moderate to severe cases of seasonal influenza (37 patients); and the other from Guangzhou representing severe cases of H7N9 avian influenza (16 patients) and seasonal H1N1 influenza (14 patients) (Extended Data Fig. 10d). We tested samples from multiple respiratory compartments (ETA, sputum, and BAL fluid). While each patient from the Taiwan cohort was sampled at a single time point after symptom onset, most Guangzhou patients were sampled at multiple time points.
A correlation matrix of the same analytes indicated similar patterns of ECM protease, TIMP, and cytokine regulation in the primarily adult influenza cohorts (Fig. 4c). We tested whether ADAMTS-4 was associated with a particular respiratory compartment including 131 nasal wash samples from the Taiwan cohort. ADAMTS-4 was detectable at very low levels in 5% (6/131) of nasal wash samples tested, but at higher frequencies and concentrations in each of the lower respiratory tract (LRT) compartments, suggesting that the source of ADAMTS-4 is localized to the LRT during infection (Extended Data Fig. 10e).
Lastly, we tested whether ADAMTS-4 is a predictor of disease severity during influenza virus infection in adults. To make the data comparable to the PICFLU cohort, we focused on the earliest ETA sample available, only including the first BALF or sputum sample (in that order) when an ETA sample was not available. Log10 ADAMTS4 levels were significantly associated with severity of disease, as determined by VFDS <10 (Odds Ratio = 1.95, p = 0.020) (Fig. 4d). By combining samples from all three cohorts, log10 ADAMTS-4 levels were associated with VFDS<10, including age and gender as potential covariates (Odds Ratio = 2.22, p = 3.1e-05) (Extended Data Fig. 10f). Based on these results, we propose that the level of ADAMTS-4 protein in the LRT is a strong predictor of hypoxic respiratory failure and mortality following severe influenza virus infection across a wide range of ages.
Discussion
Surviving a severe respiratory infection is dependent on a careful balance between mounting an immune response that is sufficient to clear the infection and maintaining lung function despite immune-induced tissue damage. By residing at the interface of the epithelial site of infection and the endothelial point of immune-cell entry, fibroblasts are opportunely located to integrate inflammatory signals and coordinate immune responses via modification of the local tissue environment23. Here, we provide compelling evidence that lung fibroblasts are critical for coordinating immune responses at the site of viral infection in the tissue, starting at very early stages and continuing through the repair process. During infection, lung fibroblasts respond to damaged epithelial cells, transmit inflammatory signals, and modify the ECM to generate a tissue environment promoting robust immune responses to infection. Recently, several studies have described both protective24 and pathogenic25–27 roles for ECM proteases in the host response to influenza virus. While these studies identified the primary sources of ECM proteases as immune cells, data presented here indicate that inflammatory fibroblasts integrate danger signals from epithelial cells and resident immune cells to produce a spectrum of inflammatory cytokines, ECM components, and degradative enzymes to modify the local tissue environment. In mice, deficiency of ADAMTS-4 activity in the lung preserves intact ECM-localized versican and modulates immune cell migration into areas of infection. Previous studies have indicated that intact versican is able to suppress cytotoxic T cell responses and inhibit migration24,28–30. Our human data suggest that ADAMTS-4 is an important determinant of influenza disease severity across a wide age-range. High ADAMTS-4 concentrations in endotracheal samples from the pediatric cohort, collected soon after intensive care admission, were strong predictors of prolonged AHRF and MODS, and in all cohorts, high ADAMTS-4 concentrations in LRT samples were associated with fewer ventilator-free days. The role of ADAMTS-4 in promoting excessive immunopathology also warrants further investigation in other severe respiratory infections, including SARS-Cov-2.
Understanding the basis for activation phenotypes in fibroblasts is a critical future direction for these studies. Determining whether these are true differentiation lineages, or if the cells can revert back to a resting state, will require the development of precise lineage tracing models. Currently, there are no effective therapeutics for treating severe complications of respiratory viral infections such as ARDS, and treatment is supportive1. We propose that targeting the ECM protease activity of damage responsive fibroblasts could provide clinical benefits, both by limiting excessive inflammation and sparing the integrity of lung tissue, and that ADAMTS-4 activity would be an ideal target for therapeutic intervention.
Methods
Mice
B6.129P2-Adamts4tm1Dgen/J (ADAMTS-4−/−) mice were obtained from Jackson Laboratories. These mice were back-crossed with C57BL/6/J mice for at least 10 generations to generate congenic ADAMTS-4−/− and ADAMTS-4+/+ mice. Mice were housed at temperature, light/dark cycle, humidity.
Studies involving mice were approved by the St. Jude Children’s Research Hospital Committee on Care and Use of Animals. All of the mice that were tested in this study were bred and maintained at the St. Jude Children’s Research Hospital under specific-pathogen free conditions.
Single-cell RNA sequencing
Whole lungs were collected from murine pathogen-free C57BL/6J mice (Taconic Biosciences) at 0, 1, 3, 6, and 21 days after initial infection. Four or five mice for each time point were infected with 2500 EID50 of mouse -adapted A/Puerto Rico/8/1934 (PR8) intranasally in 30 μL of 1x PBS31. Lungs were perfused with 10 mL of cold 1x PBS injecting into the right ventricle of the heart and then minced and digested in lung digestion buffer containing 400 U/mL of Collagenase I (Worthington Biochemical Corporation) and 50 U/ml of DNaseI (ThermoFisher) in Hanks Balanced Salt Solution (HBSS) for 75 minutes at 37 degrees C. Digested lungs were filtered through a 100 μm cell strainer and washed with HBSS. Red blood cell lysis was performed and cells were resuspended at 1×10⁶ cells/mL. Cells were incubated with Ghost Dye Violet 510 (Tonbo) (1:100 dilution) and APC anti-mouse CD45.2 (clone 104, Biolegend) (1:100 dilution) for 30 minutes at room temperature. Live, CD45-cells were sorted into 1.7 mL microfuge tubes and then centrifuged at 400 × g for 5 minutes. Cells were then incubated with PE anti-mouse H-2 antibody (1:100, clone M1/42, Biolegend) for 30 minutes on ice.
Human lung biopsy samples from de-identified, deceased patients were obtained through the National Disease Research Interchange (NDRI). Cause of death for these patients was unrelated to respiratory tract infection or lung damage, and patients did not have a history of tobacco use or lung cancer. Fresh 5 cm × 5 cm × 5cm lung biopsy samples were minced and digested in 400 U/ml of Collagenase I (Worthington Biochemical Corporation) and 50 U/ml of DNaseI (ThermoFisher) in Hanks Balanced Salt Solution (HBSS) for 90 minutes at 37 degrees. Lung samples were first filtered through sterile gauze and then through 100 μm cells strainer and washed with HBSS, and red blood cell lysis was performed. Single cell suspensions of total lung cells were frozen in freeze media (90% FBS/ 10% DMSO) at a concentration of 5×10^6 cells/mL. For scRNAseq using 10x Genomics, vials of cells were thawed and incubated with Ghost Dye Violet 510 (Tonbo) (1:100 dilution) and APC anti-human CD45 (1:200) for 30 minutes at room temperature. Live, CD45-cells and live, CD45+ cells were sorted into 1.7 mL microfuge tubes and then centrifuged at 400 × g for 5 minutes. Following sorting, cells were incubated with PE anti-human β2 microglobulin (1:100) and PE anti-human CD45 (1:100) antibodies for 30 minutes on ice.
For both mouse and human lung samples, cells were washed three times and then incubated with custom-designed hashtag oligos (HTO) conjugated to anti-PE antibodies (Thunder-Link PLUS Oligo Conjugation System, Expedeon) unique for each individual mouse. After incubation, cells were washed three times and then pooled within each time point. ~25,000 cells per sample were loaded onto the Chromium controller (10x Genomics) to partition single cells into gel beads. Single cell transcriptomic libraries were generated using the 5’ Gene Expression Kit (V2, 10x Genomics) according to the manufacturer’s instructions with the addition of primers to amplify HTOs during cDNA amplification. Sequencing was performed on the Illumina NovaSeq to generate approximately 500M reads per sample.
Single-cell gene expression analyses
10x gene expression data were first processed using CellRanger (v3.0.2, 10x Genomics). Human data were processed using version 3.0.0 of the GRCh38 10x reference, whereas mouse data were processed using the mm10 reference altered to include the PR8 influenza genome. CellRanger was then used to aggregate species-specific samples, normalizing by the number of mapped reads per identified cell. Normalized feature-barcode matrices including both gene expression and HTO counts were then imported into Seurat (v3.0.0.900) for downstream analysis32.
Data were first filtered by excluding any gene that was not present in at least 0.1% of total called cells and then by excluding cells that exhibited extremes in the species-specific distributions of: the number of genes expressed (mouse: <100 or >5,550; human: <100 or >4,500), the number of mRNA molecules (mouse: >30,000; human: >20,000), or the percent of expression owed to mitochondrial genes (mouse and human: >7.5%). Gene expression counts were log-normalized using a scaling factor of 1e4, variable features targeted for downstream analysis were identified using the ‘vst’ method with default parameters, and cell cycle scores were generated for each cell using markers identified elsewhere33. Gene expression was then scaled to regress out the effects of total transcript expression, percent of mitochondrial expression, and cell cycle scores. For first-pass analyses of entire datasets, we selected principal components (PCs) visually using an elbow plot of the PC standard deviations (mouse: 25; human: 19). These PCs were then used for t-SNE dimensionality reduction and cell clustering with Seurat’s shared nearest neighbor modularity algorithm in order to broadly characterize the cell types in the entirety of each sample. Individual cell subsets were annotated using known markers from the literature.
For more detailed analyses of fibroblast differentiation states, we generated a subset of the identified fibroblast clusters, identified the top variable features within this subset, and re-scaled that data as described above. For the mouse fibroblast data, we also regressed out the effects of days post infection (DPI) in order to more precisely characterize the variance among fibroblast clusters and distinguish cellular responses to experimental infection. After re-conducting Principal Component Analysis, PCs were scored for significance (FDR-adjusted p-value <0.05) using random permutations as implemented in Seurat. Differential gene expression was assessed among clusters for all genes expressed in at least one percent of cells within a cluster using a generalized linear hurdle model that incorporates both expression frequency and abundance34. For pairwise cluster comparisons of interest, genes were then ranked as a function of the product of their average log fold change, the absolute value of the difference in percent expression, and the inverse of the scaled, FDR-adjusted p-value. These gene rank lists were then analyzed using preranked Gene Set Enrichment Analysis35.
Meta-analysis of publicly available human single-cell gene expression datasets
Human single-cell gene expression data from published reports (Extended Data 6a) were obtained from online data repositories. From Vieira Braga et al17 we were only able to obtain data from four healthy controls, as other data, including the data from asthma patients, were not publicly available. Each dataset was filtered to exclude cells with more than 20% mitochondrial content, fewer than 200 genes, or fewer than 200 RNA molecules before being normalized, scaled, and assessed for variable features using the SCTransform wrapper in Seurat32. Focal analyses of specific datasets were conducted on these resulting data objects. We also compiled the datasets for meta-analysis using reference-based integration with 3,000 integration features, with data from Habermann et al12 as the reference, again using the SCTransform normalization method. Downstream analyses were focused on the subset of cells that contained at least one ADAMTS4 transcript. Dimensionality reduction and clustering were conducted as described previously, but in this case using the integration assay. Differential gene expression analyses were conducted on the RNA assay of the integrated object using default parameters in Seurat.
Flow Cytometry for Lung Stromal Cells and FACS-based Sorting
At the indicated time point after infection, lungs were perfused with 10 mL of cold 1x PBS injecting into the right ventricle of the heart and then minced and digested in lung digestion buffer containing 400 U/mL of Collagenase I (Worthington Biochemical Corporation) and 50 U/ml of DNaseI (ThermoFisher) in HBSS for 30 minutes at 37 degrees C. Digested lungs were filtered through a 100 μm cell strainer and washed with HBSS. Red blood cell lysis was performed, and cells were washed and resuspended in FACS buffer (1% FBS and 2 mM EDTA in 1x PBS). CD45+ cells were depleted using mouse CD45 Microbeads (Miltenyi) according to the manufacturer’s instructions. Briefly, cells were incubated with microbeads for 15 minutes on ice, washed with FACS buffer, and resuspended in 500 μl of buffer. CD45+ cells were then depleted using a Miltenyi LS column, and the flow through (CD45-cells) were collected. For antibody staining, 1×10⁶ cells were plated and then incubated with Fc block for 10 minutes at room temperature. Cells were washed one time with FACS buffer and then resuspended in 100 μl of an antibody cocktail containing the following: Ghost Dye Violet 510 (1:100), BV605 anti-mouse CD45 (1:200), BV421 anti-mouse EpCAM (1:200), PerCP/Cy5.5 anti-mouse CD31 (1:200), FITC anti-mouse BST2 (1:100), PE anti-mouse CD9 (1:100), APC anti-mouse CD49e (1:100). Cells were incubated with the antibody cocktail for 30 minutes at room temperature and then washed twice with FAC buffer before resuspending in a final volume of 150 μl. For single cell suspensions from human lung biopsy samples, cells were washed one time with FACS buffer and then resuspended in 100 μl of an antibody cocktail containing the following: Ghost Dye Violet 510 (1:100), BV605 anti-human CD45 (1:100), BV785 anti-human EpCAM (1:100), APC Fire 750 anti-human CD31 (1:100), PE/Cy7 anti-human CD140a (1:100), APC anti-human CD49e (1:100), and PE anti-human CD9 (1:100). Cells were incubated with the antibody cocktail for 30 minutes at room temperature and then washed twice with FAC buffer before resuspending in a final volume of 150 μl. Cells were analyzed using a BD LSRII Fortessa and BD FACSDIVA software (Becton Dickinson). Data were analyzed using FlowJo software (FlowJo).
High-throughput qPCR using Fluidigm Biomark
For in vitro stimulation of primary murine lung fibroblasts, fibroblasts were isolated from C57BL6/J. Lungs were collected, minced, and then digested in lung digestion buffer containing 0.1% Collagenase I (Worthington Biochemical Corporation) and 2.4 U/ml dispase (Thermo Fisher) for 90 minutes at 37 degrees C. Digested lungs were filtered through a 100 μm cells strainer and then washed with 15 mL of 0.05 M EDTA in 1x PBS. Cells were centrifuged at 400 × g for 10 minutes and then re-suspended in complete Dulbecco’s Modified Eagle Medium (cDMEM) and plated in a T75 tissue-culture flask (Corning). For cytokine and virus stimulations, 2×10⁵ cells were plated in each well of a 24-well plate 24 hours prior to stimulation. Fibroblasts were stimulated with the following murine cytokines: IL-1B (10 ng/mL), IL-1A (10 ng/mL), IL-33 (10 ng/mL), IL-18 (10 ng/mL), TNFα (200 ng/mL), IFNA (1000 U/mL), IL-6 (40 ng/mL), TGFB (2 ng/mL), IL-17A (50 ng/mL), IL-27 (50 ng/mL), and GM-CSF (40 ng/mL). For the virus stimulations, cells were infected at a multiplicity of infection (MOI) of 2. Virus inoculum was incubated with the cells for 1 hour at 37 degrees C. The following viruses were used for the stimulations: A/Puerto Rico/8/1934 (PR8), A/California/04/2009 (CA09), and A/Perth/16/09 (Perth). The supernatant was removed, and cells were washed three times with cDMEM. The wells were replenished with 1 ml of cDMEM, and the cells were incubated at 37 degrees C for 24 hours. To collect bronchoalveolar lavage (BAL) fluid, a catheter was inserted into the trachea, and 3 ml of 1x PBS was used to wash the lungs. BAL fluid was centrifuged at 400 × g for 5 minutes to pellet cells, and then the cells were resuspended in 350 μl Trizol reagent.
For co-culture experiments, normal human lung fibroblasts (Lonza) were plated at a density of 2,500 cells/cm2 in the basal chamber of a 24-well plate and cultured in fibroblast growth medium (Lonza) overnight at 37 degrees C and 5% CO2. Normal human bronchial epithelial cells (NHBEs) were seeded at a density of 10,000 cells/cm2 kn 12 mm trans-well inserts (Corning) coated with human placental collagen and then added to plates containing fibroblasts. Co-cultures were cultured in bronchial epithelial growth medium (BEGM) (Lonza) at 37 degrees C and 5% CO2 for 7 – 10 days. Co-cultures were then taken to the air-liquid interface and basolateral media was exchanged for media consisting of 50% DMEM and 50% BEGM supplemented with the BEGM BulletKit (Lonza). Media were changed every 2 – 3 days until the cells were fully differentiated (2 – 3 weeks). For infections, NHBEs were inoculated at a multiplicity of infection (MOI) of 2 using the following influenza A virus strains: H3N2 A/Perth/16/09, H5N6 A/Oriental Magpie Robin/Hong Kong/6154/2015, and H7N9 A/Hong Kong/125/2017. Infections with avian strains were performed in an ABSL3+ facility.
For monoculture experiments, NHBEs from a single donor were plated in 24-well transwell plates (Corning) and cultured in Bronchial Epithelial Basal Medium (BEBM) (Lonza) supplemented with bovine pituitary extract, insulin, hydrocortisone, gentamicin/amphotericin, transferrin, triiodothyronine, epinephrine, epidermal growth factor, and retinoic acid until wells were confluent and cells formed tight junctions. Supernatant was then removed from the apical side of the trans-well and cells were taken into the air-liquid interface for 2 – 3 weeks. NHBEs were then stimulated with the following human cytokines adding each factor to media in the basal chamber: IL-1B (10 ng/mL), IL-1A (10 ng/mL), IL-33 (10 ng/mL), IL-18 (10 ng/mL), TNFA (200 ng/mL), IFNA (1000 U/mL), IL-6 (40 ng/mL), TGFB (2 ng/mL), IL-17A (50 ng/mL), IL-27 (50 ng/mL), and GM-CSF (40 ng/mL). For virus stimulations, cells were infected at an MOI of 2. Virus inoculum was incubated with the cells in the apical chamber for 1 hour at 37 degrees C. The supernatant was removed, and cells were washed three times with BEBM, and incubated at 37 degrees C for 24 hours. Normal human bronchial fibroblasts (NHBFs) (Matek) were plated in 24-well plates at a density of 2×10⁵ cells/well and cultured in cDMEM. NHBFs were stimulated with the cytokines and viruses listed above. Following incubation, the supernatant was removed and cells were collected in 350 μl Trizol Reagent (Thermo Fisher). RNeasy spin columns (Qiagen) were then used to isolate RNA from the samples according to the manufacturer’s instructions. Following RNA isolation, the amount of RNA input was normalized (200 ng), and cDNA was generated using the iScript cDNA synthesis kit (Biorad). cDNA was then prepared for quantitative polymerase chain reaction (qPCR) using the Fluidigm Biomark (Fluidigm). Data were collected using the Fluidigm Biomark data collection software (Fluidigm). Exon-spanning qPCR primers were designed to target a panel of 96 ECM-related genes for humans (Supplemental Table 1) and mice (Supplemental Table 2).
For whole lung homogenates from mice, lungs were collected at 0, 1, 3, 6, 9, 12, 15, 30, and 40 days after infection. C57BL6/J mice were infected with 2500 EID50 PR8. Whole lungs were dissected and homogenized in 750 μl Trizol reagent using the TissueLyser II (Qiagen). RNA was isolated according to the manufacturer’s protocol.
Spatial Transcriptomics
C57BL/6J (Jackson Laboratories) were infected intranasally with 2500 EID50 of IAV PR8 in 30 μl of 1x PBS. Lungs were dissected from the mice 10 days after infection. Sections obtained from four distinct mice were imaged and processed for spatially resolved gene expression using the Visium Spatial Transcriptomics kit (10x Genomics). Lungs were inflated with 300ul of 50% OCT and 50% PBS v/v and immediately snap-frozen in OCT using isopentane that was cooled in a liquid nitrogen bath. For each lung, the same left lobe was harvested and stored at −80°C until cryosectioning. For cryosectioning, samples were equilibrated to −22°C. Exploratory sections were stained with a fluorescent lectin and dapi to determine areas of immune infiltration and remodeling, and then blocks were trimmed to 5×5mm to encompass normal and remodeled areas prior to sectioning directly onto the spatial transcriptomics kit slide. Tissue permeabilization was optimized at 12 minutes on independent lung sections. Libraries were sequenced on the Illumina NovaSeq platform at 28×120 basepairs, and resulting data were processed using SpaceRanger (v1.0.0, 10x Genomics) with manual alignment of fiducial markers, manual tissue identification, and r2-length trimmed to 91bp. Downstream analyses were conducted with Seurat (v3.1.4.9901)32.
ADAMTS-4−/− and ADAMTS-4+/+ Survival Experiments
Mice were infected intranasally with 6000 EID50 of PR8 in 30 μl 1x PBS after anesthetizing with 2,2,2-tribromoethanol by intraperitoneal (i.p.) injection. Following infection, mice were monitored twice daily and weight was recorded. Mice were euthanized if they become severely moribund based on body index score and substantial weight loss31. Righting reflex of severely moribund animals was assessed to determine if immediate euthanasia was necessary. Mice who passed 20% weight loss were placed on their backs, and if unable to right themselves within 10 seconds, were euthanized. Animals were identified by ear tag numbers, and investigators assessing morbidity were blinded to the genotype.
Plaque Titers
BAL fluid was used to obtain viral titers inoculating Madin-Darby Canine Kidney (MDCK) cells. MDCKs were plated in six-well tissue culture plates at a density of 4×10⁵ cells/well. Twenty-four hours after plating, cells were washed three times with 1x PBS and then incubated with 1 mL of BAL fluid, after performing six 10-fold dilutions in serum-free MEM. Cells were incubated with inoculum for 10 minutes at 4 degrees Celsius and then for 50 minutes at 37 degrees Celsius. Inoculum was removed and 3 mL of MEM containing 0.9% agarose and 1 mg/ml of L-1-tosylamido-2phenylethyl chloromethyl ketone-treated (TPCK) trypsin was overlaid onto the cell monolayer. Plates were then incubated at 37 degrees for 72 hours, and then plaques were counted after staining the cells with crystal violet.
Pulse Oximetry
Mice were inoculated intranasally with 6000 EID50 of IAV PR8 and arterial oxygen saturation was measured using the MouseOx system (STARR Life Sciences). Following infection, fur was removed around the neck of the animal, and arterial oxygen saturation (SpO2) was measured using a throat collar sensor. After acclimatization, oxygen saturation measurements were recorded for three minutes, and measurements were averaged over the measurement period.
Histology and Morphometry Viral Spread Analysis
Lungs were dissected at 3 and 6 days after infection with 2500 EID50 of PR8. Lungs were inflated with 1 mL of 10% neutral-buffered formalin, and then placed in a 15 mL conical tube containing 3 mL more of formalin. Lungs were incubated in formalin at room temperature for at least 72 hours to ensure complete fixation of the tissue. Lungs were embedded in paraffin blocks and then sectioned onto glass slides. Serial tissue sections were stained with hematoxylin and eosin (H&E) for histology or immunohistochemical labeling of viral antigen was completed by using a primary goat polyclonal antibody (US Biological, Swampscott, MA) against influenza A, USSR (H1N1) at 1:1000 and a secondary biotinylated donkey anti-goat antibody (catalog number sc-2042; Santa Cruz Biotechnology, Santa Cruz, CA) at 1:200 on tissue sections subjected to antigen retrieval for 30 minutes at 98°C. The extent of virus spread was quantified by first capturing digital images of whole-lung sections stained for viral antigen using an Aperio ScanScope XT Slide Scanner (Aperio Technologies, Vista, CA) and then manually outlining fields with the alveolar areas containing virus antigen-positive pneumocytes. The percentage of each lung field with infection/lesions was calculated using the Aperio ImageScope software. For histologic grading of lesions, a pathologist blinded to treatment group identity evaluated pulmonary lesions in H&E-stained histologic sections and assigned scores based on their severity and extent as follows: 0 = no lesions; 1 = minimal, focal to multifocal, barely detectable; 15 = mild, multifocal, small but conspicuous; 40 = moderate, multifocal, prominent; 80 = marked, multifocal coalescing, lobar; 100 = severe, diffuse, with extensive disruption of normal architecture and function.
Assessment of IAV-infected cells by flow cytometry
Lungs were perfused with 10 mL of cold 1x PBS injecting into the right ventricle of the heart and then minced and digested in lung digestion buffer containing 400 U/mL of Collagenase I (Worthington Biochemical Corporation) and 50 U/ml of DNaseI (ThermoFisher) in HBSS for 30 minutes at 37 degrees C. Digested lungs were filtered through a 100 μm cell strainer and washed with HBSS. Red blood cell lysis was performed, and cells were washed and resuspended in FACS buffer. Cells were washed and then incubated with Trustain FcX anti-mouse CD16/CD32 (Fc Block) at a dilution of 1:100 for 10 minutes at room temperature. For surface staining, cells were then washed and incubated in 100 μl of FACS buffer (1% FBS/1 mM EDTA in 1x PBS) containing Ghost Dye Violet 510 (1:100), PE/Cy7 anti-mouse CD45.2 (1:200), PacBlue anti-mouse CD11c (1:100), APC/Cy7 anti-mouse CD11b (1:100), BV650 anti-mouse Gr-1 (1:200), APC anti-mouse CD326/EpCAM (1:100), PE anti-mouse CD90.2 (1:100), PerCP/Cy5.5 anti-mouse CD31 (1:100) for 30 minutes at room temperature. For intracellular staining, cells were fixed and membranes permeabilized by incubating in 100 μl fixation/permeabilization solution (BD Biosciences) for 20 minutes on ice. Cells were washed with permeabilization buffer and then incubated with FITC anti-influenza A (1:100).
Assessment of CD8+ T cell responses
In order to assess immune cell populations by flow cytometry, whole lungs were dissected, minced, and incubated with spleen dissociation media (STEMCELL) for 30 minutes at 37 degrees C. Red blood cell lysis was performed, and cells were washed with HBSS and counted using a Vi-CELL XR cell counter (Beckman Coulter). For ex vivo stimulation and intracellular cytokine staining, 1×10⁶ total lung cells were plated in a 96-well plate for each condition. Cells were stimulated with Cell Stimulation Cocktail (Biolegend), containing PMA/ionomycin and Brefeldin A, at a dilution of 1:500 or with influenza peptides at a concentration of 1 μM for 4 hours. Following stimulation, cells were washed and then incubated with Trustain FcX anti-mouse CD16/CD32 (Fc Block) at a dilution of 1:100 for 10 minutes at room temperature. For surface staining, cells were then washed and incubated in 100 μl of FACS buffer (1% FBS/1 mM EDTA in 1x PBS) containing Live/Dead Aqua (1:100), APC anti-mouse CD45.2 (1:100), FITC anti-mouse CD3 (1:100), BV650 anti-mouse CD8 (1:200), and APC/Cy7 anti-mouse CD4 (1:200) for 30 minutes at room temperature. For intracellular staining, cells were fixed and membranes permeabilized by incubating in 100 μl fixation/permeabilization solution (BD Biosciences) for 20 minutes on ice. Cells were washed with permeabilization buffer and then incubated with PE/Cy7 anti-mouse IFNG (1:100) for 30 minutes on ice.
For IAV peptide:MHC tetramer staining, 1×10⁶ total lung cells were plated in a 96-well plate for each sample. Cells were incubated with APC PB1703–711 tetramer (1:750), PE PA224–233 tetramer (1:750), and BV785 NP366–375 tetramer (1:250) for 1 hour on ice. Then, cells were surface stained with FITC anti-mouse CD3 (1:100), BV650 anti-mouse CD8 (1:200), APC/Cy7 anti-mouse CD4 (1:200) for 30 minutes on ice.
Lung Tissue Immunofluorescence
Lungs were dissected 9 days after infection with 2500 EID50 of PR8. Lungs were inflated with 1 mL of fixative containing 2% paraformaldehyde, 0.1% Triton-100 and 1% DMSO and then transferred to a 15 mL conical tube containing 3 mL of fixative for 24h prior to cryoprotection with 30% sucrose in PBS for an additional 24h. Tissues were cryosectioned at 10μm thickness and blocked in buffer comprised of PBS containing 2% bovine serum albumin and 5% donkey serum. Tissues were stained overnight in blocking buffer containing 4μg/mL rat anti-CD3 (Biolegend, clone 17A2), and 4μg/mL rabbit anti-mouse versican GAG beta domain (Millipore Sigma, AB1033). Sections were washed in PBS prior to incubation with CF488-conjugated donkey anti-rat IgG (Biotium, 20027, lot 16C0301, 2μg/mL), CF568-conjugated donkey anti-rabbit IgG (Biotium, 20098, lot 19C0110, 2μg/mL) and DAPI [10uM] for 1 hr at RT. Slides were washed with PBS and mounted with prolong diamond hardset mounting medium (ThermoFisher). High resolution images were acquired using a Marianis spinning disk confocal microscope (Intelligent Imaging Innovations) equipped with a 40X 1.3NA Plan-Neofluar objective, 405nm, 488nm and 561nm laser lines and Prime 95B CMOS camera (Photometrics), and analyzed using Slidebook software (Intelligent Imaging Innovations). For quantification of CD3+ cells, 3 – 4 fields of view in the areas of tissue remodeling were collected for each lung.
Lung Function Test
For lung function studies, mice were infected with 2500 EID50 of PR8. At 10 days post-infection, mice were anesthetized with 2,2,2-tribromoethanol by intraperitoneal (i.p.) injection and tracheal tube was inserted. Airway resistance and dynamic lung compliance was measured using the Buxco Finepointe Resistance and Compliance system (Data Sciences International). Data were collected using Buxco Finepointe software (Data Sciences International). Mice were mechanically ventilated at a rate of 140 breaths/minute. Five methacholine challenges were performed at doses of 1.5625, 3.125, 6.25, 12.5, and 25 mg/ml, administering the methacholine in 0.010 ml of PBS. Following each methacholine challenge, resistance and compliance were measured for 3 minutes allowing the mice to recover for 1 minute after each measurement. Measurements for resistance and compliance were averaged over the 3 minute measurement period for each methacholine challenge and baseline measurements.
T cell Migration Assays
For migration assays, CD8+ T cells were isolated from spleens of C57BL/6J mice. To enrich for CD8+ T cells, samples were magnetically depleted using a cocktail of the following biotinylated antibodies: anti-mouse B220 (1:50), anti-mouse MHC Class II (1:50), anti-mouse CD11b (1:100), anti-mouse CD49b (1:200), and anti-mouse CD4 (1:100). Up to 109 total spleen cells were incubated with the antibody cocktail for 15 minutes on ice. Cells were washed with FACS buffer and then incubated with Miltenyi Streptavidin microbeads (1:25) for 15 minutes on ice. The cells were centrifuged at 500 × g for 5 minutes and then resuspended in 1 mL of FACS buffer. The sample was added to a pre-equilibrated Miltenyi LS column and the flow-through enriched by CD8+ T cells was collected. CD8+ T cells were then activated with anti-mouse CD3e (1 μg/mL) and anti-mouse CD28 (3 μg/mL) antibodies in complete RPMI at 37 degrees C for 72 hours. 48 hours prior to the migration assay, primary murine lung fibroblasts, which were plated at a concentration of 105 cells/well in a 24-well plate the previous night, were stimulated with IL-1B (10 ng/mL) and TNFα (200 ng/mL). For activation states (resting, DRFib, IRFib), sorted fibroblasts were plated at a density of 104 cells/well 48 hours prior to the migration assay. 6.5 mm polycarbonate trans-well inserts with 8.0 μm pore size (Corning) were coated with 10 μg/mL of versican purified from bovine aorta29 for 2 hours at 37 degrees C. Versican was aspirated and trans-well inserts were transferred to the 24-well plate with stimulated fibroblasts. To test migration, 105 activated CD8+ T cells were added to the apical chamber of the trans-well in a volume of 100 μl of complete DMEM. Cells were allowed to migrate to the basal chamber for 4 hours at 37 degrees C. After 4 hours, supernatants from the basal chamber were collected and the number of lymphocytes were manually counted.
Quantification of Proteins in Mouse Lung Homogenates and Bronchoalveolar Lavage Fluid
Cytokine levels in lung tissue homogenates were measured using LEGENDplex cytokine bead arrays (Biolegend). Lungs were dissected from PR8-infected mice at 6 days post-infection and homogenized in 500 μl of PBS. Homogenized lung samples were centrifuged at 4,000 × rpm for 10 minutes, and 25 μl of undiluted supernatant was tested in the assay. The assay was performed according to the manufacturer’s instructions.
BAL washes were performed using 500 μl of PBS. Matrix protease levels in mouse BAL fluid were quantified using ELISA or a multiplexed, Luminex-based fluorescent assay. A custom Luminex kit (R&D Systems) was used to assay the following analytes: MMP-2, MMP-8, MMP-9, MMP-12, TIMP-1, and TIMP-4. Duoset ELISA kits (R&D Systems) were used to assay the following analytes: ADAMTS-4, MMP-3, MMP-13, and TIMP-3.
Human Cohorts
For the PICFLU cohort, the study was approved by the lead site Boston Children’s Hospital (IRB X08-11-0534) and then at each enrolling site’s IRB (enrolling sites are listed in acknowledgments) and written informed consent was obtained from at least one parent or guardian. Patients were excluded before enrollment if they had an underlying condition predisposing them to severe influenza infection as has been described previously36. Additional cohort information is presented in Extended Data Figure 10a. Endotracheal aspirate samples were obtained using standardized methods with 1.5 ml of sterile normal saline down the ETT then 3–4 breaths prior to obtaining the sample with 2 suctioning attempts aiming to collect at least 2 ml of aspirate. The sample was put on ice and transferred immediately to the laboratory for processing. One aliquot was immediately frozen (−80°C) and the rest was centrifuged and the supernatant was aliquoted and frozen at −80°C.
For the Guangzhou cohort, the study was approved by the ethics committee of the First Affiliated Hospital of Guangzhou Medical University (No: 2016–78), and informed consent was obtained from all patients or their guardians. Additional cohort information is presented in Extended Data Figure 10c.
For the Taiwan cohort, the human subjects’ protocol was reviewed and approved by the Johns Hopkins School of Medicine and the Chang Gung Memorial Hospital Institutional Review Boards (IRB00091667). Informed consent was obtained from all patients or their guardians. This protocol allowed for the collection of residual bronchoalveolar lavage (BAL) and sputum samples that were initially collected for clinical purposes from influenza positive patients. Extended Data Figure 10c.
For lung samples from de-identified, deceased donors, the tissues utilized were procured by the National Disease Research Interchange (NDRI) with support from NIH grant U42OD11158. All NDRI consent forms and protocols are reviewed and approved by the Institutional Review Board at the University of Pennsylvania. Research involving these tissues was determined to not involve human subjects by the Institutional Review Board at St. Jude Children’s Research Hospital.
Quantification of matrix protease and cytokine/chemokine protein levels in human samples
Cytokine and chemokine levels were measured using Milliplex Human Cytokine/Chemokine Magentic Bead Panel - Premixed 41-plex. MMP and TIMP protein levels were quantified using the following Milliplex bead-based multiplexed assay, Human MMP Magnetic Bead Panel 1 (MMP-3, MMP-12, MMP-13), Human MMP Magnetic Bead Panel 2 (MMP-1, MMP-2, MMP-7, MMP-9, MMP-10), and Human TIMP Magnetic Bead Panel 2 (TIMP-1, TIMP-2, TIMP-3, TIMP-4). ADAMTS-4 and ADAMTS-5 were measured using Duoset ELISA kits (R&D Systems).
Cytokine correlation matrices
Correlation matrices were generated using samples analyzed in severity analyses, with cytokines log10 transformed. To control for potential effects of age and day of sample collection (days after symptom onset; DAO), we computed partial pairwise spearman correlations and assessed their statistical significance using the R psych package37. Correlations were visualized using the R corrplot package38, and correlations with p-values <0.05 after FDR adjustment were excluded.
Severity analyses
For analysis of association of ADAMTS-4 levels with severity of infection in the PICFlu cohort, we used three distinct indicators of severity: prolonged multiple organ dysfunction syndrome (PrMODS) or death, prolonged acute hypoxic respiratory failure (PrAHRF) or death, and ventilator-free days (VFDS) less than 10. In survivors, “prolonged” was defined as being present on or after day 7 of PICU admission or being on extracorporeal membrane oxygenation (ECMO) on or after day 7. PrAHRF was defined as PaO2/FiO2 ratio <200 and mechanical ventilator support, which are criteria for moderate-severe ARDS1. Ventilator-free days (VFDS) were defined as days alive and free of invasive or non-invasive mechanical ventilation up to 28 days39. Due to the bimodal distribution of VFDS, we used a cutoff of 10 VFDS to classify cases as severe (Extended Data Fig. 10b) ADAMTS-4 was modeled as a predictor of these categorical outcomes using logistic regressions in R that explicitly included gender, age, baseline health (“Previously Healthy”), and steroid administration. FDR adjustments for multiple testing were applied independently to each model. Patients were considered “Previously Healthy” if they were, upon admission, otherwise healthy, on no prescription medications, without underlying medical conditions, and not dependent on any medical devices prior to initial admission to the hospital for flu. No violations of the model assumptions were found in any reported results after specifically checking for: 1) the assumption that the relationship between continuous predictor variables and the logit of the outcome is linear, 2) evidence of extreme values in continuous predictors (as indicated by standard residuals with an absolute value over three), and 2) evidence of multicollinearity among variables (as indicated by VIF). Odds ratios were visualized using the sjPlot package in R40.
Statistical Analyses
For experiments involving mice, statistical analyses were performed using Graphpad Prism version 7.0d software. For analysis of human samples, statistical analyses were performed in R statistical software version 3.5.0 and as detailed in the sections above.
Extended Data
Extended Data Figure 1. Single-cell gene expression profiling of CD45-lung cells during severe influenza virus infection in mice.
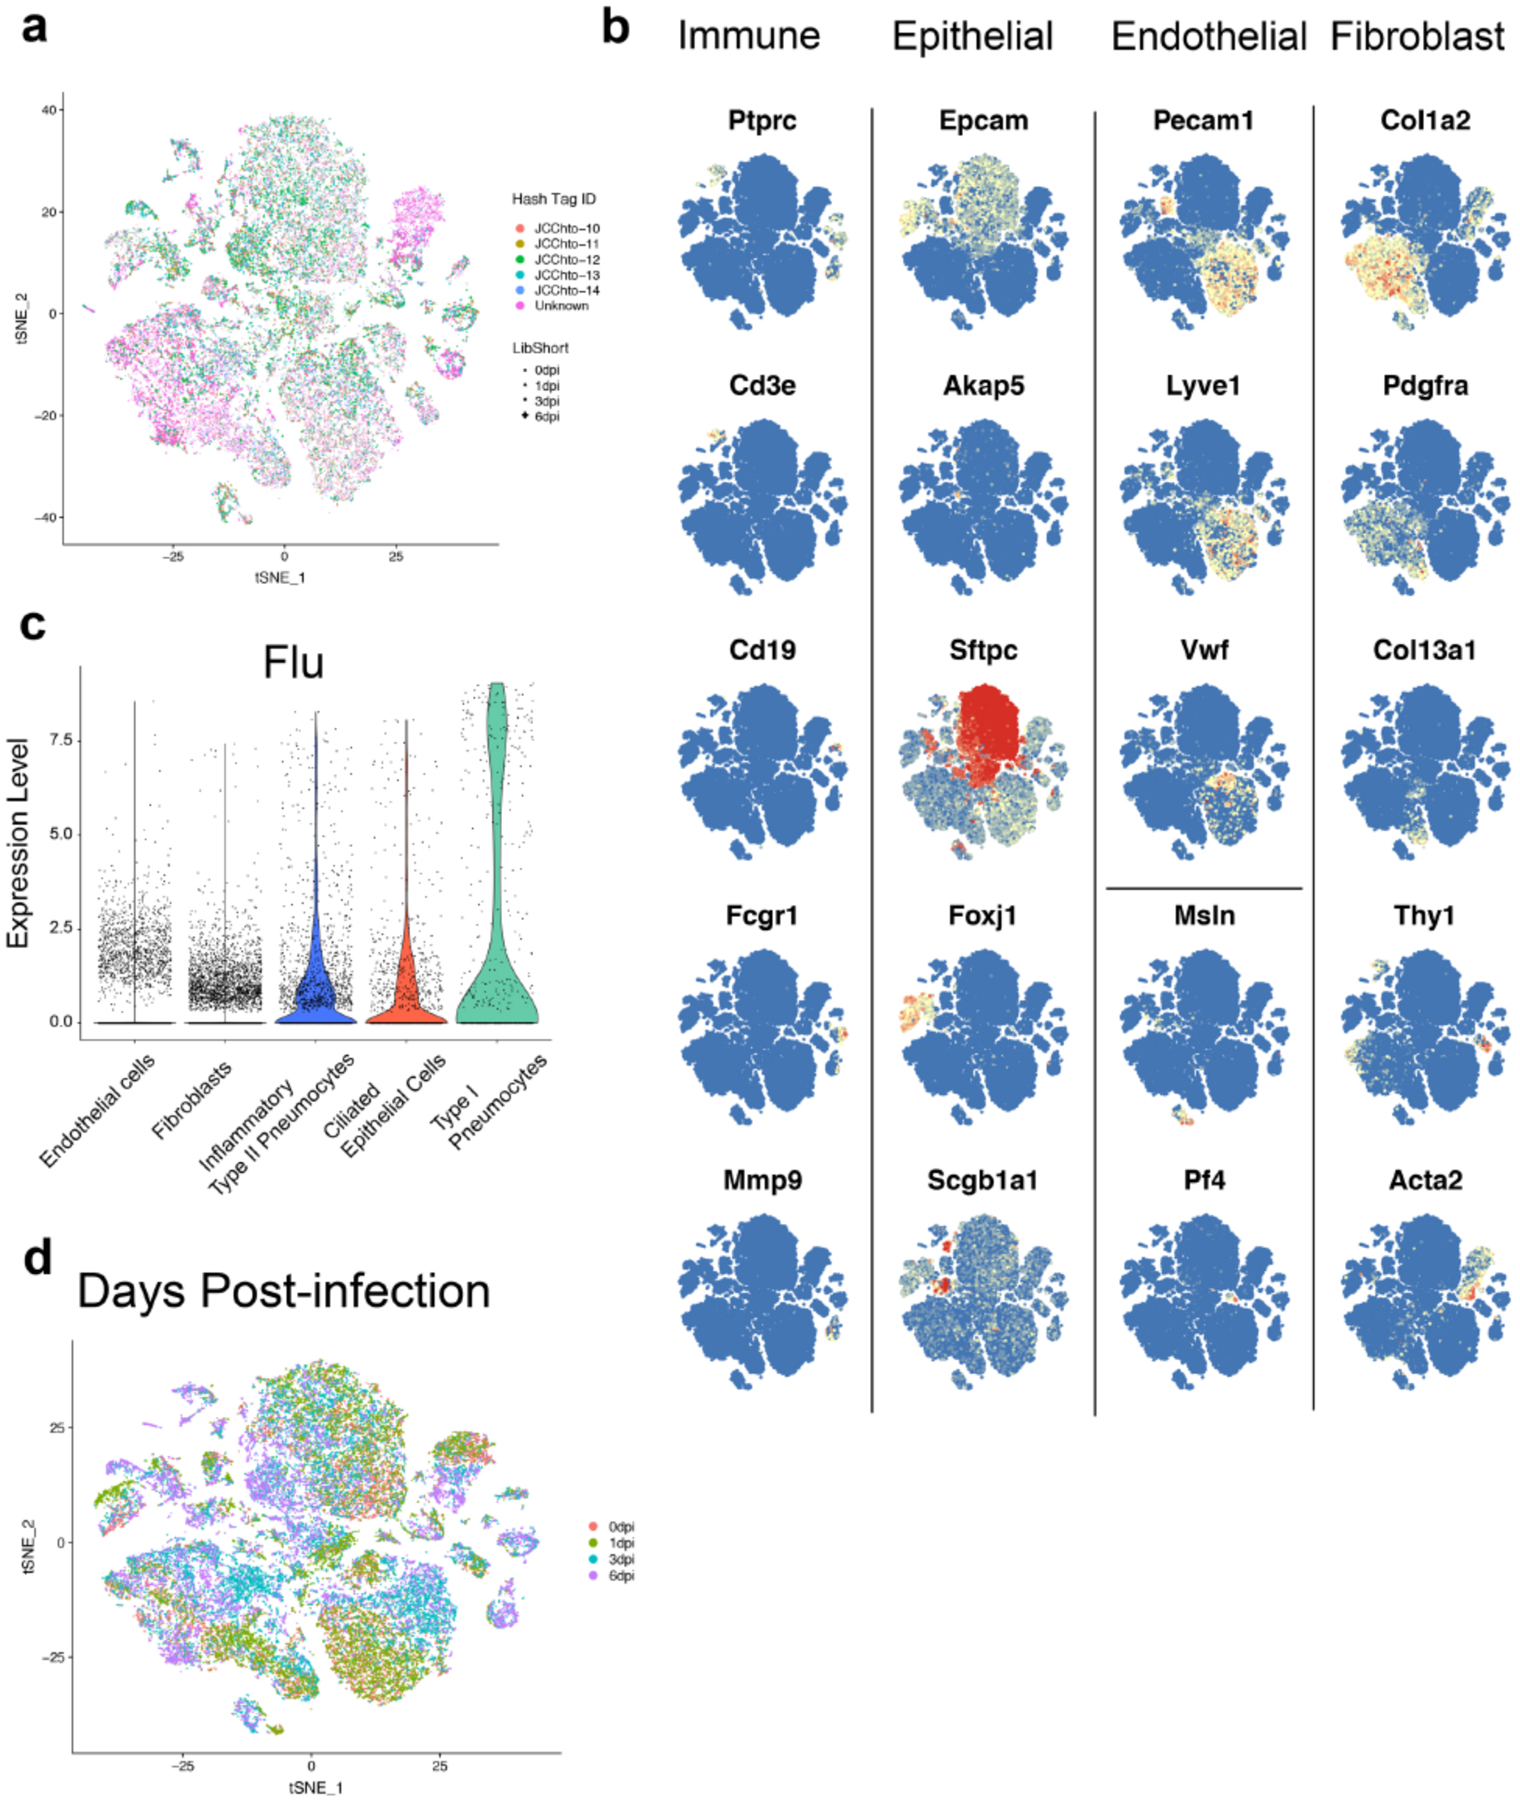
(A) Cell hashing of biological replicates for each time point. t-SNE of CD45-cells from mouse lungs at all time points. Cells from individual mice (n = 5 for time points 0, 1, and 3 dpi, and n = 4 for 6 dpi) were labeled with DNA-tagged antibodies (JCChto 10, 11, 12, 13, and 14) and pooled within time points. Pooled cells for each time point were run on separate 10x Genomics gel bead reactions. Cells are color-coded according to hashtag oligo ID as indicated at the right of the graph. ‘Unknown’ (purple) indicates that an insufficient number of hashtags were sequenced in order to determine the ID. Cells are also symbol-coded according to time point after infection: 0 dpi (circle), 1 dpi (triangle), 3 dpi (square), 6 dpi (cross). (B) Feature plots of signature genes used to identify mouse lung cell populations. The following genes were used to identify general populations of cells: immune cells (Ptprc), epithelial cells (Epcam), endothelial cells (Pecam1, Lyve1, Vwf), and mesenchymal cells (Col1a2). The following genes were used to identify specific cell populations within the main types of cells: T cells (Cd3e), B cells (Cd19), myeloid cells (Fcgr1), neutrophils (Mmp9), type I pneumocytes (Akap5), type II pneumocytes (Sftpc), ciliated epithelial cells (Foxj1), club cells (Scgb1a1), lymphatic endothelial cells (Pecam1, Thy1), fibroblasts (Pdgfra), pericytes and smooth muscle cells (Acta2), mesothelial cells (Msln), and platelets (Pf4). (C) Violin plot of expression of influenza A PR8 transcripts by scGEX in non-immune lung cells. (D) Overlay of days post-infection on t-SNE clustering of murine lung cells.
Extended Data Figure 2.. Summary of gene-set enrichment analysis of murine and human fibroblast populations.
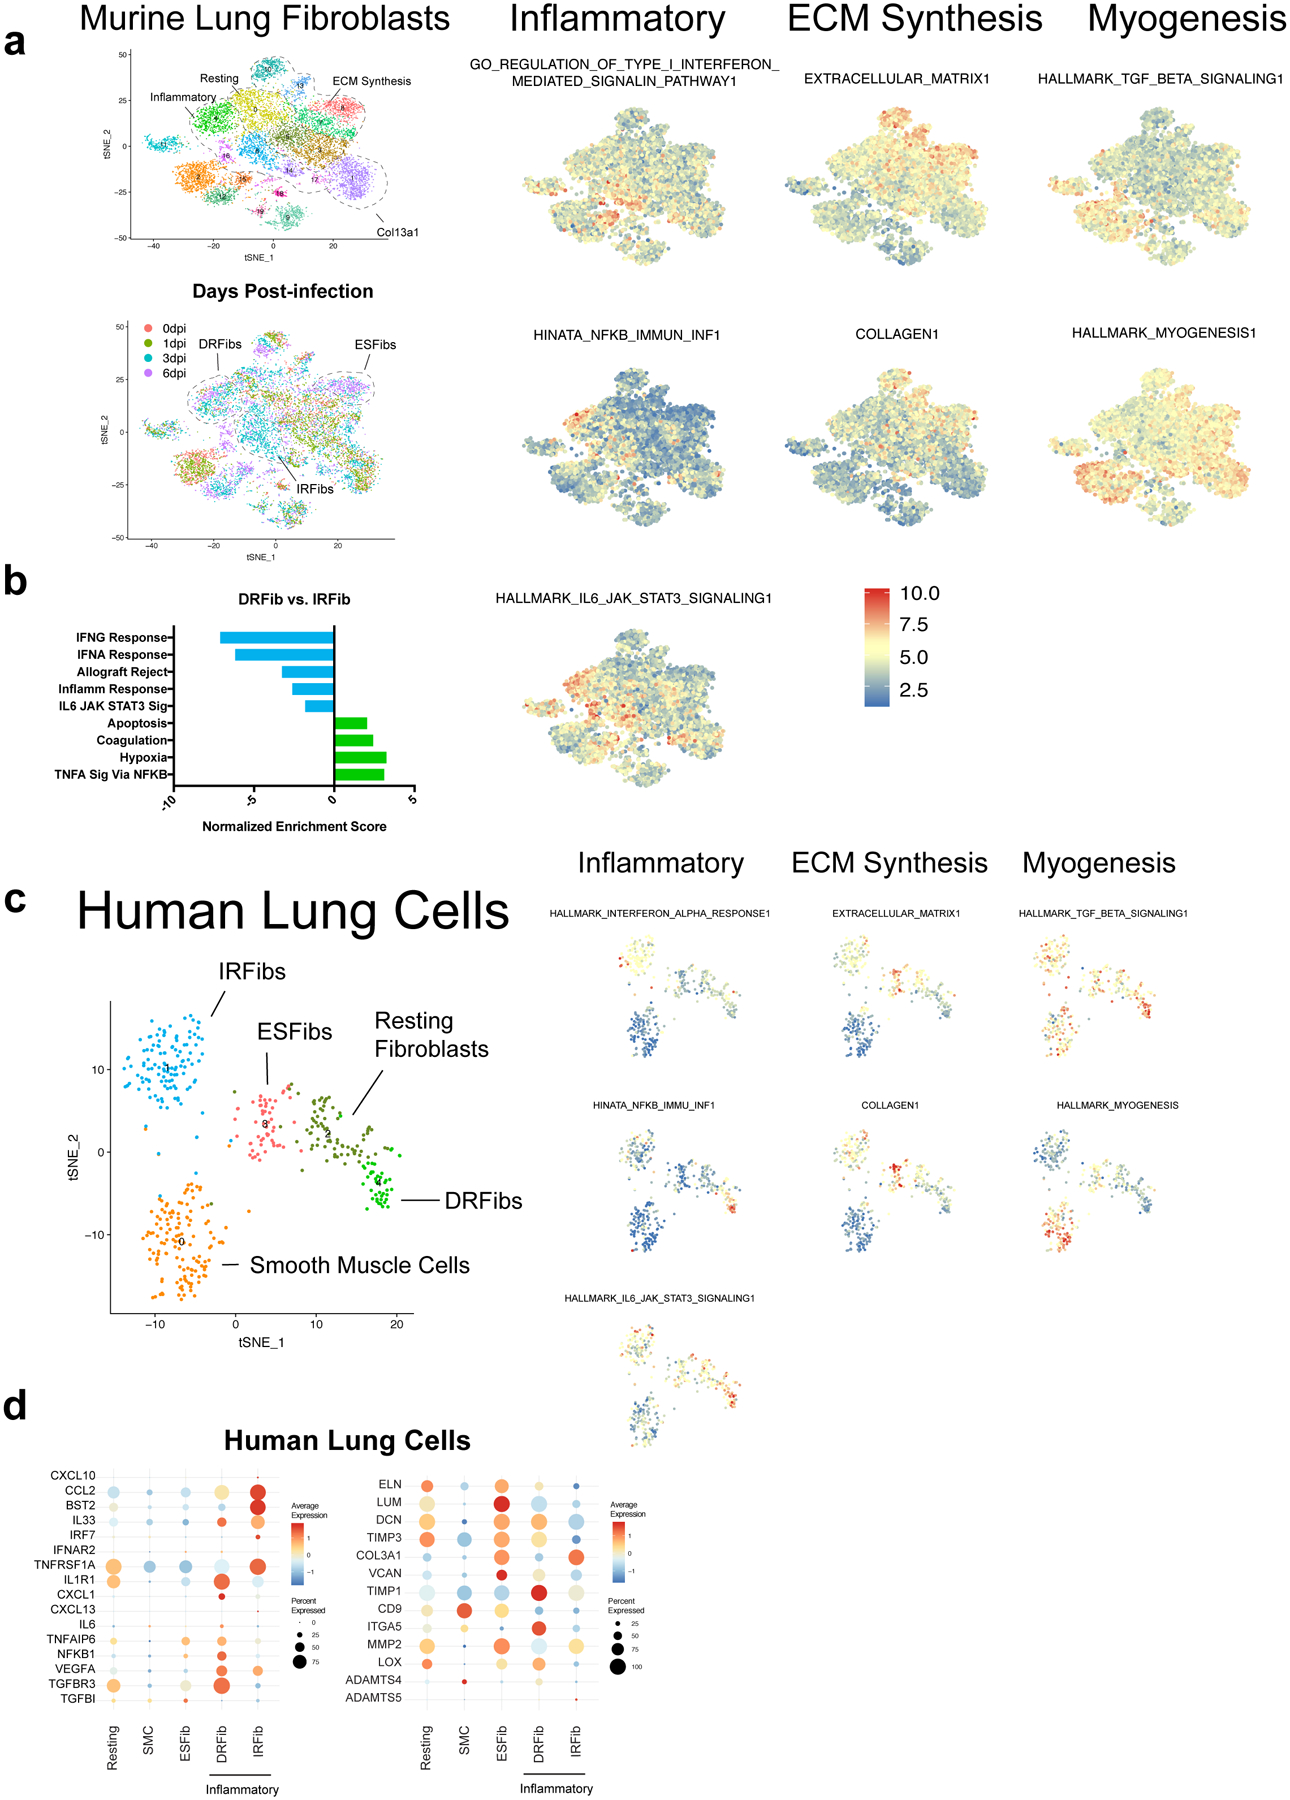
(A) Relative expression of the indicated gene sets in individual murine fibroblasts and smooth muscle cells. Gene sets representing ECM structural proteins (EXTRACELLULAR_MATRIX1 and COLLAGEN1) inflammatory cytokine responses (HALLMARK_IL6_STAT3_SIGNALING1, GO_REGULATION_OF_TYPE_I_INTERFERON_MEDIATED_SIGNALING_PATHWAY, HINATA_NFKB_IMMU_INF1), and myogenesis (HALLMARK_TGF_BETA_SIGNALING1, HALLMARK_MYOGENESIS1) are plotted. (B) Pairwise comparison of selected hallmark gene sets between murine inflammatory fibroblast clusters 4 (DRFibs) and 6 (IRFibs). Each bar represents the normalized enrichment score (NES) from GSEA comparing all cells in cluster 4 (n = 892 cells) and cluster 6 (n = 749 cells). (C) t-SNE clustering of human COL1A2 expressing mesenchymal cells from five human lung biopsy samples. Relative expression of the indicated gene sets in individual human fibroblasts and smooth muscle cells. Gene sets representing ECM structural proteins (EXTRACELLULAR_MATRIX1 and COLLAGEN1) inflammatory cytokine responses (HALLMARK_IL6_STAT3_SIGNALING1,HALLMARK_INTERFERON_ALPHA_RESPON SE1, HINATA_NFKB_IMMU_INF1), and myogenesis (HALLMARK_TGF_BETA_SIGNALING1, HALLMARK_MYOGENESIS1) are plotted. (D) Dot plots of key genes related to cytokine/chemokine induction and ECM-production and modification in human lung mesenchymal cells.
Extended Data Figure 3. Validation of inflammatory fibroblasts transcriptional states by flow cytometry.
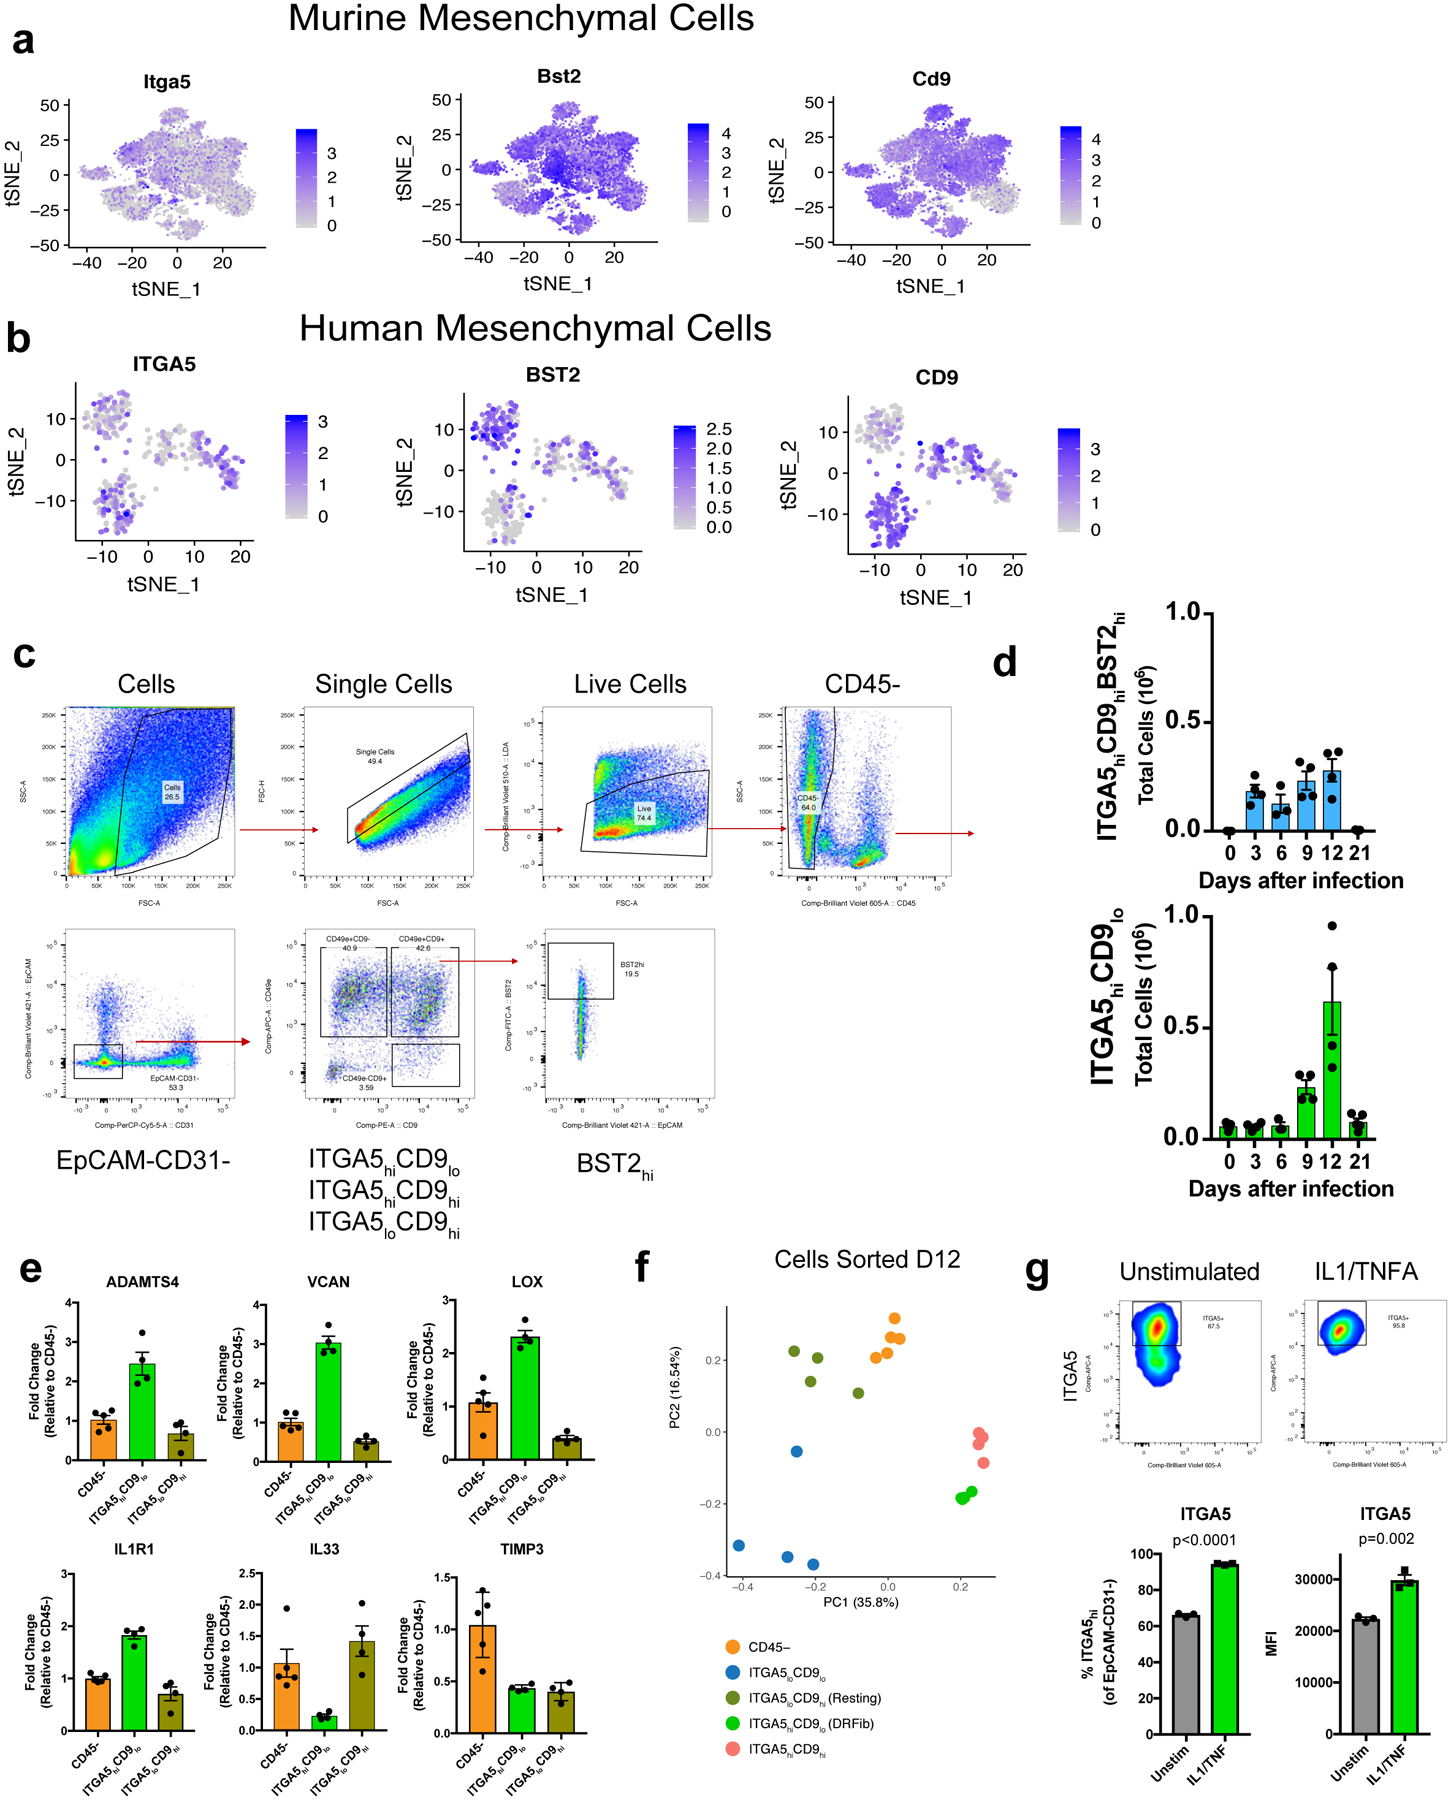
(A, B) Feature plots of Itga5/ITGA5 and Cd9/CD9 in murine and human mesenchymal cells expressing Col1a2/COL1A2 from scGEX data. Legend indicates relative expression within each dataset. (C) Gating strategy for identifying inflammatory fibroblast transcriptional states based on ITGA5 (CD49e) and CD9 staining. (D) Total cell number for IRFibs (blue) and DRFibs (green) in the lungs during IAV infection. (E) Gene expression in sorted ITGA5hiCD9lo, ITGA5lo CD9hi, and bulk CD45-cells as measured by qPCR. Each data point represents an independent biological replicate (CD45-, n = 5; ITGA5hiCD9lo , n = 4, ITGA5lo CD9hi, n = 4). Error bars represent standard error of the mean. (F) Principal component analysis of sorted fibroblast populations and bulk CD45-cells from murine lungs. (G) In vitro stimulation of murine lung fibroblasts with IL-1/TNFα. Representative flow plots of ITGA5 staining before and after stimulation. Charts at bottom indicate % of ITGA5hi fibroblasts (p = 2e-06)) and median fluorescence intensity (MFI) for ITGA5 (p = 0.002). Each data point represents an independent biological replicate (unstim, n = 3; IL1/TNF, n = 3). For statistical analysis, groups were compared using a two-sided students t-test.
Extended Data Figure 4. Assessment of fibroblast cell surface phenotype in human lung samples.
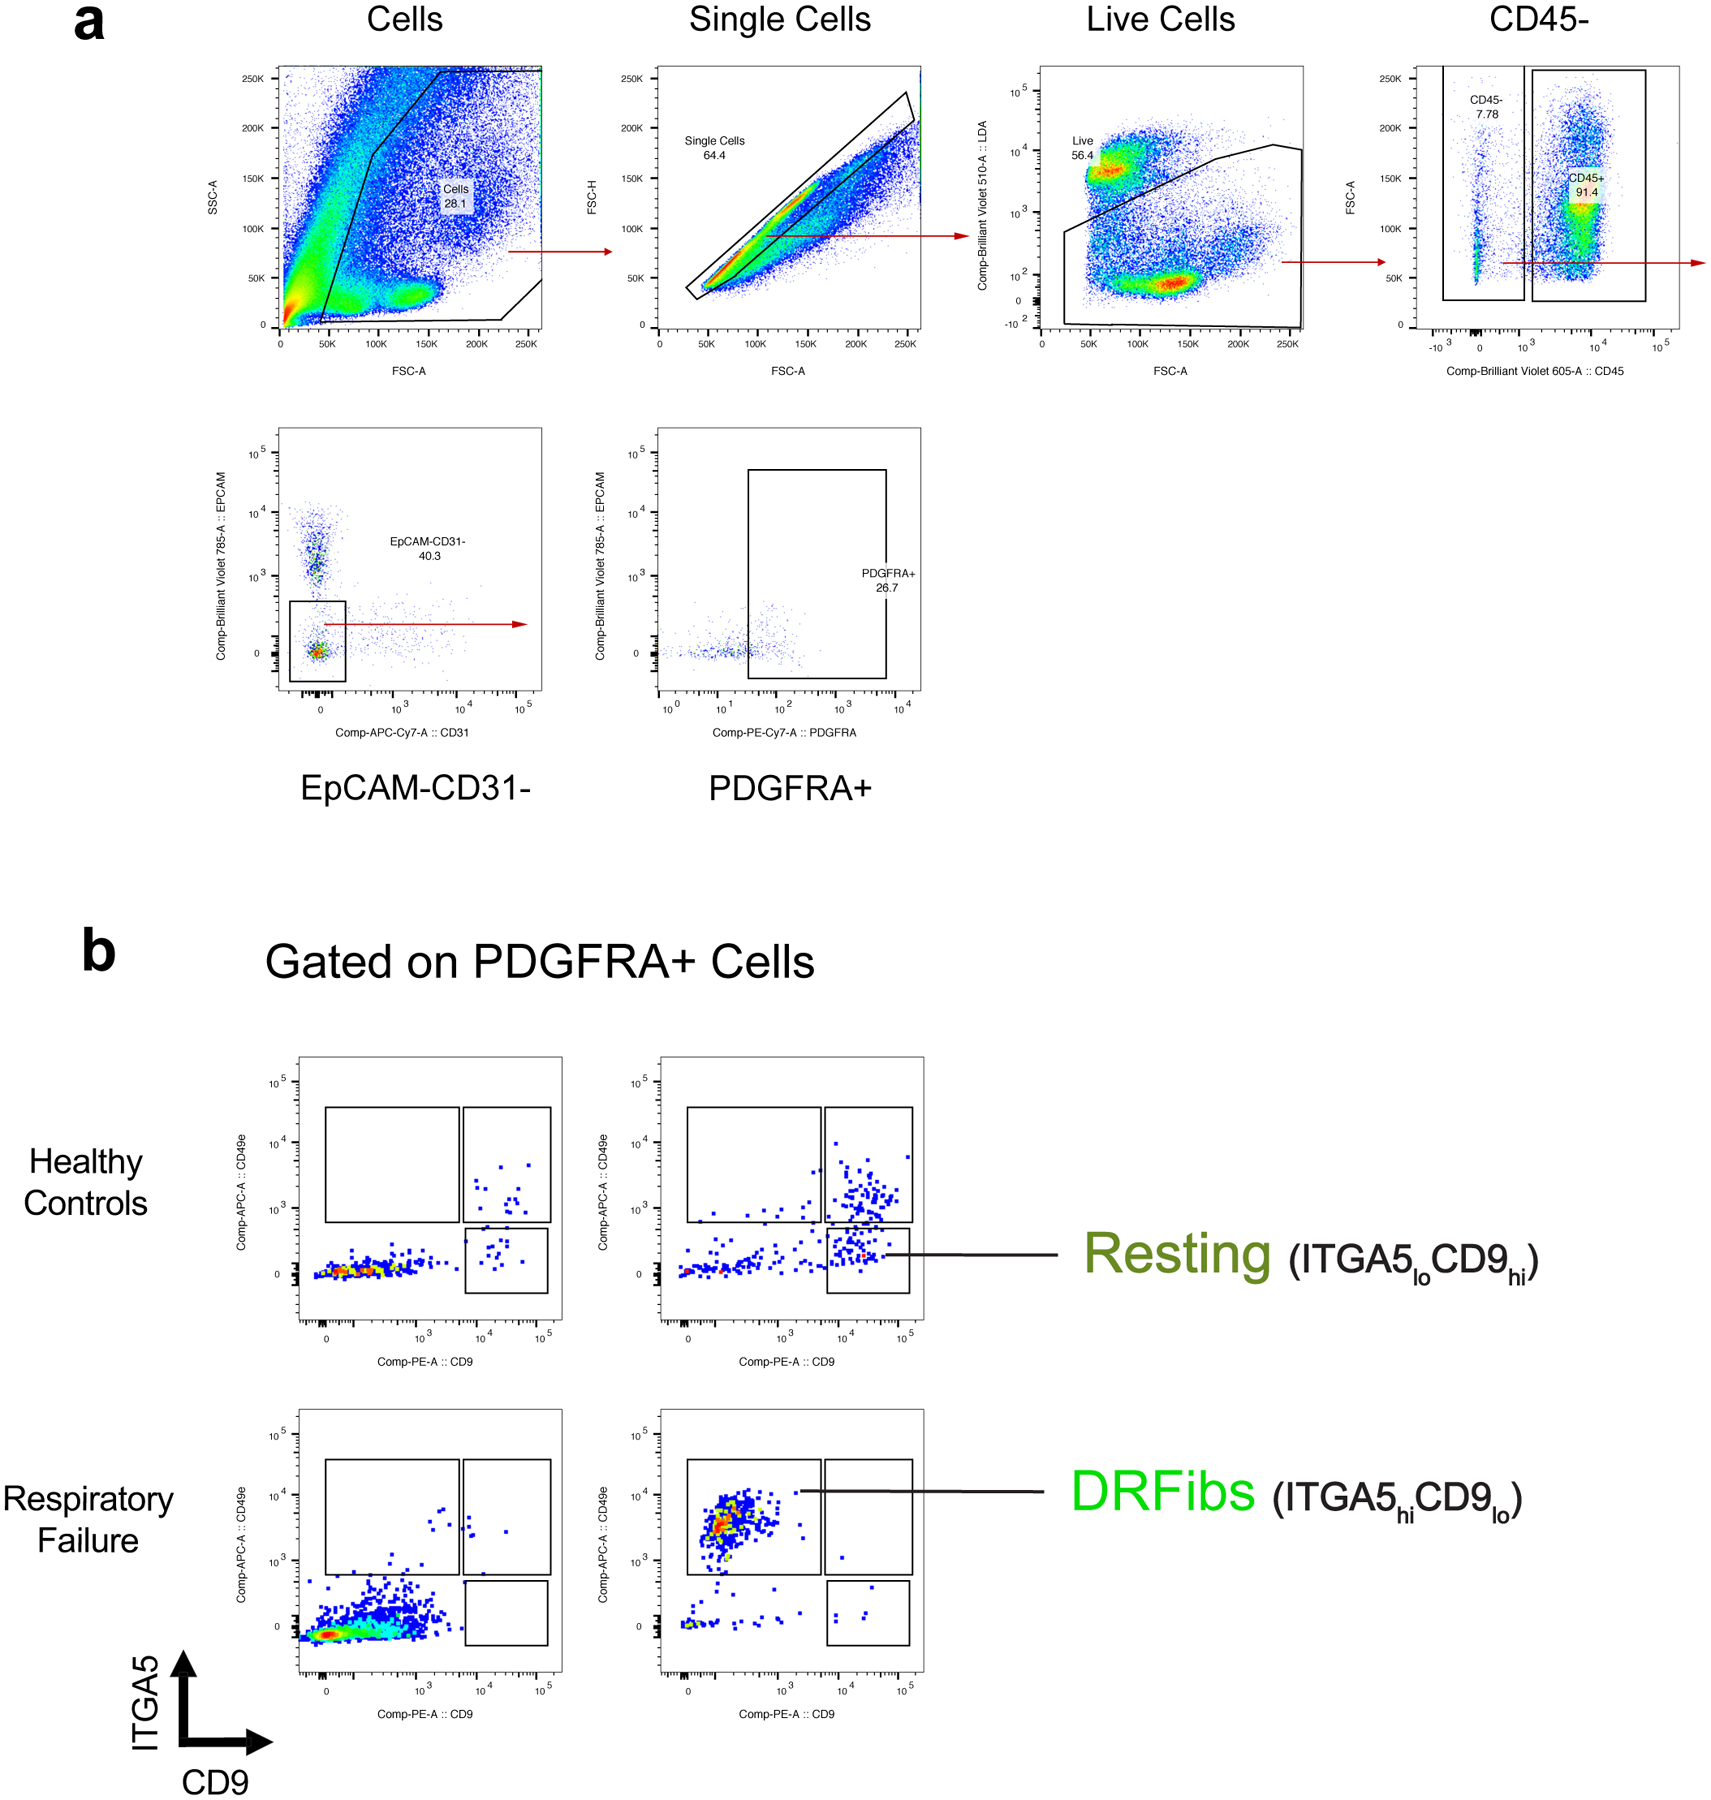
(A) Gating strategy for identifying live, CD45-EPCAM-CD31-PDGFRA+ cells in human lung samples. (B) Each flow plot represents cells gated on live, CD45-EPCAM-CD31-PDGFRA+ from an individual sample as indicated in the gating strategy. Resting fibroblasts (ITGA5loCD9hi) and damage-responsive fibroblasts (ITGA5hiCD9lo) are labeled on representative flow plots.
Extended Data Figure 5. Regulation of ECM-related gene expression in human and murine respiratory cells following cytokine stimulation.
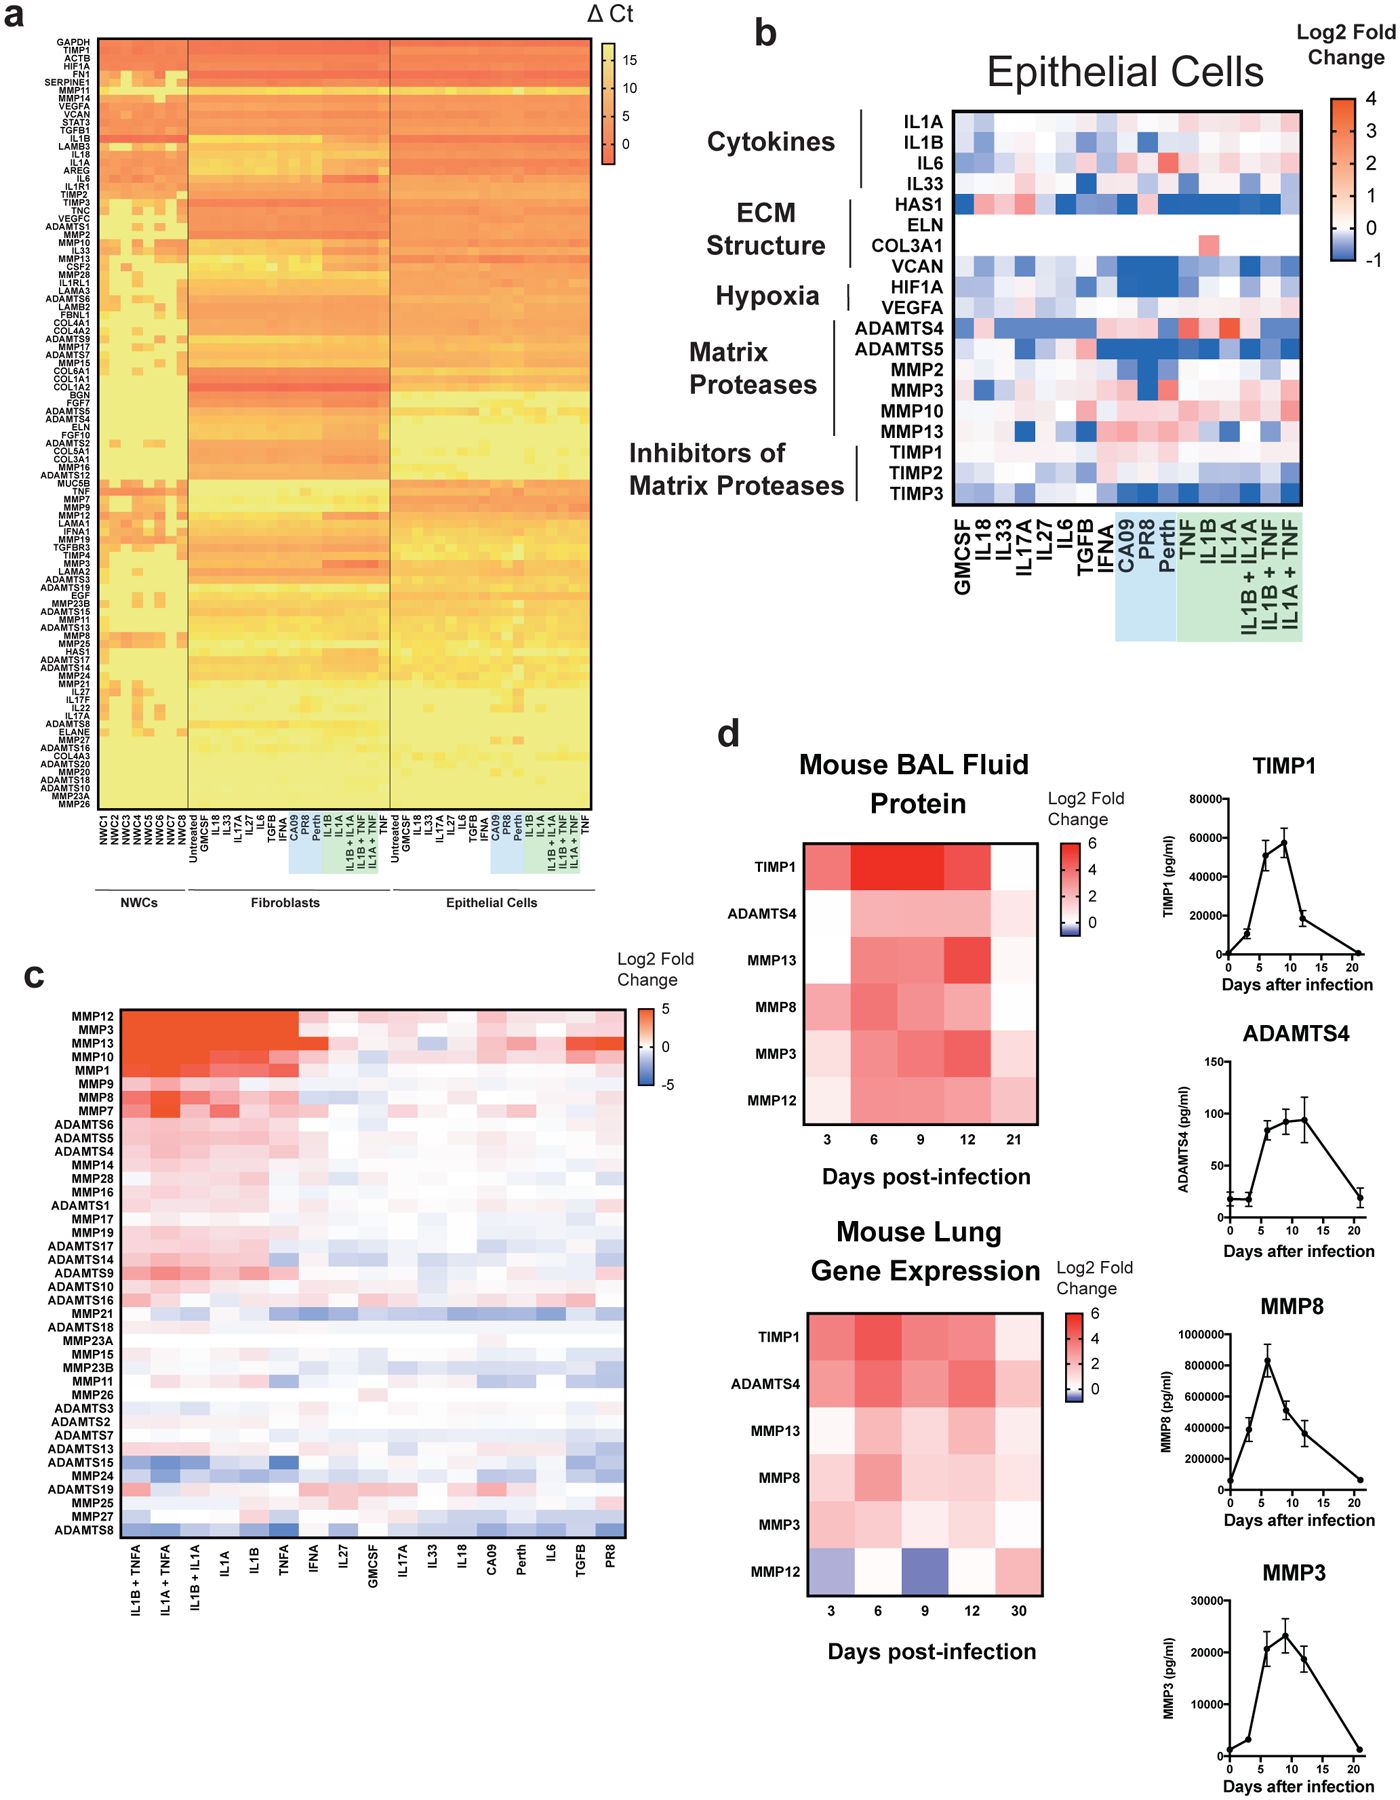
(A) Heatmap representing ΔCt values (normalized to ACTB) in normal human bronchial fibroblasts (NHBFs) and normal human bronchial epithelial cells (NHBEs) stimulated for 24 hours with the indicated cytokines or viruses, and nasal wash cells (NWCs). Green shading highlights stimulation with IL-1 cytokines, while blue shading indicates stimulation with indicated viruses. ECM-related genes are grouped by unsupervised, hierarchical clustering. (B) Heatmap representing log2 fold-change in differentiation normal human bronchial epithelial cells (NHBEs) stimulated with the indicated cytokines/viruses. Values are relative to untreated NHBEs. (C) Heat map representing log2 fold-change in gene expression relative to untreated cells as determined by the ΔΔCt method. Matrix protease genes (y-axis) and treated cell samples (x-axis) were grouped by unsupervised, hierarchical clustering. (D) Assessment of ECM protease and TIMP protein levels in bronchoalveolar lavage fluid collected from mice. Heatmaps of log2 fold-change values relative to mock-infected animals for each of the indicated analytes over the course of IAV infection. Protein levels in the BAL (top panel) are compared to log2 fold-change values relative to mock-infected animals for gene expression as measured by qPCR in whole lung homogenates. The kinetics for individual analytes plotting absolute protein concentrations are presented at the right (0dpi, n = 5 mice; 3dpi, n = 5; 6dpi, n = 5; 9 dpi, n = 5; 12dpi, n = 4; 21dpi, n = 5). Error bars represent standard error of the mean.
Extended Data Figure 6. Meta-analysis of publicly available human disease single-cell gene expression datasets.
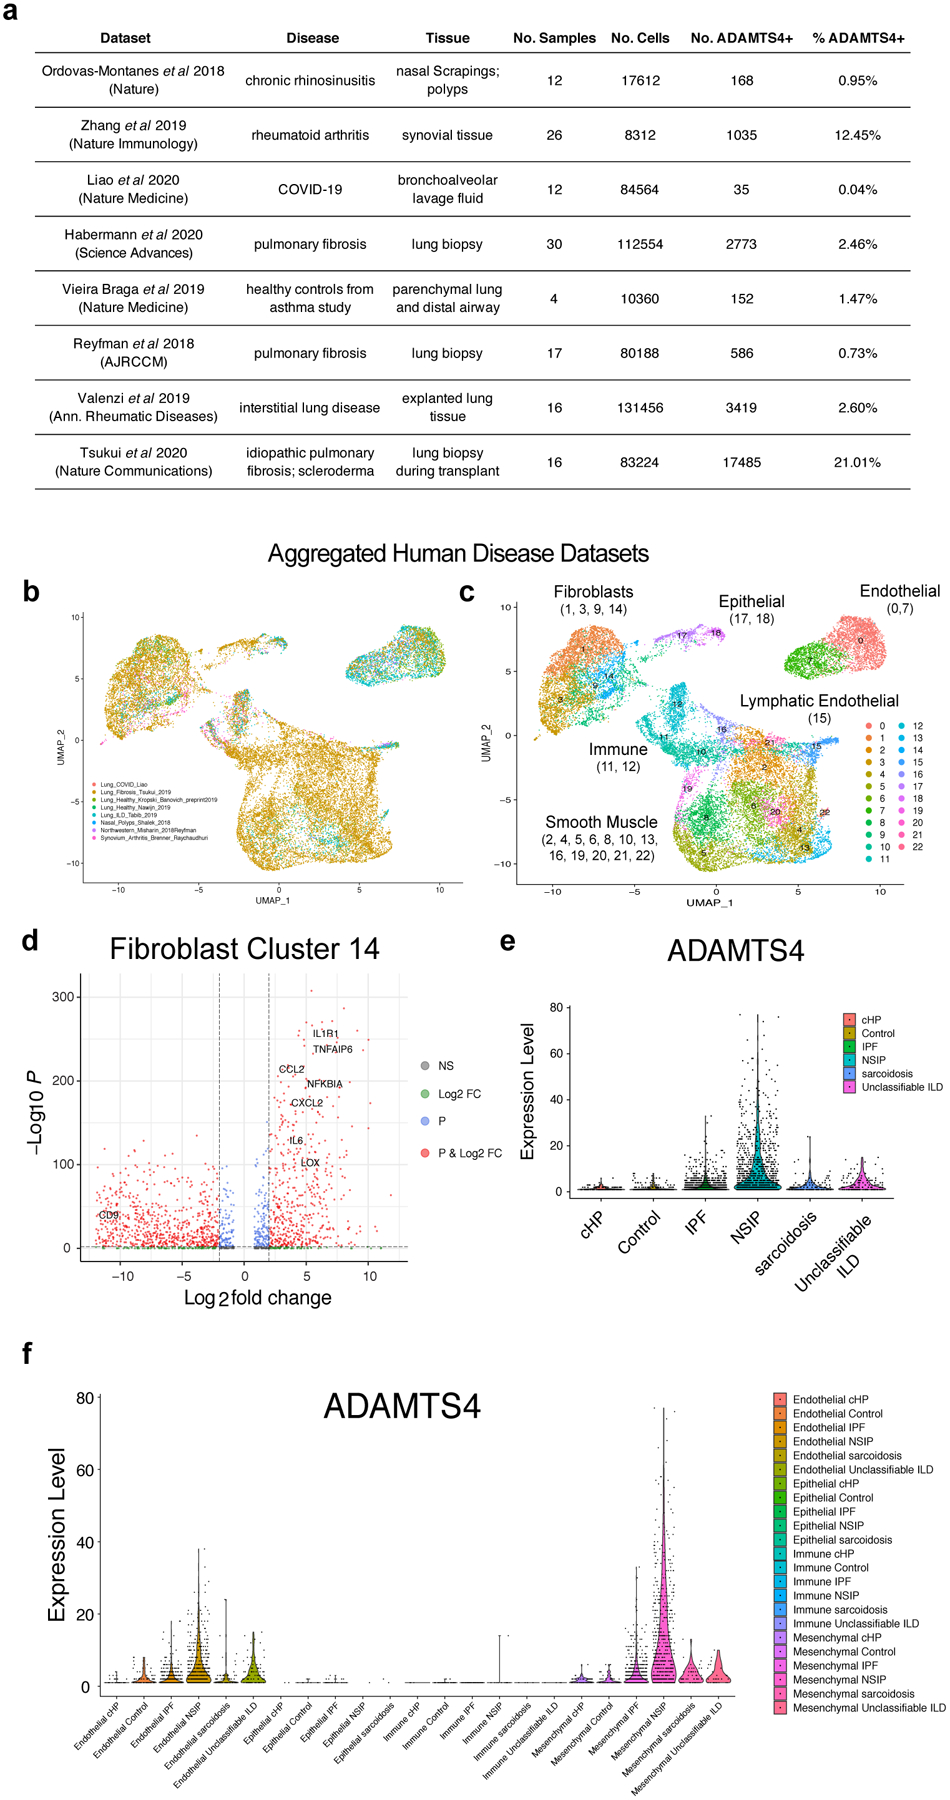
(A) Table of datasets from eight distinct studies (seven from respiratory disease and one from rheumatoid arthritis), which were aggregated for meta-analysis. Cells expressing at least one transcript of ADAMTS4 were identified. (B, C) Uniform manifold approximation and projection (UMAP) clustering of ADAMTS4+ cells with overlay of study or of unsupervised clustering by cell type. (D) Volcano plot of differentially expressed genes in cluster 14. Differentially expressed genes are based on comparison to all cells in the dataset. Each data point represents a gene and is color-coded according to whether the gene was above a threshold for adjusted p-value (<10−3, blue), log2 fold-change (>|2|, green), adjusted p-value and log2 fold-change (red), or not significant (gray). (E) Expression level of ADAMTS4 in the pulmonary fibrosis dataset from Habermann et al by disease state. (F) Expression level of ADAMTS4 in the Habermann et al dataset by cell type (endothelial, epithelial, immune, mesenchymal) and disease state.
Extended Data Figure 7. Spatial transcriptomics of lung sections from mice collected 10 days after infection.
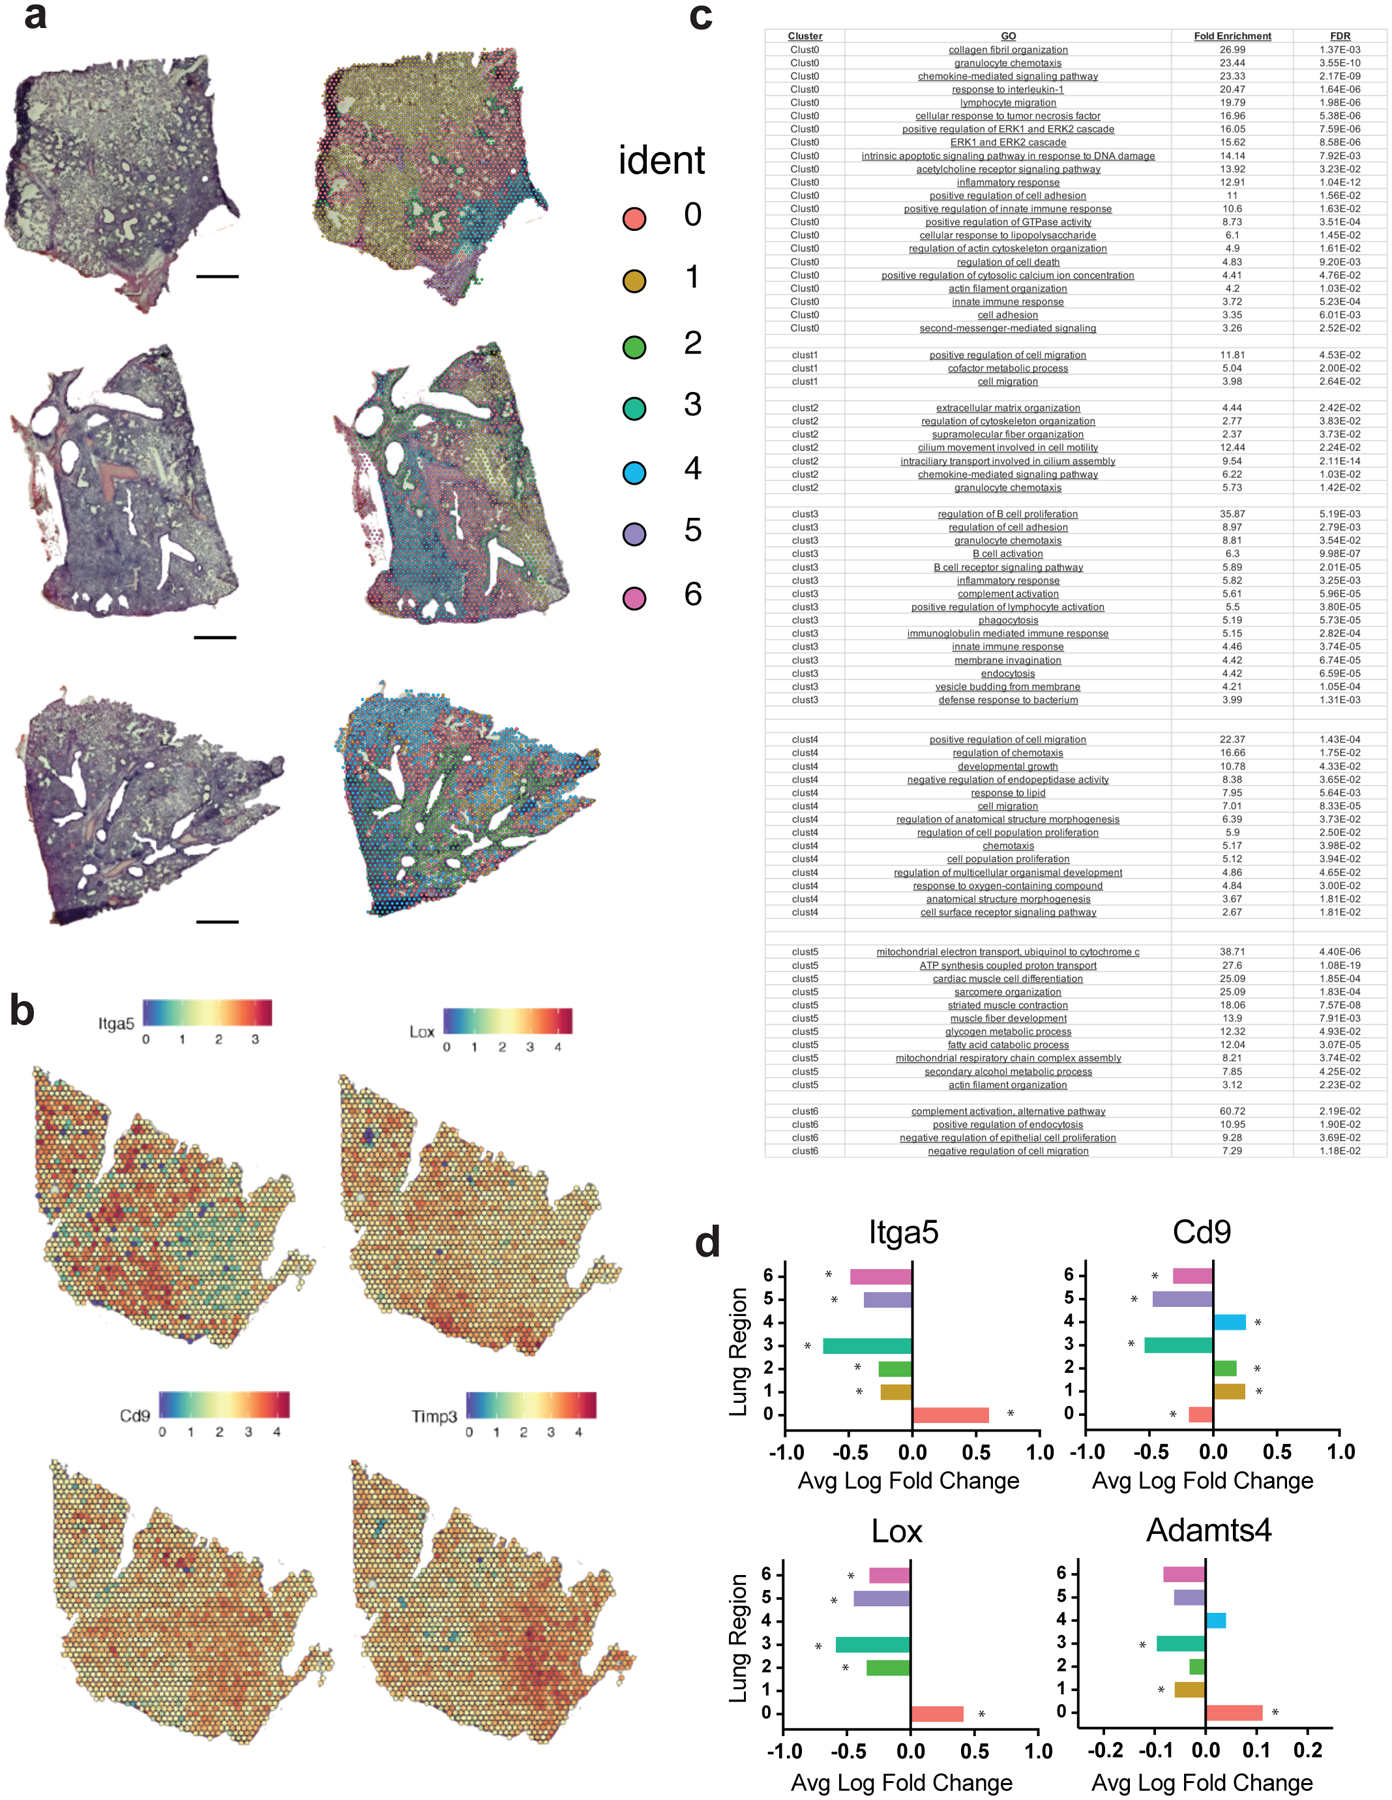
(A) H&E staining (left) and unsupervised clustering analysis (right) are presented for four lung sections from four individual mice, representing four biologically independent samples. Similar results were obtained across the four independent samples. ‘Ident’ indicates the identity of each lung region determined by unsupervised clustering of transcriptional profiles. (B) Relative gene expression of key fibroblast-associated genes (Itga5, Lox, Cd9, Timp3) in a representative lung section. (C) Summary of Gene Ontology (GO) analysis of lung regions (clusters) determined by unsupervised clustering. The chart indicates the lung region (‘Cluster’), the GO pathway (‘GO’), fold enrichment of the indicated pathway in the indicated region (‘Fold Enrichment’), and the p-value using false-discovery rate to assess statistical significance (‘FDR’). (D) Average log fold change in expression among all spots pertaining to lung regions (n = 4 independent lung sections from four individual mice). Enrichment determined using two-sided Wilcoxon Rank Sum Test with FDR adjustment. Asterisk (*) indicates that adjusted p-value is <0.00001 (exact p-values in Source Data).
Extended Data Figure 8. Assessment of IAV infection in ADAMTS-4+/+ and ADAMTS-4−/− mice.
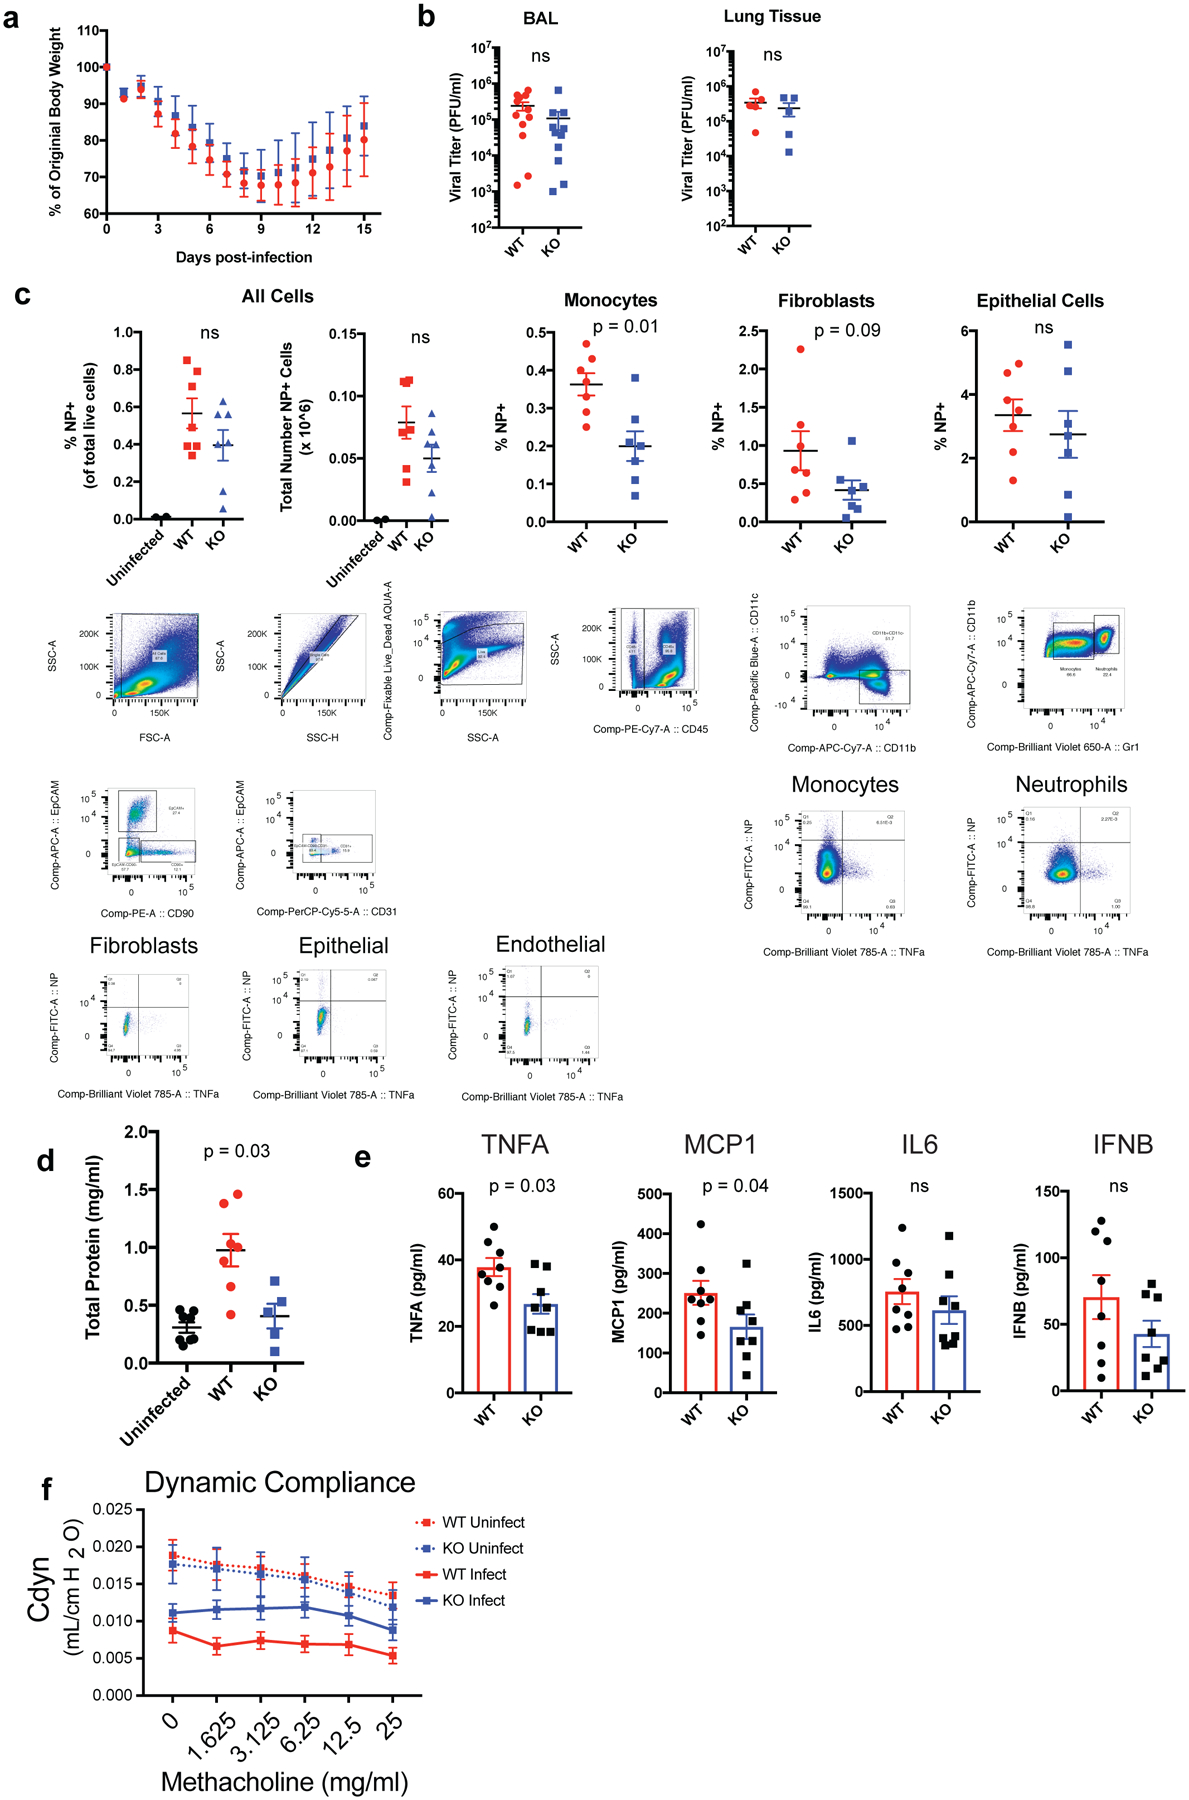
(A) Weight loss curves of ADAMTS-4+/+ and KO mice following lethal IAV challenge with 6000 EID50 PR8. Data points represent mean ± SD (WT, n = 27; KO, n = 16). Data are pooled from 5 independent experiments (B) Viral plaque titers in BAL fluid and lung tissue homogenates at 6 dpi. Each data point represents a biologically independent animal (BAL: WT, n = 12; KO, n = 11; Lung tissue: WT, n = 5; KO, n = 5). Groups were compared using a two-sided Mann-Whitney U test. Error bars represent standard error of the mean (SEM) (C) Cell-type specific infection based on IAV nucleoprotein (NP) positivity as assessed by flow cytometry and gating strategy for identifying populations for cell-type specific infection. Populations were identified using the following markers: Epithelial (CD45-Epcam+), Endothelial (CD45-CD31+), Fibroblasts (CD45-Epcam-CD90+), Monocytes (CD45+CD11c-CD11b+Gr-1lo), Neutrophils (CD45+CD11c-CD11b+Gr-1hi). Each data point represents a biologically independent animal (uninfected, n = 2; WT, n = 7; KO, n = 7). Groups were compared using a two-sided Mann-Whitney U test. Error bars represent SEM. (D) Total protein concentration in BAL fluid as measured by BCA assay at 6 dpi. Each data point represents a biologically independent animal (uninfected, n = 8; WT, n = 7; KO, n = 5). Groups were compared using a two-sided Mann-Whitney U test. Error bars represent SEM. (E) Cytokine concentrations in BAL fluid at 6 dpi as measured by multiplexed cytokine bead arrays (WT, n = 8; ADAMTS-4−/−, n = 8). (F) Measurement of dynamic lung compliance at 10 days after infection following sublethal challenge with IAV (Uninfected: WT, n = 8; KO = 3, Infected: WT n = 8, KO, n = 9). Error bars represent SEM. For statistical analysis, groups were compared using a two-sided Mann-Whitney U test.
Extended Data Figure 9. Versican accumulates in the lung during severe IAV infection in mice and affects localization and responses of T cells.
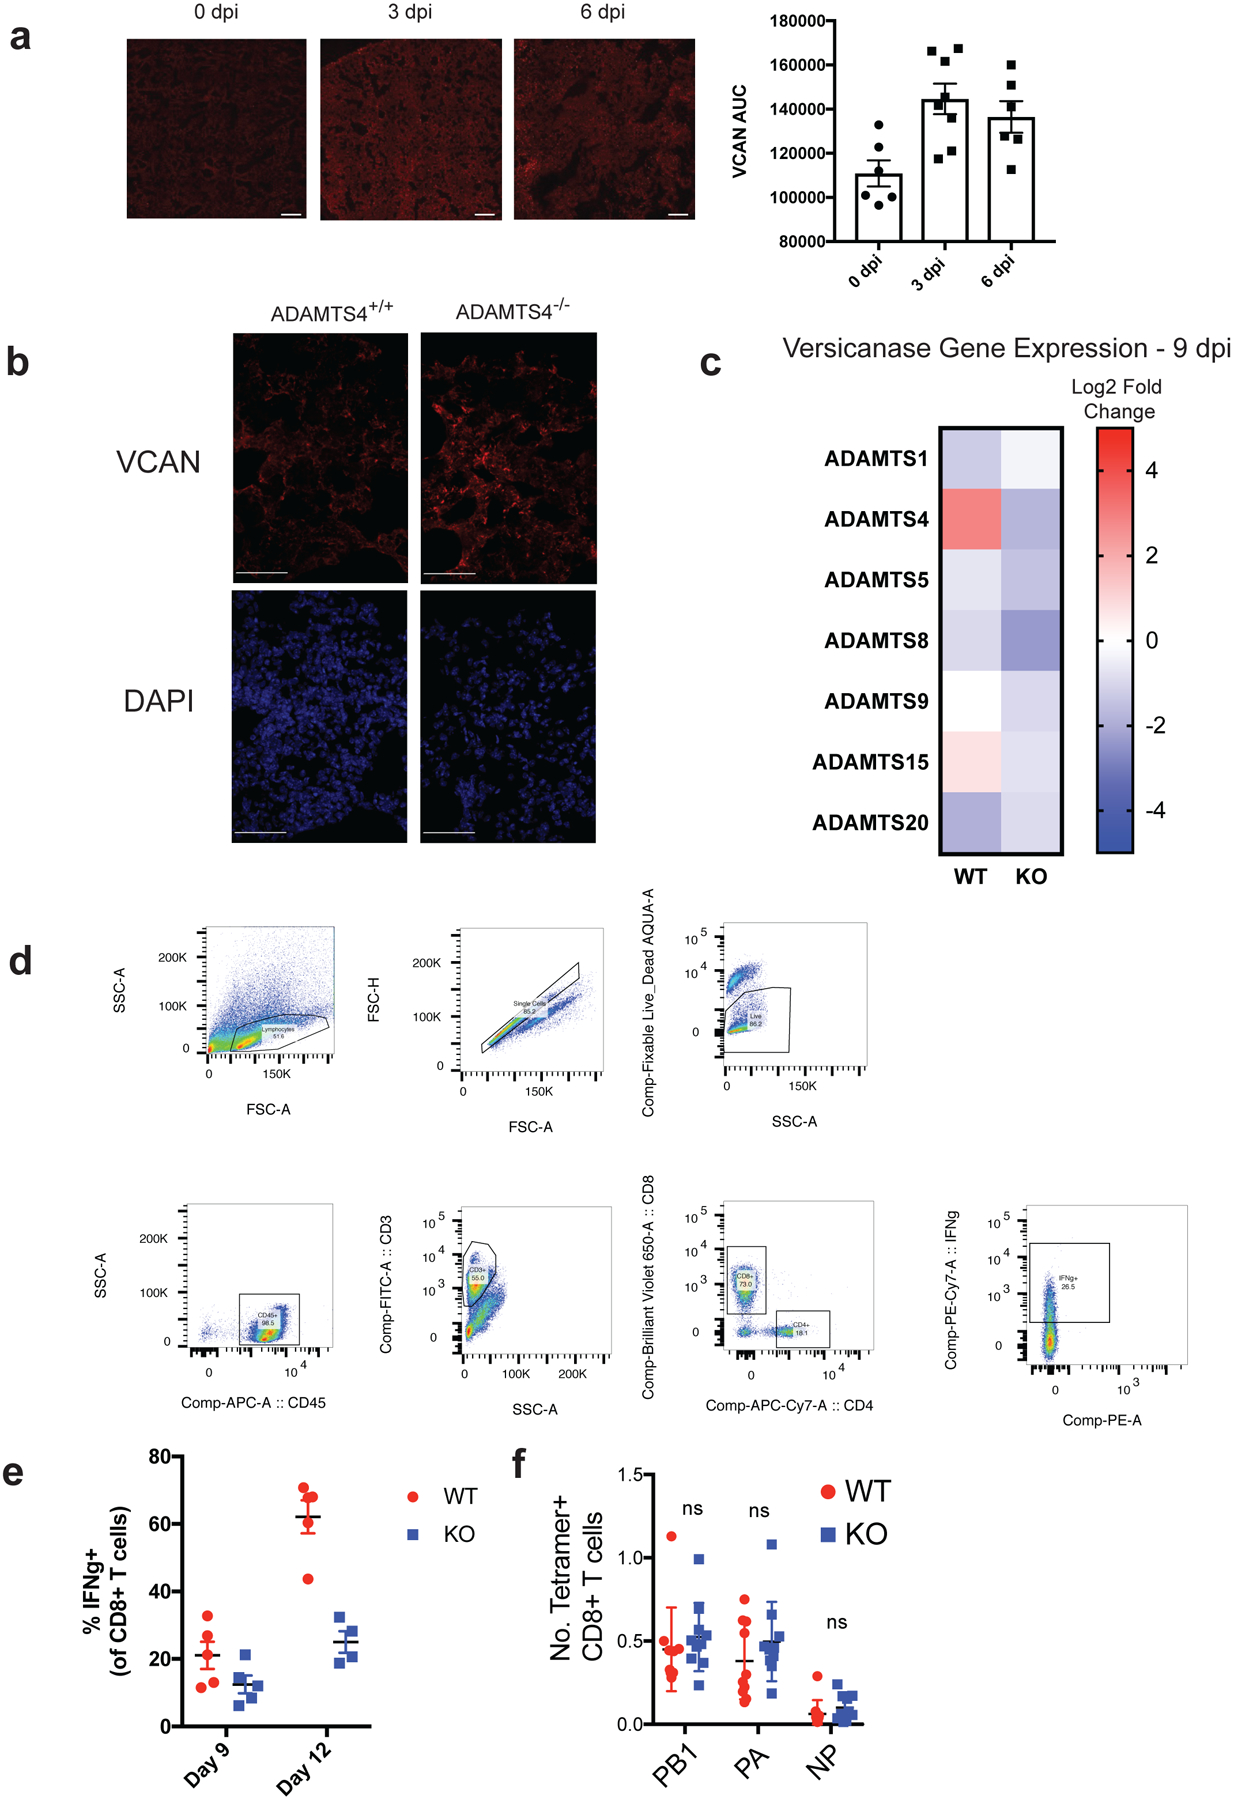
(A) Representative fluorescence microscopy images of VCAN staining at 0, 3, and 6 days after infection from two independent experiments. Scale bar = 200 μm. Quantification of VCAN staining is presented at the right. Area-under-curve was determined from the average of five intensity profiles of fluorescence per image. Each data point represents average of intensity profiles for each individual animal (0dpi, n = 6, 3dpi, n = 8; 6 dpi, n = 6). Error bars represent SEM. (B) Representative images of intact VCAN staining in lung sections from ADAMTS-4+/+ and ADAMTS-4−/− collect 9 days after infection from two independent experiments. Note that images are also presented in Figure 3H with CD3 staining. Scale bar = 50 μm. (C) Heatmap representing log2 fold change values in gene expression for each genotype relative to mock-infected controls. Whole lungs were collected 9 days after infection. (D) Gating strategy for identifying CD8+ T cells in lungs of IAV-infected mice. CD8+ T cells were identified as CD45+CD3+CD8+. (E) Frequency of IFNg+ in ADAMTS-4 WT and KO mice at 9 and 12 days after infection. Each data point represents a biologically independent animal (9dpi: WT, n = 5; KO, n = 5; 12dpi: WT, n = 5; KO, n = 4). (F) Total cell number of tetramer+ CD8+ T cells in the lung at 9 days after infection (WT, n =10; KO, n = 10). Error bars represent standard error of the mean.
Extended Data Figure 10.
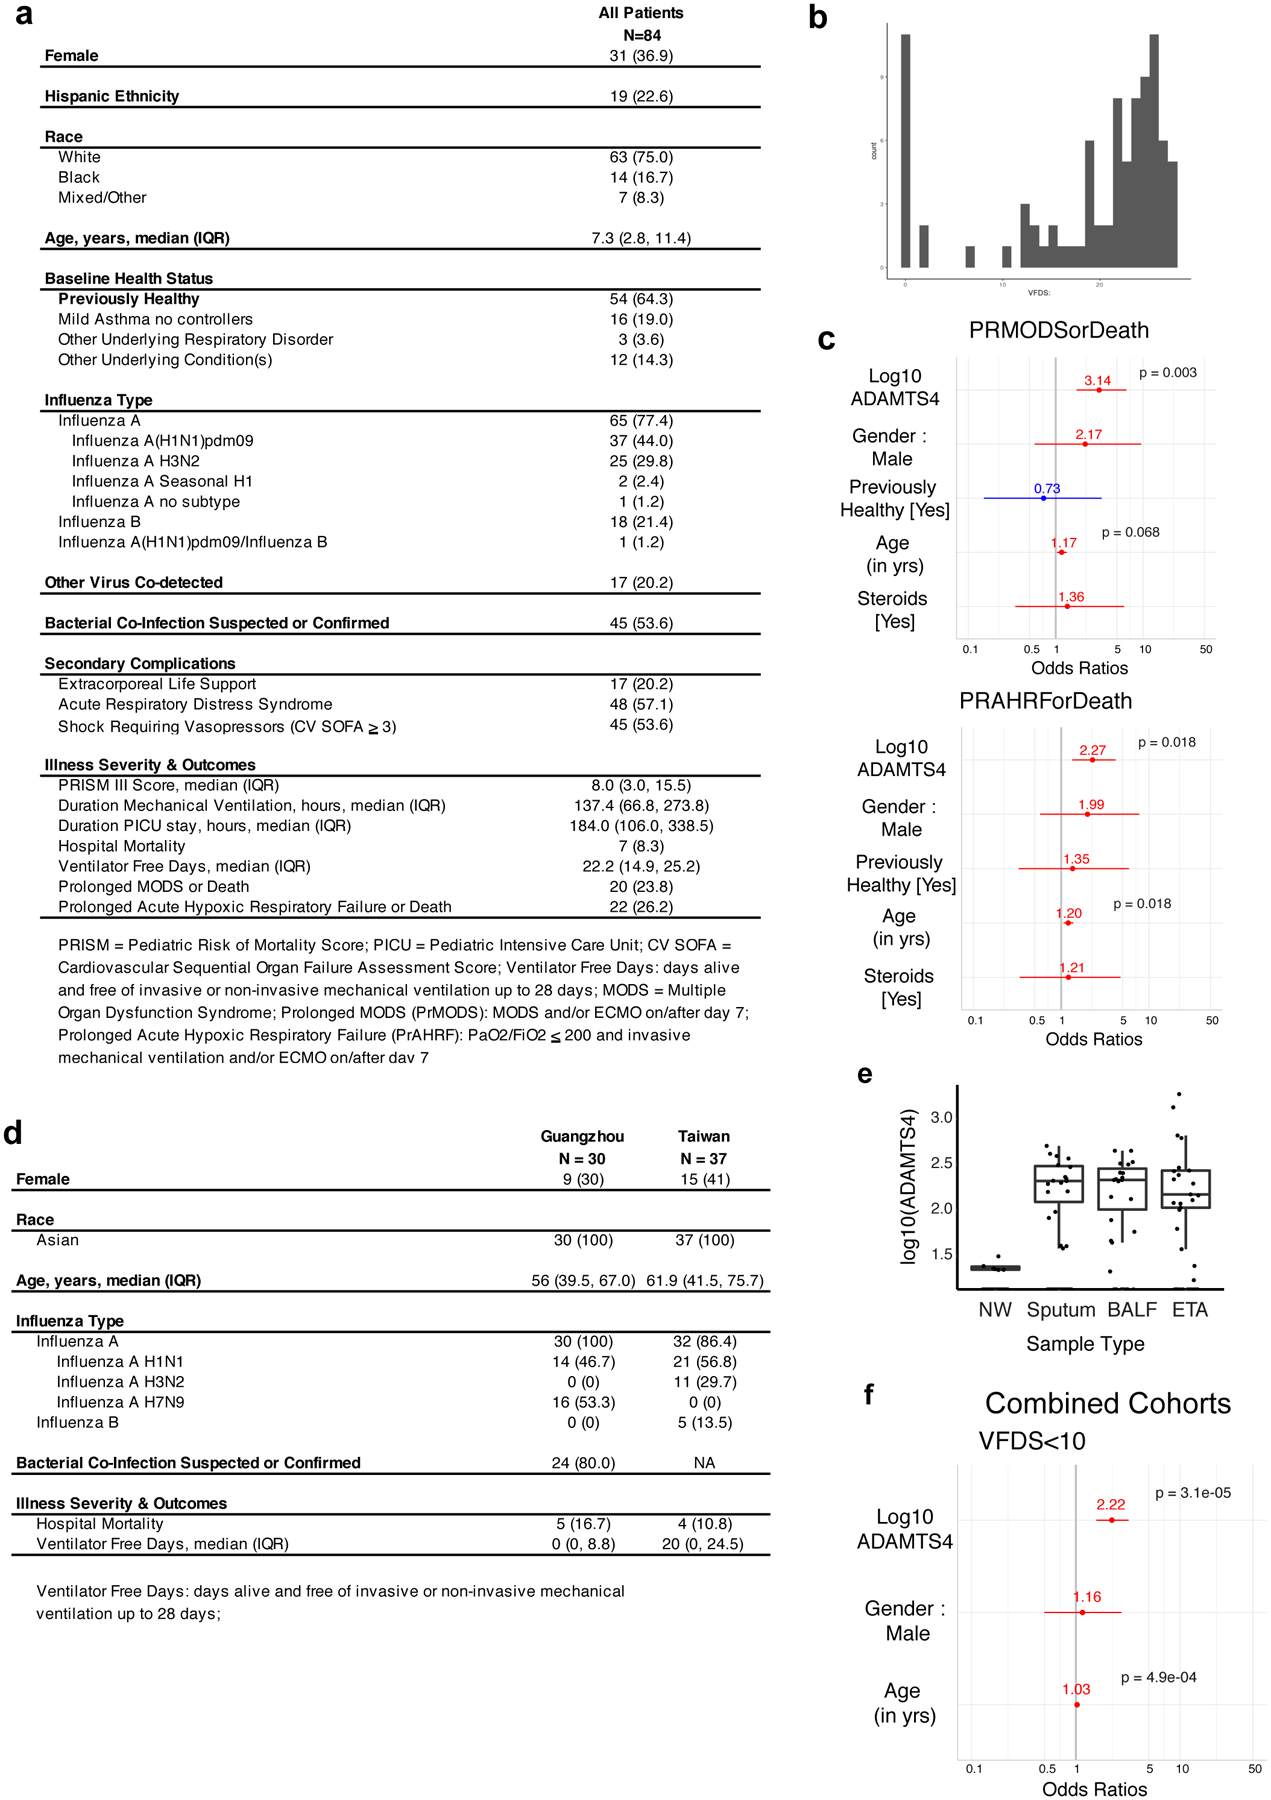
(A) Demographic information for the Pediatric Intensive Care Influenza (PICFLU) cohort. (B) Histogram of VFDS for the PICFlu cohort. (C) Odds ratios for PRMODS and PRAHRF, as well as gender, previously healthy, age, and steroids as covariates. (D) Demographic information for influenza infection cohorts in Taiwan and Guangzhou. (E) Compartmentalization of ADAMTS-4 in samples from upper (nasal wash) and lower (sputum, BALF, ETA) respiratory tracts (NW, n = 131; sputum, n = 48; BALF, n = 25; ETA, n =34). Box plots were generated for samples in which ADAMTS-4 protein was detectable. Center line indicates median, bottom and top of boxes indicate first and third quartiles, and whiskers extend to 1.5 times the interquartile range. (F) Odds ratios for VFDS<10, including gender and age as covariates, in combined analysis of three human cohorts. Odds ratios (C,F) determined using logistic regression with FDR adjustments for multiple testing.
Supplementary Material
Acknowledgments
We thank the participants in each of the cohorts included in this study. We also thank Hongxia Zhou, Lee-Ann Van De Velde, Aisha Souquette, Greig Lennon, and Dahui You for technical assistance in conducting experiments; Tim Flerlage for critical reading of the manuscript; the St. Jude Animal Resource Center for the care of the animals used in this study. We acknowledge the use of tissues procured by the National Disease Research Interchange (NDRI) with support from NIH grant U42OD11158. Schematics in figures were made using an academic license of Biorender software.
The authors gratefully acknowledge the collaboration and support of PALISI PICFLU Study Site Investigators who assisted with study design, enrolled patients and made other major contributions to the PICFLU Study, specified as follows: Michele Kong, MD (Children’s of Alabama, Birmingham, AL); Ronald C. Sanders, Jr. MD, MS, Olivia K. Irby, MD (Arkansas Children’s Hospital, Little Rock, AR); Katri Typpo, MD (Diamond Children’s Medical Center, Tucson, AZ); Barry Markovitz, MD (Children’s Hospital Los Angeles, Los Angeles, CA); Natalie Cvijanovich, MD, Heidi Flori, MD (UCSF Benioff Children’s Hospital Oakland, Oakland, CA); Adam Schwarz, MD, Nick Anas, MD (Children’s Hospital of Orange County, Orange, CA); Peter Mourani, MD, Angela Czaja, MD (Children’s Hospital Colorado, Aurora, CO); Gwenn McLaughlin, MD (Holtz Children’s Hospital, Miami, FL); Matthew Paden, MD, Keiko Tarquinio, MD (Children’s Healthcare of Atlanta at Egleston, Atlanta, GA); Bria M. Coates, MD (Ann & Robert H. Lurie Children’s Hospital of Chicago, Chicago, IL); Neethi Pinto, MD, Juliane Bubeck Wardenburg,MD, PhD, (The University of Chicago Medicine Comer Children’s Hospital, Chicago, IL); Adrienne G. Randolph, MD, MSc, Anna A. Agan, MPH, Tanya Novak, PhD, Margaret M. Newhams, MPH (Boston Children’s Hospital, Boston, MA); Stephen C. Kurachek, MD (Children’s Hospital and Clinics of Minnesota, Minneapolis, MN); Mary E. Hartman, MD, Allan Doctor, MD (St. Louis Children’s Hospital, St. Louis, MO); Edward J. Truemper, MD, Sidharth Mahapatra, MD, PhD (Children’s Hospital of Nebraska, Omaha, NE); Kate G. Ackerman, MD, L. Eugene Daugherty, MD (Golisano Children’s Hospital, Rochester, NY); Mark W. Hall, MD (Nationwide Children’s Hospital, Columbus, OH); Neal Thomas, MD (Penn State Hershey’s Children’s Hospital, Hershey, PA); Scott L. Weiss, MD, Julie Fitzgerald, MD, PhD (The Children’s Hospital of Philadelphia, Philadelphia, PA); Renee Higgerson, MD (Dell Children’s Medical Center of Central Texas, Austin, TX); Laura L. Loftis, MD (Texas Children’s Hospital, Houston, TX); Rainer G. Gedeit, MD (Children’s Hospital of Wisconsin, Milwaukee, WI); Marc-André Dugas, MD (Centre Hospitalier de l’Université Laval, Quebec, Quebec, Canada).
This work was funded by the National Institute of Allergy and Infectious Diseases under HHS contract HHSN27220140006C-OPT18I for the St. Jude Center of Excellence for Influenza Research and Surveillance (P.G.T), JHCEIRS contract HHSN272201400007C, the National Institutes of Health R01AI084011 and R21HD095228 (A.G.R), the National Institutes of Health and the National Natural Science Foundation of China under NIH-NSFC joint project 5R01AI128805-02, the National Natural Science Foundation of China under 81761128014, and ALSAC. The content is solely the responsibility of the authors and does not necessarily represent the official views of the National Institutes of Health.
Footnotes
Competing Interests
PT is a consultant for Cytoagents Inc. A patent has been filed on work related to but not directly based on the findings in this manuscript. The authors declare no other competing interests.
Data Availability
Cohort cytokine and ADAMTS4 data can be found in Supplemental Tables 3 and 4. Single-cell gene expression data and spatial gene expression data are available on the NCBI Short Read Archive under BioProjects PRJNA612345 and PRJNA613670. Hallmark gene sets from the Molecular Signatures Database were used for gene set enrichment analysis (https://www.gsea-msigdb.org/gsea/msigdb/index.jsp). The following publicly available datasets were used for meta-analysis: 20180822_PolypAll_cleaned_rawdata.txt.zip (http://shaleklab.com/wp-content/uploads/2018/08/20180822_PolypAll_cleaned_rawdata.txt.zip) and 20180822_PolypAll_cleaned_metadata.txt (http://shaleklab.com/wp-content/uploads/2018/06/20180822_PolypAll_cleaned_metadata.txt); celseq_matrix_ru1_molecules.tsv.725583.gz and celseq_meta_unfiltered.tsv.725587.gz (https://browser.immport.org/browser?path=SDY998%2FResultFiles%2FRNA_sequencing_resu lt); GSE145926_RAW.tar (https://www.ncbi.nlm.nih.gov/geo/query/acc.cgi?acc=GSE145926), GSE135893_barcodes.tsv.gz, GSE135893_genes.tsv.gz, and GSE135893_IPF_metadata.csv.gz (https://www.ncbi.nlm.nih.gov/geo/query/acc.cgi?acc=GSE135893); GSE130148_raw_counts.csv.gz and GSE130148_barcodes_cell_types.txt.gz (https://www.ncbi.nlm.nih.gov/geo/query/acc.cgi?acc=GSE130148); GSE122960_RAW.tar (https://www.ncbi.nlm.nih.gov/geo/query/acc.cgi?acc=GSE122960); GSE128169_RAW.tar (https://www.ncbi.nlm.nih.gov/geo/query/acc.cgi?acc=GSE128169); GSE132771_RAW.tar (https://www.ncbi.nlm.nih.gov/geo/query/acc.cgi?acc=GSE132771).
Code Availability
All analyses were conducted using publicly available software as detailed in the methods. All code is available upon request.
References
- 1.Matthay MA et al. Acute respiratory distress syndrome. Nat Rev Dis Primers 5, 18 (2019). [DOI] [PMC free article] [PubMed] [Google Scholar]
- 2.Soares MP, Teixeira L & Moita LF Disease tolerance and immunity in host protection against infection. Nat. Rev. Immunol 17, 83–96 (2017). [DOI] [PubMed] [Google Scholar]
- 3.Forum of International Respiratory Societies. The Global Impact of Respiratory Disease - Second Edition European Respiratory Society Second Edition, (2017). [Google Scholar]
- 4.Duan S & Thomas PG Balancing Immune Protection and Immune Pathology by CD8(+) T-Cell Responses to Influenza Infection. Front. Immunol 7, 25 (2016). [DOI] [PMC free article] [PubMed] [Google Scholar]
- 5.Bonnans C, Chou J & Werb Z Remodelling the extracellular matrix in development and disease. Nat. Rev. Mol. Cell Biol 15, 786–801 (2014). [DOI] [PMC free article] [PubMed] [Google Scholar]
- 6.Hynes RO & Naba A Overview of the Matrisome--An Inventory of Extracellular Matrix Constituents and Functions. Cold Spring Harb. Perspect. Biol 4, a004903–a004903 (2012). [DOI] [PMC free article] [PubMed] [Google Scholar]
- 7.Sorokin L The impact of the extracellular matrix on inflammation. Nat. Rev. Immunol 10, 712–723 (October/2010). [DOI] [PubMed] [Google Scholar]
- 8.Iwasaki A & Pillai PS Innate immunity to influenza virus infection. Nat. Rev. Immunol 14, 315–328 (2014). [DOI] [PMC free article] [PubMed] [Google Scholar]
- 9.El Agha E et al. Two-Way Conversion between Lipogenic and Myogenic Fibroblastic Phenotypes Marks the Progression and Resolution of Lung Fibrosis. Cell Stem Cell 20, 261–273.e3 (2017). [DOI] [PMC free article] [PubMed] [Google Scholar]
- 10.Oshansky CM et al. Mucosal immune responses predict clinical outcomes during influenza infection independently of age and viral load. Am. J. Respir. Crit. Care Med 189, 449–462 (2014). [DOI] [PMC free article] [PubMed] [Google Scholar]
- 11.Kelwick R, Desanlis I, Wheeler GN & Edwards DR The ADAMTS (A Disintegrin and Metalloproteinase with Thrombospondin motifs) family. Genome Biol. 16, (December/2015). [DOI] [PMC free article] [PubMed] [Google Scholar]
- 12.Habermann AC et al. Single-cell RNA sequencing reveals profibrotic roles of distinct epithelial and mesenchymal lineages in pulmonary fibrosis. Science Advances 6, eaba1972 (2020). [DOI] [PMC free article] [PubMed] [Google Scholar]
- 13.Tsukui T et al. Collagen-producing lung cell atlas identifies multiple subsets with distinct localization and relevance to fibrosis. Nat. Commun 11, 1920 (2020). [DOI] [PMC free article] [PubMed] [Google Scholar]
- 14.Reyfman PA et al. Single-Cell Transcriptomic Analysis of Human Lung Provides Insights into the Pathobiology of Pulmonary Fibrosis. Am. J. Respir. Crit. Care Med 199, 1517–1536 (2019). [DOI] [PMC free article] [PubMed] [Google Scholar]
- 15.Valenzi E et al. Single-cell analysis reveals fibroblast heterogeneity and myofibroblasts in systemic sclerosis-associated interstitial lung disease. Ann. Rheum. Dis 78, 1379–1387 (2019). [DOI] [PMC free article] [PubMed] [Google Scholar]
- 16.Ordovas-Montanes J et al. Allergic inflammatory memory in human respiratory epithelial progenitor cells. Nature 560, 649–654 (2018). [DOI] [PMC free article] [PubMed] [Google Scholar]
- 17.Vieira Braga FA et al. A cellular census of human lungs identifies novel cell states in health and in asthma. Nat. Med 25, 1153–1163 (2019). [DOI] [PubMed] [Google Scholar]
- 18.Liao M et al. Single-cell landscape of bronchoalveolar immune cells in patients with COVID-19. Nat. Med (2020) doi: 10.1038/s41591-020-0901-9. [DOI] [PubMed] [Google Scholar]
- 19.Zhang F et al. Defining inflammatory cell states in rheumatoid arthritis joint synovial tissues by integrating single-cell transcriptomics and mass cytometry. Nat. Immunol 20, 928–942 (2019). [DOI] [PMC free article] [PubMed] [Google Scholar]
- 20.Wight TN Provisional matrix: A role for versican and hyaluronan. Matrix Biol. 60–61, 38–56 (2017). [DOI] [PMC free article] [PubMed] [Google Scholar]
- 21.La Gruta NL, Kedzierska K, Stambas J & Doherty PC A question of self-preservation: immunopathology in influenza virus infection. Immunol. Cell Biol 85, 85–92 (2007). [DOI] [PubMed] [Google Scholar]
- 22.Fiore-Gartland A et al. Cytokine Profiles of Severe Influenza Virus-Related Complications in Children. Front. Immunol 8, 1423 (2017). [DOI] [PMC free article] [PubMed] [Google Scholar]
- 23.Wynn TA Integrating mechanisms of pulmonary fibrosis. J. Exp. Med 208, 1339–1350 (2011). [DOI] [PMC free article] [PubMed] [Google Scholar]
- 24.McMahon M et al. ADAMTS5 Is a Critical Regulator of Virus-Specific T Cell Immunity. PLoS Biol 14, e1002580 (2016). [DOI] [PMC free article] [PubMed] [Google Scholar]
- 25.Bradley LM, Douglass MF, Chatterjee D, Akira S & Baaten BJ G. Matrix metalloprotease 9 mediates neutrophil migration into the airways in response to influenza virus-induced toll-like receptor signaling. PLoS Pathog. 8, e1002641 (2012). [DOI] [PMC free article] [PubMed] [Google Scholar]
- 26.Rojas-Quintero J et al. Matrix metalloproteinase-9 deficiency protects mice from severe influenza A viral infection. JCI Insight 3, 21 (2018). [DOI] [PMC free article] [PubMed] [Google Scholar]
- 27.Talmi-Frank D et al. Extracellular Matrix Proteolysis by MT1-MMP Contributes to Influenza-Related Tissue Damage and Mortality. Cell Host Microbe 20, 458–470 (October/2016). [DOI] [PubMed] [Google Scholar]
- 28.Chang MY et al. Versican is produced by Trif- and type I interferon-dependent signaling in macrophages and contributes to fine control of innate immunity in lungs. Am. J. Physiol. Lung Cell. Mol. Physiol 313, L1069–L1086 (2017). [DOI] [PMC free article] [PubMed] [Google Scholar]
- 29.Evanko SP, Potter-Perigo S, Bollyky PL, Nepom GT & Wight TN Hyaluronan and versican in the control of human T-lymphocyte adhesion and migration. Matrix Biol. 31, 90–100 (2012). [DOI] [PMC free article] [PubMed] [Google Scholar]
- 30.Hope C et al. Immunoregulatory roles of versican proteolysis in the myeloma microenvironment. Blood blood–2016 (2016). [DOI] [PMC free article] [PubMed] [Google Scholar]
- 31.Sanders CJ, Johnson B, Frevert CW & Thomas PG Intranasal Influenza Infection of Mice and Methods to Evaluate Progression and Outcome in Mouse Models of Innate Immunity: Methods and Protocols (ed. Allen IC) 177–188 (Humana Press, 2013). [DOI] [PubMed] [Google Scholar]
- 32.Stuart T et al. Comprehensive Integration of Single-Cell Data. Cell (2019) doi: 10.1016/j.cell.2019.05.031. [DOI] [PMC free article] [PubMed] [Google Scholar]
- 33.Tirosh I et al. Dissecting the multicellular ecosystem of metastatic melanoma by single-cell RNA-seq. Science 352, 189–196 (2016). [DOI] [PMC free article] [PubMed] [Google Scholar]
- 34.Finak G et al. MAST: a flexible statistical framework for assessing transcriptional changes and characterizing heterogeneity in single-cell RNA sequencing data. Genome Biol. 16, 278 (2015). [DOI] [PMC free article] [PubMed] [Google Scholar]
- 35.Subramanian A et al. Gene set enrichment analysis: a knowledge-based approach for interpreting genome-wide expression profiles. Proceedings of the National Academy of Sciences 102, 15545–15550 (2005). [DOI] [PMC free article] [PubMed] [Google Scholar]
- 36.Hall MW et al. Innate immune function and mortality in critically ill children with influenza: a multicenter study. Crit. Care Med 41, 224–236 (2013). [DOI] [PMC free article] [PubMed] [Google Scholar]
- 37.Revelle W Procedures for Psychological, Psychometric, and Personality Research [R package psych]. (Comprehensive R Archive Network (CRAN), 2019). [Google Scholar]
- 38.Wei T & Simko V R package ‘corrplot’: Visualization of a Correlation Matrix. (Github, 2017). [Google Scholar]
- 39.Schoenfeld DA, Bernard GR & ARDS Network. Statistical evaluation of ventilator-free days as an efficacy measure in clinical trials of treatments for acute respiratory distress syndrome. Crit. Care Med 30, 1772–1777 (2002). [DOI] [PubMed] [Google Scholar]
- 40.Lüdecke D. Data Visualization for Statistics in Social Science [R package sjPlot version 2.8.3]
Associated Data
This section collects any data citations, data availability statements, or supplementary materials included in this article.


