

Abstract
Aim:
The aim of this study is to evaluate the surface roughness and color stability of a nanohybrid composite resin after exposure to tea, coffee, Coca-cola, and artificial saliva on the 7th, 14th, and 28th day.
Materials and Methods:
Forty specimens of nanohybrid composite resin discs of dimension 6 mm × 2 mm were fabricated and were randomly divided into four equal groups based on beverages (Group 1: control group – artificial saliva, Group 2: Tea, Group 3: Coffee, and Group 4 : Coca-cola). Baseline readings of surface roughness (Ra) and color change (ΔE) were obtained by profilometer and digital image analysis technique in CIE l*a*b scale followed by the readings (ΔE) taken on the 7th, 14th, and 28th day of exposure to respective beverages.
Statistical Analyses:
One-way analysis of variance (ANOVA) followed by post hoc Tukey's test and paired t-test along with Pearson's correlation with a P = 0.05.
Results:
Overall, highest surface roughness was obtained in the samples exposed to Coca-cola followed by coffee and tea while the least surface roughness was obtained in the samples exposed to artificial saliva (control group) which was statistically significant (P < 0.05). Overall highest color change was obtained in tea followed by coffee and Coca-cola. The least color change was observed in the samples exposed to artificial saliva (control group) (P < 0.05).
Conclusion:
Surface roughness and color change were time dependent as both increased with time. Furthermore, greater the surface roughness, more was the color change observed in all the groups at all tested time intervals.
Keywords: Color stability, nanohybrid composite, surface roughness
INTRODUCTION
Smile is one of the most important features of a person's face that can often determine his/her social and psychological well-being. Esthetics being the current need of the era, often motivates patients to seek dental treatment. Composite resin restorations constitute a significant portion of dentist's routine practice due to the patient's increasing demand for an esthetic appearance. They have gained considerable popularity in mainstream operative dentistry as a direct restorative material for both anterior and posterior teeth.
The continuous changes and evolution in the field of esthetic restorative materials have led to the development of various new generation composite resins that exhibit increased strength, better handling, and improved polishability for better optical properties.
Modern nanocomposites with particle size between 0.1 μm and 100 nm fulfil the esthetic requirements of the anterior esthetic zone of the mouth with superior gloss and polish retention.
Over the past two decades, considerable research is going on to improve the clinical performance of the material where the surface roughness and color stability parameter are being assessed under the modified United States Public Health Service criteria.[1]
Surface smoothness of a restoration is associated with its inherent characteristics, such as the type of organic matrix, size, composition, and distribution of filler particles, also the material's exposure to low pH food, drinks, and mouth rinse solutions. Rough surface of direct composite resins increases plaque retention resulting in gingival inflammation, superficial discoloration, and secondary caries.[2]
Composite resins are susceptible to discoloration which may be due to intrinsic or extrinsic factors. Internally induced discolorations are permanent and are related to polymer quality, filler type, and amount, as well as the synergist added to the photoinitiator system. The resin's affinity for extrinsic stains is modulated by its conversion rate and physicochemical characteristics, with the water sorption rate being of particular importance. In the oral cavity, because of superficial degradation or a slight penetration and adsorption of staining agents at the superficial layer of the composite resins, discoloration of the surface or subsurface of the resin restorations can result.[3]
There is a lot of existing literature over the effects of various sealants, bleaching agents, polishing agents, and juices on surface roughness and color stability of nanohybrid composites but not tea, coffee, and Coke, which are very commonly, consumed beverages. According to Tea Board, India, around 80% of the total tea produced in India is consumed by the domestic population.[4] Seventy-three percent of the population in India consumes coffee as per the consensus by Coffee Board, India.[5] Furthermore, there is higher consumption of aerated beverages such as Coca-cola among the younger generation with India being the world's third largest consumer. These may predispose to color change due to the coloring agent present in them as well as surface degradation of composite resin due to their mild acidic nature.[6]
Thus, the present study aims to evaluate and compare the surface roughness and color stability of a nanohybrid composite resin after exposure to tea, coffee, Coca-cola, and artificial saliva on the 7th, 14th, and 28th day.
MATERIALS AND METHODS
The materials used in the study are enlisted in Table 1:
Table 1.
List of all the materials used
| Materials | Manufacturer and batch/lot number |
|---|---|
| Nanohybrid composite resin (Beautifil II) – A2 shade (BISGMA, TEGDMA, aluminofluoro-borosilicate glass, aluminum oxide and camphoroquinone. The average filler particle size is 0.8 mm with a range of particle sizes from 0.01 to 4.0 mm. The filler content is 83% by weight and 69% by volume) | Shofu, USA Lot number: 041823 |
| Tea- Brooke Bond Red Label | Hindustan Unilever Ltd., Mumbai, India Batch number: STP 011019 |
| Coffee – Nescafe Classic | Nescafe, India Lot number: 63430452CA |
| Coca cola - regular | The Coca-Cola, India Batch number: 090307 |
| Artificial saliva- wet mouth | ICPA Health Product Ltd. Gujarat, India Batch number: C30101 |
| Distilled water | Das Enterprise |
BISGMA: Bisphenol A glycol dimethacrylate; TEGDMA: Triethylenglycol dimethacrylate
Samples (n = 40) of nanohybrid composite resin (Beautifil II) were prepared by placing composite resin inside individual customized plastic molds of dimensions approximately (6.0 ± 0.1) mm × (2.0 ± 0.1) mm. The mold was slightly overfilled and was then covered on both sides with Mylar strip. The composite resin was sandwiched between two glass plates to extrude the excess material which was removed. All the specimens were subjected to curing by placing the nozzle tip of the light-curing unit at the center of both surfaces of the mold with a Light Emitting Diode (LED) light (Coltolux LED, Coltene) for a total of 40 s for each specimen. The samples were stored in a container in distilled water at ambient room temperature for 24 h.
The samples prepared were divided into groups as follows and subjected to experimentation. All samples were equally divided into one control and three experimental groups (n = 10 in each group).
Group 1: Artificial saliva (control group)
Group 2: Tea (prepared by adding 4 g of tea leaves to 300 ml of boiling water and then the solution was boiled for 5 min.)
Group 3: Coffee (prepared by adding 4 g of coffee powder to 300 ml of boiling water, and then, the solution was boiled for 5 min.) [7]
Group 4: Coca-cola (used according to manufacturer's instructions)
Each group was further subdivided based on the time period of exposure – 7th, 14th, and 28th day.
Baseline surface roughness values and color values were obtained for each sample using a three-dimensional (3D) optical profilometer and digital imaging technique, respectively. The experimentation was proceeded by immersing each sample in their respective beverage for 5 s and in artificial saliva for 5 s for a total time period of 5 min in the morning and 5 min in the evening at a fixed time every day and stored in artificial saliva for the remaining time period to simulate a person's beverage consumption on an average. The beverages were replenished and prepared daily by using the same quantity for standardization.
The cycle was done for 28 days. The surface roughness values (Ra) and color stability value (ΔE) were obtained on the 7th day, 14th day, and 28th day of exposure.
A profilometric read out was taken for each sample using a 3D optical profilometer (Rtec Universal) [Figure 1a and b]. Before each measurement excess of water was blotted with absorbent tissue without touching the specimen surface. Samples were placed in the middle of the plate, and stylus was kept just above the top surface of the specimen by a calibrated evaluator. It was characterized by the height parameter, Ra (μm). The stylus scanned the entire surface of the specimen, and average surface roughness (Ra) values of each sample were measured. The Ra value (μm) reading was recorded using a profilometer with 0.8 mm cutoff and 0.25 mm/s speed. Three measurements were made, and an average was calculated.
Figure 1.
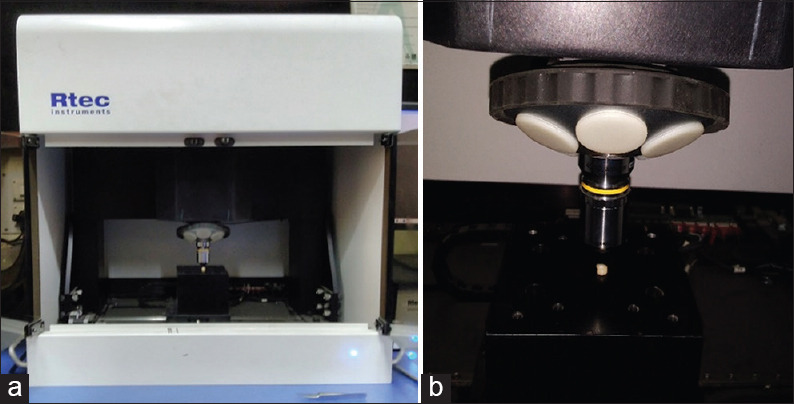
(a) Three-dimensional optical profilometer. (b) Profilometric analysis of surface roughness
The color stability of the specimens was assessed in the Commission International eI' Eclairege L*a*b* (CIELAB) color space using a digital image analysis method [Figure 2a and b]. For digital color measurement, four LED bulbs (15 watt each) were mounted perpendicular to the frontal plane of a tailor-made wooden box with bulbs being 15 cm away from the specimen, reflecting at an angle of 45°. Specimens were placed 15 cm above a wooden block covered with gray foam paper to provide a neutral background. The wooden box was covered with matte finished black paper to prevent any light interference. The front side of the box had a door which was opened to allow the placement and removal of the specimens and closed during photography. Digital images were obtained using a digital single lens reflex camera (Nikon D5300, Nikon India Pvt. Ltd.) adjusted to auto white balance with a CMOS sensor having 18.0 million effective pixels. Images were taken from the specimens in an object – lens distance of 10 cm in the macro mode using manual settings (aperture: f/11; shutter speed: 1/80 s). For each sample, three digital images were obtained. Digital images were then transferred to a personal computer, and color values were calculated using a software programme (Adobe Photoshop CS2, Adobe Systems Inc., CA, USA). Image files were opened in Adobe Photoshop software. All digital color measurements were made with the specimens in a central position within the monitor. The “histogram” window within the software was selected to obtain average color values of R, G, and B of the selected area (4 mm diameter). These R, G B values were converted to CIELAB color coordinates using Color Metric Converter software (Color Eng. Inc, USA). The reason for using this conversion software was that in the Adobe Photoshop version used it was found that L* values were given on a scale of 0–256 rather than 0–100.
Figure 2.
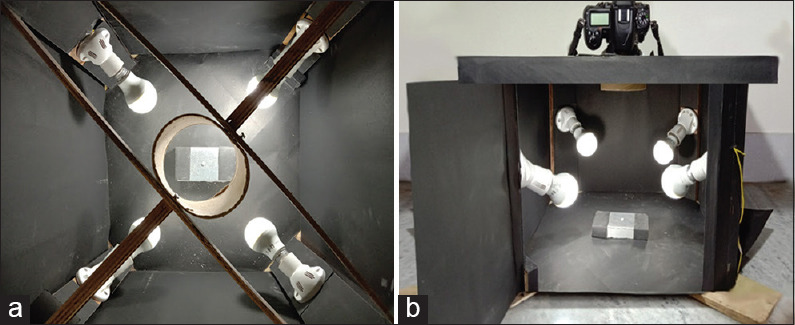
(a) Top view of the digital image analysis setup. (b) Digital image analysis setup
The data obtained for both surface roughness and color stability were then entered into a Microsoft Excel spreadsheet. The data were then subjected to statistical analysis.
RESULTS AND STATISTICAL ANALYSIS
For surface roughness (Ra), mean baseline value was 0.422 μm.
On the 7th day, Group 1 (0.422 ± 0.009) showed minimum surface roughness followed by Group 2 (1.000 ± 0.019), Group 3 (1.531 ± 0.020), whereas Group 4 (1.642 ± 0.017) showed maximum surface roughness.
On the 14th day, Group 1 (0.493 ± 0.017) showed minimum surface roughness followed by Group 2 (1.462 ± 0.004), Group 3 (1.632 ± 0.003), whereas Group 4 (2.018 ± 0.003) showed maximum surface roughness.
On the 28th day, Group 1 (0.514 ± 0.002) showed minimum surface roughness followed by Group 2 (1.890 ± 0.004), Group 3 (2.207 ± 0.0150), whereas Group 4 (2.951 ± 0.069) showed maximum surface roughness.
For assessment of color change, baseline values were obtained based on the l, a, b coordinates which were used for the calculation of the color change (ΔE) on the 7th day, 14th day, and 28th day. Baseline mean value was 62.6815, a1 was 0.8266, and b1 was 14.3745.
On the 7th day, Group 1 (0.3373 ± 0.0003) showed minimum color change followed by Group 4 (1.1305 ± 0.0004), Group 2 (1.7150 ± 0.0004), whereas Group 3 (2.7984 ± 0.0006) showed maximum color change.
On the 14th day, Group 1 (0.4185 ± 0.0043) showed minimum color change followed by Group 4 (2.7791 ± 0.0048), Group 3 (3.6030 ± 0.0044), whereas Group 2 (3.6122 ± 0.0241) showed maximum color change.
On the 28th day, Group 1 (0.4192 ± 0.0043) showed minimum color change followed by Group 4 (3.6684 ± 0.0006), Group 3 (5.5606 ± 0.0048), whereas Group 2 (6.5741 ± 0.0013) showed maximum color change.
For statistical analysis, data were tabulated in a Microsoft excel spreadsheet and then analyzed by SPSS (version 25.0; SPSS Inc., Chicago, IL, USA) and Graph Pad Prism version 5 (GraphPad Software Inc. , California, USA). Descriptive statistical analysis was performed to calculate the means with corresponding standard deviation. One-way analysis of variance (one-way ANOVA) was used to compare means of three or more groups of samples for numerical data (using the F distribution). Post hoc Tukey test was used to conclude which group out of the four is actually creating the significant difference. Paired t-test was done for a difference in mean involving the different groups. P < 0.05 was considered statistically significant. The Pearson product-moment correlation coefficient was a measure of the linear dependence between two variables: surface roughness and color change.
All groups showed statistically significant differences in their mean overall surface roughness values and color change value after subjecting the data to Post hoc Tukey test (P < 0.01). Paired t-test showed significant changes in surface roughness values and color change values for all tested time intervals (P < 0.05) for Groups 2, 3, and 4 but was statistically insignificant for Group 1. A statistically significant positive correlation between surface roughness and color change was observed by Pearson's correlation test.
DISCUSSION
Composite resins have revolutionized the concept of esthetic dentistry. It is a heterogeneous material that is composed of three major components resin matrix, filler particles, and silane-coupling agent. The structures of resin matrix, coupling agent, and the characteristics of filler particles size and shape have a direct impact on the surface smoothness of resin composites. Composite restoration can be imperceptible when its surface closely resembles the surrounding enamel surface.[8]
In this study, Beautifil II (Shofu) nanohybrid composite resin has been used. Beautifil II is a relatively new fluoride-releasing, light-cured, nano-hybrid composite indicated for Class I-V restorations, wedge-shaped defects and root caries, direct laminate veneer, core build-up, and repair of restorations. It has the GIOMER technology that combines the characteristics of both composite and glass ionomer. Beautifil II is resin-based, containing filler particles that are derived from surface prereacted glass ionomer technology.
The surface quality or texture of a restoration is an important factor determining their clinical success in the oral environment. The surface roughness value is denoted by Ra which is defined as the arithmetic average height of roughness component irregularities from the mean line measured within the sampling length.[9]
Surface profilometers have been used for years to measure surface roughness in laboratory investigations. There are two types of profilometers available which are contact profilometer and non-contact profilometer. The contact profilometer can be further classified as manual or digital. The contact profilometer has a stylus with a diamond tip that is run over the surface of a material which might cause damage to the sample surface. The universal 3D profilometer is a noncontact profilometer that has been used in the study. It is able to run multiple techniques on the same tester. It combines four imaging modes that include white light interferometer, spinning disk confocal microscopy, dark-field microscopy, and bright field microscopy. The combination of these techniques depending on its application on one platform helps in comprehensive data analysis and also reduces maintenance cost.[10,11,12]
Amongst the four groups tested, surface roughness (Ra) value was maximum in the samples exposed to Coca-cola followed by coffee and tea. The least surface roughness value was observed in the control group (artificial saliva) Graph 1, Table 2.
Graph 1.
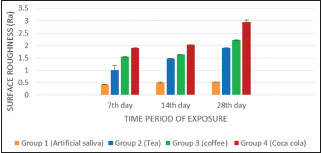
Distribution of mean surface roughness of nanohybrid composite resin
Table 2.
One-way analysis of variance of surface roughness of all groups based on beverages and time
| Sum of squares | df | Mean square | F | P | |
|---|---|---|---|---|---|
| Group 1 (control) | |||||
| Between groups (combined) | 0.064 | 3 | 0.021 | 162.962 | 0.01 |
| Within groups | 0.005 | 36 | 0 | ||
| Total | 0.069 | 39 | |||
| Group 2 | |||||
| Between groups (combined) | 11.738 | 3 | 3.913 | 34,033.78 | 0.01 |
| Within groups | 0.004 | 36 | 0 | ||
| Total | 11.742 | 39 | |||
| Group 3 | |||||
| Between groups (combined) | 16.59 | 3 | 5.53 | 27,534.32 | 0.01 |
| Within groups | 0.007 | 36 | 0 | ||
| Total | 16.597 | 39 | |||
| Group 4 | |||||
| Between groups (combined) | 32.628 | 3 | 10.876 | 8523.714 | 0.01 |
| Within groups | 0.046 | 36 | 0.001 | ||
| Total | 32.674 | 39 |
df: Degrees of freedom; F: F statistics; P: Probability value
Coca-cola is a popular soft drink with the lowest pH (2.7)[13] among the beverages in the present study. It has been reported that a low pH in acidic food and drink induces erosive wear in materials. High acidity might have a greater softening effect on the resin matrix, thus promoting the dislodgement and leaching out of filler particles and thereby increasing the surface roughness of composite resin. Although the pH of coffee is nearly 7, coffee is composed of water, and the effect of water uptake can degrade polymer materials.[14] When polymer materials absorb water, coupling agents cause hydrolysis and loss of chemical bond between filler particles and the resin matrix. Filler particles dislodge from the outer surface of the material[15] causing surface roughness. Although tea is acidic having a pH of 5.38, it has higher polarity components that are eluted first and does not readily penetrate inside which might have resulted in its lower surface roughness values when compared to coffee and Coca-cola.
Discoloration of composite resins often requires their replacement as it has a negative influence on the esthetic outcome of a restoration. Thus, the property of color stability of a resin composite plays a major role in the success of an esthetic restoration. CIE LAB was developed by the Commission Internationale de I'Eclairge in 1931. A color difference (ΔE) between two objects can be calculated as the Euclidean distance between two coordinates (before and after) in the color space according to the following equation:[16]
ΔE = ([L1*–L2*]2 + (a1*–a2*)2 + [b1*–b2*]2)½ The L* value in the CIELAB system measures lightness and correlates to value (V) in the Munsell color order system. The a* and b* values can be used to derive the metric chroma (C*ab = [a2+b2]0,5).
The amount of ΔE is useful in determining how much of colour change is acceptable and is perceptible to observers. Most of the authors consider Δ E more than 1 as perceptible and ΔE more than 3.3 as clinically unacceptable.[17]
The color of composite resins can be assessed both visually and instrumentally. Visual assessment of color by using shade guides is a common practice; however, it is subjective, inconsistent and may vary from one observer to another. On the other hand, instrumental color assessment by spectrophotometer, colorimeter, and digital image analysis allows a more objective, quantitative, accurate, and reproducible color evaluation.[18] Although most studies advocate the use of spectrophotometers and colorimeters, Jarad et al. in 2005[19] found a very high and statistically significant correlation between the spectrophotometer and digital camera for all CIE L*, a*, and b* color coordinates and he concluded that the digital camera could be used for color measurements in the dental clinic.
In the present study, overall color change was maximum in the samples exposed to tea followed by coffee and Coca-cola. The least color change was observed in the control group (artificial saliva). A statistically significant difference in mean color change (P < 0.01) was observed amongst all the tested groups. The color change on the 7th day was maximum for the samples immersed in coffee followed by tea and Coca-cola which is in accordance to a study conducted by Gupta et al. in 2005.[20] However, on the 14th day and 28th day of experimentation, specimens exposed to tea showed highest color change followed by coffee and Coca cola. Both tea and coffee showed Δ E values >3.3 on the 14th and 28th day of exposure signifying clinically significant discoloration, whereas Coca-cola showed Δ E values >3.3 on the 28th day of exposure Graph 2, Table 3.
Graph 2.
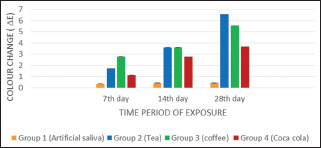
Distribution of mean colour change of nanohybrid composite resin
Table 3.
One-way ANOVA of color change of all groups based on beverages and time
| Sum of squares | df | Mean square | F | P | |
|---|---|---|---|---|---|
| Group 1 (control) | |||||
| Between groups (combined) | 0.044 | 2 | 0.022 | 1802.745 | 0.01 |
| Within groups | 0 | 27 | 0 | ||
| Total | 0.045 | 29 | |||
| Group 2 | |||||
| Between groups (combined) | 119.941 | 2 | 59.97 | 3082.70 | 0.01 |
| Within groups | 0.005 | 27 | 0 | ||
| Total | 119.946 | 29 | |||
| Group 3 | |||||
| Between groups (combined) | 40.365 | 2 | 20.183 | 14,402.99 | 0.01 |
| Within groups | 0 | 27 | 0 | ||
| Total | 40.366 | 29 | |||
| Group 4 | |||||
| Between groups (combined) | 33.165 | 2 | 16.583 | 21,029.77 | 0.01 |
| Within groups | 0 | 27 | 0 | ||
| Total | 33.165 | 29 |
df: Degrees of freedom; F: F statistics; P: Probability value
Both tea and coffee contain yellow colorants with different polarities. Higher polarity components (like those in tea) are eluted first, while lower polarity components (like those in coffee) are eluted at a later time. In the present study a slight change in color was caused due to Coca-Cola, which could be attributed to the change in roughness of the samples due to the low pH (2.62) of the solution, which further aids in the adsorption of color onto its surface. Cola gains its color through the due to the presence of caramel colour in its composition. These results are in agreement with Patel et al. who stated that Coca-Cola causes a minimal change in color in the composite resins.[21]
Both surface roughness and colour change has shown time dependent increase in all the tested time period where the least values were obtained on the 7th day followed by 14th day and the maximum value was obtained on the 28th day. These results are in similar to a study done by Chandrasekhar V et al. and Bansal et al.[22,23]
In the present study a positive correlation was found between surface roughness and colour change in artificial saliva, tea, coffee and Coca cola. As surface roughness increased colour change also increased thereby indicating a reduction in the colour stability of the composite resin.
Limitations
In the present study, both parameters were measured upto 28 days, however more long-term clinical studies or in vitro studies with better simulation of the oral environment are necessary to validate the findings.
CONCLUSION
Within the limitations of the study, nanohybrid composite resin (Beautifil II) was susceptible to both surface roughness and colour change when exposed to beverages like tea, coffee, Coca cola. Surface roughness was highest in Coca cola followed by coffee and tea. Similarly, highest colour change was observed in tea followed by coffee and Coca cola. Both surface roughness and colour stability were time dependent as with increase in time, surface roughness and colour change also increases.
Financial support and sponsorship
Nil.
Conflicts of interest
There are no conflicts of interest.
REFERENCES
- 1.McLaren EA, Cao PT. Smile analysis and esthetic design: “In the Zone.”. Inside Dent. 2009;5:e7–11. [Google Scholar]
- 2.Oysaed H, Ruyter IE, Kleven U. Release of formaldehyde from dental composites 1988. J Dent Res. 2008;67:1289–94. doi: 10.1177/00220345880670100901. [DOI] [PubMed] [Google Scholar]
- 3.Gonzalez MA, Khokhar NH, Razak AA. Polishing of the composite resin restorations – Literature review. Annal Dent Univ Malaya. 2010;17:25–34. [Google Scholar]
- 4.Teaboard.gov.in. 2020. [Last accessed on 2020 Sep 21]. Available from: http://www.teaboard. g o v. i n / p d f / E x e c u t i v e _ S u m m a r y _ Te a _ C o n s u m p t i o n _20062018_pdf5940.pdf .
- 5.Indiaƌs Forecast Coffee Consumption 2019. Is Still India a Coffee Tea? Coffee BI. Coffee Business Intelligence. 2020. [Last accessed on 2020 Sep 21]. Available from: https://coffeebi.com/2019/02/04/indias-forecast-coffee-consumptio n-2019 .
- 6.Fernandes AC, de Assunc IV, Borges BC, da Costa GD. Impact of additional polishing on the roughness and surface morphology of dental composite resins. Rev Port Estomatol Meddent Cir Maxilofac. 2016;57:74–81. [Google Scholar]
- 7.Poggio C, Vialba L, Berardengo A, Federico R, Colombo M, Beltrami R, et al. Color stability of new esthetic restorative materials: A spectrophotometric analysis. J Funct Biomater J Funct Biomater. 2017;8(3):26. doi: 10.3390/jfb8030026. [DOI] [PMC free article] [PubMed] [Google Scholar]
- 8.da Silva HA, Arossi GA, Damo DM, Tovo MF. Effect of grape derived beverages in colour stability of composite resin submitted to different finishing and polishing methods. Pesquisa Brasileira em Odontopediatria e Clinica Integrada. 2017;17:e3435–9. [Google Scholar]
- 9.de Moraes RR, Gonçalves Lde S, Lancellotti AC, Consani S, Correr-Sobrinho L, Sinhoreti MA. Nanohybrid resin composites: Nanofiller loaded materials or traditional microhybrid resins? Oper Dent. 2009;34:551–7. doi: 10.2341/08-043-L. [DOI] [PubMed] [Google Scholar]
- 10.Abzal MS, Rathakrishnan M, Prakash V, Vivekanandhan P, Subbiya A, Sukumaran VG. Evaluation of surface roughness of three different composite resins with three different polishing systems. J Conserv Dent. 2016;19:171–4. doi: 10.4103/0972-0707.178703. [DOI] [PMC free article] [PubMed] [Google Scholar]
- 11.Barbosa SH, Zanata RL, Navarro MF, Nunes OB. Effect of different finishing and polishing techniques on the surface roughness of microfilled, hybrid and packable composite resins. Braz Dent J. 2005;16:39–44. doi: 10.1590/s0103-64402005000100007. [DOI] [PubMed] [Google Scholar]
- 12.Nair VS, Sainudeen S, Padmanabhan P, Vijayashankar LV, Sujathan U, Pillai R. Three-dimensional evaluation of surface roughness of resin composites after finishing and polishing. J Conserv Dent. 2016;19:91–5. doi: 10.4103/0972-0707.173208. [DOI] [PMC free article] [PubMed] [Google Scholar]
- 13.Lath DL, Wildgoose DG, Guan YH, Lilley TH, Smith RN, Brook AH. A digital image analysis system for the assessment of tooth whiteness compared to visual shade matching. J Clin Dent. 2007;18:17–20. [PubMed] [Google Scholar]
- 14.Tanthanuch S, Kukiattrakoon B, Siriporananon C, Ornprasert N, Mettasitthikorn W, Likhitpreeda S, et al. The effect of different beverages on surface hardness of nanohybrid resin composite and giomer. J Conserv Dent. 2014;17:261–5. doi: 10.4103/0972-0707.131791. [DOI] [PMC free article] [PubMed] [Google Scholar]
- 15.Santos C, Clarke RL, Braden M, Guitian F, Davy KW. Water absorption characteristics of dental composites incorporating hydroxyapatite filler. Biomaterials. 2002;23:1897–904. doi: 10.1016/s0142-9612(01)00331-3. [DOI] [PubMed] [Google Scholar]
- 16.Bhandari R, Thakur S, Singhal P, Chauhan D, Jayam C, Jain T. Concealment effect of resin infiltration on incisor of Grade I molar incisor hypomineralization patients: An in vivo study. J Conserv Dent. 2018;21:450–4. doi: 10.4103/JCD.JCD_61_18. [DOI] [PMC free article] [PubMed] [Google Scholar]
- 17.Douglas RD, Steinhauer TJ, Wee AG. Intraoral determination of the tolerance of dentists for perceptibility and acceptability of shade mismatch. J Prosthet Dent. 2007;97:200–8. doi: 10.1016/j.prosdent.2007.02.012. [DOI] [PubMed] [Google Scholar]
- 18.Khurana R, Tredwin CJ, Weisbloom M, Moles DR. A Clinical evaluation of the individual repeatability of three commercially available colour matching devices. Br Dent J. 2007;203:675–80. doi: 10.1038/bdj.2007.1108. [DOI] [PubMed] [Google Scholar]
- 19.Jarad FD, Russell MD, Moss BW. The use of digital imaging for colour matching and communication in restorative dentistry. Br Dent J. 2005;199:43–9. doi: 10.1038/sj.bdj.4812559. [DOI] [PubMed] [Google Scholar]
- 20.Gupta R, Parkash H, Shah N, Jain V. A spectrophotometric evaluation of color changes of various tooth colored veneering materials after exposure to commonly consumed beverages. J Indian Prosthodont Soc. 2005;5:72–8. [Google Scholar]
- 21.Patel SB, Gordan VV, Barrett AA, Shen C. The effect of surface finishing and storage solutions on the color stability of resin-based composites. J Am Dent Assoc. 2004;135:587–94. doi: 10.14219/jada.archive.2004.0246. [DOI] [PubMed] [Google Scholar]
- 22.Chandrasekhar V, Reddy LP, Prakash TJ, Rao GA, Pradeep M. Spectrophotometric and colorimetric evaluation of staining of the light cured composite after exposure with different intensities of light curing units. J Conserv Dent. 2011;14:391–4. doi: 10.4103/0972-0707.87208. [DOI] [PMC free article] [PubMed] [Google Scholar]
- 23.Bansal K, Acharya SR, Saraswathi V. Effect of alcoholic and non-alcoholic beverages on color stability and surface roughness of resin composites: An in vitro study. J Conserv Dent. 2012;15:283–8. doi: 10.4103/0972-0707.97961. [DOI] [PMC free article] [PubMed] [Google Scholar]