

Abstract
Objective:
To investigate what social, psychological, personality, and behavioral factors affect overtime heart rate changes of college students.
Participants:
The daily heart rates of over 600 undergraduates at the University of Notre Dame were unobtrusively recorded via Fitbit devices from August 16, 2015, to May 13, 2017.
Method:
Latent Growth-Curve modeling strategy is utilized to examine how daily mean heart rate and its standard deviation change over time, and what foregoing factors predict observed changes.
Results:
The mean heart rate increased and its standard deviation stayed the same over the 637 days. Heart rate levels go up with that of social contacts, an indicator of peer influence. Both daily heart rate levels and changes are also affected by multiple external factors.
Conclusion:
Human heart rate is not only a physiological phenomenon but also a social-psychological one, as it is systematically affected by peer networks, social contexts, and human activities.
Keywords: Heart rate, Peer influence, Latent Growth-Curve Model (LGCM), Social networks, Sensor data
Introduction
The human heart beats about 100 thousand times in one day, about 35 million times in a year, and more than 2.5 billion times in an average lifetime.1 In humans, the basal and non-basal heart rate decreases from infancy to late adolescence and then stabilizes in adulthood,2 with heart rate variation declining with increasing age.3 The heart rate is an important biological marker and is one of the vital signs public health workers use to monitor the health of a community. Dysregulation in the heart rate, in the form of excessive or narrow heart rate variability (HRV), or excessively high resting heart rate (as measured by beats per minute), has been linked to a variety of negative health outcomes, including, inter alia, hypertension and early (all-cause and cardiovascular) mortality.4
As such, knowledge about how the heart rate changes over time, as well as the possible predictors of such temporal trends, can provide a fundamental basis for improving the overall health of this population. Despite its importance as an individual and community health factor, most previous work attempting to look at the social or environmental predictors of the heart rate restricts itself to comparing heart rate statistics across various socio-demographic groups, without measuring these factors directly. Also, little is known about how one’s heart rate, both in terms of overall level and variability, changes when he or she transitions from late adolescence to emerging adulthood, in a context in which personal social networks are dramatically restructured and lifelong relationships (both romantic and friendship) begin to form. We study a population undergoing such a life course change, by focusing on first-year college students making the transition from high school to college in an exclusively residential campus. This provides us with a strategic research site to study a number of environmental factors, including direct peer group social ties,5,6 that could influence the levels and variability in the heart rate.
Factors affecting the heart rate
Physiologically one’s heart rate is regulated by the autonomic nervous system, with increased sympathetic activity speeding it up and increased parasympathetic activity slowing it down.1,7 At the same time, the heart rate is impacted by multiple external factors unrelated to the autonomic nervous system or genetic determinants which can be classified into five categories: Social, Personal, Psychological, Environmental, and Behavioral. Failing to account for those external factors would lead to “physiological reductionism”, namely, the exclusive consideration of only biological or genetic factors in determining individual variability in heart rate, at the expense of social, environmental, personal, psychological and behavioral factors. In the following, we consider the full panoply of determinants of the heart rate.
Social factors.
A person’s heart rate can become correlated or synchronized with that of peers he or she interacts with on a regular basis. The synchrony and parallelism in heart rate have been observed between a man and a woman in coitus,8 physical and psychological therapist and patients,9,10,11 romantic partners,12,13 resting mothers and preschoolers,14 choir members,15 and pairs of game players,16 especially those who trust each other.17 Personal network size might also be a determinant of heart rate. Previous studies suggest that lower social support is correlated with an elevated heart rate.18 While social support is associated with network size, the two are not identical constructs and thus network size and social support may have distinct and independent effects on the heart rate.
Personal factors.
Heart rate can vary according to personal socio-demographic traits. It is higher in women than men2,19 and its variability is different for men and women although the difference is not statistically significant.3 When compared with whites, studies show that Black Americans and African immigrants have similar daytime heart rate but higher nighttime heart rate, yielding a higher 24-hour mean heart rate.20 Body mass index (BMI) is positively associated with heart rate because obese people are engaged in less exercise, an activity that strengthens the parasympathetic activity and balances the autonomic nervous system.19
Psychological factors.
Mixed findings have been reported about the effect of personality on heart rate: While in one study self-reported personality traits such as extraversion, agreeableness, conscientiousness, neuroticism, and openness were not found to be associated with one’s heart rate,21 another study found that low conscientiousness individuals experience a higher rise in heart rate when they are playing a first-person computer game compared to high conscientiousness ones.22 Depressive symptoms have also been associated with elevated resting heart rate.23,24
Environmental factors.
The effects of environmental factors on the heart rate are complex. While on weekdays or Saturday the amount of physical activity of children aged 9–10 is not significantly different, boys experience more time and girls experience less time with heart rates over 140 beats per minute on weekdays than on Saturday.25 And heart rate can rise, fall, or stay the same due to low ambient temperature.26
Behavioral factors.
Physical activity can accelerate heart rate while ongoing, although individuals typically experience a decline in heart rate post-exercise.1,2 Physical posture also has an effect, with heart rate being much higher when one stands upright and higher when one sits down compared to being asleep.2
Contributions of the present work
While previous studies have greatly contributed to our understanding of between-person variation in the heart rate, we know less about the with-person variation over time. This is in large because there is a paucity of objective data tracing the heart rate of human subjects around the clock in natural settings over a long period of time. This could be one of the reasons why overtime changes in the human heart rate from late adolescence to early adulthood have been understudied. Additionally, no previous study has looked at the effect of the full set of multiple determinants on the human heart rate, using a single, systematic statistical modeling framework. Using data collected by Fitbit devices, smartphones, and surveys in the NetHealth project,27,28 the current study addresses these gaps in the literature by examining how undergraduate students’ heart rates changed over their first two academic years.
Method
Data
This study uses data from the NetHealth project,27,28 a four-year NIH-funded research which was approved by the Institutional Review Board of the University of Notre Dame in 2015. More than 600 undergraduate students from the 2015 entering cohort of 2000 undergraduates at the University of Notre Dame were recruited and consented to wear Fitbit devices we supplied, install applications on their smartphones and computers that allowed us to retrieve and securely store communication (text, calls) event meta-data (to and from numbers, date and time, but not the content), and complete online surveys every three to four months. Students were initially recruited for a two-year period. The recruited sample is representative of the Notre Dame student population on basic demographic traits (gender, ethnoracial category, religious affiliation). There was very little attrition during the first year, but during the second year there were some withdrawals and some students whose compliance levels for wearing their Fitbit devices dropped, leading to missing data on heart rate for some periods of time. For the purposes of this study we estimate models using data over 637 days (August 16th of 2015 to May 13th of 2017) from 487 participants who had relatively complete Fitbit data (defined as 80% or more daily within-person records28).
Data used in this analysis were collected from four sources. First, from the Fitbit devices, we retrieved minute-by-minute heart rate values, daily physical activity measures (e.g., number of steps), and daily sleep amount measures. Second, from participant smartphones, we retrieved communication logs allowing us to identify when a participant communicated with another study participant. We then used data on the heart rates of the in-study contacts a participant communicated with to assess whether his or her daily heart rate changes as the participant’s in-study contacts’ heart rates change. Third, from surveys regularly administered every three to four months, we obtained demographic information, health status (height and weight), personality measures, mental health assessments, and information on the number of courses a student was taking. Finally, using publicly available data sources, we obtained information on the weather in South Bend on each day (from http://www.usclimatedata.com/ website) and events and holidays occurring at the University of Notre Dame.
We merged data from different sources to create daily records for each participant with indicators for both the time-constant variables (e.g. demographic traits, personality) and the time-varying factors (heart rate, physical activity, weather, sleep). The dataset has been fully de-identified with a non-identifying participant number that allows researchers to link data from different sources, and is publicly available via the NetHealth Project website (http://sites.nd.edu/nethealth/).
Measures
The two outcome variables, namely, the mean and standard deviation of a participant’s heart rate, are computed for each day. Among the main predictors, social factors include the peer influence indicator5 measured as the average daily heart rate of each participant’s in-study contacts that he or she communicated with on that day (as well as the average of his or her in-study contacts’ standard deviations). We also include daily network degree as an indicator of overall social activity, indexed by how many contacts a participant communicated with on that day. Personal (socio-demographic) factors include participants’ gender (identification as either a man or a woman), ethnoracial category (identification as White, Latino, Black American, Asian American, vs. International students), and body mass index (BMI; weight/height2). Psychological factors include individual scores for extraversion (a standardized factor score of 8 items; Cronbach’s α = 0.87), agreeableness (a standardized factor score of 9 items; Cronbach’s α = 0.80), conscientiousness (a standardized factor score of 9 items; Cronbach’s α = 0.83), neuroticism (a standardized factor score of 8 items; Cronbach’s α = 0.82), openness (a standardized factor score of 10 items; Cronbach’s α = 0.79; those foregoing psychological factors are also known as the “big five” personality trait ratings29). We also include individual scores in a validated score of depressive symptoms (a standardized factor score of 20 items from the Center for Epidemiologic Studies Depression Scale; CES-D;30 Cronbach’s α = 0.94). Environmental factors include the day of a week (Sunday, Monday to Thursday, Friday, vs. Saturday), daily status by academic calendar (Regular school day, Home football game Saturday, Midterm break, Winter break, Summer break, Thanksgiving holiday, Easter holiday, Orientation weeks, vs. Final exam week), the highest and lowest temperatures (°F) in that day, daily precipitation in inches, daily snowfall in inches, and daily snow piling depth in inches. Behavioral factors include daily physical activity (a standardized factor score of 18 items obtained from Fitbit devices, including low range calories and minutes, fat burn calories and minutes, cardio calories and minutes, peak calories and minutes, steps, floors, sedentary minutes, lightly active minutes, fairly activity minutes, very active minutes, marginal calories, activity calories, calories BMR, and calories out; Cronbach’s α = 0.89; more details about the items are available at http://help.fitbit.com), minutes in bed, and the number of classes taken that day.
Analytical plan
We expect that participants’ mean and standard deviation of heart rates will change over the 637 days. To explore these time trends, we estimate Latent Growth-Curve Models (LGCMs) with random/fixed effects for the daily panel data in Stata V15.2. LGCMs are Hierarchical Linear Models (HLMs) since they contain both within-subject (Level 1) and between-subject (Level 2) variance components.
Level 1 with-subject equation can be written as follows:
| (1) |
where is the dependent variable for the ith subject at the dth day, is the latent factor indicating initial value of , is the latent subject-specific factor for the linear slope of , is the time-varying covariate for the ith subject at the dth day, is the estimated parameter for , and is the subject-specific random error with an expected mean of zero and variance of to be estimated from the data.
Level 2 between-subject equations can be written as follows:
| (2) |
| (3) |
where are intercept terms, is the time-constant variable, is the effect of time-constant variable on the intercept, is the effect of time-constant variable on the linear slope, and are between-subject random error terms.
Figure 1 illustrates the dependencies specified in the statistical model. The dependent variable y measured at multiple waves with a random error ε has three predictors: (1) the intercept or initial value η0, (2) the linear slope or rate of change η1, and (3) the time-varying variable x, reflecting the within-subject variation. Both η0 and η1 are estimated as latent variables. The effect of time-constant variable z on the dependent variable y goes through η0 and η1, indicating the between-subject variation. This method enables the time trend and effects of determinants to be analyzed in a unified (one-step) modeling framework.
Figure 1.
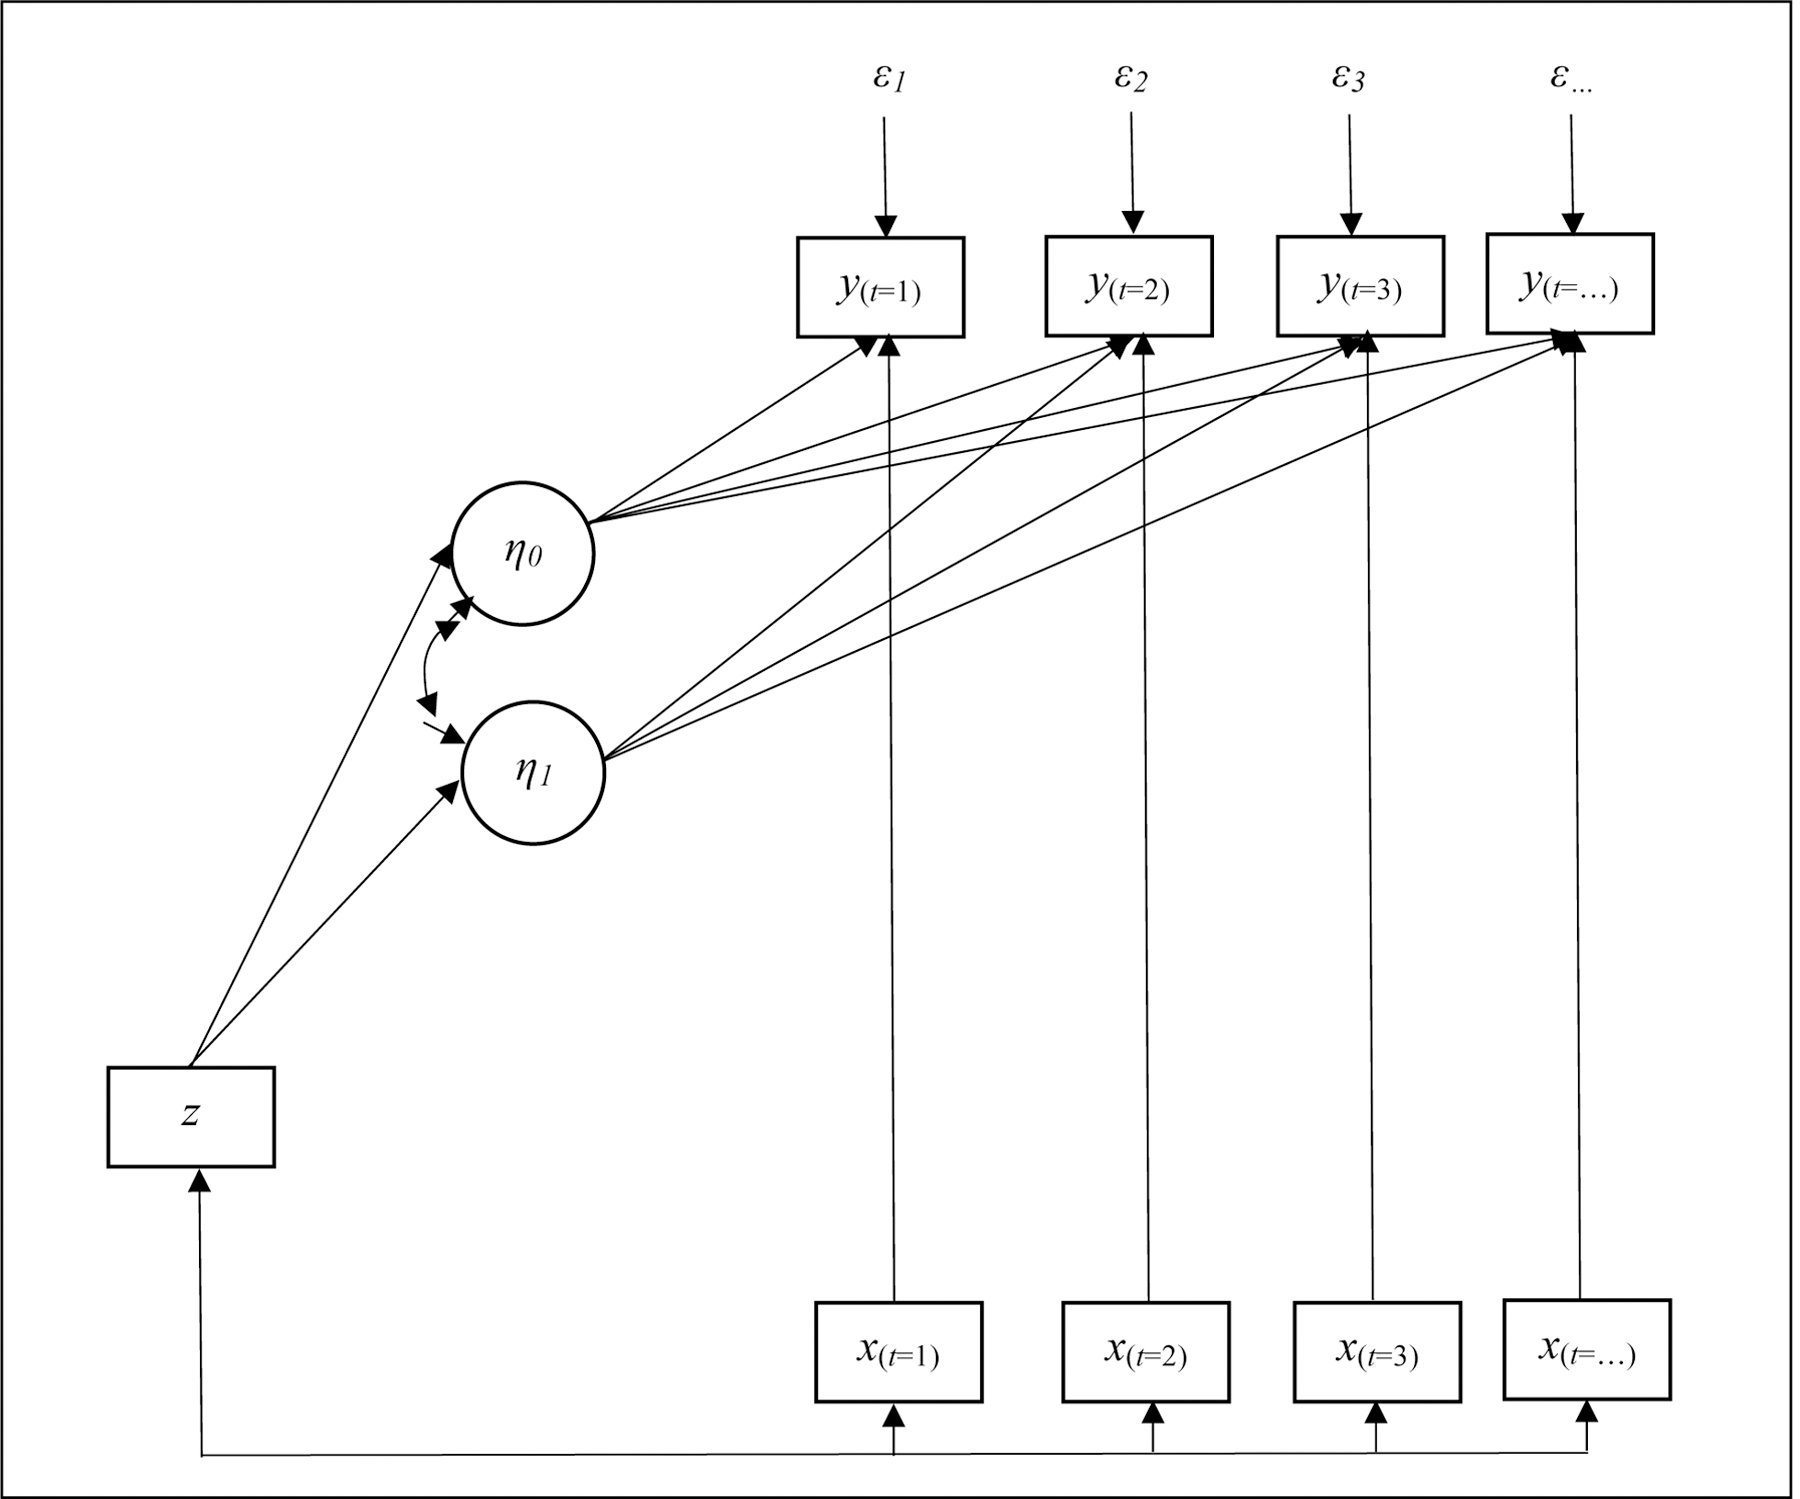
Statistical framework of latent growth-curve model.
Results
Descriptive statistics
As shown in Table 1, on average a NetHealth participant has a heart rate mean of 74 beats per minute (bpm) with a standard deviation of 15 bpm. The average values for his or her in-study contacts are similar. On average, each study participant communicates with 10 contacts with smartphone and spends 378 minutes (i.e., 6.3 hours) in bed daily, while taking an average of 2.5 classes per day during regular school days.
Table 1.
Summary of time-varying variables.
| Variables for each individual each day | Mean (SD) or n (%) |
|---|---|
| Daily mean heart beats per minute | 74.41 (9.69) |
| Daily standard deviation of heart beats per minute | 15.33 (4.28) |
| In-study contacts’ average daily mean heart beats per minute | 74.85 (8.39) |
| In-study contacts’ average daily standard deviation of heart beats per minute | 15.71 (3.70) |
| Daily network size | 10.06 (7.17) |
| Daily physical activity | 0.02 (0.58) |
| Daily minutes in bed | 378.02 (197.41) |
| Daily number of courses taken (during regular school days) | 2.51 (1.16) |
| Number of cases | 208,074 (100.00%) |
| Variables for each day | |
| Weather indicators | |
| Highest temperature (°F) | 58.39 (19.56) |
| Lowest temperature (°F) | 40.22 (16.69) |
| Precipitation in inch | 0.12 (0.40) |
| Snowfall in inch | 0.17 (0.80) |
| Snow piling depth in inch | 0.44 (1.40) |
| Number of days | 637 (100.00%) |
Table 2 shows statistics for the time-constant variables including gender, ethnoracial category, BMI, personality, and depressive symptoms. Among the 622 participants, about 51% are women, 65% whites, 13% Latinos, 6% Black Americans, 9% Asian Americans, and 6% international students. The typical participant has a BMI of 22.8.
Table 2.
Summary of time-constant variables.
| Variables for each individual | Mean (SD) or n (%) |
|---|---|
| Women (1=yes) | 317 (50.96%) |
| Ethnoracial category | |
| White (1=yes) | 406 (65.27%) |
| Latino (1=yes) | 81 (13.02%) |
| Black American (1=yes) | 38 (6.11%) |
| Asian American (1=yes) | 58 (9.32%) |
| International student (1=yes) | 39 (6.27%) |
| BMI | 22.82 (3.36) |
| Extraversion | −0.01 (0.71) |
| Agreeableness | 0.00 (0.60) |
| Conscientiousness | 0.04 (0.62) |
| Neuroticism | −0.02 (0.64) |
| Openness | −0.01 (0.58) |
| Depression | 0.05 (0.46) |
| Number of individuals | 622 (100.00%) |
LGCM results
Estimated parameters from the Latent Growth-Curve Models for the daily mean heart rate (Model 1) and the daily standard deviation around the mean (Model 2) are reported in Table 3. The Root Mean Square Error of Approximation (RMSEA) is smaller than .06 and the Comparative Fit Index (CFI) is greater than .95 for each model, both suggesting a good fit.
Table 3.
Results from linear growth-curve models.
| Model 1 | Model 2 | |
|---|---|---|
|
| ||
| Mean heart rate | SD heart rate | |
| Day | 0.011** (0.003, 0.019) |
0.002 (−0.001, 0.005) |
| Average measure of in-study contacts | 0.045*** (0.041, 0.050) |
0.025*** (0.020, 0.030) |
| Daily network size | 0.041*** (0.035, 0.048) |
−0.017*** (−0.021, −0.014) |
| Women (1=yes) | 5.869*** (4.425, 7.312) |
1.911*** (1.570, 2.251) |
| Women × Day | −0.001 (−0.003, 0.002) |
−0.002*** (−0.003, −0.001) |
| Latino (1=yes) | 0.635 (−1.393, 2.663) |
−0.212 (−0.691, 0.267) |
| Latino × Day | 0.002 (−0.002, 0.005) |
0.000 (−0.001, 0.001) |
| Black American (1=yes) | 3.292* (0.396, 6.188) |
−0.479 (−1.192, 0.234) |
| Black American × Day | −0.001 (−0.006, 0.003) |
0.000 (−0.002, 0.002) |
| Asians American (1=yes) | 0.803 (−1.637, 3.242) |
0.059 (−0.519, 0.637) |
| Asians American × Day | 0.001 (−0.003, 0.005) |
0.001 (−0.001, 0.002) |
| International student (1=yes) | −0.724 (−3.959, 2.511) |
−0.615 (−1.413, 0.183) |
| International student × Day | 0.002 (−0.003, 0.008) |
0.002 (−0.000, 0.004) |
| BMI | 0.186 (−0.018, 0.389) |
−0.188*** (−0.237, −0.139) |
| BMI × Day | −0.001** (−0.001, −0.000) |
−0.000 (−0.000, 0.000) |
| Extraversion | −0.204 (−1.198, 0.790) |
−0.100 (−0.335, 0.134) |
| Extraversion × Day | −0.000 (−0.002, 0.001) |
0.000 (−0.000, 0.001) |
| Agreeableness | −0.874 (−2.113, 0.365) |
0.003 (−0.289, 0.296) |
| Agreeableness × Day | −0.002* (−0.004, −0.000) |
−0.000 (−0.001, 0.001) |
| Conscientiousness | −1.460* (−2.636, −0.283) |
0.317* (0.0379, 0.597) |
| Conscientiousness × Day | 0.001 (−0.001, 0.003) |
0.000 (−0.000, 0.001) |
| Neuroticism | 0.107 (−1.146, 1.360) |
0.175 (−0.127, 0.476) |
| Neuroticism × Day | −0.001 (−0.003, 0.001) |
0.000 (−0.001, 0.001) |
| Openness | −0.359 (−1.602, 0.885) |
−0.172 (−0.467, 0.122) |
| Openness × Day | 0.001 (−0.001, 0.003) |
−0.000 (−0.001, 0.000) |
| Depressive symptoms | 0.924 (−0.746, 2.594) |
0.416 (−0.015, 0.847) |
| Depressive symptoms × Day | −0.001 (−0.004, 0.001) |
−0.001 (−0.002, 0.000) |
| Monday to Thursday(1=yes) | −0.622*** (−0.735, −0.509) |
0.447*** (0.382, 0.512) |
| Friday(1=yes) | 0.295*** (0.164, 0.427) |
−0.212*** (−0.287, −0.137) |
| Saturday(1=yes) | 0.775*** (0.649, 0.901) |
−0.399*** (−0.471, −0.328) |
| Home football game day (1=yes) | 1.641*** (1.409, 1.872) |
−1.199*** (−1.331, −1.067) |
| Midterm break (1=yes) | −0.475*** (−0.639, −0.311) |
−0.283*** (−0.376, −0.190) |
| Winter break(1=yes) | −0.912*** (−1.081, −0.744) |
−0.023 (−0.119, 0.073) |
| Summer break(1=yes) | −1.905*** (−2.052, −1.759) |
0.014 (−0.0687, 0.0964) |
| Thanksgiving holidays (1=yes) | −0.807*** (−1.070, −0.544) |
0.040 (−0.110, 0.189) |
| Easter holidays (1=yes) | −1.150*** (−1.444, −0.855) |
0.237** (0.0699, 0.405) |
| Orientation week (1=yes) | −0.944*** (−1.256, −0.631) |
−0.616*** (−0.794, −0.438) |
| Final exam week (1=yes) | −0.089 (−0.273, 0.095) |
−0.134* (−0.239, −0.029) |
| Highest temperature (°F) | −0.004 (−0.008, 0.001) |
−0.008*** (−0.010, −0.005) |
| Lowest temperature (°F) | −0.011*** (−0.016, −0.006) |
0.004* (0.001, 0.006) |
| Precipitation in inch | 0.118** (0.030, 0.206) |
−0.006 (−0.056, 0.044) |
| Snowfall in inch | −0.010 (−0.051, 0.030) |
−0.009 (−0.032, 0.014) |
| Snow piling depth in inch | −0.018 (−0.044, 0.008) |
0.000 (−0.015, 0.015) |
| Physical activity | 6.789*** (6.711, 6.866) |
5.426*** (5.382, 5.470) |
| Minutes in bed | −0.008*** (−0.009, −0.008) |
−0.000*** (−0.000, −0.000) |
| Number of classes | −0.193*** (−0.225, −0.161) |
0.029** (0.011, 0.047) |
| Intercept | 66.930*** (62.120, 71.750) |
18.170*** (17.010, 19.340) |
| Number of cases | 55,977 | 55,961 |
| Number of individuals | 487 | 487 |
| Goodness-of-fit | ||
| AIC | 308409.7 | 244317.9 |
| BIC | 308865.3 | 244773.4 |
| Wald chi-square/df | 46219.29/46 | 64278.73/46 |
| Log-likelihood | −154153.85 | −122107.94 |
Note:
p < 0.05
p < 0.01
p < 0.001
The intercept or starting point for the mean heart rate is 66.9 bpm and that for the standard deviation is 18.2 bpm. The daily mean heart rate increases over time so that after 637 days the model estimates the typical student’s heart rate will have increased by 6.8 bpm.
With regard to social factors, statistically significant peer influence effects are evident for both daily mean heart rate and its standard deviation. When the average heart rate of a participant’s in-study contacts increases, his or her heart rate is also likely to increase. Similarly, when the daily average variation among a participant’s in-study contacts increases, the daily variability in his or her heart rate also increases. The models also show that the larger the daily network size, the higher the mean heart rate and the lower its standard deviation on that day. Because our measures of the heart rates of a participant’s in-study contacts and the size of their social network can vary from day to day, these are strong findings, implying that daily changes in both network size and the heart rates of those in a participant’s active network predict daily changes in his or her own heart rate patterns.
Turning to personal factors, women have higher starting points on mean and standard deviation of heart rate than men, but the daily standard deviation of heart rate declines over time for women and at the end of 637 days it is expected to decrease about 1.1 bpm, which is still higher than men. When it comes to ethnoracial status, we find that Black participants have higher mean heart rate than white participants. In terms of personal physical factors, we find study participants with higher BMIs have lower daily standard deviations in their heart rates, and their daily means decline a little over time.
Among psychological factors, daily mean heart rate decreases for more agreeable students (by 1.3 bpm for each standard deviation increase in agreeableness). High levels of conscientiousness are associated with lower mean heart rate but lead to higher standard deviation throughout a day.
As for environmental factors, students have lower mean and higher standard deviation of heart rate during weekdays (Mondays to Thursdays), and higher mean and lower standard deviation on weekends (Fridays and Saturdays) compared to Sundays. We also observe study participants have higher mean and lower standard deviation on home football game Saturdays, lower mean and standard deviation during midterm breaks and orientation weeks, lower mean during winter breaks, summer breaks, and Thanksgiving holidays, lower mean and higher standard deviation during Easter holidays, and lower standard deviation during final exam weeks compared to regular school days. On days with high maximum temperatures there is less variation in the heart rate throughout the day, while on days with lower minimum temperatures, participant’s average heart rate across the day is lower but with more variation throughout the day. Participants have high mean heart rates on raining days.
Finally, as would be expected, when participants are more active their daily heart rates increase as does the amount of variation in their heart rates during a day. In addition, after nights in which study participants are observed to get more sleep, the heart rate declines as does its variability on a subsequent day, speaking to the possible health benefits of a good night’s sleep. Moreover, on days when a participant has more classes, he or she has lower mean heart rate but more variability.
Discussion
This study examines how human daily heart rate levels and variability change over a 637-day period for young adults making the transition from high school to college. Using Fitbit, telecommunication, and survey data from the NetHealth project, we find that the average daily heart rate in this sample increases over the observation period. This finding is at odds with prior research showing a general decline in heart rates from infancy to late adolescence and then stabilize during adulthood.2 The overall increase in heart rates may be the result of the increased activity students experience when they go away to college and reside on a college campus. This is especially at an elite residential university like Notre Dame, where students have more opportunities to engage in vigorous forms of physical activity. Whether and to what extent the increasing temporal trend in heart rates observed over the first two years persists at the higher levels or even grows in the future is an open question. Though we do find this overall trend in increasing heart rate in our sample, what is most interesting is variation across participants and across time in heart rates.
Among the multiple time-varying features included in this study, our most striking finding is positive peer influence effect on both the mean and the standard deviation of heart rate.5,6 Changes in the heart rates and within-day variation in the heart rates of a participant’s network contacts predict changes in the participant’s own heart rate and its within-day variation. Changes in a participant’s heart rate can occur because either the participant’s contacts change and these new contacts differ from his or her old contacts, and/or his or her current contacts experience changes in their heart rates. Peer influence could occur via face-to-face interaction facilitating behavioral and emotional coordination which in turn generates heart rate synchronization,8–17 or by engagement in common activities related to hear rate and associate role modeling.6 Whatever the mechanism may be, among these students there is a tendency for their hear rates levels and patterns to become similar to their network contacts’. Besides, one’s network size over smartphone increases the mean heart rate and decreases its standard deviation.
Turning to the effect of time-invariant features, this study corroborates previous research finding that women and Black Americans have higher mean heart rate.2,19,20 We also find that women have higher within-day variation in their heart rates than men. Unlike prior studies,19 those with higher BMIs upon arriving at college do not have higher heart rates. We also find that those with higher BMIs do not see increases in their heart rates more than other students. On the contrary, it appears that after arriving, higher BMI students are more likely to experience declines in their heart rates.
We also find that heart rate is systematically linked to personability factors. Conscientious participants have lower heart rates as suggested in previous research,22 but they also have more within-day variation. We find little evidence that the scores on the other four “big five” personality dimensions or a person’s mental health, as measured by a validated depressive symptoms scale, are related to changes in heart rate patterns and levels.
Our findings indicate that the heart rate is conditioned by the organization of social activities in calendar time as well as by large-scale physical factors such as the weather. However, overall our findings suggest that the effects of environmental factors on heart rate are more complex than described in previous research.26 The heart rate pattern of NetHealth participants varies not only with weekdays/weekends and temperatures as in prior studies,25,26 but across regular school days, breaks, holidays, and other weather conditions like precipitation.
Finally, our findings replicate the often noted positive association between heart rate and physical activity.1,2 The negative association between heart rate and time spent in bed is suggestive and deserves further investigation as there has been little research on the relation between sleep duration and heart rate, although related work using these data has begun to explore these issues.31 Both these findings for the effects of physical activity and sleep levels are “strong” findings in that they are within-subject estimates of the effects of daily changes in activity or sleep on daily changes in participant’s heart rates. Posture has effects: the more classes a participant takes a day, the more time of sitting down, and the lower the mean heart rate. A participant also needs to transfer between classrooms if he or she takes more classes a day, which affects the standard deviation of his or her heart rate.
A key strength of this study is the use of heart rate data from remote, always-on sensors worn by college students engaged in everyday activities in natural settings over a long period of time, as well as time-stamped network communication data unobtrusively collected via smartphones.32 With these two indicators, we can trace both one’s heart rate and the heart rates of his or her network contacts on a day to day basis. Another strength is the use of the Latent Growth-Curve Modeling strategy, which enables us to model both the between-person and within-person (overtime) variation in heart rate using a unified statistical framework.
Certain limitations of this study should also be mentioned. First, it uses data collected from college students at one private, religiously affiliated elite university. Although most of our findings are consistent with prior literature, our findings should be interpreted with the caveat that these college students are more active than the average individual in the U.S. both physically and socially, and reside together on a residential campus. Whether and to what extent findings from our sample are generalizable to other college students starting college, or to young people becoming adults, is an open question. Because the transition to college is a critical junction during which interaction patterns and behaviors change, our findings suggest that new insights about heart rates, and the effects of social networks on health behaviors can be gleaned from high grade longitudinal data from sensors.33,34 With additional data from different settings, researchers will be able to conduct comparative analyses and explore under what conditions and through what mechanisms peer influence on people’s health behaviors occur. Second, there was a significant amount of missing data, a problem that occurs with all longitudinal data collection efforts, but occurs for different reasons with sensor data. While ideally, sensors are always on, yielding streams of temporal data, sensors can stop working and in the case of Fitbit devices they might not be worn. Data collected on the device must be transferred (synced) to a server. In the case of Fitbit devices, while data is stored locally for up to 7 days, if not synced in time then it can disappear as it is overwritten by new data. Researchers working with sensor data (smartphones, wearables) will need to devise methods for dealing with and estimating the effects of missing data during specific time periods (e.g., when users are at places hard to get Internet connection).
Despite these limitations, our findings have multiple implications for future interdisciplinary research linking social and environmental factors to health behaviors and physiological outcomes. First, this study suggests both feasibility and merit of investigating the change in human heart rate within a unified statistical modeling framework in order to reduce the risk of misspecification that can occur when estimating separate models for different but interdependent processes. Second, core findings from this study show that the human heart rate is not only a physiological phenomenon but a social one, and is affected by the heart rates of regular social contacts,5 a phenomenon that has been shown to be important in the case of other health-related physiological markers such as obesity and subjective well-being.6,35 In this respect, it is possible that both well-regulated and dysregulated heart rate patterns can “spread” in a population via social network ties. However, it is also possible that other mechanisms, such as the selection of network contacts based on other lifestyle factors linked to the heart rate, may lie behind this empirical linkage. Overall, more interdisciplinary work is needed to better understand the connection between the internal physiological factors and external social factors. Third, while our findings provide a very strong indication that peer influence on heart rate occurs in this population,5,6,34 we do not know how and why heart rate synchrony occurs, nor do we know whether the intensity of peer influence effect varies across social networks ties that differ in their strength, closeness, or embeddedness (among other tie properties). This offers yet another potentially promising avenue of future research on the linkage between social networks, health behaviors, and physiological outcomes.
Our findings also have some practical implications. First, given the heart rate is not just a physiological phenomenon but a social one, public health workers can utilize social networks to build an environment for health enhancement among college students. Second, our findings suggest the participants to have lower heart rates and be more sedentary over breaks and holidays. Intervention programs might be more efficient and effective when the students are on campus where support from peers and friends and exercise and fitness facilities are widely available. Simultaneously, it is also clinically important to investigate dynamic change in heart rate across a relatively long span using multilevel approaches.
Footnotes
Conflict of interest disclosure
The authors have no conflicts of interest or financial disclosures.
References
- 1.Berne RM, Levy MN. Cardiovascular Physiology. 8th ed. St. Louis, MO: Mosby; 2001. [Google Scholar]
- 2.Dittmer DS, Grebe RM. Handbook of Circulation. Philadelphia, PA: W. B. Saunders; 1959. [Google Scholar]
- 3.O’Brien IAD, O’Hare P, Corrall RJM. Heart rate variability in healthy subjects: effect of age and the derivation of normal ranges for tests of autonomic function. Br Heart J 1986;55(4):348–354. [DOI] [PMC free article] [PubMed] [Google Scholar]
- 4.Thayer JF, Yamamoto SS, Brosschot. The relationship of autonomic imbalance, heart rate variability and cardiovascular disease risk factors. Int J Cardiol 2010;141(2):122–131. [DOI] [PubMed] [Google Scholar]
- 5.Friedkin NE, Cook KS. Peer group influence. Sociol Methods Res 1990;19(1):122–143. [Google Scholar]
- 6.Christakis NA, Fowler JH. The spread of obesity in a large social network over 32 years. N Engl J Med 2007;357(4):370–379. [DOI] [PubMed] [Google Scholar]
- 7.Gordan R, Gwathmey JK, Xie L-H. Autonomic and endocrine control of cardiovascular function. World J Cardiol 2015;7(4):204–214. [DOI] [PMC free article] [PubMed] [Google Scholar]
- 8.Bartlett RG Jr. Physiologic responses during coitus. J Appl Physiol 1956;9(3):469–472. [DOI] [PubMed] [Google Scholar]
- 9.DiMascio A, Boyd RW, Greenblatt M, Solomon HC. The psychiatric interview: a sociophysiologic study. Dis Nerv Syst 1955;16(1):4–9. [PubMed] [Google Scholar]
- 10.Coleman RM, Oreenblatt M, Solomon H. Physiological evidence of rapport during psychotherapeutic interviews. Dis Nerv Syst 1956;17(3):71–77. [PubMed] [Google Scholar]
- 11.Kodama K, Tanaka S, Shimizu D, Hori K, Matsui H. Heart rate synchrony in psychological counseling: a case study. Psychol 2018;9(7):1858–1874. [Google Scholar]
- 12.Ferrer E, Helm JL. Dynamical systems modeling of physiological coregulation in dyadic interactions. Int J Psychophysiol 2013;88:296–308. [DOI] [PubMed] [Google Scholar]
- 13.Konvalinka I, Xygalatas D, Bulbulia J, Schjødt U, Jegindø E-M, Wallot S, et al. Synchronized arousal between performers and related spectators in a fire-walking ritual. PNAS 2011;108(20):8514–8519. [DOI] [PMC free article] [PubMed] [Google Scholar]
- 14.Creaven A-M, Skowron EA, Hughes BM, Howard S, Loken E. Dyadic concordance in mother and preschooler resting cardiovascular function varies by risk status. Dev Psychobiol 2014;5(1):142–152. [DOI] [PMC free article] [PubMed] [Google Scholar]
- 15.Müller V, Lindenberger U. Cardiac and respiratory patterns synchronize between persons during choir singing. PLoS ONE 2011;6(9):24893. [DOI] [PMC free article] [PubMed] [Google Scholar]
- 16.Noy L, Levit-Binun N, Golland Y. Being in the zone: physiological markers of togetherness in joint improvisation. Front Hum Neurosci 2015;9:187. [DOI] [PMC free article] [PubMed] [Google Scholar]
- 17.Mitkidis P, McGraw JJ, Roepstorff A, Wallot S. Building trust: heart rate synchrony and arousal during joint action increased by public goods game. Physiol Behav 2015;149:101–106. [DOI] [PubMed] [Google Scholar]
- 18.Evans O, Steptoe A. Social support at work, heart rate, and cortisol: a self-monitoring study. J Occup Health Psychol 2001;6(4):361–370. [PubMed] [Google Scholar]
- 19.Stolarz K, Staessen JA, Kuznetsova T, et al. Host and environmental determinants of heart rate and heart rate variability in four European populations. J Hypertens 2003;21(3):525–535. [DOI] [PubMed] [Google Scholar]
- 20.Osei K, Schuster DP. Effects of race and ethnicity on insulin sensitivity, blood pressure, and heart rate in three ethnic populations: comparative studies in African-Americans, African immigrants (Ghanaians), and white Americans using ambulatory blood pressure monitoring. Am J Hypertens 1996;9(12 Pt 1):1157–1164. [DOI] [PubMed] [Google Scholar]
- 21.Holland AS, Roisman GI. Big five personality traits and relationship quality: self-reported, observational, and physiological evidence. J Soc Pers Relat 2008;25(5):811–829. [Google Scholar]
- 22.Brouwer AM, van Schaik MG, Korteling JE, van Erp JBF, Toet, A. Neuroticism, extraversion, conscientiousness and stress: physiological correlates. IEEE T Affect Comput 2015;6(2):109–117. [Google Scholar]
- 23.Lahmeyer HW, Bellur SN. Cardiac regulation and depression. J Psychiatr Res 1987;21(1):1–6. [DOI] [PubMed] [Google Scholar]
- 24.Kamphuis MH, Geerlings MI, Dekker JM, et al. Autonomic dysfunction: a link between depression and cardiovascular mortality? The FINE Study. Eur J Cardiovasc Prev Rehabil 2007;14(6):796–802. [DOI] [PubMed] [Google Scholar]
- 25.Gilbey H, Gilbey M. The physical activity of Singapore primary school children as estimated by heart rate monitoring. Pediatr Exerc Sci 1995;7(1):26–35. [Google Scholar]
- 26.Budd GM, Warhaft N. Body temperature, shivering, blood pressure and heart rate during a standard cold stress in Australia and Antarctica. J Physiol 1966;186(1):216–232. [DOI] [PMC free article] [PubMed] [Google Scholar]
- 27.Purta R, Mattingly S, Song L, et al. Experiences measuring sleep and physical activity patterns across a large college cohort with Fitbits. In: ISWC’16 Proceedings of the 2016 ACM International Symposium on Wearable Computers. New York: ACM; 2016:28–35. [Google Scholar]
- 28.Faust L, Purta R, Hachen DS, et al. Exploring compliance: observations from a large scale Fitbit study. In: SocialSens’17 Proceedings of the 2nd International Workshop on Social Sensing. New York: ACM; 2017:55–60. [Google Scholar]
- 29.John OP, Donahue EM, Kentle RL. The Big Five Inventory – Versions 4a and 54. Berkeley, CA: University of California, Berkeley, Institute of Personality and Social Research; 1991. [Google Scholar]
- 30.Radloff LS. The CES-D scale: a self-report depression scale for research in the general population. Appl Psychol Meas 1977;1(3):385–401. [Google Scholar]
- 31.Faust L, Feldman K, Mattingly SM, Hachen DS, Chawla NV. Deviations from normal bedtimes are associated with short-term increases in resting heart rate. NPJ Digit Med 2020;3:39. [DOI] [PMC free article] [PubMed] [Google Scholar]
- 32.Eagle N, Pentland A (sandy). Reality mining: sensing complex social systems. Pers Ubiquit Comput 2006;10:255–268. [Google Scholar]
- 33.Liu S, Hachen DS, Lizardo O, Poellabauer C, Striegel A, Milenković T. The power of dynamic social networks to predict individuals’ mental health. Pac Symp Biocomput 2020;25:635–646. [PMC free article] [PubMed] [Google Scholar]
- 34.Liu S, Hachen DS, Lizardo O, Poellabauer C, Striegel A, Milenković T. Network analysis of the NetHealth data: exploring co-evolution of individuals’ social network positions and physical activities. Appl Netw Sci 2018;3:45. [DOI] [PMC free article] [PubMed] [Google Scholar]
- 35.Fowler JH, Christakis NA. Dynamic spread of happiness in a large social network: longitudinal analysis over 20 years in the Framingham Heart Study. BMJ 2008;337:a2338. [DOI] [PMC free article] [PubMed] [Google Scholar]