

Abstract
Objectives:
Correlations are made between mainstream cigarette smoke deliveries of individual PAHs over multiple years. Average overall PAH deliveries in mainstream cigarette smoke by study year, mentholation, ring size, and manufacturer are compared.
Methods:
Mainstream smoke deliveries were determined by GC/MS for 14 polycyclic aromatic hydrocarbons (PAHs) from selected cigarettes on the US market in 2002, 2004, 2007, and 2011. The mainstream smoke PAH emissions were measured under international standardization organization (ISO) smoking conditions. Pearson product-moment correlation was used to examine the linear relationship among the PAHs over multiple years.
Results:
A number of the PAH analytes were statistically highly correlated with each other. The overall average for mainstream smoke deliveries of PAHs did not change significantly between study years. Similar levels in average PAH deliveries were seen for mentholated and non-mentholated cigarettes.
Conclusions:
The strong correlations between PAH compounds over multiple years show that a limited set of PAHs can predict deliveries of others with confidence over multiple years. A more limited panel of analytes may be considered when designing studies involving PAH measurements in mainstream smoke.
Keywords: polycyclic aromatic hydrocarbons, PAHs, PAH correlations, mainstream cigarette smoke
Since the 1964 landmark report by the Surgeon General on the health consequences of smoking,1 several smoking constituents have been of interest in addressing the harmful health effects of cigarettes. Most cigarettes sold in the United States (US) are comprised of American tobacco blend mostly made from bright, burley and oriental tobacco types.2 Polycyclic aromatic hydrocarbons (PAHs) are formed primarily through incomplete combustion of organic materials, which include both tobacco as well as cigarette additives, during smoking. These mainstream smoke constituents are a class of organic compounds with multiple fused aromatic rings. Of the more than 500 PAHs found in mainstream cigarette smoke,3,4 16 have been identified as harmful and potentially harmful constituents (HPHCs) by the Food and Drug Administration (FDA).5 Early studies focused on a few compounds such as benzo[a]pyrene (BAP) as the main culprit of cancer.6 Further studies concluded that although BAP was shown to cause cancer, it was not the only contributing factor.7 In addition to PAHs, multiple classes of chemical constituents, such as aldehydes, metals, nitrosamines, and small organics (particularly benzene), are also attributing factors to cancer.8
Previously, our laboratory reported smoke yields of 14 PAHs in 30 brands of domestic cigarettes.9 Other studies have reported PAH mainstream smoke deliveries of cigarettes on the market, both domestic and international.10–12 BAP and benz[a]anthracene (BAA) were measured in mainstream smoke from 26 brand variants of cigarettes from the US market in 2002.13 A high correlation between tar deliveries and BAP and BAA was established with correlation coefficients, R2, of 0.89 and 0.88, respectively, via a quadratic regression curve. Counts14 et al also performed a study in which several analytes were measured in mainstream smoke from 48 brands of Philip Morris USA and Philip Morris International. The only PAH represented in the Counts et al study was BAP and the focus was on linear relationships between various constituent yields. There is a high correlation between mainstream smoke deliveries of BAP and tar, giving R2 values of 0.91 to 0.94 for the 3 smoking regimens tested.
In a previous study, we performed a statistical analysis for a single-year sampling of PAH mainstream smoke emissions from US cigarette brands, showing strong correlations between BAP deliveries and several other PAHs.10 In the current study, we have taken a similar approach and are evaluating PAH mainstream smoke emissions over multiple years to determine consistent linear relationships over time. We focus on the ISO smoking regime to provide consistent comparisons with our historical data; Canadian intense regimen yields were not available for the earlier studies. The correlation between analytes would demonstrate the potential utility of using one PAH analyte as a surrogate for a common trend in the behavior of other analytes, which may be applicable over multiple years. Also, we are investigating historical trends of 14 PAHs analyzed in mainstream smoke from cigarettes purchased in the US market between 2002, 2004, 2007, and 2011.
METHODS
Materials
The cigarettes selected for this study represented a significant portion (>50%) of the US market share for each study year, based on a proprietary database of units sold. This was a convenience sampling and products were purchased from various retail outlets in the metropolitan Atlanta, GA area in 2002, 2004, 2007, and 2011. The total number of brand variants analyzed were 28, 33, 66, and 42 for the years 2002, 2004, 2007, and 2011, respectively. The number of menthol brand variants were 4, 10, 29, and 11 for these years. For example, the 2011 brand variants represented 54% of the US cigarette market, including regular and menthol flavored cigarettes, king and 100mm lengths, and a variety of manufacturers (ie, Brown & Williamson, Commonwealth, Lorillard, Natural American Spirit, Philip Morris, R.J. Reynolds, and Vector Group) with various taste profiles, indicative of the descriptors on the exterior packaging. Other study years had similar portions of the US market represented by the sampling. The taste profiles are representative of the manufacturer’s descriptors in words or color designations on the exterior packaging. We expected tobacco mass and various cigarette engineering parameters such as ventilation and rod length to be major factors in PAH deliveries.
Cigarettes were stored at −70 °C in their original packaging prior to analysis. The 2R4F (2002–2007) and 3R4F (2011) reference cigarettes, purchased from the University of Kentucky, Kentucky Tobacco Research and Development Center (Lexington, KY) served as quality control samples.
Calibration standards were prepared in methanol from 14 individual PAHs obtained from Aldrich Chemical Company (Milwaukee, WI). Analytes included acenaphthylene (ACL), acenaphthene (ACT), anthracene (ANT), benz[a]anthracene (BAA), BAP, benzo[b]fluoranthene (BBF), benzo[e] pyrene (BEP), benzo[k]fluoranthene (BKF), chrysene (CHR), fluoranthene (FLR), fluorene (FLU), naphthalene (NAP), phenanthrene (PHE), and pyrene (PYR). We chose these 14 PAHs for the study because they had readily available standards and internal standards and were of particular health concern, being included on the US-EPA 16 PAH priority pollutants and the NIOSH list of 17 priority PAHs. These 14 PAHs include 6 of the 16 PAHs listed on the FDA Harmful and Potentially Harmful Constituents in Tobacco (HPHC) list (BAA, BBF, BAP, BKF, CHR, and NAP), the single PAH on the FDA HPHC Abbreviated list (BAP), and all of the EU PAH-4 list (which includes BAA, BBF, BAP, and CHR). Of the 14 PAHs analyzed in this study, BAP is on the IARC Group 1 list (carcinogenic to humans); BAA, BBF, BKF and NAP are on the IARC Group 2B list (possibly carcinogenic to humans); and 8 of the other PAHs, ACT, ANT, BEP, CHR, FLR, FLU, PHE, and PYR, are on the IARC Group 3 list (not classifiable as to its carcinogenicity to humans).15
A PAH 13C-labeled internal standard mixture, containing 13 PAH analytes was purchased from Cambridge Isotope Laboratories (Andover, MA). Isotope enriched 13C-labeled BAP was used as a surrogate internal standard for BEP. Cambridge filter pads (CFPs), purchased from Whatman (Maid stone, United Kingdom) were used to collect the mainstream smoke.
Mainstream Smoke Particulate Matter Collection
International Organization for Standardization 3402:1999 guidelines16 were followed for conditioning cigarettes and CFPs at 22 °C and 60% relative humidity for at least 48 hours prior to smoking. Cigarettes were smoked on a Cerulean linear smoking machine ASM-450 (Milton Keynes, UK), with mainstream smoke total particulate matter (TPM) collected on CFPs using the ISO smoking regimen (35 mL puff volume, 2-second puff duration, and 60-second puff interval).17 Three cigarettes were smoked per CFP to a butt length of the filter overwrap plus 3mm. Kentucky reference cigarettes (2R4F, 3R4F) were smoked with each batch for quality control samples.
Sample Preparation
The CFPs were placed in a 15 mL amber vial and spiked with the 13C internal standard mixture. Methanol (10 mL) was added to the vial and shaken on an orbital shaker at 160 rpm for 60 minutes. After extraction, the samples were concentrated to 1 mL with a Zymark Turbovap and cleaned up using a Varian C-18 SPE cartridge (Lake Forest, CA).
Instrumental Analysis
A gas chromatograph mass spectrometer (GC-MS) in selected ion monitoring (SIM) mode was used to separate and detect the analytes. Thermo-Electron (Waltham, Massachusetts) Xcalibur software was used for quantitation from the re-constructed ion chromatograms. An extensive description of the method is provided in a previous publication.9
Data Analysis
Results were exported to SAS Institute (Cary, North Carolina) SAS software Version 9.3 for statistical analysis. Averages of 4–7 replicates were reported for each analyte and each brand variant. Pearson’s product moment correlations18 were calculated between pairs of the PAH analytes as well as averages of individual PAH analytes grouped according to ring size as a function of flavor (menthol or non-menthol), manufacturer, and taste strengths (typically designated by package color).
Pearson’s product moment correlation was performed on each data set to show linear relationships between the different PAH analytes. Pearson’s (r) is a value between +1 and −1 inclusive, where 1 is perfect positive correlation and −1 is perfect negative correlation. If the correlation between 2 analytes is greater than 0, the analytes are positively correlated. Two analytes (x, y) correlate negatively if x and y decrease simultaneously. However, if the correlation between 2 analytes is zero (0), the analytes are considered uncorrelated. If 2 analytes are uncorrelated, then no linear relationship between the 2 analytes exists.
A permutation test was performed for each analyte with the null hypothesis representing the overall average yield between years (ie, 2002 vs 2004, 2002 vs 2007, etc). The Satterthwaite degrees of freedom method19 was used consisting of a 2-tailed distribution. Calculated p values were compared to an alpha of .05 to determine the null hypothesis for acceptance of probable relationship between analytes paired by study years.
RESULTS
General Deliveries
Manufacturer variations by study year.
Average PAH smoke deliveries for the brand variants sampled from different manufacturers by study year were measured (Table 1). Average deliveries here are calculated by summing all 14 PAH measurements from a given manufacturer and dividing that number by the total number of measurements. Lorillard, Philip Morris, and R.J. Reynolds tobacco companies were the only manufacturers represented in all 4 studies. The average PAH smoke deliveries for brand variants sampled from each of these 3 manufacturers were consistent between 2002, 2004, 2007 and 2011. Average PAH smoke deliveries for all 4 study years for Lorillard and Philip Morris were similar at 64.7 and 64.6 nanograms per cigarette (ng/cig), respectively, with R.J. Reynolds brands giving an 11% higher value of 72.0 ng/cig. The average PAH smoke delivery for R.J. Reynolds in 2011 at 82.4 ng/cig contributed to a 15% higher combined average of these 3 manufacturers for 2011 (74.2 in 2011 vs an average of 64.7 ng/cig for the previous years). Note here that particular brand variants were not matched from study to study, so brand variant sampling differences between years can explain some of these differences. Also, mergers and acquisitions among tobacco companies over the past decade have changed ownership of some brands.
Table 1.
Average PAH Deliveries of Select Brand Variants by Manufacturer by Study Year (ng/cig)
| Manufacturer | 2002 | 2004 | 2007 | 2011 |
|---|---|---|---|---|
| Brown & Williamson | 61.2 (5.7 to 91.0) | n/a | n/a | n/a |
| Commonwealth | n/a | n/a | n/a | 91.9 (91.9 to 91.9) |
| Lorillard | 59.0 (28.6 to 81.9) | 64.8 (40.0 to 85.6) | 63.7 (34.9 to 80.2) | 71.2 (49.0 to 80.2) |
| Natural Am Spirit | n/a | n/a | n/a | 185.6 (185.6 to 185.6) |
| Philip Morris | 67.4 (34.1 to 114.1) | 65.6 (31.9 to 88.0) | 56.2 (24.2 to 90.7) | 69.1 (35.1 to 85.1) |
| R.J. Reynolds | 74.7 (53.2 to 102.3) | 67.2 (39.8 to 95.7) | 63.9 (23.1 to 123.8) | 82.4 (9.9 to 143.3) |
| Vector | 61.7 (58.9 to 64.6) | n/a | n/a | n/a |
Note. Ranges of average PAH values for the brands represented are given in parentheses.
Natural American Spirit brand, measured only in the 2011 study, gives significantly higher PAH deliveries than all other brands. Its higher mass of tobacco and its use of flue-cured Virginia tobacco contribute to these high PAH levels, as described in our previous study.10
Average deliveries by year.
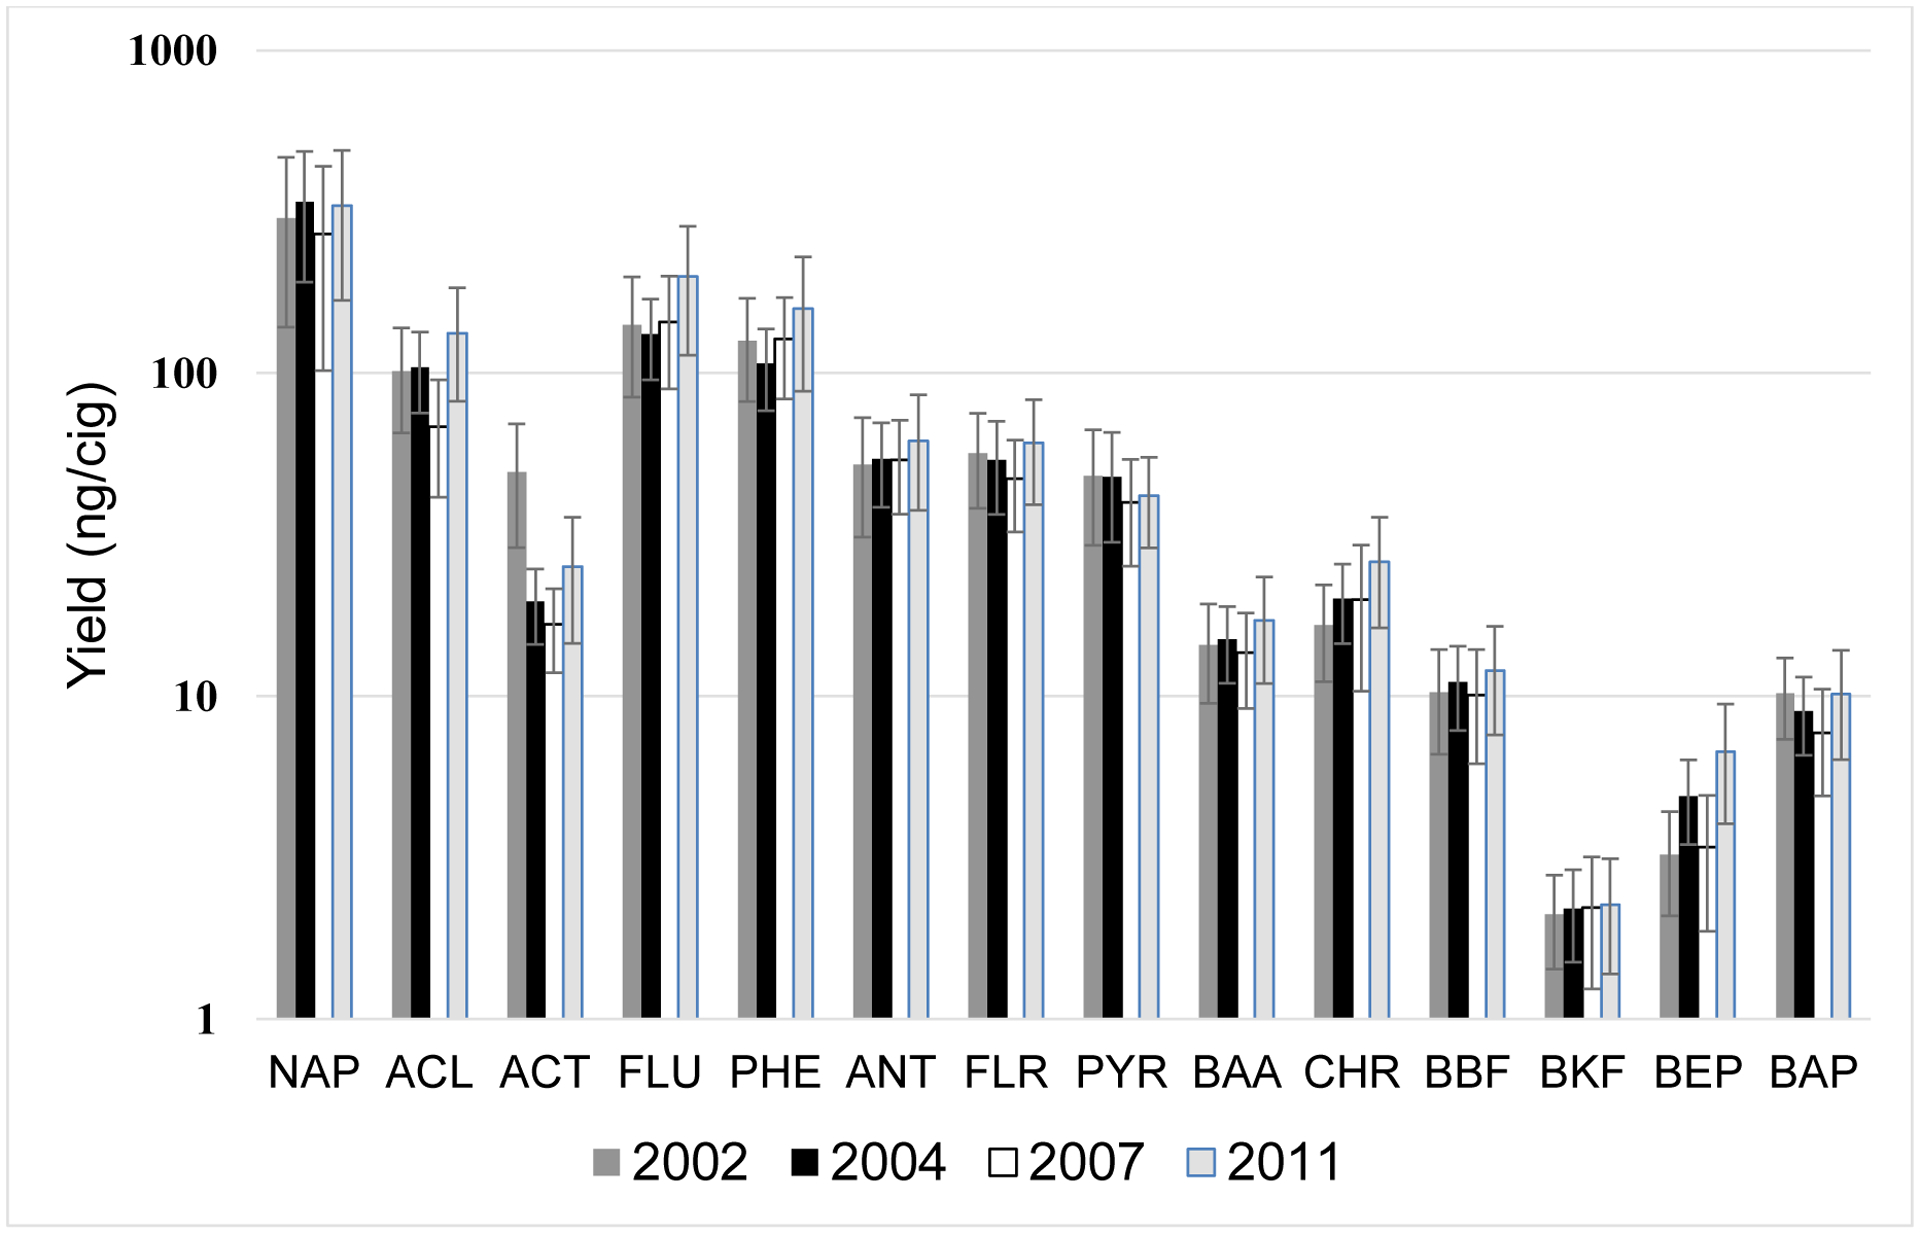
Average deliveries of each of the 14 PAHs for the 4 different study years were compared (Figure 1). The PAHs are listed by GC retention time, which is primarily a function of molecular mass: NAP has 2 rings, ACL to ANT have 3 rings, FLR to CHR have 4 rings, and BBF to BAP have 5 rings. These overall averages are calculated the same as discussed above. Note that a y-axis logarithmic scale is used because of the large dynamic range of analyte deliveries. The error bars, at ±1 standard deviation, are moderately large because of the wide range of PAH yields in the different cigarette brand variants. We observe a qualitatively similar average delivery of each analyte between study years, except for ACL, ACT, and BEP which have relative standard deviations of 25.9%, 53.5%, and 35.6% for the variability between years, respectively. This is in sharp contrast to the relative standard deviations for the yearly averages of the remaining individual analytes of 20% or less.
Figure 1.
Average Individual PAH Values (ng/cig) for All Cigarettes Tested for the 4 Study Years
The permutation test of PAH analyte yields gave a quantitative statistical measure of the difference in individual yields between study years. All permutations of years (2002 vs 2004, 2002 vs 2007, 2002 vs 2011, 2004 vs 2007, 2004 vs 2011, and 2007 vs 2011) had at least one analyte with a p value less than .0001 and at least one analyte with a p value of greater than .90. This indicates that it is highly probable that there is a difference in some PAH levels between years but other PAHs from the same samples showed no statistical differences in yields between the same years. Looking at individual analytes, all analytes had at least one year-to-year permutation that gave a p < .0001 (except for BKF which had all p > .142), indicating statistically significant differences in yields of all analytes except BKF between years. All individual analytes also had at least one year-to-year permutation that gave p > .50 (except for ACT which had all p < .0001), indicating no statistically significant difference for that year-to-year permutation.
The permutation test indicates there is no clear trend in all analyte levels together being statistically different or similar from one study year to another study year. Along the same lines, all individual analytes also showed mixed results except for ACT and BKF, with some analyte levels between year permutations showing statistical differences and some year-to-year permutations showing no statistical differences. We would expect individual brand variants to have much more similar deliveries between years than market averages over many different brand variants because PAH deliveries in mainstream smoke arise primarily from the combustion of the organic material in cigarettes. Similar tobacco weight and cigarette engineering from year-to-year for a given brand variant should give similar PAH yields.
Figure 2 shows Box-and-Whisker plots of individual PAH deliveries for year 2002. The Box-and-Whisker plot provides a graphical presentation of data using 5 measures: the median, the first quartile, the third quartile, and the smallest and largest values in the dataset between the lower and upper inner fences. Note here that the y-axis is a log scale due to extremely high differences in concentrations between different analytes. BKF has the lowest analyte concentration; NAP has the highest concentration. Generally, the measured PAH levels decrease with increased molecular mass, a trend seen in other studies.19 Subsequent study years give similar plots.
Figure 2.
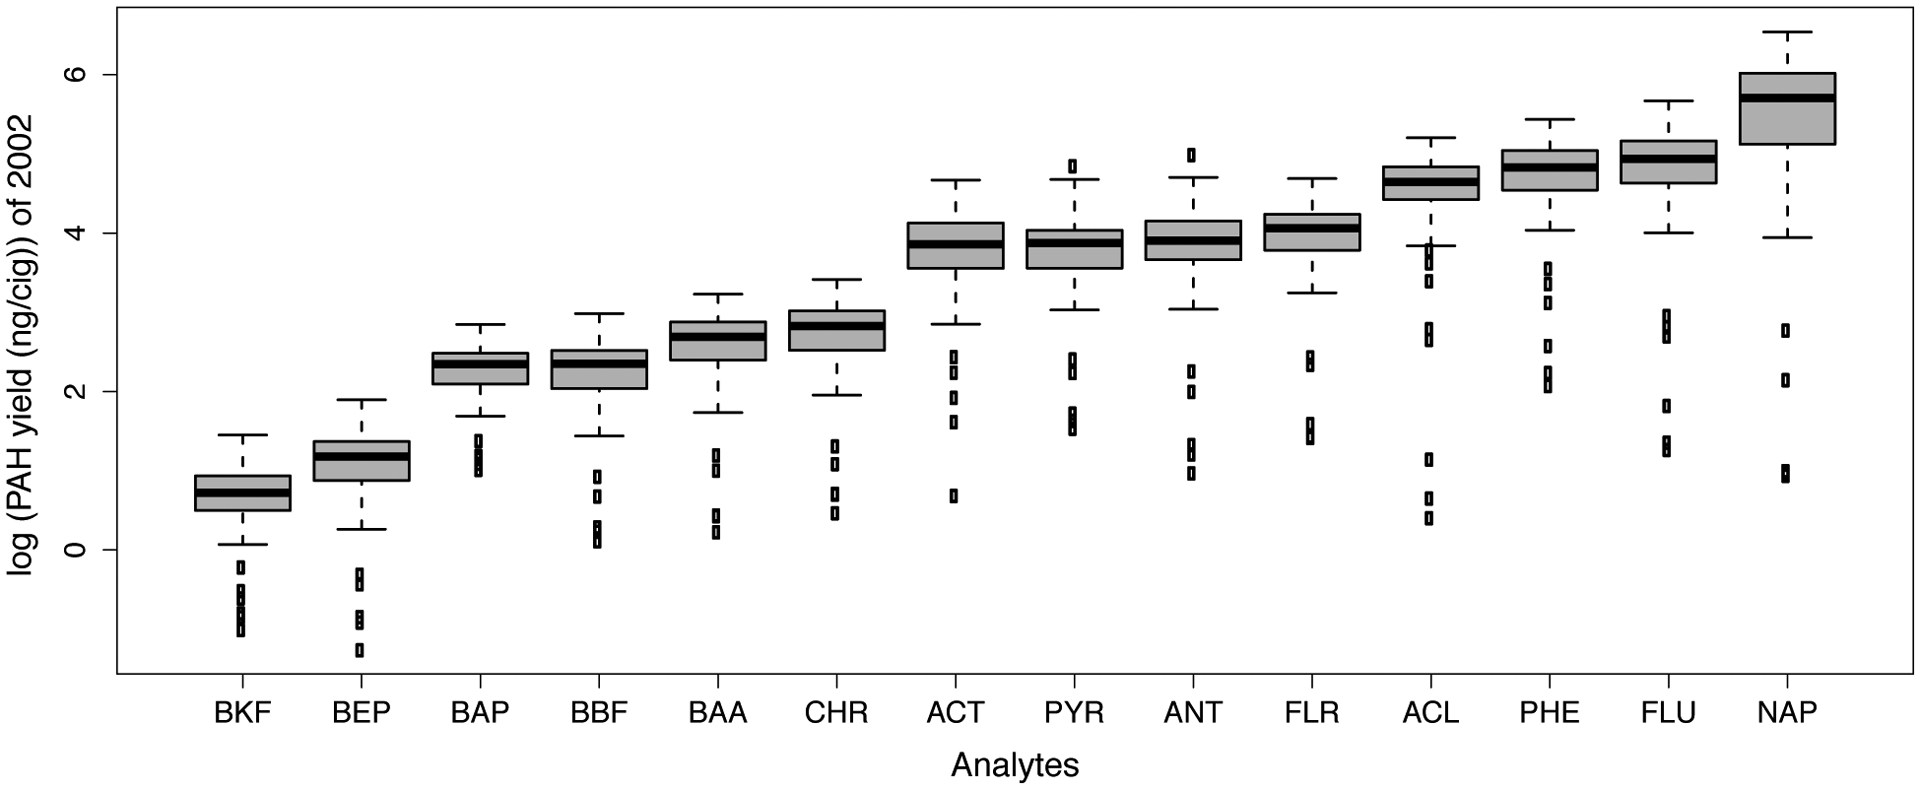
Box-and-Whisker Plots for PAH yield by Analyte for 2002
Deliveries of specific brand variants represented in all study years.
Nine brand variants were sampled in all 4 study years, including Camel Filters, Camel Blue, Kool Menthol, Marlboro Red, Marlboro Gold, Marlboro Silver, Newport Menthol, Salem Menthol, and Winston Gold. Whereas some of the individual brand variant deliveries change from year-to-year, there is no clear trend in PAH deliveries over the different study years. Overall, the average PAH levels change very little between study years.
Average deliveries by ring size in a study year.
PAHs that were analyzed in this study with 3 rings included ACL, ACT, ANT, FLU, and PHE (NAP, with 2 rings, was also included in this category); 4-membered ring PAHs included BAA, CHR, FLR, and PYR; and 5-membered ring PAHs included BAP, BBF, BEP, and BKF. Table 2 shows the average PAH delivery for the sampled cigarettes for ring sizes of 3, 4, and 5, as a function of year, with the average calculated as above except for grouping each set of analytes by ring size individually. Average deliveries vary significantly by ring size, in the order of 3 >> 4 >> 5, a pattern seen in previous studies.9,10
Table 2.
Average PAH Levels by Study Year by Ring Size (ng/cig)
| Ring Size | 2002 | 2004 | 2007 | 2011 |
|---|---|---|---|---|
| 3 | 128.9 (109.9) | 128.3 (116.4) | 113.8 (105.9) | 151.2 (126.4) |
| 4 | 33.9 (22.1) | 33.8 (21.1) | 30.1 (17.4) | 36.5 (21.6) |
| 5 | 6.5 (4.4) | 6.7 (4.1) | 6.1 (3.9) | 7.8 (4.9) |
Note. Standard deviations are given in parentheses.
For the 3-member PAH rings, the permutations of yields for different years show statistically significant differences (p < .05) for all combinations except 2002 compared to 2004. For the 4-member rings, half of the combinations give p values above .05 and half give p values below .05, indicating mixed statistically significant differences between yields in the different year studies. Five-membered ring PAHs give p values of .83 and .38 for 2002 vs 2004 and 2002 vs 2007, respectively, and p values less than .05 for all other year permutations. Overall, the deliveries by ring size show some statistical differences between years but also show some year combinations that showed no statistical difference in the PAH deliveries.
Pearson’s correlation.
Figures 3 and 4 show Pearson’s product moment correlations for years 2002 and 2011. Due to the nature of the dataset, only these study years are amenable to this analysis because the other study years had unequal numbers of replicates for different analytes. All analyte pairings within a study year for these 2 years showed positive correlation with all p values less than .0001. The positive correlations indicate that as one analyte value increases, the other analyte value tends to increase as well. The p values less than .0001 indicate that we have less than a 0.01% probability that the pairing correlations occurred by chance. Alternatively, p values less than .0001 indictate that we are 99.99% confident that our correlations did not occur by chance. Pearson r values range from 0.56 (the NAP/PYR pairing) to 0.98 (the BAP/BAA pairing) for the 2002 data set, with an average r of 0.79. The r value of .98 indicates that the BAP value would be an excellent predictor of the expected BAA value. Even for the smallest Pearson correlation for NAP/PYR pairing, we still have moderately strong prediction value between these analytes.
Figure 3.
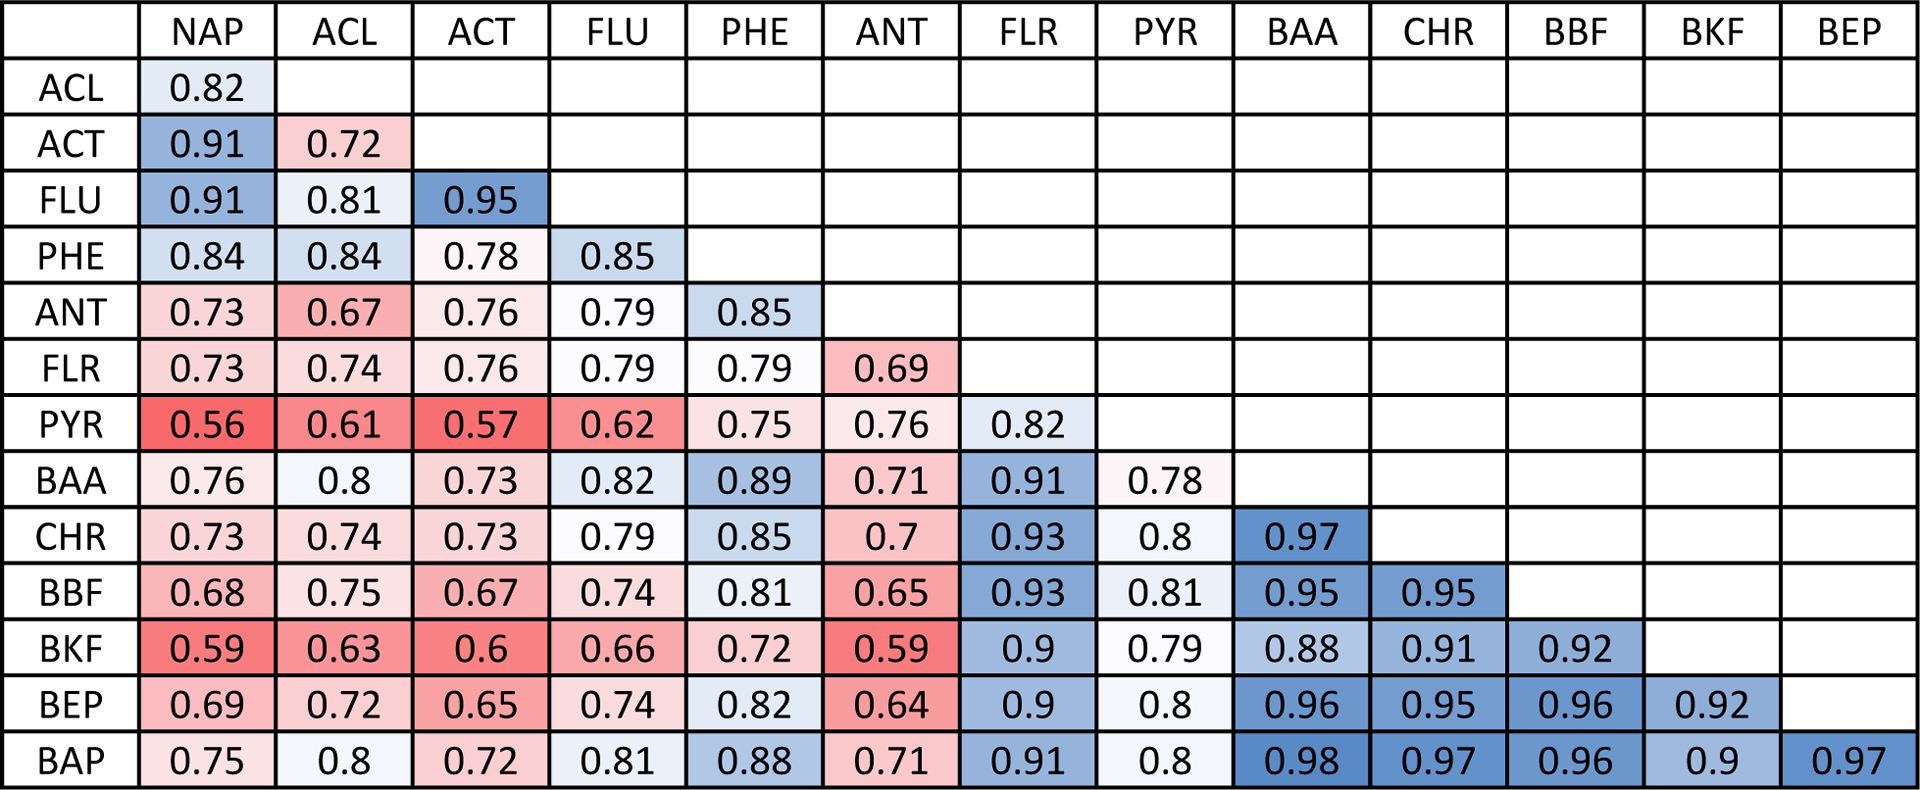
Pearson’s Product Moment Correlation for PAH 2002 Data
Figure 4.
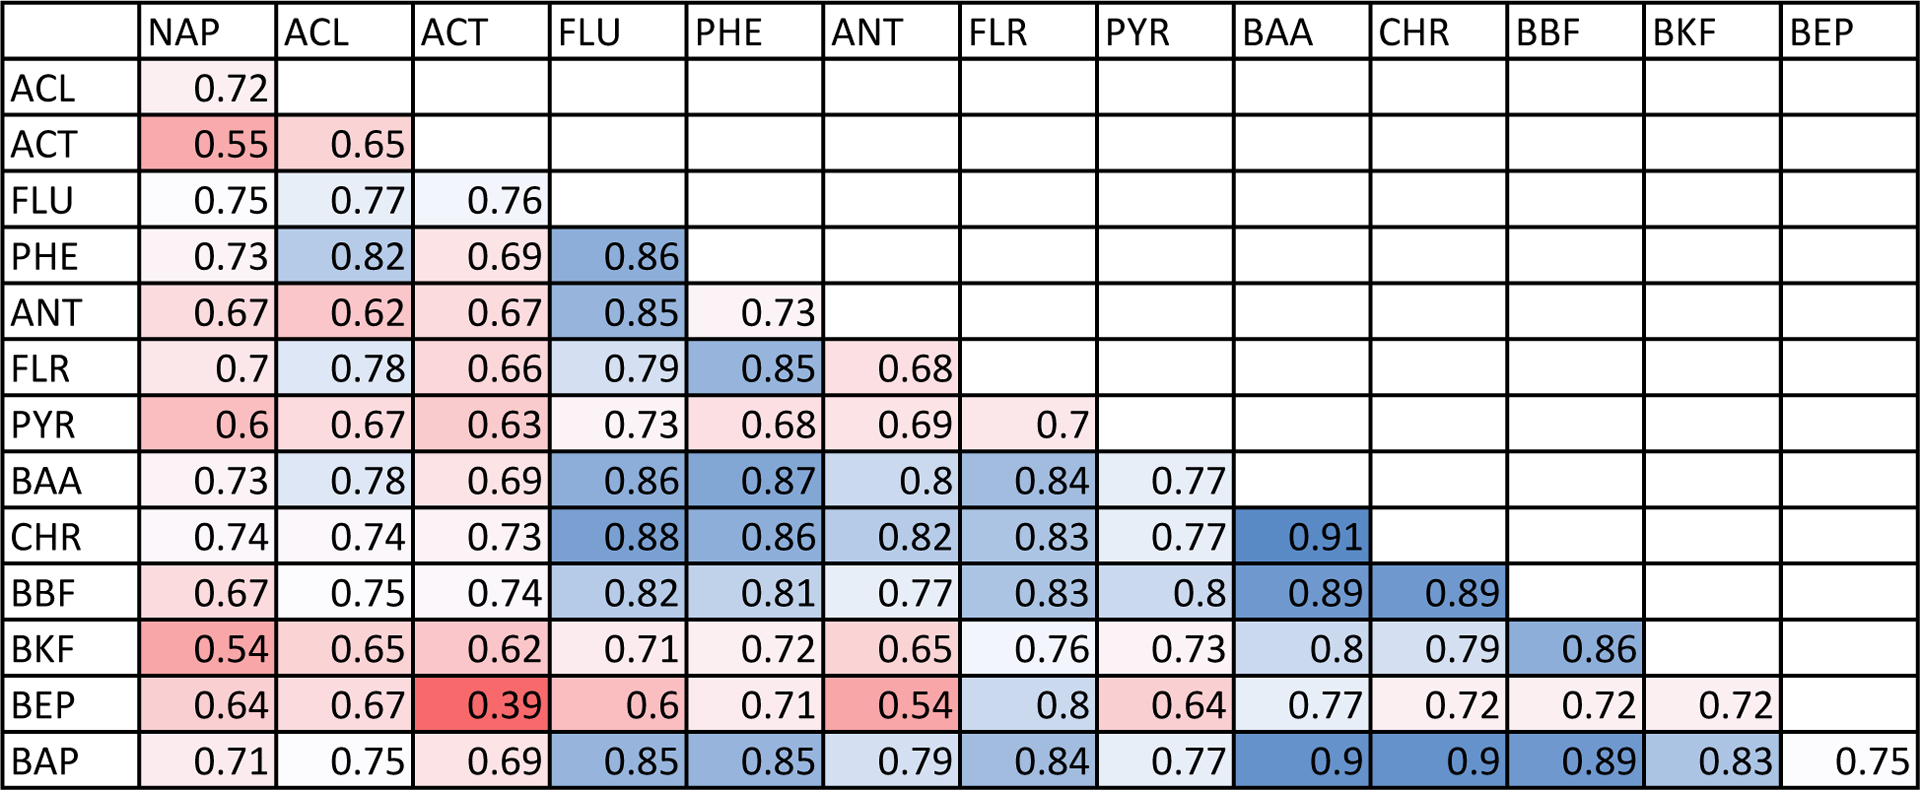
Pearson’s Product Moment Correlation for PAH 2011 Data
According to 2002 statistical data, the 4- and 5-ring PAHs FLR, BAA, CHR, BBF, BEP, and BAP had linear relationships (Pearson product moment correlations r > .90) for all pairings with each other and could serve as excellent alternative surrogates of PAH yield between these analytes. The smaller ring sized PAHs NAP, ACT, and FLU also had r > .90 for pairings between themselves and could serve as excellent surrogates of yield for each other as well.
For the ability of an individual analyte to predict levels of other analytes in 2002, BAA, BAP, CHR, BBF, FLR, BEP, and PHE have average r values greater than 0.80. ANT had the lowest average r value of the analytes, 0.71. For the 2011 data set, BAA, BBF, and BAP had average r values greater than 0.80; ACT and NAP had the lowest average r values, at 0.66 and 0.67, respectively.
Flavoring
Menthol vs non-menthol by year.
We do not expect menthol to have much effect on PAH deliveries because the main factors in PAH deliveries in mainstream cigarette smoke are tobacco weight and cigarette ventilation. Having the data available, we decided to see if we would see unexpected differences between menthol and non-menthol brand variants. Table 3 shows the average PAH deliveries by study year and ring size for menthol and non-menthol cigarettes. The first lines indicate overall average PAH deliveries by year, whereas the last 6 lines show averages by year for different ring sizes. Differences in the overall PAH delivery between menthol and non-menthol cigarettes was 13.0 ng/cig for 2002, 20% higher for menthol cigarettes. This difference was not statistically significant at the alpha = .01 level, as discussed below. Subsequent years had differences in overall PAH analyte levels between menthol and non-menthol cigarettes of 3.0 ng/cig or smaller, corresponding to differences of less than 6%.
Table 3.
Average PAH Delivery by Year and Ring Size for Menthol and Non-menthol Cigarettes (ng/cig)
| Ring Size | Type | 2002 | 2004 | 2007 | 2011 |
|---|---|---|---|---|---|
| All PAHs | Menthol | 77.6 (56 to 83) | 67.4 (44 to 86) | 61.4 (7.0 to 112) | 78.0 (46 to 115) |
| Non-menthol | 64.6 (5.7 to 114) | 65.6 (26 to 96) | 58.4 (17 to 124) | 77.3 (9.9 to 186) | |
| 3-ring PAHs | Menthol | 151 (110 to 200) | 131 (86 to 165) | 117 (13 to 219) | 150 (85 to 225) |
| Non-menthol | 124 (9 to 239) | 127 (46 to 186) | 111 (30 to 253) | 152 (17 to 375) | |
| 4-ring PAHs | Menthol | 38 (28 to 49) | 35 (20 to 47) | 31 (5.3 to 53) | 40 (27 to 51) |
| Non-menthol | 33 (4.7 to 52) | 33 (18 to 53) | 29 (12 to 50) | 35 (7.1 to 72) | |
| 5-ring PAHs | Menthol | 7.2 (5.2 to 9.1) | 6.9 (4.2 to 8.7) | 6.4 (1.0 to 10) | 7.2 (4.9 to 11.8) |
| Non-menthol | 6.3 (1.5 to 10) | 6.6 (3.9 to 10) | 5.9 (2.4 to 10) | 7.5 (1.5 to 15) |
Note. Ranges for the average PAH delivery for the brands are given in parentheses.
Non-menthol PAH averages for 2002, 2004, and 2007 are similar, with 2011 deliveries being approximately 23% higher than the other year yields. Measured PAH values for menthol-flavored cigarettes were lowest for year 2007, 17% lower than the average of the menthol cigarette PAH values from other years. Considering the differences in brand variant selection between study years, the overall PAH yields are extremely similar between menthol and non-menthol cigarettes and between study years.
The p values for menthol vs non-menthol by year and ring size.
Using a similar permutation test as above to compare differences in average PAH levels between menthol and non-menthol cigarettes within 3-, 4-, and 5-ring PAHs and within a given year, p values ranged from .0001 (statistically significant difference between menthol and non-menthol cigarettes) for 5-ring PAHs in 2011 to 0.737 (no statistical difference) for 3-ring PAHs in 2011. Only 2011 4-ring and 5-ring gave statistically significant p values less than .01. All of the other year/ring size combinations showed no statistically significant differences (at the alpha = .01 level) in the PAH levels between menthol and non-menthol cigarettes.
DISCUSSION
Comparing the data sets, which included measurements in 2002, 2004, 2007, and 2011, showed similar PAH deliveries in menthol cigarettes and non-menthol cigarettes in the US market. For most PAHs, the overall average individual PAH levels did not change significantly between study years.
Mainstream smoke deliveries of PAHs from cigarettes in the US market over multiple years were determined. Pearson’s product moment correlations were determined for the 14 PAHs, showing similarities in correlations between these analytes over multiple years, useful in determining whether one PAH or a limited set of PAHs might be able to predict deliveries of others with confidence over multiple years.
Pearson’s product moment correlations for 2 study years showed positive correlation with all p values less than .0001. For 2002, FLR, BAA, CHR, BBF, BEP, and BAP had strong linear relationships (Pearson product moment correlations r > .90) for all parings and could serve as potential alternative surrogates of PAH yield for each other. For the 2011 data set, BAA, BBF, and BAP had average r values greater than 0.80. These strong predictive values over different years indicate that a more limited panel of analytes may be considered when designing studies involving ISO PAH measurements in mainstream smoke.
With the current American blend of cigarette styles, we show that BAP, traditionally used as a surrogate for all PAHs, serves as an excellent surrogate particularly for our other 5-membered PAH analytes (BBF, BKF, and BEP), with an average Pearson correlation of r = 0.89 over multiple years. Interestingly, and unexpectedly, BAP, with 5 rings, also gave the highest average Pearson correlation (r = 0.89) for the 4-ring PAHs (FLR, PYR, BAA, and CHR), even higher than the individual analytes in this group. There are noticeably lower (but still significant) correlations between the 2- and 3-ring PAHs in this study. Among the 3-ring PAHs in this study, FLU gave the highest average correlation with the other 3-ring PAHs (r = 0.83). Not surprising due to it having only 2 rings, NAP had the lowest average Pearson correlation with the other PAH analytes (r = 0.71). Because NAP shows lower correlations with the other PAHs, for a study with limited analytical capabilities, measurement of only 3 polycyclic aromatic hydrocarbons, NAP, FLU, and BAP would provide an excellent gauge of all 14 of the PAHs analyzed in this study: NAP because it shows lower correlation than the others, FLU to represent the 3-ring PAHs, and BAP to represent the 4- and 5-ring PAHs.
The average PAH deliveries for cigarettes from 3 manufacturers (RJ Reynolds, Lorillard, and Philip Morris) represented in all study years show no consistent trends from 2002 to 2011. Natural American Spirit, measured only in the 2011 study, gives significantly higher PAH deliveries than all other brand variants sampled in this study.
Limitations
In hindsight, due to the high correlation between tar and PAHs, the inclusion of tar with the PAH correlation measurements would have been useful in this study. Unfortunately, we did not perform tar measurements alongside the PAH measurements. Whereas tar has been used historically as a reasonable surrogate for a number of analytes and is cheaper and easier than many other measures that might be used for health impact studies, it does not provide individual specific constituent levels. Differences in cigarette product design could alter the PAH profile, reducing the utility of tar as a surrogate and increase the need for analysis of multiple analytes. This study is based on historical mainstream cigarette smoke PAH data where brands were obtained by convenience sampling. No effort was made to match brand variants that were sampled from year-to-year. Because of this, averages between years will be influenced by this sampling. For instance, if a higher proportion of full-flavor cigarettes were sampled one study year, we would expect average PAH levels to be higher. Only 9 of the brand variants were sampled for all 4 study years, so we have a limited number of these to compare directly for all study years. The chosen brands did, however, represent a significant portion of the US market (>50%), so overall averages still provide insight into statistical correlations and trends in time of PAH mainstream smoke deliveries. Vu et al10 looked at mainstream smoke PAH yields from cigarettes using both ISO and Canadian intense PAH yields, showing slightly weaker correlations between PAH constituents for the Canadian intense regime. This statistical analysis is limited to data collected using the ISO smoking regimen because we did not have the Canadian Intense data for earlier study years. However, this study shows ISO correlations over multiple years spanning from 2002 to 2011.
IMPLICATIONS FOR TOBACCO REGULATION
Correlations between these analytes over multiple years were shown, which is useful in determining whether a limited set of PAHs can predict deliveries of others with confidence over multiple years. The strong prediction values between analytes over different years indicate that a more limited panel of analytes may be considered when designing studies involving PAH measurements in mainstream smoke. Looking at cigarettes with the current American-blend cigarette style, studies with limited analytical capabilities and/or limited budgets, this study indicates that the measurement of NAP, FLU, and BAP would provide an excellent gauge of all 14 of the PAHs analyzed here. Similar average PAH deliveries in mainstream smoke were seen for mentholated and non-mentholated cigarettes. Between the study years of 2002 and 2011, few statistically significant changes in PAH deliveries were seen.
Acknowledgements
The findings and conclusions in this report are those of the authors and do not necessarily represent the official position of the US Centers for Disease Control and Prevention or US Food and Drug Administration. Use of trade names and commercial sources is for identification only and does not imply endorsement by the US Department of Health and Human Services. This study was funded through an interagency agreement by the US Food and Drug Administration and by internal funds of the US Centers for Disease Control and Prevention and the US Food and Drug Administration.
Abbreviations
- ACL
acenaphthylene
- ACT
acenaphthene
- ANT
anthracene
- BAA
benz[a]anthracene
- BAP
benzo[a]pyrene
- BBF
benzo[b]fluoranthene
- BEP
benzo[e]pyrene
- BKF
benzo[k]fluoranthene
- CFP
Cambridge filter pad
- CHR
chrysene
- FLR
fluoranthene
- FLU
fluorene
- GC/MS
gas chromatography/mass spectrometry
- ISO
International Organization for Standardization
- NAP
naphthalene
- PAHs
polycyclic aromatic hydrocarbons
- PHE
phenanthrene
- PYR
pyrene
Footnotes
Human Subjects Statement
No human participants were involved in this research.
Conflict of Interest Statement
None.
References
- 1.US Department of Health, Education, and Welfare (US-DHEW). Smoking and Health. Report of the Advisory Committee to the Surgeon General of the Public Health Service Atlanta, GA: USDHEW, Public Health Service, US Centers for Disease Control and Prevention; 1964. Available at: https://profiles.nlm.nih.gov/NN/B/B/M/Q/. Accessed April 22, 2018. [Google Scholar]
- 2.Hoffmann D, Hoffmann I. The changing cigarette, 1950–1995. J Toxicol Environ Health, Part A. 1997;50(4):307–364. [DOI] [PubMed] [Google Scholar]
- 3.Rodgman A, Perfetti TA. The composition of cigarette smoke: a catalogue of the polycyclic aromatic hydrocarbons. Beitrage zur Tabakforschung International. 2006;22:13–69. [Google Scholar]
- 4.Rodgman A, Perfetti TA. The Chemical Components of Tobacco and Tobacco Smoke. Boca Raton, FL: CRC Press; 2009:1–110. [Google Scholar]
- 5.Harmful and potentially harmful constituents in tobacco products and tobacco smoke; established list. Fed Regist. 2012;77(64):20034–20037. [Google Scholar]
- 6.Wynder EL, Hoffmann D. Some practical aspects of the smoking-cancer problem. N Engl J Med. 1960;262:540–545. [DOI] [PubMed] [Google Scholar]
- 7.Kier LD, Yamasaki E, Ames BN. Detection of mutagenic activity in cigarette smoke condensates. Proc Natl Acad Sci U S A. 1974;71(10):4159–4163. [DOI] [PMC free article] [PubMed] [Google Scholar]
- 8.Fowles J, Dybing E. Application of toxicological risk assessment principles to the chemical constituents of cigarette smoke. Tob Control. 2003;12:424–430. [DOI] [PMC free article] [PubMed] [Google Scholar]
- 9.Ding YS, Trommel JS, Yan XJ, et al. Determination of 14 polycyclic aromatic hydrocarbons in mainstream smoke from domestic cigarettes. Environ Sci Technol. 2005;39:471–478. [DOI] [PubMed] [Google Scholar]
- 10.Vu AT, Taylor KM, Holman MR, et al. Polycyclic aromatic hydrocarbons in the mainstream smoke of popular U.S. cigarettes. Chem Res Toxicol. 2015;28(8):1616–1626. [DOI] [PMC free article] [PubMed] [Google Scholar]
- 11.Ding YS, Yan XJ, Jain RB, et al. Determination of 14 polycyclic aromatic hydrocarbons in mainstream smoke from U.S. brand and non-U.S. brand cigarettes. Environ Sci Technol. 2006;40:1133–1138. [DOI] [PubMed] [Google Scholar]
- 12.Yershova K, Yuan JM, Wang R, et al. Tobacco-specific N-nitrosamines and polycyclic aromatic hydrocarbons in cigarettes smoked by the participants of the Shanghai Cohort Study. Int J Cancer. 2016;139(6):1261–1269. [DOI] [PMC free article] [PubMed] [Google Scholar]
- 13.Counts ME, Hsu FS, Tewes FJ. Development of a commercial cigarette “market map” comparison methodology for evaluating new or non-conventional cigarettes. Regul Toxicol Pharmacol. 2006;46:225–242. [DOI] [PubMed] [Google Scholar]
- 14.Counts ME, Morton MJ, Laffoon SW, et al. Smoke composition and predicting relationships for international commercial cigarettes smoked with three machine-smoking conditions. Regul Toxicol Pharmacol. 2005;41:185–227. [DOI] [PubMed] [Google Scholar]
- 15.International Agency for Research on Cancer, IARC Monographs on the Evaluation of the Carcinogenic Risk of Chemicals to Humans. Available at: http://monographs.iarc.fr/ENG/Classification/latest_classif.php. Accessed April 18, 2018.
- 16.International Organization for Standardization (ISO). ISO 3402 Tobacco and Tobacco Products – Atmosphere for Conditioning and Testing. Geneva, Switzerland: ISO; 1999:1–4. [Google Scholar]
- 17.International Organization for Standardization (ISO). ISO 3308 Routine Analytical Cigarette-Smoking Machine-Definitions and Standard Conditions. Geneva, Switzerland: ISO; 2000. [Google Scholar]
- 18.Pearson K. Notes on regression and inheritance in the case of two parents. Proc R Soc Lond. 1895;58:240–242. [Google Scholar]
- 19.Satterthwaite FE. An approximate distribution of estimates of variance components. Biometrics. 1946;2:110–114. [PubMed] [Google Scholar]
- 20.Tobiszewski M, Namiesnik J. PAH diagnostic ratios for the identification of pollution emission sources. Environ Pollut. 2012;162:110–119. [DOI] [PubMed] [Google Scholar]