

Abstract
Metabolic syndrome is a cluster of symptoms including excessive body fat and insulin resistance which may lead to obesity and type 2 diabetes (T2D). The physiological and pathological cross-talk between T2D and obesity is crucial and complex, meanwhile, the genetic connection between T2D and obesity is largely unknown. The purpose of this study is to identify pleiotropic SNPs and genes between these two associated conditions by applying genetic analysis incorporating pleiotropy and annotation (GPA) on two large genome-wide association studies (GWAS) data sets: a body mass index (BMI) data set containing 339,224 subjects and a T2D data set containing 110,452 subjects. In all, 5182 SNPs showed pleiotropy in both T2D and obesity. After further prioritization based on suggested local false discovery rates (FDR) by the GPA model, 2146 SNPs corresponding to 217 unique genes are significantly associated with both traits (FDR < 0.2), among which 187 are newly identified pleiotropic genes compare with original GWAS in individual traits. Subsequently, gene enrichment and pathway analyses highlighted several pleiotropic SNPs including rs849135 (FDR = 0.0002), rs2119812 (FDR = 0.0018), rs4506565 (FDR = 1.23E–08), rs1558902 (7.23E–10) and corresponding genes JAZF1, SYN2, TCF7L2, FTO which may play crucial rol5es in the etiology of both T2D and obesity. Additional evidences from expression data analysis of pleiotropic genes strongly supports that the pleiotropic genes including JAZF1 (p = 1.39E–05 and p = 2.13E–05), SYN2 (p = 5.49E–03 and p = 5.27E–04), CDKN2C (p = 1.99E–12 and p = 6.27E–11), RABGAP1 (p = 3.08E–03 and p = 7.46E–03), and UBE2E2 (p = 1.83E–04 and p = 8.22E–03) play crucial roles in both obesity and T2D pathogenesis. Pleiotropic analysis integrated with functional network identified several novel and causal SNPs and genes involved in both BMI and T2D which may be ignored in single GWAS.
Introduction
Metabolic syndrome (MetS) is a cluster of symptoms including excessive body fat, insulin resistance, glucose intolerance, increased blood pressure, hyperlipidemia, and hyperglycemia, all of which increase the risk of serious diseases such as central obesity and type 2 diabetes (T2D) [1,2]. Over the past two decades, the number of people with some degree of MetS has increased tremendously [3]. Although the worldwide prevalence of MetS ranges from 10% to up to 84% due to different hereditary backgrounds and living environments [4, 5], the International Diabetes Federation evaluates that a quarter of adult population in the world are suffering MetS [3].
MetS-associated diseases cause a high rate of morbidity and mortality in a considerable portion of the population. For instance, high blood pressure was supported to be the number one risk factor which accounts for 9.4 million mortalities and 7% morbidity worldwide in 2010 [6]. Both obesity and T2D could increase the risk of cardiovascular morbidity and mortality [7, 8]. As the most prevalent symptoms of MetS, obesity and T2D are becoming serious health problems mainly characterized by excessive body fat and insulin resistance, respectively. The body mass index (BMI), defined as weight divided by height squared (kg/m2), is used to qualify the amount of fat tissue mass and is widely used in both research and clinical settings regarding obesity. T2D is a long-term metabolic disorder characterized mainly by high blood sugar, insulin resistance, and relative lack of insulin. Both environmental and genetic factors play significant roles in the development of obesity and T2D [9]. Changes in the global economy have altered the average person’s lifestyle in both diet and physical activities, which in combination with hereditary factors have led to a worldwide increase in obesity and T2D [1]. The global prevalence of obesity has nearly doubled from 1980 to 2008 [10]. Meanwhile, until 2010, an estimated 285 million people worldwide had diabetes mellitus, the number may reach up to 439 million by 2030 [11], 90% of whom had T2D [12]. The physiological and pathological cross-talk between T2D and obesity is complex; for example, obesity is a potential inducer of numerous serious diseases including T2D, but T2D may also cause unexplained weight loss [13].
Genome-wide association studies (GWAS) have been performed in T2D and obesity individually, which identified a number of SNPs/loci contributing to these two traits and provided a large amount of GWAS data [14, 15]. However, the specific genetic connection between T2D and obesity is largely unknown. Accumulating evidence from GWAS suggests that different complex diseases often share common genetic risk bases [16]. Pleiotropy is defined as one gene influencing two or more phenotypic traits. A mutation in a pleiotropic gene may influence two or more traits simultaneously [17, 18]. In this study, we applied a recently developed novel genetic analysis incorporating pleiotropy and annotation (GPA) model on two large GWAS data sets for pleiotropic analysis for obesity and T2D. GPA can increase statistical power to identify common risk variants through joint analysis of summary statistics of multiple GWAS data sets for different traits [16].
Gene-based pathway and network analysis can provide more topological information between genes and corresponding traits, which allow us to better understand the physiology and pathology of T2D and obesity. Pathways/modules generated by network analysis give us a comprehensive view between causal genes and biological process [19]. There are several bioinformatics tools such as Database for Annotation, Visualization and Integrated Discovery (DAVID), Search Tool for the Retrieval of Interacting Genes/Proteins (STRING), and Cytoscape can be selected for multiple function of pathway and network analysis [20, 21]. Specific description of the above bioinformatics tools can be find in our previous publication [22, 23].
In this study, GWAS-based pleiotropic analysis, integrated with gene enrichment, and pathway analysis shed light on the genetic link between T2D and obesity. In order to gain additional and functional mechanistic support, we performed expression data analysis of pleiotropic genes.
Materials and methods
GWAS data sets
The summary statistical results of two GWAS data sets were used in this study. The T2D GWAS data set was generated from a trans-ethnic meta-analysis in 110,452 subjects from four ancestries including 12,171 cases and 56,862 controls of European ancestry; 6952 cases and 11,865 controls of East Asian ancestry; 5561 cases and 14,458 controls of South Asian ancestry; and 1804 cases and 779 controls of Mexican and Mexican American ancestry (a total of 26,488 cases and 83,964 controls) [15], which contains a total number of about 2.9 million SNPs. The data set was downloaded from DIAbetes Genetics Replication and Meta-analysis Consortium (http://diagram-consortium.org/downloads.html). The BMI data set was generated from meta-analysis of 82 GWAS and 43 metabochip studies in 339,224 individuals [14], which contains a total of about 2.6 million SNPs. The data set was downloaded from the Genome-scale Integrated Analysis of gene Networks in Tissues Consortium (https://www.broadinstitute.org/collaboration/giant/index.php/GIANT_consortium_data_files#GIANT_consortium_2012-2015_GWAS_Metadata_is_Available_Here_for_Download).
GWAS data sets manipulation
The T2D and BMI GWAS data sets of summary statistics contain a total of about 2.9 and 2.6 million SNPs, respectively. As required by the GPA model, only 2,514,745 overlapped SNPs and the corresponding p values in both traits were used for further analyses. The overlapped SNPs make up a large proportion and contain almost all the potentially significant SNPs (p < 0.05) in each single GWAS data set.
GPA model and pleiotropic SNPs evaluation
In this study, we used the GWAS data sets for two traits: T2D and obesity. Based on the hypothesis testing of genome-wide SNPs, we used their p values (summary statistics for the association testing of individual SNPs) from these two data sets. GPA assumes that the p values from null SNPs (SNPs without true effects) and non-null SNPs follow the uniform distribution and the beta distribution, respectively. Then, we fit the GPA model and evaluated the pleiotropy of SNPs by implementing association mapping with appropriate command. Comparing with similar methods, including conditional false discovery rates (cFDR) and linear mixed models, there are three main advantages (innovations) of GPA method: (1) GPA only needs the summary statistics (p values) as its input which could simplify the analysis procedure and make it popularly applicable. (2) GPA provides more accurate, powerful, and deeper analysis to evaluate local FDR for each SNP, the proportion of SNPs associated with phenotypes, and the overall effect strength of the associated SNPs. (3) With strictly statistical control and integrative consideration of linkage disequilibrium and expression quantitative trait loci, GPA model could accurately and robustly detected risk pleiotropic SNPs for corresponding phenotypes. A detailed description of the GPA model can be found in the original publication [16].
SNPs further prioritized based on false discovery rates (FDR)
Pleiotropic SNPs can be further prioritized based on their local FDR. For a single GWAS, the FDR is defined as the probability that the jth SNP belongs to the null group given its p value:
| (1) |
For joint analysis of two GWAS data sets, the pleiotropic SNP is defined as the jth SNP associated with both phenotypes:
| (2) |
The specific description of FDR calculation was presented in the original paper [16].
Pleiotropic SNPs annotation
The pleiotropic SNPs were annotated using the online SNP and CNV Annotation Database (SCAN) (http://www.scandb.org/newinterface/index.html). The online annotation tool provided detailed information including chromosome, position, alleles, and genes for each specific SNP.
Gene-based functional annotation, pathway analysis, and gene-disease association analysis
Based on those genes corresponding to pleiotropic SNPs, we performed gene enrichment and functional annotation analysis in the DAVID online system. A total of 227 pleiotropic genes were imported into the online tool for functional annotation and gene enrichment analysis. Comprehensive functional information for all of these genes enriched in specific terms was obtained. In addition, we performed pathway analysis based on all pleiotropic genes using the KEGG database. For the most significant pleiotropic genes (FDR < 0.01), we performed gene interaction analysis and constructed their interaction network using the STRING online tool. Furthermore, gene-disease associations have been observed based on DisGeNET database (https://www.disgenet.org/), the network has been constructed using Cytoscape. Specific descriptions of pathway and network analysis can be found in our previous publication [22, 23].
Expression data analysis of pleiotropic genes
We further explored the potential functions of the identified pleiotropic genes in a comprehensive gene expression data set containing 200 subjects [24]. The data set was downloaded from Gene Expression Omnibus with the accession number GSE32512. Total RNA was isolated from all samples. Transcriptional profiling was performed based on Illumina Human HT-12 v3 Expression BeadChip. The correlations between gene expression levels and different phenotypes including BMI and insulin activities (insulin resistance and insulin sensitivity) were evaluated [24]. We assessed the associations between the pleiotropic genes and the BMI and insulin resistance phenotypes to determine whether the pleiotropic genes identified in our study are potentially associated with both obesity and T2D phenotypes in gene expression data.
Results
Pleiotropic SNPs and further prioritized base on FDR value
Based on the pleiotropy estimation and FDR calculation, 5182 SNPs were found to be related to both T2D and BMI. All of the SNPs can be further prioritized by setting FDR q values < 0.2 as a significance cutoff. In all, 2277 out of 5182 SNPs showed significant pleiotropy in both traits. The distribution of all the pleiotropic SNPs is shown in the Manhattan plot using FDR value as the Y-axis (Fig. 1).
Fig. 1.

Manhattan plot of pleiotropic SNPs. In all, 5182 SNPs showed pleiotropy in T2D and BMI. Two cutoff line: blue line (FDR = 0.2, the recommended cutoff line in GPA model); red line (FDR = 0.01)
Pleiotropic SNPs annotation
In all, 5182 pleiotropic SNPs were annotated to a total of 467 genes. Corresponding to the 2227 significant pleiotropic SNPs (FDR < 0.2), 217 genes were identified as pleiotropic genes (Supplementary Data set 1). For the original GWAS data sets in individual traits, 549 and 2051 SNPs corresponding to 55 and 124 genes reached significance in GWAS level (p < 5E–8) for T2D and BMI, respectively. In our pleiotropic analysis, 2277 SNPs corresponding to 217 genes were identified as pleiotropic SNPs/genes (FDR < 0.2). By comparing with the original results, we found that within the 217 pleiotropic genes, 30 are overlapped with the original GWAS results and 187 are newly identified pleiotropic genes (Fig. 2).
Fig. 2.
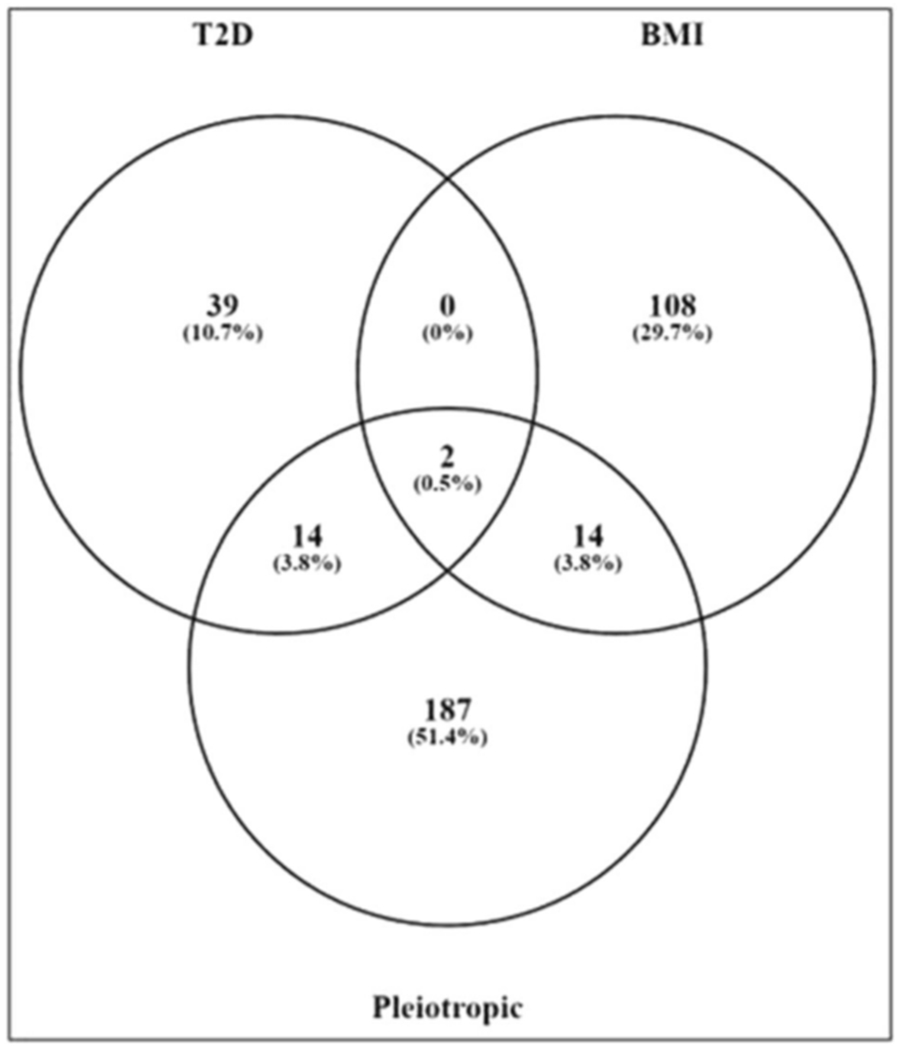
Comparison with original GWAS in individual traits. By comparing our results with original GWAS in single trait, 30 genes are significant in our study and original studies and 187 genes are newly identified pleiotropic genes
Integrated gene set enrichment, pathway analysis, and gene-disease association analysis
Corresponding to the total 2277 pleiotropic SNPs, 217 pleiotropic genes were imported into the DAVID online tool for functional annotation and gene enrichment analysis. With an integrated consideration of statistical results and physiological features, we listed the top 10 terms from biological function classification (Table 1). As expected, most of the pleiotropic genes identified in this study were enriched in metabolic-related terms such as “proteolysis,” “positive regulation of macromolecule metabolic process,” and “positive regulation of biosynthetic process.” Additionally, we evaluated the associations between pleiotropic genes and genetic diseases. We list all related diseases with p < 0.05 in Table 2. Six out of 10 terms are associated with diabetes or obesity. Eighteen pleiotropic genes are enriched in T2D (p = 3.82E–06) and 7 genes are enriched in obesity (p = 1.91E–02). Several genes such as SREBF1, CRHR2, FTO, and PPARG show pleiotropy in both traits. Pathway analysis based on the KEGG database indicated that numerous genes including CRHR2 and MAPK1 are involved in metabolism-related pathways such as “type 2 diabetes mellitus,” “ubiquitin mediated proteolysis,” and “maturity onset diabetes of the young” (Table 3). Network analysis and reconstruction based on the most significant pleiotropic genes (FDR < 0.01) provided insight into the interactions between those genes (Fig. 3). Gene-disease association study indicated that 91, 78, and 48 pleiotropic genes are associated with obesity, diabetes, and both syndromes, respectively (Fig. 4). The results supported that pleiotropic analysis using GPA method could reveal more novel and biologically significant genes involved in multiple syndromes.
Table 1.
Top 10 biological function terms (count of enriched pleiotropic gene)
| Terms | Count | p value |
|---|---|---|
| GO:0006508: proteolysis | 18 | 6.51E–02 |
| GO:0042592: homeostatic process | 17 | 7.56E–03 |
| GO:0006811: ion transport | 17 | 9.27E–03 |
| GO:0010604: positive regulation of macromolecule metabolic process | 17 | 2.38E–02 |
| GO:0048878: chemical homeostasis | 15 | 1.37E–03 |
| GO:0010557: positive regulation of macromolecule biosynthetic process | 14 | 2.59E–02 |
| GO:0031328: positive regulation of cellular biosynthetic process | 14 | 3.57E–02 |
| GO:0009891: positive regulation of biosynthetic process | 14 | 3.94E–02 |
| GO:0006812: cation transport | 13 | 1.74E–02 |
| GO:0045941: positive regulation of transcription | 13 | 2.00E–02 |
Based on the count of enriched pleiotropic genes, the top 10 biological function terms and their corresponding p values are listed here
Table 2.
Genetic association of diseases/traits and corresponding genes
| Term | Count | p value | Genes |
|---|---|---|---|
| Diabetes, type 2 | 18 | 3.82E–06 | SREBF1, HNF1B, KIF11, WFS1, LEPR, PPARG, IDE, FTO, IGF2BP2, CDKAL1, KCNJ11, TCF7L2, CRHR2, HNF4A, SLC2A2, GIPR, SLC30A8, ABCC8 |
| Obesity | 7 | 1.91E–02 | SREBF1, CRHR2, GCKR, LEPR, FTO, PPARG, MC4R |
| Insulin | 6 | 8.78E–04 | LEPR, PPARG, IDE, KCNJ11, ABCC8, TCF7L2 |
| Diabetes, gestational | 5 | 5.79E–04 | HNF4A, PPARG, KCNJ11, ABCC8, TCF7L2 |
| Psoriasis | 5 | 2.85E–02 | GSTM1, CCHCR1, POU5F1, ZNF148, PPARG |
| Diabetes, type 2 triglycerides | 3 | 5.97E–03 | IGF2BP2, CDKAL1, SLC30A8 |
| Laryngeal cancer | 3 | 1.24E–02 | GSTM1, CCND1, BCL2 |
| Binge eating | 2 | 3.47E–02 | LEPR, MC4R |
| Diabetes, type 2 glucose insulin | 2 | 3.47E–02 | HNF4A, TCF7L2 |
The significant diseases (p < 0.05) are listed and sorted by the count of enriched pleiotropic genes. The corresponding p values and the specific genes are shown in the third and fourth columns. The pleiotropic genes are enriched in two major diseases: diabetes and obesity. Some genes such as “SREBF1,” “CRHR2,” “LEPR,” “FTO,” and “PPARG” are involved in both diseases
Table 3.
Pathway analysis based on pleiotropic genes
| Pathway | Count | p value | Genes |
|---|---|---|---|
| hsa04080: neuroactive ligand-receptor interaction | 8 | 2.53E–02 | CRHR2, PTGER3, OPRL1, LEPR, GIPR, MTNR1B, MC4R, GRIN3A |
| hsa04930: type 2 diabetes mellitus | 5 | 1.89E–03 | MAPK1, SLC2A2, CACNA1G, KCNJ11, ABCC8 |
| hsa04120: ubiquitin mediated proteolysis | 5 | 7.00E–02 | UBE2D3, FBXW7, UBE3C, UBE2E2, UBE2R2 |
| hsa05216: thyroid cancer | 4 | 4.17E–03 | MAPK1, CCND1, PPARG, TCF7L2 |
| hsa04520: adherens junction | 4 | 5.69E–02 | PTPRJ, MAPK1, PVRL2, TCF7L2 |
| hsa05210: colorectal cancer | 4 | 7.02E–02 | MAPK1, CCND1, BCL2, TCF7L2 |
| hsa05215: prostate cancer | 4 | 8.04E–02 | MAPK1, CCND1, BCL2, TCF7L2 |
| hsa04950: maturity onset diabetes of the young | 3 | 3.24E–02 | HNF1B, HNF4A, SLC2A2 |
| hsa05219: bladder cancer | 3 | 8.24E–02 | RPS6KA5, MAPK1, CCND1 |
All pathways are listed and sorted by the count of enriched pleiotropic genes. The corresponding p value and the specific genes are shown in the third and fourth columns. Most are metabolism-related pathways
Fig. 3.
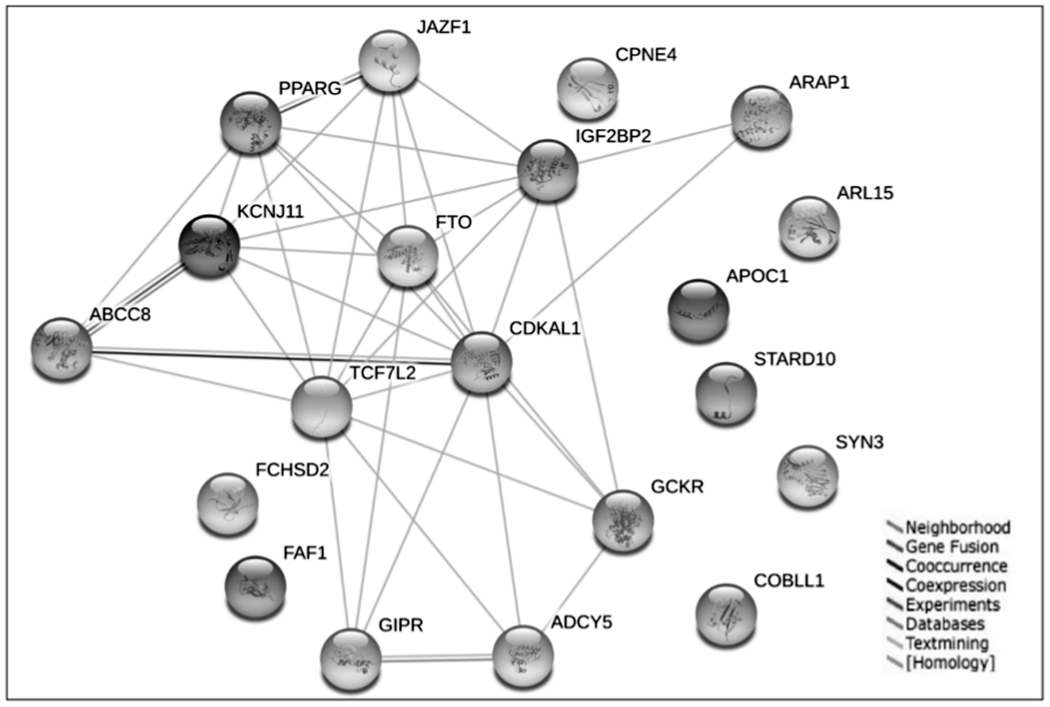
Interactions between significant pleiotropic genes. Based on the STRING database, different interactions between significant pleiotropic genes (FDR < 0.01) are shown in colored lines
Fig. 4.

Gene-disease association study based on pleiotropic genes. In all, 78 (A), 91 (B) and 48 (C) pleiotropic genes are associated with diabetes, obesity and both syndromes base on DisGeNET database
Additional evidence from gene expression data
We investigated the association of 217 pleiotropic genes identified in our study with the phenotypes BMI and insulin resistance in the comprehensive gene expression data. Thirtyseven and 44 pleiotropic genes show significant association with BMI and insulin resistance, respectively (p < 0.05). Among them, 29 genes overlap, indicating that they are significantly associated with both BMI and insulin resistance (Table 4). The additional evidence from expression data analysis of pleiotropic genes strongly supports that the pleiotropic genes including JAZF1 (FDR = 0.0002), SYN2 (FDR = 0.0018), CDKN2C (0.0227), RABGAP1 (0.0295), and UBE2E2 (FDR = 0.0459) and the corresponding SNPs rs849135, rs2119812, rs12855, rs587364, rs17012823 may play crucial roles in both obesity and T2D pathogenesis.
Table 4.
Expression data analysis of pleiotropic genes
| Pleiotropic analysis |
BMI |
Insulin resistant |
||||
|---|---|---|---|---|---|---|
| Gene | SNP | FDR | logFC | p value | logFC | p value |
| JAZF1 | rs849135 | 0.0002 | 1.76 | 1.39E–05 | 0.35 | 2.13E–05 |
| SYN2 | rs2119812 | 0.0018 | −1.99 | 5.49E–03 | −0.50 | 5.27E–04 |
| CDKN2C | rs12855 | 0.0227 | −5.57 | 1.99E–12 | −1.06 | 6.27E–11 |
| RABGAP1 | rs587364 | 0.0295 | −0.80 | 3.08E–03 | −0.15 | 7.46E–03 |
| UBE2E2 | rs17012823 | 0.0459 | 0.99 | 1.83E–04 | 0.14 | 8.22E–03 |
| ATP2B4 | rs17537593 | 0.0479 | −1.36 | 4.51E–03 | −0.38 | 7.26E–05 |
| DDX42 | rs11079511 | 0.0554 | −0.48 | 2.87E–02 | −0.14 | 1.67E–03 |
| EIF3H | rs12677487 | 0.0600 | −0.96 | 4.42E–05 | −0.22 | 2.13E–06 |
| NUCB2 | rs214105 | 0.0699 | 1.81 | 1.91E–05 | 0.39 | 5.18E–06 |
| SKIV2L | rs437179 | 0.0759 | −0.77 | 3.38E–03 | −0.13 | 1.20E–02 |
| BPTF | rs12449442 | 0.0839 | 0.94 | 3.65E–03 | 0.14 | 3.90E–02 |
| SENP2 | rs3087964 | 0.0876 | −1.92 | 2.05E–06 | −0.40 | 8.84E–07 |
| WDR68 | rs17631394 | 0.0899 | −0.74 | 3.16E–02 | −0.19 | 7.49E–03 |
| SOBP | rs3923954 | 0.1048 | 2.15 | 8.65E–06 | 0.53 | 3.62E–08 |
| SLIT3 | rs10069222 | 0.1096 | 0.78 | 4.54E–02 | 0.25 | 1.85E–03 |
| THADA | rs17334919 | 0.1108 | 1.66 | 2.17E–05 | 0.41 | 1.33E–07 |
| SLC39A11 | rs9912666 | 0.1145 | 2.08 | 3.78E–06 | 0.43 | 2.84E–06 |
| CCND1 | rs649392 | 0.1228 | 4.27 | 1.86E–09 | 0.78 | 8.58E–08 |
| BCL2 | rs12454712 | 0.1326 | −1.04 | 2.37E–03 | −0.26 | 1.72E–04 |
| OGDH | rs6961567 | 0.1342 | −1.22 | 1.38E–05 | −0.12 | 3.27E–02 |
| GALNT10 | rs6860445 | 0.1425 | 1.68 | 4.72E–05 | 0.29 | 4.68E–04 |
| PROS1 | rs8178610 | 0.1463 | 2.24 | 3.03E–10 | 0.45 | 3.39E–10 |
| PHACTR2 | rs1082 | 0.1543 | 0.64 | 3.10E–02 | 0.14 | 1.55E–02 |
| NOPE | rs2289045 | 0.1570 | −2.57 | 1.68E–05 | −0.43 | 4.02E–04 |
| HLA-DRA | rs3129882 | 0.1588 | 3.33 | 5.45E–09 | 0.63 | 7.17E–08 |
| FBXW7 | rs1516822 | 0.1633 | 1.42 | 3.96E–05 | 0.21 | 3.24E–03 |
| C15orf44 | rs12909511 | 0.1662 | −1.50 | 2.58E–03 | −0.28 | 4.84E–03 |
| PLEKHM2 | rs16851970 | 0.1771 | 0.82 | 5.05E–04 | 0.17 | 3.76E–04 |
| TOM1L2 | rs7222480 | 0.1872 | −2.73 | 3.83E–08 | −0.52 | 3.18E–07 |
The first column lists the 29 genes that show evidence of pleiotropy in both our study (FDR < 0.2) and the validation gene expression data (p < 0.05). The second and third columns list the corresponding SNPs and FDR value in our GWA-based pleiotropic analysis. The last four columns list the log fold change (FC) and p values in gene expression data which may reveal the association between genes and the phenotypes BMI and insulin resistance, respectively
Discussion
It is well known that T2D and obesity are physiologically related diseases that may influence each other in multiple ways. Both conditions are global public health problems. Despite many studies focused on the pathogenesis of T2D and obesity [25–27], either in a single gene, pathway or in various omics investigations, genetic intercommunity studies between these two diseases are very limited. With the assumption that two closely related traits are likely to share common genetic factors [28, 29], we performed pleiotropic analysis based on large GWAS data sets regarding T2D and BMI. Although several methods [16, 30, 31] for pleiotropy analysis between two GWAS summary results, GPA has better performance in statistical power for identifying disease-associated genes than many other approaches including cFDR [16].
Since the purpose of GWA-based pleiotropic analysis is to identify pleiotropic genes which play significant roles in both traits, we compared the results between our pleiotropic analysis and the original GWAS in single phenotype. As described in the “Results,” 2227 pleiotropic SNPs corresponding to 217 unique pleiotropic genes were identified in our study. Among these genes, 30 are overlapped and significant in GWA level (p < 5E–8), and 187 are newfound genes which may be ignored in the original GWAS studies. We do not intend to compare the number of significant SNPs or genes between multiple studies based on different statistical methods and values (e.g., p value and FDR value). However, pleiotropic analysis in our study indeed sheds light on those causal SNPs and genes which may be ignored in single GWAS. For instance, we verified multiple SNPs including rs4506565 (FDR = 1.23E–08), rs12255372 (1.74E–07), rs1558902 (7.23E–10), rs1421085 (FDR = 7.58E–07) and the corresponding genes TCF7L2 and FTO which are significant in GWA level in both original studies. More importantly, beyond verification, we highlighted several SNPs such as rs864745 (FDR = 3.96E–04), rs17175643 (FDR = 1.05E–04), rs11603334 (FDR = 1.9E–04) and the corresponding genes JAZF1, MC4R, CENTD2 which do not reach genome-wide significance in GWA level in either or both of the original data sets, but show significant pleiotropy in our study.
GWAS is a popular approach for systematical biological investigation. With high throughput and coverage, it is able to identify millions of SNPs in a large amount of subjects [32, 33]. SNPs could affect specific phenotypes in multiple ways, including regulating gene expression level [34, 35]. In order to gain additional evidence, we performed expression data analysis of pleiotropic genes. By evaluating the correlation between genes and the phenotypes BMI and insulin resistance (an important phenotype of T2D), several pleiotropic genes such JAZF1, SYN2, and CDKN2C showed significant association with both phenotypes. Several previous epidemiologic and genomic studies demonstrated a close relationship between JAZF1 and T2D [36–38]. Meanwhile, numerous functional studies in multiple tissues have shown that JAZF1 can reduce lipid synthesis and increase lipolysis in adipocytes and liver cells, which may represent a potential target in intervention and treatment of T2D and obesity [39–41]. A number of previous publications have suggested crucial roles for genes SYN2 and CDKN2C in T2D and obesity [42–45]. As we know, the variance of gene expression in different individuals may lead to different expression of corresponding proteins, thus influencing specific phenotypes. Evidence from gene expression data provided strong and direct support for our pleiotropic analysis using the GPA method.
FTO is a nuclear protein coding gene, with the full name “Alpha-Ketoglutarate Dependent Dioxygenase.” RNA (mRNA, tRNA, and snRNA) demethylase mediated by FTO play a crucial role in the physiology of energy and material metabolism including adipogenesis and glycometabolism [46, 47]. Previous studies suggested that FTO could regulate the fat mass and body weight by mediating the thermogenesis and adipocyte differentiation into brown and white fat cells [48]. TCF7L2 play a significant role in Wnt signaling pathway. It encodes a high-mobility group box-containing transcription factor which is involved in blood glucose homeostasis and adipogenesis. As a well-known T2D candidate gene, TCF7L2 is also a crucial transcriptional effector in Wnt signaling pathway which could significantly regulate the development and function of adipocytes [49]. Our integrative pathway and network analysis suggested that both TFO and TCF7L2 were involved in metabolism-related pathways or diseases such as “glucose homeostasis,” “carbohydrate homeostasis,” “diabetes mellitus,” and “type 2 diabetes.”
We note that the imbalance of data structure inherent in performing a study between two GWAS data sets may lead to unexpected false positive results. Generally, two GWAS data sets with uncoordinated sample size and/or count of SNPs are not the ideal data sets for pleiotropic studies by the GPA method [16]. To avoid missing important information, the ideal scenario is to use all SNPs and the corresponding statistical values in both data sets for pleiotropic evaluation. However, overlapped SNPs are required by most methods including GPA. Therefore, among all the conditions, a comparative count of total SNPs is the most important element between the two data sets. In our study, although the sample sizes are different, the total counts of SNPs between T2D and BMI data sets are comparable. Furthermore, by comparing with the original data sets, the overlapped SNPs we used for pleiotropic analysis make up a large proportion of total SNPs (around 90%) and cover almost all significant SNPs (p < 0.05) in both original GWAS data sets. Based on data quality control, we can effectively minimize the false positive rate and enhance the reliability of our results. Therefore, imbalance of sample size in the two GWAS data sets that we used may have minimum impact for unexpected false positive results in our study.
Supplementary Material
Acknowledgements
We thank our laboratory members for the collaboration and helpful discussion.
Funding This study was partially supported by grants from NIH (R01AR059781 and R01MH104680) and Edward G. Schlieder Endowment. The study also benefited from the National Natural Science Foundation of China (31371194) and the Fundamental Research Funds from the Central Universities (2013JBM098).
Footnotes
Supplementary information The online version of this article (https://doi.org/10.1038/s10038-020-00843-4) contains supplementary material, which is available to authorized users.
Conflict of interest The authors declare that they have no conflict of interest.
References
- 1.Fall T, Ingelsson E. Genome-wide association studies of obesity and metabolic syndrome. Mol Cell Endocrinol. 2014;382:740–57. [DOI] [PubMed] [Google Scholar]
- 2.Min JL, Nicholson G, Halgrimsdottir I, Almstrup K, Petri A, Barrett A, et al. Coexpression network analysis in abdominal and gluteal adipose tissue reveals regulatory genetic loci for metabolic syndrome and related phenotypes. PLoS Genet. 2012;8:e1002505. [DOI] [PMC free article] [PubMed] [Google Scholar]
- 3.Kaur J A comprehensive review on metabolic syndrome. Cardiol Res Pract. 2014;2014:943162. [DOI] [PMC free article] [PubMed] [Google Scholar] [Retracted]
- 4.Kolovou GD, Anagnostopoulou KK, Salpea KD, Mikhailidis DP. The prevalence of metabolic syndrome in various populations. Am J Med Sci. 2007;333:362–71. [DOI] [PubMed] [Google Scholar]
- 5.Desroches S, Lamarche B. The evolving definitions and increasing prevalence of the metabolic syndrome. Appl Physiol Nutr Metab. 2007;32:23–32. [DOI] [PubMed] [Google Scholar]
- 6.Lim SS, Vos T, Flaxman AD. A comparative risk assessment of burden of disease and injury attributable to 67 risk factors and risk factor clusters in 21 regions, 1990-2010: a systematic analysis for the Global Burden of Disease Study 2010 (vol 380, pg 2224, 2012). Lancet. 2013;381:1276. [DOI] [PMC free article] [PubMed] [Google Scholar]
- 7.Prospective Studies C, Whitlock G, Lewington S, Sherliker P, Clarke R, Emberson J, et al. Body-mass index and cause-specific mortality in 900 000 adults: collaborative analyses of 57 prospective studies. Lancet. 2009;373:1083–96. [DOI] [PMC free article] [PubMed] [Google Scholar]
- 8.Horr S, Nissen S. Managing hypertension in type 2 diabetes mellitus. Best practice & research. Clin Endocrinol Metab. 2016;30:445–54. [DOI] [PubMed] [Google Scholar]
- 9.Winnier DA, Fourcaudot M, Norton L, Abdul-Ghani MA, Hu SL, Farook VS, et al. Transcriptomic identification of ADH1B as a novel candidate gene for obesity and insulin resistance in human adipose tissue in Mexican Americans from the Veterans Administration Genetic Epidemiology Study (VAGES). Plos ONE. 2015;10:e0119941. [DOI] [PMC free article] [PubMed] [Google Scholar]
- 10.Bastien M, Poirier P, Lemieux I, Despres JP. Overview of epidemiology and contribution of obesity to cardiovascular disease. Prog Cardiovasc Dis. 2014;56:369–81. [DOI] [PubMed] [Google Scholar]
- 11.Shaw JE, Sicree RA, Zimmet PZ. Global estimates of the prevalence of diabetes for 2010 and 2030. Diabetes Res Clin Pract. 2010;87:4–14. [DOI] [PubMed] [Google Scholar]
- 12.Zimmet P, Alberti KG, Shaw J. Global and societal implications of the diabetes epidemic. Nature. 2001;414:782–7. [DOI] [PubMed] [Google Scholar]
- 13.Kogelman LJ, Zhernakova DV, Westra HJ, Cirera S, Fredholm M, Franke L, et al. An integrative systems genetics approach reveals potential causal genes and pathways related to obesity. Genome Med. 2015;7:105. [DOI] [PMC free article] [PubMed] [Google Scholar]
- 14.Locke AE, Kahali B, Berndt SI, Justice AE, Pers TH, Day FR, et al. Genetic studies of body mass index yield new insights for obesity biology. Nature. 2015;518:197–206. [DOI] [PMC free article] [PubMed] [Google Scholar]
- 15.Mahajan A, Go MJ, Zhang WH, Below JE, Gaulton KJ, Ferreira T, et al. Genome-wide trans-ancestry meta-analysis provides insight into the genetic architecture of type 2 diabetes susceptibility. Nat Genet. 2014;46:234. [DOI] [PMC free article] [PubMed] [Google Scholar]
- 16.Chung D, Yang C, Li C, Gelernter J, Zhao H. GPA: a statistical approach to prioritizing GWAS results by integrating pleiotropy and annotation. PLoS Genet. 2014;10:e1004787. [DOI] [PMC free article] [PubMed] [Google Scholar]
- 17.Stearns FW. One hundred years of pleiotropy: a retrospective. Genetics. 2010;186:767–73. [DOI] [PMC free article] [PubMed] [Google Scholar]
- 18.Paaby AB, Rockman MV. The many faces of pleiotropy. Trends Genet. 2013;29:66–73. [DOI] [PMC free article] [PubMed] [Google Scholar]
- 19.Swa HL, Shaik AA, Lim LH, Gunaratne J. Mass spectrometry based quantitative proteomics and integrative network analysis accentuates modulating roles of annexin-1 in mammary tumorigenesis. Proteomics. 2015;15:408–18. [DOI] [PubMed] [Google Scholar]
- 20.Wu X, Hasan MA, Chen JY. Pathway and network analysis in proteomics. J Theor Biol. 2014;362:44–52. [DOI] [PMC free article] [PubMed] [Google Scholar]
- 21.Sherman BT, Huang da W, Tan Q, Guo Y, Bour S, Liu D, et al. DAVID Knowledgebase: a gene-centered database integrating heterogeneous gene annotation resources to facilitate high-throughput gene functional analysis. BMC Bioinforma. 2007;8:426. [DOI] [PMC free article] [PubMed] [Google Scholar]
- 22.Zeng Y, Zhang L, Zhu W, Xu C, He H, Zhou Y, et al. Quantitative proteomics and integrative network analysis identified novel genes and pathways related to osteoporosis. J Proteom. 2016;142:45–52. [DOI] [PMC free article] [PubMed] [Google Scholar]
- 23.Zhang L, Liu YZ, Zeng Y, Zhu W, Zhao YC, Zhang JG, et al. Network-based proteomic analysis for postmenopausal osteoporosis in caucasian females. Proteomics. 2016;16:12–28 [DOI] [PubMed] [Google Scholar]
- 24.Stancakova A, Civelek M, Saleem NK, Soininen P, Kangas AJ, Cederberg H, et al. Hyperglycemia and a common variant of GCKR are associated with the levels of eight amino acids in 9,369 Finnish men. Diabetes 2012;61:1895–902. [DOI] [PMC free article] [PubMed] [Google Scholar]
- 25.Chen L, Magliano DJ, Zimmet PZ. The worldwide epidemiology of type 2 diabetes mellitus-present and future perspectives. Nat Rev Endocrinol. 2012;8:228–36. [DOI] [PubMed] [Google Scholar]
- 26.Huang T, Qi Q, Zheng Y, Ley SH, Manson JE, Hu FB, et al. Genetic predisposition to central obesity and risk of type 2 diabetes: two independent cohort studies. Diabetes Care. 2015;38:1306–11. [DOI] [PMC free article] [PubMed] [Google Scholar]
- 27.Blakemore AI, Buxton JL. Obesity, genetic risk, and environment. BMJ. 2014;348:g1900. [DOI] [PubMed] [Google Scholar]
- 28.Vattikuti S, Guo J, Chow CC. Heritability and genetic correlations explained by common SNPs for metabolic syndrome traits. PLoS Genet. 2012;8:e1002637. [DOI] [PMC free article] [PubMed] [Google Scholar]
- 29.McCarthy MI. Genomics, type 2 diabetes, and obesity. N Engl J Med. 2010;363:2339–50. [DOI] [PubMed] [Google Scholar]
- 30.Zhu X, Feng T, Tayo BO, Liang J, Young JH, Franceschini N, et al. Meta-analysis of correlated traits via summary statistics from GWASs with an application in hypertension. Am J Hum Genet. 2015;96:21–36. [DOI] [PMC free article] [PubMed] [Google Scholar]
- 31.Andreassen OA, Thompson WK, Schork AJ, Ripke S, Mattingsdal M, Kelsoe JR, et al. Correction: improved detection of common variants associated with schizophrenia and bipolar disorder using pleiotropy-informed conditional false discovery rate. PLoS Genet. 2015;11:e1005544. [DOI] [PMC free article] [PubMed] [Google Scholar]
- 32.Corvin A, Craddock N, Sullivan PF. Genome-wide association studies: a primer. Psychol Med. 2010;40:1063–77. [DOI] [PMC free article] [PubMed] [Google Scholar]
- 33.Korte A, Farlow A. The advantages and limitations of trait analysis with GWAS: a review. Plant Methods. 2013;9:29. [DOI] [PMC free article] [PubMed] [Google Scholar]
- 34.Ramasamy A, Trabzuni D, Guelfi S, Varghese V, Smith C, Walker R, et al. Genetic variability in the regulation of gene expression in ten regions of the human brain. Nat Neurosci. 2014;17:1418–28. [DOI] [PMC free article] [PubMed] [Google Scholar]
- 35.Consortium GT. Human genomics. The Genotype-Tissue Expression (GTEx) pilot analysis: multitissue gene regulation in humans. Science. 2015;348:648–60. [DOI] [PMC free article] [PubMed] [Google Scholar]
- 36.Langberg KA, Ma L, Sharma NK, Hanis CL, Elbein SC, Hasstedt SJ, et al. Single nucleotide polymorphisms in JAZF1 and BCL11A gene are nominally associated with type 2 diabetes in African-American families from the GENNID study. J Hum Genet. 2012;57:57–61. [DOI] [PMC free article] [PubMed] [Google Scholar]
- 37.Schleinitz D, Tonjes A, Bottcher Y, Dietrich K, Enigk B, Koriath M, et al. Lack of significant effects of the type 2 diabetes susceptibility loci JAZF1, CDC123/CAMK1D, NOTCH2, ADAMTS9, THADA, and TSPAN8/LGR5 on diabetes and quantitative metabolic traits. Horm Metab Res. 2010;42:14–22. [DOI] [PubMed] [Google Scholar]
- 38.Stevens VL, Ahn J, Sun J, Jacobs EJ, Moore SC, Patel AV, et al. HNF1B and JAZF1 genes, diabetes, and prostate cancer risk. Prostate. 2010;70:601–7. [DOI] [PMC free article] [PubMed] [Google Scholar]
- 39.Jang WY, Bae KB, Kim SH, Yu DH, Kim HJ, Ji YR, et al. Overexpression of Jazf1 reduces body weight gain and regulates lipid metabolism in high fat diet. Biochem Biophys Res Commun. 2014;444:296–301. [DOI] [PubMed] [Google Scholar]
- 40.Ming GF, Xiao D, Gong WJ, Liu HX, Liu J, Zhou HH, et al. JAZF1 can regulate the expression of lipid metabolic genes and inhibit lipid accumulation in adipocytes. Biochem Bioph Res Commun. 2014;445:673–80. [DOI] [PubMed] [Google Scholar]
- 41.Li L, Yang Y, Yang GY, Lu CM, Yang ML, Liu H, et al. The role of JAZF1 on lipid metabolism and related genes in vitro. Metabolism. 2011;60:523–30. [DOI] [PubMed] [Google Scholar]
- 42.Sharma NK, Langberg KA, Mondal AK, Elbein SC, Das SK. Type 2 diabetes (T2D) associated polymorphisms regulate expression of adjacent transcripts in transformed lymphocytes, adipose, and muscle from Caucasian and African-American subjects. J Clin Endocrinol Metab. 2011;96:E394–403. [DOI] [PMC free article] [PubMed] [Google Scholar]
- 43.Popa E, Rusu A, Purcarea C. Methanobrevibacter smithii carbamoyl phosphate synthetase, a missing link and a putative target for obesity prevention. Curr Opin Biotech. 2011;22:S81. [Google Scholar]
- 44.Rodriguez-Acebes S, Palacios N, Botella-Carretero JI, Olea N, Crespo L, Peromingo R, et al. Gene expression profiling of subcutaneous adipose tissue in morbid obesity using a focused microarray: distinct expression of cell-cycle- and differentiation-related genes. BMC Med Genomics. 2010;3:61. [DOI] [PMC free article] [PubMed] [Google Scholar]
- 45.Zhao Y, Shi K, Su X, Xie L, Yan Y. Microcystin-LR induces dysfunction of insulin secretion in rat insulinoma (INS-1) cells: implications for diabetes mellitus. J Hazard Mater. 2016;314:11–21. [DOI] [PubMed] [Google Scholar]
- 46.Claussnitzer M, Dankel SN, Kim KH, Quon G, Meuleman W, Haugen C, et al. FTO obesity variant circuitry and adipocyte browning in humans. N Engl J Med. 2015;373:895–907. [DOI] [PMC free article] [PubMed] [Google Scholar]
- 47.Jia GF, Fu Y, Zhao X, Dai Q, Zheng GQ, Yang Y, et al. N6-Methyladenosine in nuclear RNA is a major substrate of the obesity-associated FTO (vol 7, pg 885, 2011). Nat Chem Biol. 2012;8:1008. [DOI] [PMC free article] [PubMed] [Google Scholar]
- 48.Wang TL, Hong TT, Huang Y, Su HM, Wu F, Chen Y, et al. Fluorescein derivatives as bifunctional molecules for the simultaneous inhibiting and labeling of FTO protein. J Am Chem Soc. 2015;137:13736–9. [DOI] [PubMed] [Google Scholar]
- 49.Chen X, Ayala I, Shannon C, Fourcaudot M, Acharya NK, Jenkinson CP, et al. The diabetes gene and wnt pathway effector TCF7L2 regulates adipocyte development and function. Diabetes. 2018;67:554–68. [DOI] [PMC free article] [PubMed] [Google Scholar]
Associated Data
This section collects any data citations, data availability statements, or supplementary materials included in this article.