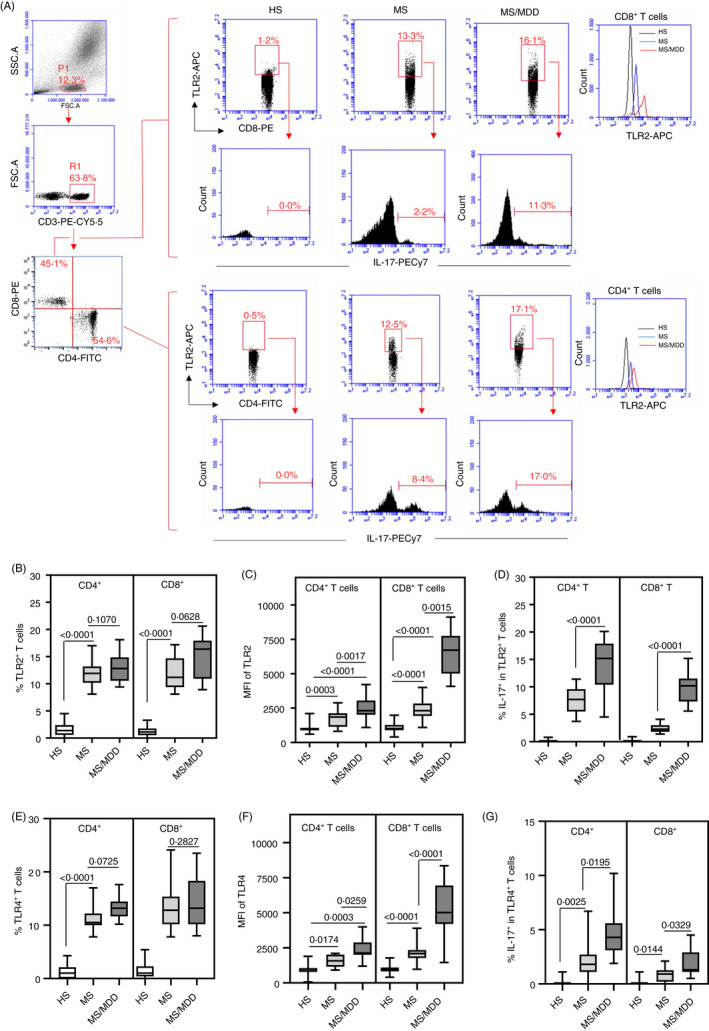
Figure 4.

Comparison of the proportion of circulating IL‐17‐secreting CD4+and CD8+T cells expressing TLR2 and TLR4 in MS patients with or without MDD. The mean proportion of CD4+and CD8+T cells positive for TLR2 (B) and TLR4 (E), as well as MFI of TLR2 (C) and TLR4 (F) for these cells, was determined by cytometry following representative dot plots and histograms shown in panel A after acquisition of 200,000 events in samples obtained from healthy subjects (HS,n = 25) and MS patients with (MS/MDD,n = 25) or without (MS,n = 25) MDD. The mean frequency of IL‐17‐secreting CD4+and CD8+T cells among TLR2+(D) and TLR4+(G) cells was also evaluated after activation of those cells with PMA plus ionomycin. Data are shown as mean ±SD of seven independent experiments with 3 to 4 samples per experiment from each group (HS, MS and MS/MDD) (Figure2S). Significance was calculated by comparing different cell culture conditions from HS, MS and MS/MDD
