Abstract
Objective
To determine whether a new index for multiple chronic conditions (MCCs) predicts poststroke functional outcome (FO), we developed and internally validated the new MCC index in patients with ischemic stroke.
Methods
A prospective cohort of patients with ischemic stroke (2008–2017) was interviewed at baseline and 90 days in the Brain Attack Surveillance in Corpus Christi Project. An average of 22 activities of daily living (ADL)/instrumental ADL (IADL) items measured the FO score (range 1–4) at 90 days. A FO score >3 (representing a lot of difficulty with ADL/IADLs) was considered unfavorable FO. A new index was developed using machine learning techniques to select and weight conditions and prestroke impairments.
Results
Prestroke modified Rankin Scale (mRS) score, age, congestive heart failure (CHF), weight loss, diabetes, other neurologic disorders, and synergistic effects (dementia × age, CHF × renal failure, and prestroke mRS × prior stroke/TIA) were identified as important predictors in the MCC index. In the validation dataset, the index alone explained 31% of the variability in the FO score, was well-calibrated (p = 0.41), predicted unfavorable FO well (area under the receiver operating characteristic curve 0.81), and outperformed the modified Charlson Comorbidity Index in predicting the FO score and poststroke mRS.
Conclusions
A new MCC index was developed and internally validated to improve the prediction of poststroke FO. Novel predictors and synergistic interactions were identified.
Classification of Evidence
This study provides Class II evidence that in patients with ischemic stroke, an index for MCC predicts FO at 90 days.
Up to 53% of patients with stroke have long-term disability in activities of daily living (ADLs).1,2 Clinically, accurate prediction of poststroke functional outcome (FO) could aid in decision-making regarding the balance of side effects and benefits of aggressive treatments.3,4 It would help patients, families, and physicians to have realistic expectations, set attainable rehabilitation goals, and plan for home adjustment, community support, or institutional care.3,4 From a research perspective, prognostic factors are important in observational studies for case mix adjustment and in clinical trials for consideration of imbalance in treatment arms.3,4 Stratifying patients into prognostically comparable groups can increase power to detect clinically relevant differences.5,6
Comorbidity increases risk of poor poststroke FO.7–10 Although many studies have linked individual comorbid conditions to FO, most patients have multiple chronic conditions (MCCs) at stroke onset, which may affect FO synergistically.11,12 Hospital-based studies have shown that MCCs, measured by the modified Charlson Comorbidity Index (mCCI), predict FO,13–16 but it is not clear whether the conditions in the mCCI are adequate for MCC assessment in patients with stroke. Comorbidities have been included in prognostic scores for poststroke FO, although the comorbid conditions have varied across studies.8–10 Furthermore, cognitive and psychosocial impairments have not been considered, although they may interact synergistically with other comorbidities to influence poststroke FO.17,18 The prediction of FO can potentially be improved by adding functionally relevant conditions, prestroke impairments, and synergistic interactions to MCC assessment.14 Using machine learning, we aimed to develop and internally validate a new MCC index that improves the prediction of poststroke FO at 90 days.
Methods
We conducted a prospective cohort study nested in the Brain Attack Surveillance in Corpus Christi (BASIC) Project (November 8, 2008–March 31, 2017). BASIC methodology has been described previously.19,20 BASIC is an ongoing population-based stroke surveillance study in Nueces County, Texas. In 2016, the county population was 361,350, with 63% being Mexican Americans, who are mostly second- or third-generation US-born citizens.20,21 Stroke cases were ascertained through active and passive surveillance in the 7 hospitals in the county.18–20 Active surveillance identifies cases through daily screening of admission logs, medical wards, and intensive care units for validated cerebrovascular diagnostic terms. Passive surveillance identifies cases through searching hospital and emergency department discharge diagnoses using ICD-9/10 codes (430–438/I60–I69).22 Strokes are defined as a focal neurologic deficit of acute onset specifically attributable to cerebrovascular distribution that lasts >24 hours. All stroke cases were validated by a fellowship-trained stroke physician blinded to race–ethnicity and age. To study additional comorbid conditions not included in the BASIC medical record abstraction, hospital discharge data were requested but only available from 3 hospitals, which covers ∼70% of acute strokes in the area. Patients without hospital discharge data were excluded. In this study, only the first ischemic stroke event for each patient was included, although a patient may have had prior strokes or TIA events. Patients aged <45 years, living outside of Nueces County, or with traumatic strokes were excluded based on the BASIC exclusion criteria.20 Patients of race/ethnicity other than Mexican American or non-Hispanic white (6.3%) were excluded to reduce sparsity.
Structured, in-person interviews (English/Spanish) were conducted shortly after stroke onset (baseline interview) and at ∼90 days after stroke (outcome interview). If a patient was unable to complete an interview, a proxy interview was conducted. Patients who died before the outcome interview were excluded. Poststroke FO score was measured at ∼90 days using an average score of self-reported levels of difficulty with 22 ADL/instrumental ADL (IADLs) tasks. Self-reported level of difficulty for each task was recorded as 1 (no difficulty), 2 (some difficulty), 3 (a lot of difficulty), or 4 (can only do with help).23 The total FO score was dichotomized into none/mildly impaired (≤3) and dependent (>3, a lot of difficulty with ADL/IADLs). Patients from recent years (since October 2014) also have modified Rankin Scale (mRS) 9Q scores at ∼90 days, a 9-question yes/no survey that measures poststroke mRS.24
Chronic conditions were abstracted from medical records and complemented by extracting ICD-9 and -10 codes from hospital discharge data. A total of 22 chronic conditions were considered, including those in the mCCI and Elixhauser Comorbidity Index.25 Information on prestroke functional, cognitive, and psychosocial impairments was ascertained from the baseline interview. Prestroke function was measured by the prestroke mRS using a series of structured questions referring to the prestroke period.26 Prestroke cognitive function was measured by the Informant Questionnaire on Cognitive Decline in the Elderly (IQCODE), a validated 16-item questionnaire completed by a proxy informant who knows the patient.27 Patients were classified as having normal cognition (IQCODE ≤3), mild cognitive impairment (IQCODE 3.01–3.43), or dementia (IQCODE ≥3.44 or medical recorded dementia) before stroke.28 Patients without a proxy have missing information on IQCODE. Social support, marital status, self-reported depression, and current/previous use of antidepressants were used to measure prestroke psychosocial impairments. The social support index was a sum of a 7-item scale adapted from the Sacramento Area Latino Study on Aging.29 Each item was scored 0 (never/rarely) to 2 (always) with the final score ranging from 0 to 14 (higher for more social support). Patients with a total score of more than 7 were considered as having high social support.29 Information on social support and depression status was not available if a proxy interview was conducted. Race–ethnicity, education, and insurance status were collected in the baseline interview.20 Medical records included age, sex, smoking status, alcohol use, body mass index (BMI) and morbid obesity (BMI ≥ 40), prior stroke/TIA, and initial stroke severity measured by the NIH Stroke Scale (NIHSS).30
Statistical Analysis
Data were divided into the training (November 8, 2008–September 30, 2016, 90%) and validation datasets (October 1, 2016–October 31, 2017, 10%). In the training dataset, baseline characteristics were compared by FO status at 90 days using Wilcoxon rank-sum tests and  tests. Pairwise correlations (Spearman) and linearity between each continuous predictor and FO score were examined, and suitable transformations were explored. Generalized additive models with smoothing splines or piecewise linear regressions did not provide better fit for the continuous variables (age, initial NIHSS, BMI) and therefore they were modeled linearly. Information on social support and depression status were missing when proxy interviews were conducted among patients with more severe strokes. IQCODE, however, would be less likely to be missing when a proxy interview was conducted. Twenty-three percent of baseline and 21% of outcome interviews were proxy interviews. To limit potential selection bias in the analysis due to excluding patients with missing information for these variables, multiple imputation with the fully conditional specification method was used to impute prestroke impairment variables (prestroke mRS, IQCODE, social support index, and depression status) for both the training and validation datasets. We performed 10 imputations with 100 burn-in iterations. The predictive mean matching method was used for the continuous variable (prestroke IQCODE). The distributions of IQCODE (median 3.06, interquartile range [IQR] 3–3.31) and social support index (median 11, IQR 8–12) in the imputed and complete dataset were similar. The proportions of patients being dependent before stroke (25%) and with prestroke history of depression (13%) or current antidepressant use (20%) were also similar to those in the complete dataset, respectively. The percentage imputed for prestroke IQCODE, social support index, depression status, and mRS were 11.6%, 25.7%, 22.5%, and 2.2%, respectively.
To build the new MCC index, variable selection was conducted by including age, race–ethnicity, sex, and initial stroke severity so that we could consider potential interactions between these factors and MCC. Traditional model selection approaches, such as stepwise or backward elimination, are not suitable for building the MCC index given the large pool of potential predictors (conditions and interactions) and the potential for unstable estimates and poor prediction accuracy.31,32 Nova variable selection methods in machine learning, such as the least absolute shrinkage and selection operator (Lasso) regression method and its derivatives,33,34 can overcome these shortfalls and simultaneously select predictors, estimate their relative contribution to FO, and explore interactions with improved accuracy and consistency.33,34 The assumptions for linear regression still apply to the Lasso regularization extended for linear regression models. We applied the Lasso regression method for hierarchical interactions (hierNet) method,35 which allowed us to explore the effect of interactions between MCC by fitting a hierarchy model, only allowing an interaction into the model if at least one of the corresponding main effects is also in the model.35 Hierarchy models have demonstrated strong predictive power among patients with neurologic problems.36 All potential predictors were standardized before model fitting, and all pairwise interactions among predictors were explored. The model was evaluated using 5-fold cross-validation and the tuning parameter was chosen based on both a smaller cross-validation error and model interpretability. The variable selection was separately done in each imputed dataset, and predictors were selected only if they appeared in all models.37
After variable selection, a multiple linear regression model was refitted using the selected predictors from hierNet. Weights for the new index were derived from the pooled β coefficients multiplied by 10 and rounded to the nearest integer. The overall score of the MCC index was a sum of the weights from each component. Collinearity was investigated using the Spearman correlation coefficients, tolerance, and variance inflation factor (VIF). Tolerance, a commonly used measure of multicollinearity, grows smaller when a variable is more highly predicted by the other independent variables (collinearity). The VIF is the reciprocal of tolerance. A tolerance of less than 0.20 or a VIF greater than 5 often cast concerns for multicollinearity.38 R2 and adjusted R2 were calculated for the final model.
Discrimination and calibration were assessed in the training and validation datasets. The ability to discriminate between none/mildly impaired and dependent was assessed in the training and validation datasets by the area under the receiver operating characteristic (ROC) curve (AUC) equivalent to the c statistic. In the validation dataset, the ability of the MCC index to discriminate between favorable (mRS 0–2) and unfavorable (mRS 3–5) outcome based on poststroke mRS-9Q at ∼90 days was also assessed. The predictivity of the MCC index was compared with models using the established predictors of FO including age and stroke severity (e.g., initial NIHSS).13,39 Calibration was assessed with the Hosmer-Lemeshow goodness-of-fit test. ROC curves for models using the new MCC index and the mCCI were compared using nonparametric DeLong tests.40 Statistical analyses were conducted with SAS (version 9.4, SAS Institute, Cary, NC) and R (version 3.5.3, RStudio).
Primary Research Question
Does a new index for MCC predict FO at 90 days in patients with ischemic stroke? This study provides Class II evidence that an index for MCC predicted FO (an average score of ADL/IADL) at 90 days in a prospective cohort of patients with ischemic stroke (AUC 0.81).
Standard Protocol Approvals, Registrations, and Patient Consents
This project was approved by the University of Michigan institutional review board and the institutional review boards of both hospital systems. Written informed consent was obtained from all participants.
Data Availability
The data will not be made available to the public because of their restricted nature.
Results
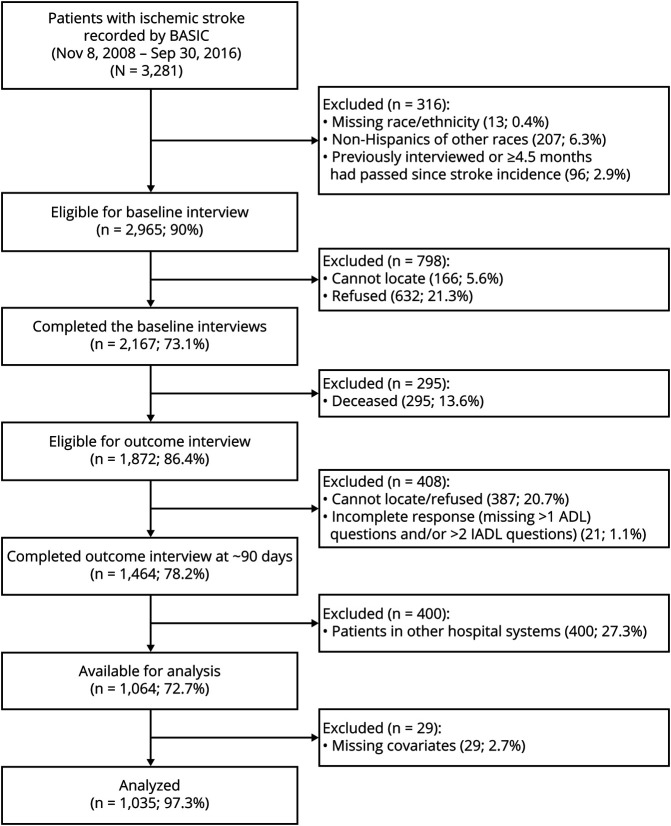
Between November 8, 2008, and September 30, 2016, 2,167 patients completed the baseline interviews and were followed for the outcome (figure 1). Among the 1,872 survivors (86%) at 90 days, 180 (9.6%) patients refused participation and 204 (10.9%) patients or their proxies could not be located for the outcome interview. Thus 1,464 (78.2%) survivors completed outcome interviews at 90 days. Hospital discharge data containing ICD-9 or -10 codes were available for 1,064 (72.7%) patients. After excluding 29 (2.7%) patients with missing information on baseline characteristics (<2% missing in each variable), 1,035 patients were included in the training dataset.
Figure 1. Flow Chart of Patient Participation.
ADL = activities of daily living; BASIC = Brain Attack Surveillance in Corpus Christi; IADL = instrumental activities of daily living.
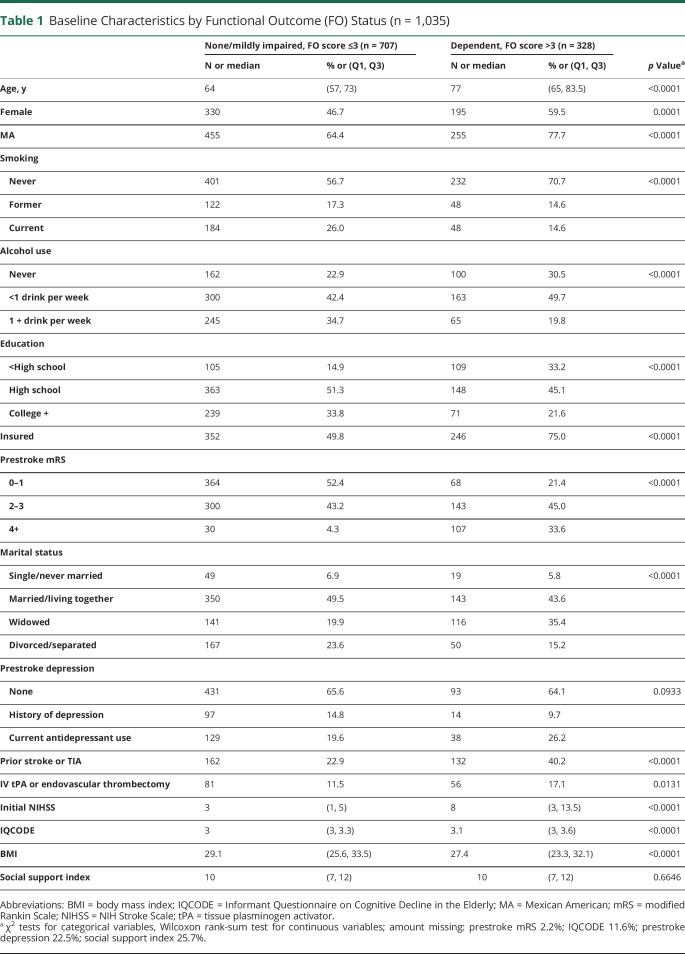
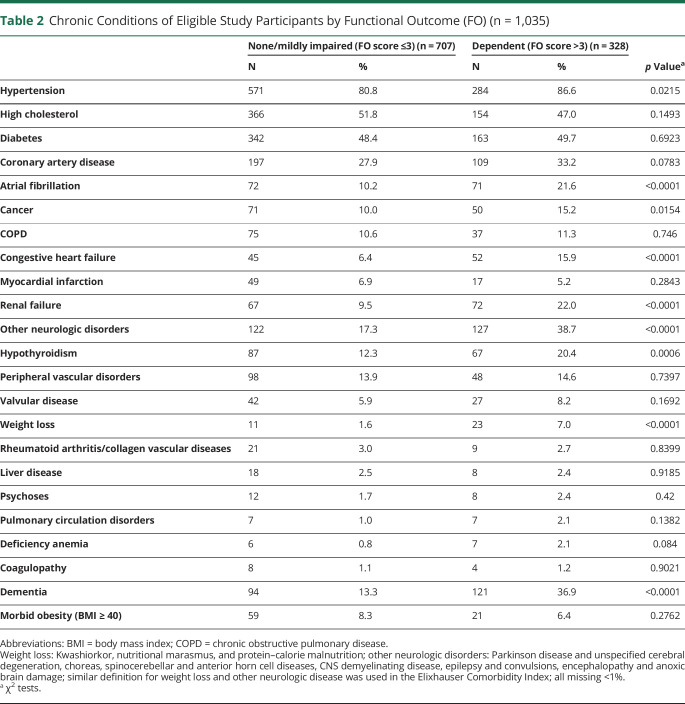
Among the 1,035 patients, 69% were Mexican American, and 51% were female. The mean age was 68 ± 12.1 years. The median initial NIHSS score was 4 (IQR 2–8) and the median FO score at 90 days was 2.36 (IQR 1.55–3.41), representing mild to moderate functional disability. The distribution of baseline characteristics and the FO score are included in tables 1 and 2. In the unadjusted analysis, patients with higher prestroke mRS and prior stroke/TIA had worse FO. Hypertension, atrial fibrillation, cancer, congestive heart failure (CHF), renal failure, other neurologic disorders, hypothyroidism, weight loss, and dementia were also associated with worse FO score at 90 days.
Table 1.
Baseline Characteristics by Functional Outcome (FO) Status (n = 1,035)
Table 2.
Chronic Conditions of Eligible Study Participants by Functional Outcome (FO) (n = 1,035)
Compared to those who were analyzed, patients who were excluded due to a reason other than death (treated at the other hospital system or refusal/cannot locate for outcome interview) had a similar prevalence for all the comorbid conditions from medical record abstraction and baseline interview, although they were less likely to be dependent before stroke (p < 0.05).
The MCC Index
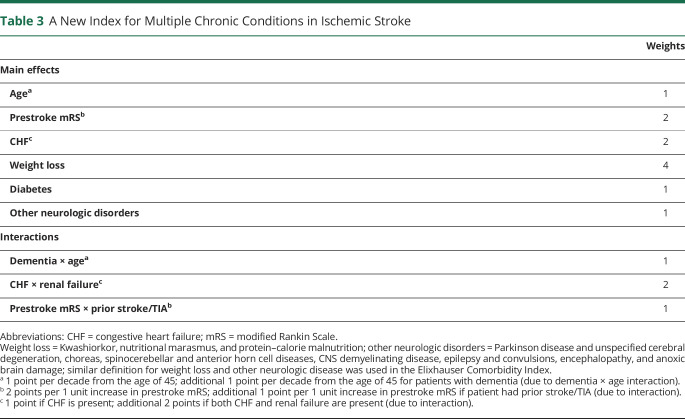
Nine predictors and interactions were selected to be included in the MCC index: prestroke mRS, age, CHF, weight loss, diabetes, other neurologic disorders, dementia × age, CHF × renal failure, and prestroke mRS × prior stroke/TIA. Race–ethnicity, sex, and initial NIHSS were found to be predictors of FO, although no interactions were found between these factors and the other predictors. Given that no interaction was identified, we did not include these factors in the MCC index but considered them as covariates in the regression model. In the multiple linear regression model adjusting for race–ethnicity, sex, and initial stroke severity, the tolerance for these predictors ranged from 0.63 to 0.98 and the mean VIF ranged from 1.02 to 1.62. Given that the model included 3 interaction terms and the VIF values were still small, multicollinearity was not a concern.
The weights for each component of the MCC index are displayed in table 3. The actual scores that a patient received given the combination of comorbid conditions and impairment status are shown in figure 2. The median of the total MCC score in the training dataset was 6 (IQR 4–11).
Table 3.
A New Index for Multiple Chronic Conditions in Ischemic Stroke
Figure 2. A New Index for Multiple Chronic Conditions in Ischemic Stroke.
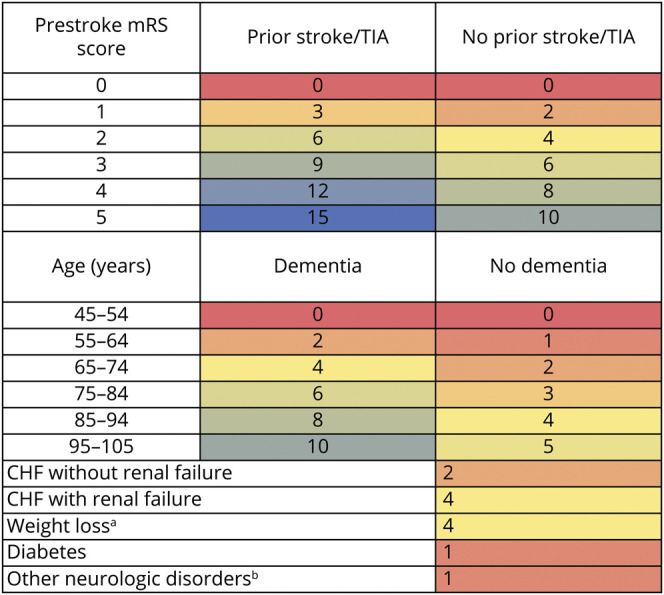
aWeight loss = Kwashiorkor, nutritional marasmus, and protein–calorie malnutrition. bOther neurologic disorders = Parkinson disease and unspecified cerebral degeneration, choreas, spinocerebellar and anterior horn cell diseases, CNS demyelinating disease, epilepsy and convulsions, encephalopathy and anoxic brain damage. Similar definitions for weight loss and other neurologic disease have been used in the Elixhauser comorbidity index. CHF = congestive heart failure; mRS = modified Rankin Scale.
Discrimination and Calibration
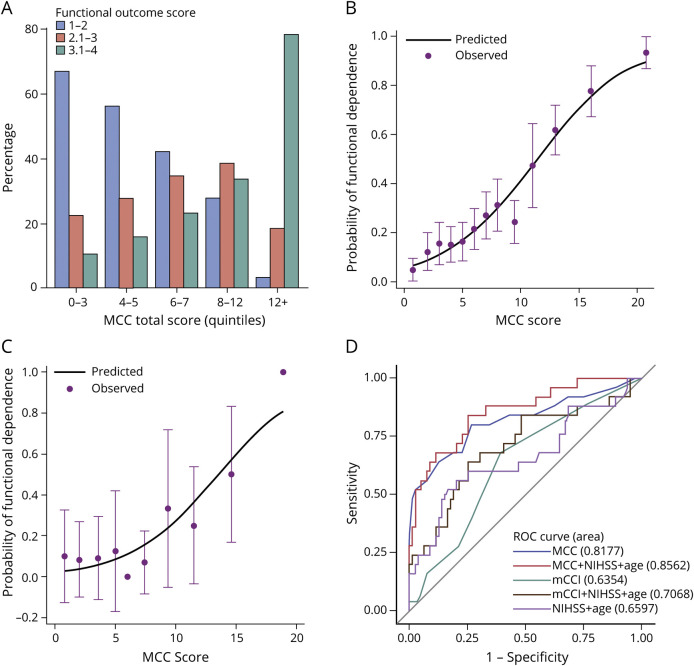
The distribution of the FO status (FO score 1–2, 2.1–3, and 3.1–4) across the quintiles of MCC index is shown in figure 3A. The risk of worse FO increased with the quintile of the MCC index. For example, the risk of being dependent at 90 days was 10%, 23%, or 78% for an MCC index score in quintile 1 (score 0–3), quintile 3 (score 6–7), or quintile 5 (score 12+), respectively. The observed and predicted probabilities of being functionally dependent (FO score >3) at 90 days were similar across the MCC index score subgroups (p = 0.60). Therefore, the MCC index was well calibrated in the training dataset (figure 3B).
Figure 3. Discrimination and Calibration.
(A) The proportions of patients in each functional outcome score levels by MCC index quintiles. Observed vs predicted proportion of functional dependency (functional outcome score >3) at 90 days in the training (B) and validation (C) dataset are shown. Dots represent the actual proportion of patients being functionally dependent. Vertical lines represent 95% confidence intervals of the actual proportion of patients being functionally dependent. The continuous lines represent the predicted probability of being functionally dependent in the training (B) and validation (C) datasets. (D) Receiver operating characteristic (ROC) curves for models predicting functional outcome at 90 days in the validation dataset. MCC = the new MCC index; mCCI = modified Charlson Comorbidity Index; mRS = modified Rankin Scale; NIHSS = NIH Stroke Scale.
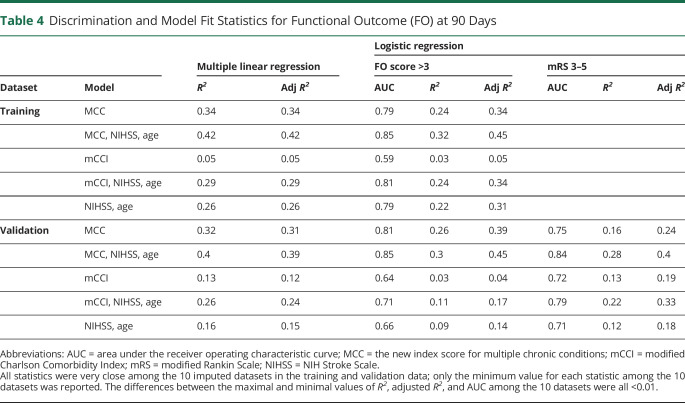
Statistics for the predictive performance in the training dataset are summarized in table 4. The proportion of variability in the FO score explained by the MCC index was 34% (adjusted R2 = 0.34) when FO was modeled continuously or dichotomously (FO score >3 vs 1–3). Compared to a model including only initial NIHSS and age (adjusted R2 = 0.26), including the MCC index explained an additional 16% of variability in FO score (adjusted R2 = 0.42). Together with age and initial NIHSS, the MCC index predicted functional dependency at 90 days with an excellent discriminating ability (AUC 0.85).
Table 4.
Discrimination and Model Fit Statistics for Functional Outcome (FO) at 90 Days
Model Validation
The MCC index was validated in the consecutive 111 patients from BASIC (October 1, 2016–October 31, 2017) who were alive at 90 days with FO recorded. Seven patients were excluded due to missing information for baseline characteristics. These 104 patients had similar distributions of age, sex, race–ethnicity, initial NIHSS, FO score, and MCC index score as patients in the training dataset (all p > 0.05). Among these 104 patients, 71% were Mexican American and 54% were female. The mean age was 66 ± 11 years. The medians for initial NIHSS and the FO score were 3 (IQR 1–5.5) and 2.35 (IQR 1.43–3), respectively. The median score of the MCC index was 7 (IQR 3–11.5). The proportion (94%) of patients with 2 or more conditions (of the 22 medical conditions measured) was higher than that in patients in the training dataset (88%, p < 0.05).
The additional amount of variance explained by the MCC index (24%) compared to only including initial NIHSS and age was even more notable than that in the training dataset (16%, table 4). The MCC index predicted functional dependency at 90 days more accurately (AUC 0.85) than the model with initial NIHSS and age (AUC 0.66). The observed and predicted probability of functional dependency at 90 days in the validation dataset is plotted in figure 3C. The MCC index was well calibrated in the validation dataset (p = 0.41).
The ability of the MCC index to discriminate favorable (mRS 0–2) vs unfavorable (mRS 3–5) outcome based on poststroke mRS-9Q was also validated at 90 days (table 4). Similarly, age and initial NIHSS-adjusted MCC index performed well in discriminating favorable and unfavorable outcome (AUC 0.84), much better than a model only including initial NIHSS and age (AUC 0.71).
MCC Index vs mCCI
We further compared our MCC index with the most widely used comorbidity index, the mCCI, for predicting FO in both the training and validation dataset (table 4).13,14,41 We found that mCCI alone explained little variability in FO.42 In the training dataset when FO was modeled continuously, mCCI explained 3% of the variability in FO in addition to age and initial NIHSS, much smaller than our MCC index (additional 16%). Findings were similar when FO was modeled dichotomously. This difference in performance was even more obvious in the validation dataset: our MCC index explained a much larger proportion of variability and predicted FO at 90 days more accurately than mCCI (table 4). Adjustment by initial NIHSS and age did not change these findings. When looking at the unfavorable outcome defined by mRS (3–5), these differences in performance were largely unchanged (table 4). Comparisons of the ROC curves showed that our MCC index was significantly more accurate in predicting FO at 90 days than mCCI with or without adjusting for initial NIHSS and age (all p < 0.05, figure 3D).
Discussion
We present the development and internal validation of a new assessment tool for MCC in patients with stroke that significantly improves the prediction of poststroke FO at 90 days. This relatively simple and yet integrated measure of chronic conditions, prestroke functional and cognitive impairments, and their synergistic effects can be assessed by neurologists or other health care providers during the acute hospitalization. Knowing the conditions that are most relevant to poststroke FO improves the accuracy of outcome prognosis, which is crucial for treatment decisions and discharge planning. The risk of worse FO increases with the index score in a graded fashion. The index alone, and with the adjustment for initial stroke severity and age, was validated internally to perform very well in discriminating FO status measured by both ADL/IADLs and mRS at 90 days. The new index demonstrates potential as an MCC assessment tool in ischemic stroke although further external validation in other stroke populations is required.
To build the MCC index, we used machine learning to perform variable selection—a novel approach for prognostic modeling in stroke, which assured the validity and stability of the selected predictors. The penalization regression method allowed us to assess a larger number of conditions simultaneously and discover 2 new predictors (weight loss and other neurologic disorders) that have not been considered before by other stroke risk scores that were based on clinical judgment or traditional model selection methods. The application of the hierNet method also allowed for the exploration of all possible interactions among potential predictors in a hierarchical manner, which led to the finding of 3 important interactions (dementia × age, CHF × renal failure, and prestroke mRS × prior stroke/TIA). In addition, this work was nested within a population-based, longitudinal stroke cohort with ethnic diversity, where capturing a full spectrum of comorbid conditions in the broader stroke population was more possible than studies conducted in single hospitals or rehabilitation-based settings.
Our MCC index is constructed by age, prestroke mRS, CHF, weight loss, diabetes, other neurologic disorders, dementia, renal failure, and prior stroke/TIA as independent or synergistic effects. The findings of these predictors are largely in line with previous research on the associations of individual comorbid conditions and poststroke FO. For example, CHF, diabetes, renal failure, and prestroke dependency have been included in existing MCC indices used in patients with stroke or prognostic models for stroke, including the mCCI, iScore, and the PLAN score.8,10,13,43,44 Although it was not our intention to develop a comprehensive prognostic model for stroke, including our index in a regression model with age and stroke severity showed similar if not superior discrimination compared with other prognostic models for poststroke FO that include additional variables, such as iScore and the PLAN score.9,10
Notably, several conditions in our MCC index were not included in the commonly used comorbidity index—the mCCI. The mCCI has been used predominantly by hospital-based studies of patients with stroke.13,14 CCI, which includes 19 chronic conditions weighted by their strength of associations with mortality, was originally developed as a prognostic indicator in patients with a variety of conditions and validated in patients with breast cancer.41 The mCCI is similar but excludes cerebrovascular disease and hemiplegia.13 In this study, we demonstrated the superior predictive performance of our MCC index over the mCCI. Our index is also a simpler tool that requires less information on comorbid conditions. We found that the mCCI was only weakly correlated with our MCC index. Although mCCI has been widely used to predict FO after stroke, it does not appear to fully capture the effect of function-related conditions in stroke. There has been some work showing that certain comorbid conditions may affect FO through pathophysiologic mechanisms that are specific to stroke,45–47 and therefore a stroke-specific MCC index is needed, as supported by our results.
Preferably, a stroke-specific MCC index should include not only the conditions that are relevant to FO but also their synergistic effects due to certain conditions clustering within individuals. However, the effect of MCC clustering in stroke outcomes is poorly understood, and interactions between chronic conditions have never been included in stroke prognostic scores. Take the interaction between prestroke function and prior stroke/TIA, for example. Not only have these factors rarely been examined together, many prognostic studies excluded patients with severe prestroke disability or were conducted in first-ever patients with stroke only.39 Given the limited data in this area, the mechanisms of the 3 interactions included are not clear but are worth future investigation.
This research has several strengths. First, the study was nested in a population-based, longitudinal stroke cohort with ethnic diversity. With more than 7 years of data and more than 1,000 ischemic strokes, the BASIC Project provided a large study population and sufficient statistical power to capture the variance in FO explained by MCC. The surveillance and validation of ischemic stroke cases and the identification of comorbid conditions from medical records and baseline interviews in addition to hospital discharge data and FO from patient interviews limited case ascertainment and measurement bias inherent in studies using administrative data alone. Second, a new conceptual model adding prestroke impairments assured a comprehensive assessment of MCC. The BASIC Project collects detailed data on prestroke functional, cognitive, and psychosocial impairments, which allowed the implementation of such a conceptual model and the adjustment of initial stroke severity and other important confounding factors. Third, using machine learning to perform variable selection for prognostic modeling was a novel approach in stroke outcome research, which assured the validity and stability of the selected predictors, and allowed for the consideration of synergism among identified predictors. Fourth, the developed MCC index is relatively simple, required less information compared to former MCC indices, and yet performed superiorly than the most widely used MCC indices in predicting both ADL/IADLs score and mRS.
This study has several limitations. Generalizability may be limited given the work was conducted in one community with a high proportion of Mexican Americans and our validation dataset was relatively small. External validation in larger stroke cohorts with different racial and ethnic distributions is required in the future before the application of this index. Although the FO measurement by ADL/IADLs may not be available in many other study populations, external validation can be conducted to examine the performance of the MCC index in predicting poststroke mRS. All predictors in our index were obtained from hospital discharge data and medical records except that prestroke mRS and dementia contained information from baseline patient interviews, which could limit the utility of our index in cohorts where interviews cannot be conducted. Our measurement of chronic conditions may be limited by the fact that only 25 diagnoses are available in the hospital discharge data; some individuals may have >25 conditions, and information on some geriatric syndromes (urine incontinence and falls) was not available. We did not have information to measure MCC severity, although including severity measures in comorbidity indices may also add complexity that challenges clinical utility.44 Due to the nature of the hospital discharge data and medical records, the temporality of some conditions and stroke may be ambiguous. Although some comorbid conditions may be secondary to stroke, they can still be broadly considered as comorbid conditions of stroke as they “co-occur during the clinical course of stroke.”48 Nonmedical factors, such as reimbursement, may influence the coding of chronic conditions.49 Some conditions, such as weight loss and other neurologic disorders, might be more susceptible to misclassification and low interrater reliability given that they were identified based on ICD codes without detailed medical history. Sicker patients with higher MCC at baseline may more likely be lost to follow-up at 90 days, introducing some selection bias. We excluded patients without hospital discharge data, although our data suggest that excluded patients were similar to included patients. We used multiple imputations to fill in missing values of prestroke impairment variables, although variables may not be missing at random. We limited our variable selection to 2-way interactions for the sake of model parsimoniousness and practical utility, which precluded the search for 3-way interactions, which may be important. There are other potential confounders that we did not control for in our analysis, such as physical activity, income, poststroke care, and rehabilitation, which are not collected by the current study.
We developed a relatively simple tool for the measurement of MCC that is function-relevant and specific for ischemic stroke. Weight loss, other neurologic disorders, and interactions between MCC were discovered as novel predictors. The MCC index showed superior ability in predicting poststroke FO measured by both ADL/IADLs and mRS at 90 days. This score demonstrates potential as an assessment tool for MCC in stroke prognosis, but further external validation is needed. Efforts to improve stroke survivorship may benefit from better understanding, prevention, and management of MCC in the population at high risk for stroke.
Acknowledgment
This study was performed in the Corpus Christi Medical Center and CHRISTUS Spohn Hospitals, CHRISTUS Health System, in Corpus Christi, Texas.
Glossary
- ADL
activities of daily living
- AUC
area under the receiver operating characteristic curve
- BASIC
Brain Attack Surveillance in Corpus Christi
- BMI
body mass index
- FO
functional outcome
- CHF
congestive heart failure
- IADL
instrumental activities of daily living
- ICD-9
International Classification of Diseases–9
- ICD-10
International Classification of Diseases–10
- IQCODE
Informant Questionnaire on Cognitive Decline in the Elderly
- IQR
interquartile range
- Lasso
least absolute shrinkage and selection operator
- MA
Mexican American
- MCC
multiple chronic conditions
- mCCI
modified Charlson Comorbidity Index
- mRS
modified Rankin Scale
- NIHSS
NIH Stroke Scale
- ROC
receiver operating characteristic
- VIF
variance inflation factor
Appendix 1. Authors

Appendix 2. Coinvestigators
Footnotes
Class of Evidence: NPub.org/coe
Study Funding
This study was supported by American Heart Association Predoctoral Fellowship (18PRE33990493) and NIH (R01 NS38916).
Disclosure
The authors report no disclosures relevant to the manuscript. Go to Neurology.org/N for full disclosures.
References
- 1.Wade DT, Hewer RL. Functional abilities after stroke: measurement, natural history and prognosis. J Neurol Neurosurg Psychiatry 1987;50:177–182. [DOI] [PMC free article] [PubMed] [Google Scholar]
- 2.Duncan PW. Stroke disability. Phys Ther 1994;74:399–407. [DOI] [PubMed] [Google Scholar]
- 3.Ntaios G, Faouzi M, Ferrari J, Lang W, Vemmos K, Michel P. An integer-based score to predict functional outcome in acute ischemic stroke: the ASTRAL score. Neurology 2012;78:1916–1922. [DOI] [PubMed] [Google Scholar]
- 4.Counsell C, Dennis M. Systematic review of prognostic models in patients with acute stroke. Cerebrovasc Dis 2001;12:159–170. [DOI] [PubMed] [Google Scholar]
- 5.Lewis JA. Statistical principles for clinical trials (ICH E9): an introductory note on an international guideline. Stat Med 1999;18:1903–1942. [DOI] [PubMed] [Google Scholar]
- 6.Young FB, Lees KR, Weir CJ. Improving trial power through use of prognosis-adjusted end points. Stroke 2005;36:597–601. [DOI] [PubMed] [Google Scholar]
- 7.Saposnik G, iScore Research T. An integer-based score to predict functional outcome in acute ischemic stroke: the ASTRAL score. Neurology 2012;79:2293; author reply 2293–2294. [DOI] [PubMed] [Google Scholar]
- 8.Saposnik G, Kapral MK, Liu Y, et al. IScore: a risk score to predict death early after hospitalization for an acute ischemic stroke. Circulation 2011;123:739–749. [DOI] [PubMed] [Google Scholar]
- 9.Saposnik G, Raptis S, Kapral MK, et al. The iScore predicts poor functional outcomes early after hospitalization for an acute ischemic stroke. Stroke 2011;42:3421–3428. [DOI] [PubMed] [Google Scholar]
- 10.O'Donnell MJ, Fang J, D'Uva C, et al. The PLAN score: a bedside prediction rule for death and severe disability following acute ischemic stroke. Arch Intern Med 2012;172:1548–1556. [DOI] [PubMed] [Google Scholar]
- 11.Fried LP, Ferrucci L, Darer J, Williamson JD, Anderson G. Untangling the concepts of disability, frailty, and comorbidity: implications for improved targeting and care. J Gerontol Biol Sci Med Sci 2004;59:M255–M263. [DOI] [PubMed] [Google Scholar]
- 12.Guralnik JM, LaCroix AZ, Everett DF, Kovar MG. Aging in the eighties: the prevalence of comorbidity and its association with disability. Hyattsville, MD: National Center for Health Statistics; 1989. [Google Scholar]
- 13.Goldstein LB, Samsa GP, Matchar DB, Horner RD. Charlson index comorbidity adjustment for ischemic stroke outcome studies. Stroke 2004;35:1941–1945. [DOI] [PubMed] [Google Scholar]
- 14.Jiang X, Morgenstern LB, Cigolle CT, Claflin ES, Lisabeth LD. Multiple chronic conditions and functional outcome after ischemic stroke: a systematic review and meta-analysis. Neuroepidemiology 2020;54:205–213. [DOI] [PubMed] [Google Scholar]
- 15.Katan M, Fluri F, Morgenthaler NG, et al. Copeptin: a novel, independent prognostic marker in patients with ischemic stroke. Ann Neurol 2009;66:799–808. [DOI] [PubMed] [Google Scholar]
- 16.Fischer U, Mono ML, Zwahlen M, et al. Impact of thrombolysis on stroke outcome at 12 months in a population: the Bern stroke project. Stroke 2012;43:1039–1045. [DOI] [PubMed] [Google Scholar]
- 17.Colantonio A, Kasl SV, Ostfeld AM, Berkman LF. Psychosocial predictors of stroke outcomes in an elderly population. J Gerontol 1993;48:S261–S268. [DOI] [PubMed] [Google Scholar]
- 18.Lisabeth LD, Sánchez BN, Baek J, et al. Neurological, functional, and cognitive stroke outcomes in Mexican Americans. Stroke 2014;45:1096–1101. [DOI] [PMC free article] [PubMed] [Google Scholar]
- 19.Piriyawat P, Smajsová M, Smith MA, et al. Comparison of active and passive surveillance for cerebrovascular disease: the Brain Attack Surveillance in Corpus Christi (BASIC) project. Am J Epidemiol 2002;156:1062–1069. [DOI] [PubMed] [Google Scholar]
- 20.Smith MA, Risser JM, Moyé LA, et al. Designing multi-ethnic stroke studies: The Brain Attack Surveillance in Corpus Christi (BASIC) project. Ethn Dis 2004;14:520–526. [PubMed] [Google Scholar]
- 21.United States Census Bureau. Texas: QuickFacts Nueces County; 2016. [Google Scholar]
- 22.World Health Organization. MONICA Manual, Part 4, Section 3: Event registration quality assurance methods [online]. Available at: http://www.thl.fi/publications/monica/manual/part4/iv-3.htm. Accessed June 22, 2016. [Google Scholar]
- 23.Spector WD, Fleishman JA. Combining activities of daily living with instrumental activities of daily living to measure functional disability. J Gerontol B Psychol Sci Soc Sci 1998;53:S46–S57. [DOI] [PubMed] [Google Scholar]
- 24.Patel N, Rao VA, Heilman-Espinoza ER, Lai R, Quesada RA, Flint AC. Simple and reliable determination of the modified Rankin scale score in neurosurgical and neurological patients: the mRS-9Q. Neurosurgery 2012;71:971–975. [DOI] [PubMed] [Google Scholar]
- 25.Elixhauser A, Steiner C, Harris DR, Coffey RM. Comorbidity measures for use with administrative data. Med Care 1998;36:8–27. [DOI] [PubMed] [Google Scholar]
- 26.Rankin J. Cerebral vascular accidents in patients over the age of 60: II: prognosis. Scott Med J 1957;2:200. [DOI] [PubMed] [Google Scholar]
- 27.Jorm AF. A short form of the Informant Questionnaire on Cognitive Decline in the Elderly (IQCODE): development and cross-validation. Psychol Med 1994;24:145–153. [DOI] [PubMed] [Google Scholar]
- 28.Murao K, Bodenant M, Cordonnier C, et al. Does pre-existing cognitive impairment no-dementia influence the outcome of patients treated by intravenous thrombolysis for cerebral ischaemia? J Neurol Neurosurg Psychiatry 2013;84:1412–1414. [DOI] [PubMed] [Google Scholar]
- 29.Sharrief AZ, Sanchez BN, Lisabeth LD, et al. The impact of pre-stroke depressive symptoms, fatalism, and social support on disability after stroke. J Stroke Cerebrovasc Dis 2017;26:2686–2691. [DOI] [PMC free article] [PubMed] [Google Scholar]
- 30.Williams LS, Yilmaz EY, Lopez-Yunez AM. Retrospective assessment of initial stroke severity with the NIH Stroke Scale. Stroke 2000;31:858–862. [DOI] [PubMed] [Google Scholar]
- 31.Breiman L. Heuristics of instability and stabilization in model selection. Ann Stat 1996;24:2350–2383. [Google Scholar]
- 32.Fan J, Li R. Statistical challenges with high dimensionality: feature selection in knowledge discovery. arXiv preprint math/0602133. 2006. [Google Scholar]
- 33.Zou H. The adaptive Lasso and its oracle properties. J Am Stat Assoc 2006;101:1418–1429. [Google Scholar]
- 34.Tibshirani R. Regression shrinkage and selection via the Lasso. J Roy Stat Soc B Met 1996;58:267–288. [Google Scholar]
- 35.Bien J, Taylor J, Tibshirani R. A lasso for hierarchical interactions. Ann Stat 2013;41:1111–1141. [DOI] [PMC free article] [PubMed] [Google Scholar]
- 36.Li H, Liu Y, Gong P, Zhang C, Ye J, Initiative ADN. Hierarchical interactions model for predicting mild cognitive impairment (MCI) to Alzheimer's disease (AD) conversion. PLoS One 2014;9:e82450. [DOI] [PMC free article] [PubMed] [Google Scholar]
- 37.Wood AM, White IR, Royston P. How should variable selection be performed with multiply imputed data? Stat Med 2008;27:3227–3246. [DOI] [PubMed] [Google Scholar]
- 38.Neter J, Wasserman W, Kutner MH. Applied Linear Regression Models. New York; McGraw-Hill: 1989. [Google Scholar]
- 39.Veerbeek JM, Kwakkel G, van Wegen EE, Ket JC, Heymans MW. Early prediction of outcome of activities of daily living after stroke: a systematic review. Stroke 2011;42:1482–1488. [DOI] [PubMed] [Google Scholar]
- 40.DeLong ER, DeLong DM, Clarke-Pearson DL. Comparing the areas under two or more correlated receiver operating characteristic curves: a nonparametric approach. Biometrics 1988;44:837–845. [PubMed] [Google Scholar]
- 41.Charlson ME, Pompei P, Ales KL, MacKenzie CR. A new method of classifying prognostic comorbidity in longitudinal studies: development and validation. J Chronic Dis 1987;40:373–383. [DOI] [PubMed] [Google Scholar]
- 42.Tessier A, Finch L, Daskalopoulou SS, Mayo NE. Validation of the Charlson Comorbidity Index for predicting functional outcome of stroke. Arch Phys Med Rehabil 2008;89:1276–1283. [DOI] [PubMed] [Google Scholar]
- 43.Liu M, Domen K, Chino N. Comorbidity measures for stroke outcome research: a preliminary study. Arch Phys Med Rehabil 1997;78:166–172. [DOI] [PubMed] [Google Scholar]
- 44.Ferriero G, Franchignoni F, Benevolo E, Ottonello M, Scocchi M, Xanthi M. The influence of comorbidities and complications on discharge function in stroke rehabilitation inpatients. Eura Medicophys 2006;42:91–96. [PubMed] [Google Scholar]
- 45.Huynh W, Kwai N, Arnold R, et al. The effect of diabetes on cortical function in stroke: implications for poststroke plasticity. Diabetes 2017;66:1661–1670. [DOI] [PubMed] [Google Scholar]
- 46.Prosser-Loose EJ, Verge VM, Cayabyab FS, Paterson PG. Protein-energy malnutrition alters hippocampal plasticity-associated protein expression following global ischemia in the gerbil. Curr Neurovasc Res 2010;7:341–360. [DOI] [PubMed] [Google Scholar]
- 47.Snowdon DA, Greiner LH, Mortimer JA, Riley KP, Greiner PA, Markesbery WR. Brain infarction and the clinical expression of Alzheimer disease: the Nun Study. JAMA 1997;277:813–817. [PubMed] [Google Scholar]
- 48.Feinstein AR. The pre-therapeutic classification of co-morbidity in chronic disease. J Chronic Dis 1970;23:455–468. [DOI] [PubMed] [Google Scholar]
- 49.Hsia DC, Krushat WM, Fagan AB, Tebbutt JA, Kusserow RP. Accuracy of diagnostic coding for Medicare patients under the prospective-payment system. N Engl J Med 1988;318:352–355. [DOI] [PubMed] [Google Scholar]
Associated Data
This section collects any data citations, data availability statements, or supplementary materials included in this article.
Data Availability Statement
The data will not be made available to the public because of their restricted nature.


