

Abstract
Objective
To measure the out-of-pocket (OOP) costs of evaluation and management (E/M) services and common diagnostic testing for neurology patients.
Methods
Using a large, privately insured health care claims database, we identified patients with a neurologic visit or diagnostic test from 2001 to 2016 and assessed inflation-adjusted OOP costs for E/M visits, neuroimaging, and neurophysiologic testing. For each diagnostic service each year, we estimated the proportion of patients with OOP costs, the mean OOP cost, and the proportion of the total service cost paid OOP. We modeled OOP cost as a function of patient and insurance factors.
Results
We identified 3,724,342 patients. The most frequent neurologic services were E/M visits (78.5%), EMG/nerve conduction studies (NCS) (7.7%), MRIs (5.3%), and EEGs (4.5%). Annually, 86.5%–95.2% of patients paid OOP costs for E/M visits and 23.1%–69.5% for diagnostic tests. For patients paying any OOP cost, the mean OOP cost increased over time, most substantially for EEG, MRI, and E/M. OOP costs varied considerably; for an MRI in 2016, the 50th percentile paid $103.10 and the 95th percentile paid $875.40. The proportion of total service cost paid OOP increased. High deductible health plan (HDHP) enrollment was associated with higher OOP costs for MRI, EMG/NCS, and EEG.
Conclusion
An increasing number of patients pay OOP for neurologic diagnostic services. These costs are rising and vary greatly across patients and tests. The cost sharing burden is particularly high for the growing population with HDHPs. In this setting, neurologic evaluation might result in financial hardship for patients.
Out-of-pocket (OOP) medical costs have increased in a recent effort by health insurance companies and employers to contain spending.1–4 We know little regarding OOP costs of neurologist care and the potential impact of increased cost sharing on neurology patients.
Cost sharing is supported by the theory of moral hazard, which proposes that individuals will take greater risk if someone else bears the consequences.5 The theory suggests that individuals will use less health care when they experience higher cost sharing, which has been demonstrated in some experiments.6 However, there is evidence that cost sharing may decrease use of appropriate health care.7,8 Furthermore, the concept of cost sharing presupposes that the value of a test may be weighed against the cost, yet the actual OOP costs of testing are largely invisible.9 Although neurologic tests are known to be costly to the health care system,10,11 the costs to individual patients are more challenging to estimate as posted prices, when available, rarely match actual costs, and there is considerable variation in charges across facilities, insurers, and patients.
Use of a large, privately insured administrative claims dataset offers a unique opportunity to examine individual OOP costs. We sought to measure the inflation-adjusted OOP costs of evaluation and management (E/M) services and common neurologic testing, characteristics of patients and insurance plans associated with OOP costs, and trends in cost sharing for neurologic diagnostic services. This quantification of financial burden is important for evaluating the impact of cost sharing on neurology patients' health care utilization, clinical outcomes, and economic well-being.
Methods
Standard Protocol Approvals, Registrations, and Patient Consents
The University of Michigan Institutional Review Board determined that this study was exempt.
Dataset and Population
We used the de-identified Clinformatics Datamart (OptumInsight, Eden Prairie, MN) database, which contains detailed medical and pharmaceutical claims for more than 73 million individuals insured by UnitedHealthcare from January 2001 to June 2016. We identified patients who had an encounter with a neurologist or had neurologic diagnostic testing ordered by a neurologist. Neurologists were identified by provider category code or the National Uniform Claim Committee taxonomy code in the OptumInsight data. We identified claims for diagnostic tests with a neurologist listed as the referring provider (taxonomy), billing provider (taxonomy), service provider (taxonomy), or provider category (provider category code). Using “place of service” codes, we excluded claims completed in the inpatient setting.
We included E/M services, both new/consults (Current Procedural Terminology 99201–99205, 99241–99245) and return visits (99211–99215), provided by neurologists. We examined the top 6 neurologic diagnostic tests as ranked by aggregate expenditures: (1) MRI of the neuroaxis (brain: 70551–70553; cervical: 72141, 72142, 72156; thoracic: 72146, 72147, 72157; lumbosacral: 72148, 72149, 72158; magnetic resonance angiography [MRA] head: 70545, 70546; MRA neck: 70547–70549), (2) EMG/nerve conduction studies (NCS) (95860–95670, 95885–95886, 95900, 95903, 95904, 95934, 95936, 95907–95913), (3) EEG (95812, 95813, 95816, 95819, 95822, 95953), (4) polysomnogram (PSG) (95800, 95801, 95805–95811, 94660), (5) CT of the neuroaxis (brain: 70450, 70460, 70470; cervical: 72125–72127; thoracic: 72128–72130; lumbosacral: 72131–72133; CTA head: 70496; CTA neck: 70498), and (6) carotid ultrasound (CUS) (93880). As there were not substantial differences in OOP costs between subtypes of neuroimaging and neurophysiologic studies, all MRIs were grouped together for analysis, as were all EMG/NCS, all EEGs, all PSGs, and all CTs.
Demographics and Clinical Variables
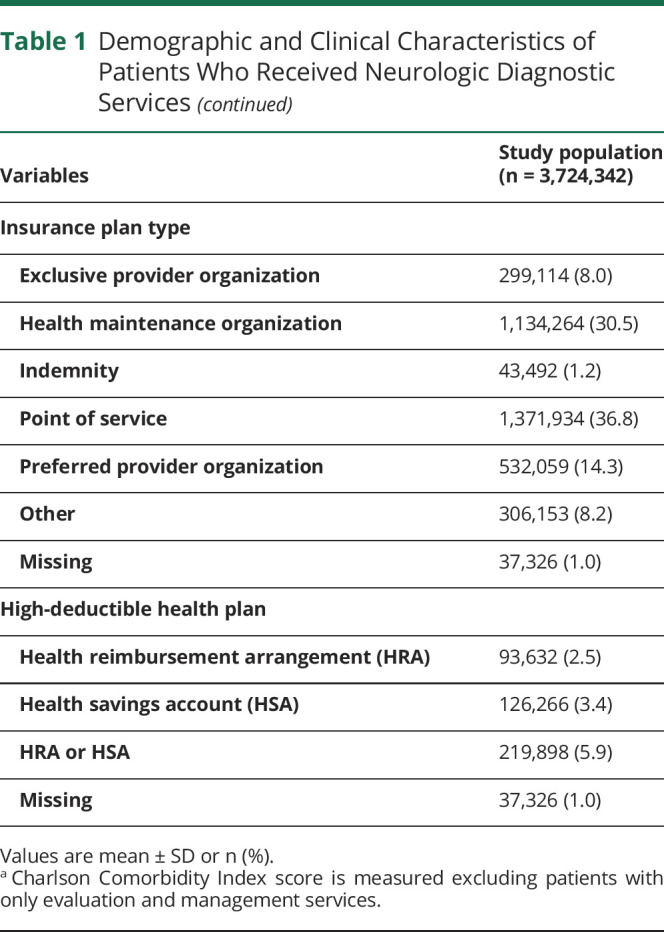
The dataset included patient age, sex, race/ethnicity, geographic region, education level, household income, insurance plan type (preferred provider organization [PPO], exclusive provider organization, health maintenance organization, indemnity, point of service, other), and high deductible health plan (HDHP) status (defined as having a health reimbursement arrangement [HRA] or health savings account [HSA]). The Charlson Comorbidity Index was also calculated.12
Outcomes
For each diagnostic service, we determined the proportion of patients each year who had any OOP cost (i.e., an OOP cost >$0). OOP cost included the copayment (“copay”), deductible payment, and coinsurance payment associated with the diagnostic service; these amounts represented the insurer's calculation of the requested payments from the patient to the service provider. Among patients with any OOP cost, we calculated the mean individual OOP cost per procedure each year. If an individual patient had multiple occurrences of the same diagnostic service within 1 calendar year, we first averaged those individual OOP costs before calculating the population mean. To account for inflation, costs were adjusted to 2016 prices using the Consumer Price Index.13
Secondary outcomes included the proportion of total diagnostic service costs that were attributed to OOP charges and cumulative OOP costs for neurologic and non-neurologic diagnostic testing in the first year following an initial diagnostic test.
Statistical Analysis
Descriptive statistics were used to characterize the population of patients who had any neurologic diagnostic services (encounter with a neurologist or diagnostic testing ordered by a neurologist) from 2001 to 2016. For each diagnostic service, we calculated the proportion of patients with any OOP costs in each year. Of patients with OOP costs, we calculated the population mean OOP cost for each test as well as the 25th, 50th, 75th, 95th, and 99th percentiles of patient-specific mean OOP costs for each test. Separately, to delineate fluctuations in OOP costs throughout the course of a calendar year, the mean OOP costs for MRI were calculated in each month from 2001 to 2016. We also calculated the proportion of total diagnostic service costs that were paid OOP by patients.
To add context to the cost of neurologic testing, we assessed how the cumulative costs for neurologic diagnostic testing in the year subsequent to a completed neurologic test compared to the cumulative costs from all medical diagnostic testing over the subsequent year. Using clinical classifications software codes to identify diagnostic testing, cumulative costs were calculated for each day in the subsequent year following a neurologic test performed in 2014 or 2015. In each day of follow-up, we determined the mean population cumulative OOP cost for both neurologic tests and all diagnostic testing. We also calculated the 25th, 50th, 75th, 95th, and 99th percentiles of total cumulative neurologic testing costs over 1 year.
In addition, we modeled OOP costs as a function of patient demographics and insurance plan characteristics to understand which factors were associated with OOP costs. We utilized a 2-part modeling approach to determine which patient demographics and insurance plan characteristics were associated with OOP costs for EMG/NCS, MRI, and EEG (the most common diagnostic tests). To identify the most current associations, we limited this analysis to tests that occurred between 2014 and 2016. First, multivariable logistic regression models were fit to quantify associations between patient factors and whether there were any OOP costs between 2014 and 2016 for the 3 diagnostic tests separately. For patients who had any OOP costs, we built separate gamma regression models with a log-link to determine associations between patient factors and mean OOP costs between 2014 and 2016 for the 3 diagnostic tests separately.14 In addition, we fit logistic regression models for EMG/NCS, MRI, and EEG to determine which patient factors were associated with having a very high (above the 90th percentile) OOP cost between 2014 and 2016.
Lastly, to understand cost sharing trends for neurology patients, we measured the proportion of patients in HDHPs each year over the study period.
Data management and analysis was completed using SAS v9.4 and R v3.4.2.
Data Availability
The Clinformatics Datamart (OptumInsight) database is commercially available.
Results
We identified 3,724,342 unique patients who had a neurologist outpatient visit or a neurologic test ordered by a neurologist from January 2001 to June 2016. Demographic and clinical characteristics of the study population are presented in table 1. Within this population, a total of 14,222,479 neurologic diagnostic services were performed: 1,098,986 EMG/NCS, 751,930 MRIs, 641,693 EEGs, 410,460 PSGs, 95,211 CUSs, 64,647 CTs, and 11,159,552 E/M visits to neurologists (26.9% were new visits).
Table 1.
Demographic and Clinical Characteristics of Patients Who Received Neurologic Diagnostic Services

For diagnostic testing, the percentage of patients who paid OOP costs varied across diagnostic tests but consistently increased over the study period. For EMG/NCS, the proportion of patients who paid OOP costs increased from 30.3% in 2001 to 52.5% in 2016, for MRI 23.5%–69.5%, for EEG 28.3%–45.9%, for PSG 32.5%–42.5%, for CUS 23.5%–47.9%, and for CT 26.7%–47.7%. For E/M visits, the majority of patients (86.5%–95.2%) paid OOP costs across all years (figure 1A).
Figure 1. Proportion of Patients With Out-of-Pocket (OOP) Costs for Neurologic Diagnostic Services, Mean OOP Cost for Patients With OOP Costs, and Mean OOP Cost Proportion for Patients With OOP Costs.

(A) Proportion of patients with OOP costs for neurologic diagnostic services. (B) Mean OOP cost for patients with OOP costs. (C) Mean OOP cost proportion for patients with OOP costs. CUS = carotid ultrasound; E/M = evaluation and management; NCS = nerve conduction studies; PSG = polysomnogram.
For patients paying OOP costs, the mean OOP costs rose over the study period: EMG/NCS ($73.9–$153.2; 107% increase), MRI ($83.8–$241.6; 188% increase), EEG ($38.7–$112.4; 190% increase), PSG ($102.0–$151.8; 49% increase), CUS ($35.4–$56.4; 59% increase), CT ($44.3–$97.2; 119% increase), and E/M ($18.2–$52.3; 187% increase) (figure 1B). For both E/M visits and diagnostic tests, the mean proportion of the total service cost that was paid OOP increased throughout the study period for patients paying OOP costs (EMG/NCS: 22.5%–27.4%; MRI: 6.8%–15.0%; EEG: 10.6%–15.0%; PSG: 8.6%–16.1%; CUS: 9.4%–11.1%; CT: 6.7%–15.1%; and E/M: 11.7%–17.6%) (figure 1C).
A small number of patients paid a large amount for their neurologic diagnostic services. In 2016, patients in the 95th percentile of cost were paying OOP costs of $538.0 for EMG/NCS, $875.4 for MRI, $374.7 for EEG, $560.5 for PSG, $193.4 for CUS, $330.9 for CT, and $146.9 per E/M visit. The range of percentiles of OOP costs for each service for years 2001, 2008, and 2016 are listed in table 2.
Table 2.
Mean Out-of-Pocket (OOP) Costs and Percentiles of OOP Costs per Service for Patients With OOP Costs in 2001, 2008, and 2016

Looking at recent years (testing performed in 2014–2016), the cumulative neurologic testing costs summed over 1 year by percentile were 25th percentile, $0.0; 50th percentile, $37.3; 75th percentile, $126.7; 95th percentile, $558.1; and 99th percentile, $1,419.2. These cumulative neurologic testing OOP costs represented 28.2% of the mean cumulative costs from all medical diagnostic testing over the year (mean cumulative cost $130.7 vs $463.1) (figure 2).
Figure 2. Mean Cumulative Out-of-Pocket (OOP) Costs From Neurologic Diagnostic Testing vs All Medical Diagnostic Testing (Starting in 2014 and 2015).

The mean OOP cost for MRI was stable throughout the calendar year for the first several years of the study period; however, as cost sharing strategies (e.g., larger deductibles) took off around 2007, the OOP cost of testing appeared to decrease as the year progressed. In 2015, the mean OOP cost for an MRI was $287.2 in January and declined to $192.4 in December (figure 3).
Figure 3. Mean Out-of-Pocket (OOP) Cost for MRI by Month.

While there were several significant associations between patient characteristics, insurance factors, and OOP costs for MRI, EMG/NCS, and EEG, a limited number of factors had a consistent relationship and potential clinical relevance (tables 3 and 4). As compared to PPOs, other insurance plan types were largely associated with a lower odds of any OOP cost and with a lower odds of having OOP costs above the 90th percentile. Enrollment in an HDHP was associated with greater odds of having an OOP payment for MRI (odds ratio [OR] 1.23, 95% confidence interval [CI] 1.18–1.28), EMG/NCS (OR 4.75, 95% CI 4.56–4.94), and EEG (OR 4.66, 95% CI 4.42–4.91) and was associated with increased OOP costs for each test (MRI: exp[PE] 1.17, 95% CI 1.14–1.20; EMG/NCS: exponentiated point estimate [exp(PE)]1.38, 95% CI 1.35–1.41; EEG: exp[PE] 1.42, 95% CI 1.38–1.47). Patients with HDHPs also had a higher odds of having OOP costs above the 90th percentile for MRI (OR 1.29, 95% CI 1.22–1.36), EMG/NCS (OR 4.69, 95% CI 4.49–4.90), and EEG (OR 3.90, 95% CI 3.67–4.16).
Table 3.
Patient and Insurance Factors Associated With Out-of-Pocket (OOP) Costs

Table 4.
Patient and Insurance Factors Associated With High Out-of-Pocket (OOP) Costs (Above the 90th Percentile) from 2014 to 2016

The proportion of neurologic patients with HDHPs steadily increased throughout the study period. In 2001%, 0.0% of the study population was enrolled in an HDHP; by 2016, this number had increased to 11.0%.
Discussion
Using this large, privately insured health care claims database to evaluate OOP costs of neurologic care, we identified several important trends. First, we found that the proportion of patients paying OOP costs for E/M services has been consistently high (>86%), whereas those paying OOP costs for diagnostic testing was previously low (∼30%) but has become increasingly common over the past decade. Second, patients are paying a greater amount per service in recent years, with mean OOP payments around $50–$100 for E/M, CUS, and CT, and $100–$200 for EMG/NCS, EEG, PSG, and MRI. Third, a high degree of variability in OOP costs for diagnostic tests is present.
The majority of patients had OOP costs for E/M neurology visits and this was consistent over time. However, the OOP cost associated with an E/M visit remained relatively low (mean $52.3 in 2016). For diagnostic testing, both the proportion of patients paying OOP costs and the OOP cost trended upward over time. This finding varied across diagnostic tests: in 2016, the proportion of patients with an OOP cost for MRI was 69.5% as compared to 42.5% for PSG. Such differences in cost sharing may create differential incentives, and it is unknown whether such incentivization is harmful or beneficial to health outcomes.
We found pronounced variability across patients in OOP costs for the same diagnostic test in the same year even within a single insurer. Although fewer than two-thirds of patients face OOP costs for diagnostic testing, our work demonstrated that the proportion of patients facing OOP costs, the magnitude of OOP costs, and the proportion of total service cost shifted to patients have continued to increase over time. Furthermore, a small number of patients (i.e., the 95th percentile and above) are paying a large sum for neurologic diagnostic services. Using 2016 as an example, 30.5% of patients had no OOP expenses for MRI. However, of those who did, the median cost was $103 and the 95th percentile paid $875 OOP. The financial burden experienced by patients is likely exacerbated by the common occurrence of multiple tests being ordered at once as part of a diagnostic evaluation (e.g., brain MRI and EEG for suspected seizures). In addition, for many patients, neurologic testing costs are a just a fraction (∼28% from our estimates) of the cost of all medical diagnostic testing over 1 year. These OOP charges have the potential to cause real financial hardship, as according to the 2018 Federal Reserve survey of households ∼30% of Americans do not have sufficient savings to cover their monthly bills plus an unexpected $400 expense.15 From our data, we estimate that 7.7% (7,712/99687) of patients included in study years 2014–2015 experienced cumulative OOP charges for neurologic tests of $400 or greater over 1 year.
Given the magnitude and variability of OOP expenses as well as the economic hazard, there is an urgent need for patients to know what a test will cost them at the time of prescription. Although there has been recent activity to mandate price reporting (e.g., hospitals must publicly post standard charge information), including an executive order by President Trump in June 2019,16 it is not clear that these data will be presented in a way that is useful to patients.17,18 These data represent the hospitals' chargemaster prices, which typically are crafted to be significantly higher than the highest contracted rate for a service and thus designed to maximize reimbursement across all accepted insurances. It is critical that patients are able to see their personalized potential charges to make informed decisions about health care utilization and to make necessary financial plans. Neurologists may be unaware whether they are asking patients to pursue MRIs associated with no expense, $103, or $875 OOP. It is also important for patients to see the risk-adjusted quality metrics for the sites where they intend to receive care, as cost is only one part of the value equation.
The most important predictor of OOP costs was found to be enrollment in an HDHP. National trends, as well as the trend within neurologic patients measured in our study, forecast continued growth in HDHP enrollment that has already tripled in the past decade.2,4 It is worth noting that the deductible portion of these health plans only defines part of the OOP expenses; in 2020, the maximum OOP expenses (the sum of deductibles, copayments, and coinsurance) in HDHPs could reach as high as $6,900 for an individual and $13,800 for a family: a limit that does not apply to out-of-network services.19 It is possible that HDHP beneficiaries, particularly healthy ones, in fact spend less overall on health care due to lower health care utilization in combination with lower premiums. However, there is increasing evidence that high cost sharing plans may not improve health care utilization as originally intended. For example, HDHPs appear to be associated with decreased use of preventative care and ambulatory care,8 and HDHPs may cause patients with chronic illnesses to reduce ambulatory visits,20 which could have major implications for the care of neurologic patients. Medical financial hardship is prevalent throughout the United States21 and high cost sharing in particular has been associated with financial hardship for cancer survivors.22 Moreover, a high level of cost sharing does not incentivize the development of consumer sophistication23 and, in fact, HDHP enrollees may believe that higher-priced facilities and providers are associated with higher quality care.24 Future studies will need to elucidate how the HDHP-associated reduction in health care utilization affects health outcomes for neurologic patients.
A responsibility falls on the provider to support informed patient decision-making with regard to diagnostic service costs, and there are several ways that cost information could be integrated into patient care. As each patient's insurance carrier and benefit structure can have unique implications on OOP costs, talking to patients about their health insurance plan is a wise practice. To augment this effort, electronic medical records (EMRs) could have the capability to flag patients with HDHPs and proactively identify those most vulnerable to higher cost sharing. Because a patient's deductible balance is a moving target throughout the year that has great effect on diagnostic service OOP costs (as demonstrated by our MRI OOP cost data, which fluctuates across months as the deductible is spent down), it would be useful to develop methods for real-time capture of a patient's outstanding deductible amount, for example through coordination of data between the EMR and insurance plan using an online fee estimator.25 If this is not possible due to the required EMR interface development, especially in small private practices, it would be helpful for patients themselves to have access to applications that provide up-to-date data on their year-to-date costs and an estimate of the OOP expenditure for various diagnostic tests. Lastly, we can and should encourage our patients to engage in consumer strategies (e.g., price shopping across service locations) to mitigate costs.26 However, ideally this strategy would be informed by additional knowledge that may influence decision-making, such as practice quality metrics and relevant expertise of the individuals interpreting tests.
The greatest limitation of this study is that we only analyzed OOP costs and total service costs within one insurer: UnitedHealthcare. Although this represents the largest privately insured population in the United States, it is unknown how the trends we demonstrate would generalize to other private insurance beneficiaries or Medicaid. The dataset's OOP cost amounts come from the insurer and describe the requested payments from the patient to the service provider. In addition, while the OOP costs are exact numbers, the total service costs are estimates. The HDHP cohort was defined by use of an HSA or HRA; while these accounts do indicate enrollment in an HDHP plan, this strategy does not comprehensively capture HDHP enrollees. We are not able to determine how the overall health care expenditures of patients in HDHPs compare with the amount they would have spent on a conventional plan. Due to limitations of the dataset, we are not able to involve provider-level variables to evaluate the effect of provider characteristics on OOP costs. Another consideration is that administrative claims data only capture tests performed; to evaluate how OOP costs might affect health care utilization, it would be useful to have access to information regarding testing that was ordered by providers but never completed by patients.
From 2001 to 2016, OOP costs for neurologic diagnostic evaluation have continued to rise. There is substantial variability in OOP costs across patients and the burden of cost sharing is particularly great for patients with HDHPs. It is critical for physicians and patients to consider cost in individualizing decisions about health care utilization and greater price transparency would be beneficial.
Glossary
- CI
confidence interval
- CUS
carotid ultrasound
- E/M
evaluation and management
- EMR
electronic medical record
- HDHP
high-deductible health plan
- HRA
health reimbursement arrangement
- HSA
health savings account
- MRA
magnetic resonance angiography
- NCS
nerve conduction studies
- OOP
out-of-pocket
- OR
odds ratio
- PPO
preferred provider organization
- PSG
polysomnogram
Appendix. Authors

Footnotes
Study Funding
The study was funded by the American Academy of Neurology Health Services Research Subcommittee. Chloe Hill is supported by NIH KL2TR002241. Evan Reynolds is supported by NIH T32NS0007222. James Burke is supported by R01 AG059733 and R01 MD008879. Mousumi Banerjee has no funding to report. Kevin Kerber is supported by AHRQ R18 HS022258. Brandon Magliocco is an employee of the American Academy of Neurology and has no funding to report. Gregory Esper has no funding to report. Lesli Skolarus is supported by NIH R01 MD008879, U01 AG032947, and R01 MD011516. Brian Callaghan is supported by NIH NIDDK R-01 DK115687 and VA CSRD Merit CX001504.
Disclosure
C. Hill, E. Reynolds, J. Burke, M. Banerjee, K. Kerber, and B. Magliocco report no disclosures relevant to the manuscript. G. Esper is on the scientific advisory board for NeuroOne, Inc, a medical device company, and performs medical legal expert consultations. Lesli Skolarus performed consulting for Bracket Global. Brian Callaghan receives research support from the American Academy of Neurology, which supported this project. He consults for a PCORI grant, triages articles and performs evidence-based reviews for DynaMed, and performs medical legal consultations including for the vaccine injury compensation program. Go to Neurology.org/N for full disclosures.
References
- 1.Herman B. More Americans gain health coverage, but their cost-sharing keeps rising. Mod Healthc 2016;46:12. [PubMed] [Google Scholar]
- 2.Claxton G, Rae M, Long M, Damico A, Whitmore H. Kaiser Family Foundation Employer Health Benefits 2018 Annual Survey. Oakland, CA: Kaiser Family Foundation; 2018. [Google Scholar]
- 3.Haviland AM, Marquis MS, McDevitt RD, Sood N. Growth of consumer-directed health plans to one-half of all employer-sponsored insurance could save $57 billion annually. Health Aff 2012;31:1009–1015. [DOI] [PubMed] [Google Scholar]
- 4.Cohen RA, Zammitti EP. High-deductible Health Plans and Financial Barriers to Medical Care: Early Release of Estimates from the National Health Interview Survey, 2016. Hyattsville, MD: National Center for Health Statistics; 2017. [Google Scholar]
- 5.Pauly MV. The economics of moral hazard: comment. Am Econ Rev Am Econ Assoc 1968;58:531–537. [Google Scholar]
- 6.Aron-Dine A, Einav L, Finkelstein A. The RAND health insurance experiment, three decades later. J Econ Perspect 2013;27:197–222. [DOI] [PMC free article] [PubMed] [Google Scholar]
- 7.Beeuwkes Buntin M, Haviland AM, McDevitt R, Sood N. Healthcare spending and preventive care in high-deductible and consumer-directed health plans. Am J Manag Care 2011;17:222–230. [PubMed] [Google Scholar]
- 8.Agarwal R, Mazurenko O, Menachemi N. High-deductible health plans reduce health care cost and utilization, including use of needed preventive services. Health Aff Project HOPE 2017;36:1762–1768. [DOI] [PubMed] [Google Scholar]
- 9.Gupta R, Tsay C, Fogerty RL. Promoting cost transparency to reduce financial harm to patients. AMA J Ethic 2015;17:1073–1078. [DOI] [PubMed] [Google Scholar]
- 10.Skolarus LE, Burke JF, Callaghan BC, Becker A, Kerber KA. Medicare payments to the neurology workforce in 2012. Neurology 2015;84:1796–1802. [DOI] [PMC free article] [PubMed] [Google Scholar]
- 11.Burke JF, Skolarus LE, Callaghan BC, Kerber KA. Choosing Wisely: highest-cost tests in outpatient neurology. Ann Neurol NIH Public Access 2013;73:679–683. [DOI] [PMC free article] [PubMed] [Google Scholar]
- 12.Quan H, Sundararajan V, Halfon P, et al. Coding algorithms for defining comorbidities in ICD-9-CM and ICD-10 administrative data. Med Care 2005;43:1130–1139. [DOI] [PubMed] [Google Scholar]
- 13.Dunn A, Grosse SD, Zuvekas SH. Adjusting health expenditures for inflation: a review of measures for health services research in the United States. Health Serv Res 2018;53:175–196. [DOI] [PMC free article] [PubMed] [Google Scholar]
- 14.Blough DK, Ramsey SD. Using generalized linear models to assess medical care costs. Health Serv Outcomes Res Methodol 2000;1:185–202. [Google Scholar]
- 15.The Fed: Executive Summary [online]. Available at: federalreserve.gov/publications/2019-economic-well-being-of-us-households-in-2018-executive-summary.htm. Accessed January 6, 2020. [Google Scholar]
- 16.Trump DJ. Executive Order on Improving Price and Quality Transparency in American Healthcare to Put Patients First. Washington, DC: The White House; 2019. [Google Scholar]
- 17.Kullgren JT, Duey KA, Werner RM. A census of state health care price transparency websites. JAMA 2013;309:2437–2438. [DOI] [PubMed] [Google Scholar]
- 18.Meisel ZF, VonHoltz LAH, Merchant RM. Crowdsourcing healthcare costs: opportunities and challenges for patient centered price transparency. Healthc (Amst) 2016;4:3–5. [DOI] [PubMed] [Google Scholar]
- 19.High Deductible Health Plan (HDHP) [online]. Accessed at: healthcare.gov/glossary/high-deductible-health-plan/. Accessed April 14, 2020. [Google Scholar]
- 20.Reddy SR, Ross-Degnan D, Zaslavsky AM, Soumerai SB, Wharam JF. Impact of a high-deductible health plan on outpatient visits and associated diagnostic tests. Med Care 2014;52:86–92. [DOI] [PMC free article] [PubMed] [Google Scholar]
- 21.Yabroff KR, Zhao J, Han X, Zheng Z. Prevalence and correlates of medical financial hardship in the USA. J Gen Intern Med 2019;34:1494–1502. [DOI] [PMC free article] [PubMed] [Google Scholar]
- 22.Narang AK, Nicholas LH. Out-of-pocket spending and financial burden among Medicare beneficiaries with cancer. JAMA Oncol 2017;3:757. [DOI] [PMC free article] [PubMed] [Google Scholar]
- 23.Gupta N, Polsky D. High deductible health plans: does cost sharing stimulate increased consumer sophistication? Heal Expect 2015;18:335–343. [DOI] [PMC free article] [PubMed] [Google Scholar]
- 24.Sinaiko AD, Mehrotra A, Sood N. Cost-sharing obligations, high-deductible health plan growth, and shopping for health care: enrollees with skin in the game. JAMA Intern Med 2016;176:395–397. [DOI] [PMC free article] [PubMed] [Google Scholar]
- 25.Stults CD, Li J, Frosch DL, et al. Assessment of accuracy and usability of a fee estimator for ambulatory care in an integrated health care delivery network. JAMA Netw Open 2019;2:e1917445. [DOI] [PMC free article] [PubMed] [Google Scholar]
- 26.Cliff BQ, Krenz C, West BT, et al. Attitudes about consumer strategies among Americans in high-deductible health plans. Med Care 2019;57:187–193. [DOI] [PubMed] [Google Scholar]
Associated Data
This section collects any data citations, data availability statements, or supplementary materials included in this article.
Data Availability Statement
The Clinformatics Datamart (OptumInsight) database is commercially available.