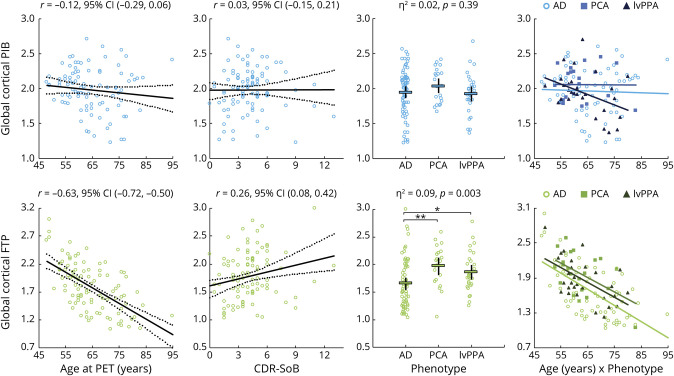
Figure 1. Relationships Between Global Cortical PET Standard Uptake Value Ratio (SUVR) Values and Clinical Variables: Univariate Analyses.
All data are raw, i.e., not adjusting for other variables, and statistics correspond to simple (univariate) models; see text and table 2 for general linear models with multiple variables. Regression plots are shown with regression line (dark line) and 95% confidence interval (CI) (dotted lines). Dotplots show average values (thick black bar) and 95% CI (thinner bars). *Mean difference = 0.210, 95% CI (0.030, 0.390), p = 0.02; **mean difference = 0.316, 95% CI (0.113, 0.519), p = 0.003; logopenic variant primary progressive aphasia (lvPPA)–posterior cortical atrophy (PCA) mean difference = 0.106 (−0.127, 0.340), p = 0.37. Plots in the rightmost column illustrate relationships between age and SUVR values, with regression lines calculated for each phenotype separately; see Results section for details. AD = Alzheimer disease; CDR-SB = Clinical Dementia Rating scale, Sum of Boxes; FTP = flortaucipir; PiB = Pittsburgh compound B.

