

Key Points
Questions
What is the association between flortaucipir positron emission tomography (PET) imaging visual classification using a clinically applicable and US Food and Drug Administration–approved method and 18-month cognitive and functional decline in patients with clinically diagnosed mild cognitive impairment and dementia owing to Alzheimer disease (AD)?
Findings
In this analysis of 2 open-label clinical trials, visual read of an advanced flortaucipir PET AD pattern was associated with an increased risk of 18-month cognitive and functional decline compared with other scan patterns.
Meaning
Clinically applicable visual reads of flortaucipir PET scans may provide valuable information regarding the risk of near-term clinical deterioration among patients with clinically diagnosed mild cognitive impairment or dementia owing to AD.
Abstract
Importance
Flortaucipir positron emission tomography (PET) scans, rated with a novel, US Food and Drug Administration–approved, clinically applicable visual interpretation method, provide valuable information regarding near-term clinical progression of patients with Alzheimer disease (AD) or mild cognitive impairment (MCI).
Objective
To evaluate the association between flortaucipir PET visual interpretation and patients’ near-term clinical progression.
Design/Setting/Participants
Two prospective, open-label, longitudinal studies were conducted from December 2014 to September 2019. Study 1 screened 298 patients and enrolled 160 participants who had a flortaucipir scan at baseline visit. Study 2 selected 205 participants from the AMARANTH trial, which was terminated after futility analysis. Out of the 2218 AMARANTH participants, 424 had a flortaucipir scan around randomization, but 219 did not complete 18-month clinical dementia rating (CDR) assessments and thus were excluded. In both studies, all participants were diagnosed as clinically impaired, and they were longitudinally followed up for approximately 18 months after baseline.
Main Outcomes and Measures
Flortaucipir scans were rated as either advanced or nonadvanced AD pattern using a predetermined visual interpretation method. The CDR sum of box (CDR-SB) score was used as primary clinical end point measurement in both studies.
Results
Of the 364 study participants who had readable scans, 48% were female (n = 174 of 364), and the mean (SD) age was 71.8 (8.7) years. Two hundred forty participants were rated as having an advanced AD pattern. At 18 months follow-up, 70% of those with an advanced AD pattern (n = 147 of 210) had 1 point or more increase in CDR-SB, an event predefined as clinically meaningful deterioration. In contrast, only 46% of those with a nonadvanced AD pattern scan (n = 48 of 105) experienced the same event (risk ratio [RR], 1.40; 95% CI, 1.11-1.76; P = .005). The adjusted mean CDR-SB changes were 2.28 and 0.98 for advanced and nonadvanced AD pattern groups, respectively (P < .001). Analyses with other clinical end point assessments, as well as analyses with each individual study’s data, consistently indicated a higher risk of clinical deterioration associated with an advanced AD scan pattern.
Conclusions and Relevance
These results suggest that flortaucipir PET scans, when interpreted with an US Food and Drug Administration–approved, clinically applicable visual interpretation method, may provide valuable information regarding the risk of clinical deterioration over 18 months among patients with AD and MCI.
Trial Registration
ClinicalTrials.gov Identifier: NCT02016560 and NCT03901105
This study evaluates the association between flortaucipir positron emission tomography visual interpretation and patients’ near-term clinical progression of mild cognitive impairment and dementia owing to Alzheimer disease.
Introduction
Alzheimer disease (AD) is characterized pathologically by tau neurofibrillary tangles (NFTs)1 and β amyloid plaques (Aβ).2,3 Neuropathologic criteria for the diagnosis of AD requires proof of the presence of both amyloid plaques and tangles.4 Neuropathology studies5,6,7,8 suggest that elevation of Aβ and NFTs are both associated with dementia severity in patients with AD, although the association is stronger for NFTs.9,10,11 Therefore, accurately detecting tau burden in living patients might help to not only establish an AD diagnosis12 but also to predict a patient’s likelihood of clinical progression.
Flortaucipir is a positron emission tomography (PET) tracer for detection of the aggregated tau of AD.13,14 Previous cross-sectional studies reported that quantitative measures of flortaucipir are associated with degree of cognitive impairment15,16,17,18,19,20,21,22,23,24,25 and with longitudinal decline in cognitive performance.26,27 Published studies to date have focused on quantitative analyses of flortaucipir PET scans, which is suitable for research purposes but could pose a challenge in clinical practice. Visual scan interpretation may enable broader clinical application and make flortaucipir more accessible to medical practitioners and, therefore, to patients. A clinically applicable visual interpretation method was recently developed and approved by the US Food and Drug Administration (FDA). The accuracy of this method for detecting cortical tau deposition was validated in an autopsy study.12 To understand the prognostic value of visually interpreted flortaucipir scans, we applied this approach in 2 independent phase III clinical trials and assessed the association between flortaucipir visual interpretation patterns and participants’ clinical decline at 18 months.
Methods
Study Design
Two prospective, longitudinal clinical studies were conducted independently. Study 1 (Study 18F-AV-1451-A05; NCT02016560) was designed to evaluate the association between flortaucipir uptake at baseline and the subsequent rate of cognitive decline observed over an 18-month period. This study was conducted at 26 study sites across the United States from December 2014 to July 2017. Study 2 (Study 18F-AV-1451-PX01; NCT03901105) was designed to take advantage of data from a 24-month therapeutic trial (I8D-MC-AZES/D5010C00009/AMARANTH; NCT02245737) that included flortaucipir PET scans at baseline in a subset of participants. The AMARANTH trial was designed to evaluate the treatment effect of β-secretase 1 (BACE) inhibitor AZD3293 (LY3314814; lanabecestat) but was terminated early after a futility analysis. To minimize the effect of data missing not at random owing to early termination, only participants (both lanabecestat-treated and placebo-treated) who had a flortaucipir scan at baseline and completed a clinical dementia rating (CDR) at the week 78 (18 months) were selected into Study 2. Study 2 participants were enrolled from 68 study sites worldwide from March 2017 to October 2018. Both studies tested the same hypotheses: baseline tau status, determined by flortaucipir visual interpretation patterns, would predict the risk of clinical decline over 18 months of follow-up.
Study protocols were approved by the relevant institutional review boards and all participants or authorized representatives signed informed consent prior to conduct of study procedures. Trials were conducted in compliance with the Declaration of Helsinki and the International Conference on Harmonization guideline on good clinical practice.28
Participants
Study 1 participants were cognitively impaired men and women 50 years and older with a suspected neurodegenerative cause at enrollment, and with a Mini-Mental State Examination (MMSE) score between 20 and 27, inclusive. Study 2 participants were men and women (aged 55 to 85 years) diagnosed as having mild cognitive impairment (MCI) owing to AD or probable AD dementia by National Institute on Aging–Alzheimer’s Association criteria,29,30 with Mini-Mental State Examination (MMSE) score 20 to 30 inclusive, a CDR Global score (CDR-Global) of 0.5 (MCI) or 0.5 or 1 (AD), a CDR sum of box (CDR-SB) score of at least 0.5, and a Repeatable Battery for the Assessment of Neuropsychological Status Update delayed memory score of 85 or less. All Study 2 participants were Aβ+ by amyloid PET or lumbar puncture.
Positron Emission Tomography Imaging Visual Interpretation
In both studies, flortaucipir scans that passed quality control were independently evaluated by 5 imaging physicians blinded to clinical information (details in eMethods in the Supplement). Readers rated each scan as either an advanced, moderate, or negative AD tau pattern (Figure 1) using a predefined visual interpretation method.12 For analyses purposes, imaging analysis end points were dichotomized as advanced AD tau pattern vs nonadvanced (negative or moderate) AD tau pattern. Majority reads, defined as the same interpretation from 3 or more readers for each scan, were derived mathematically based on this dichotomized end point.
Figure 1. Flortaucipir Positron Emission Tomography (PET) Scan Visual Interpretation.
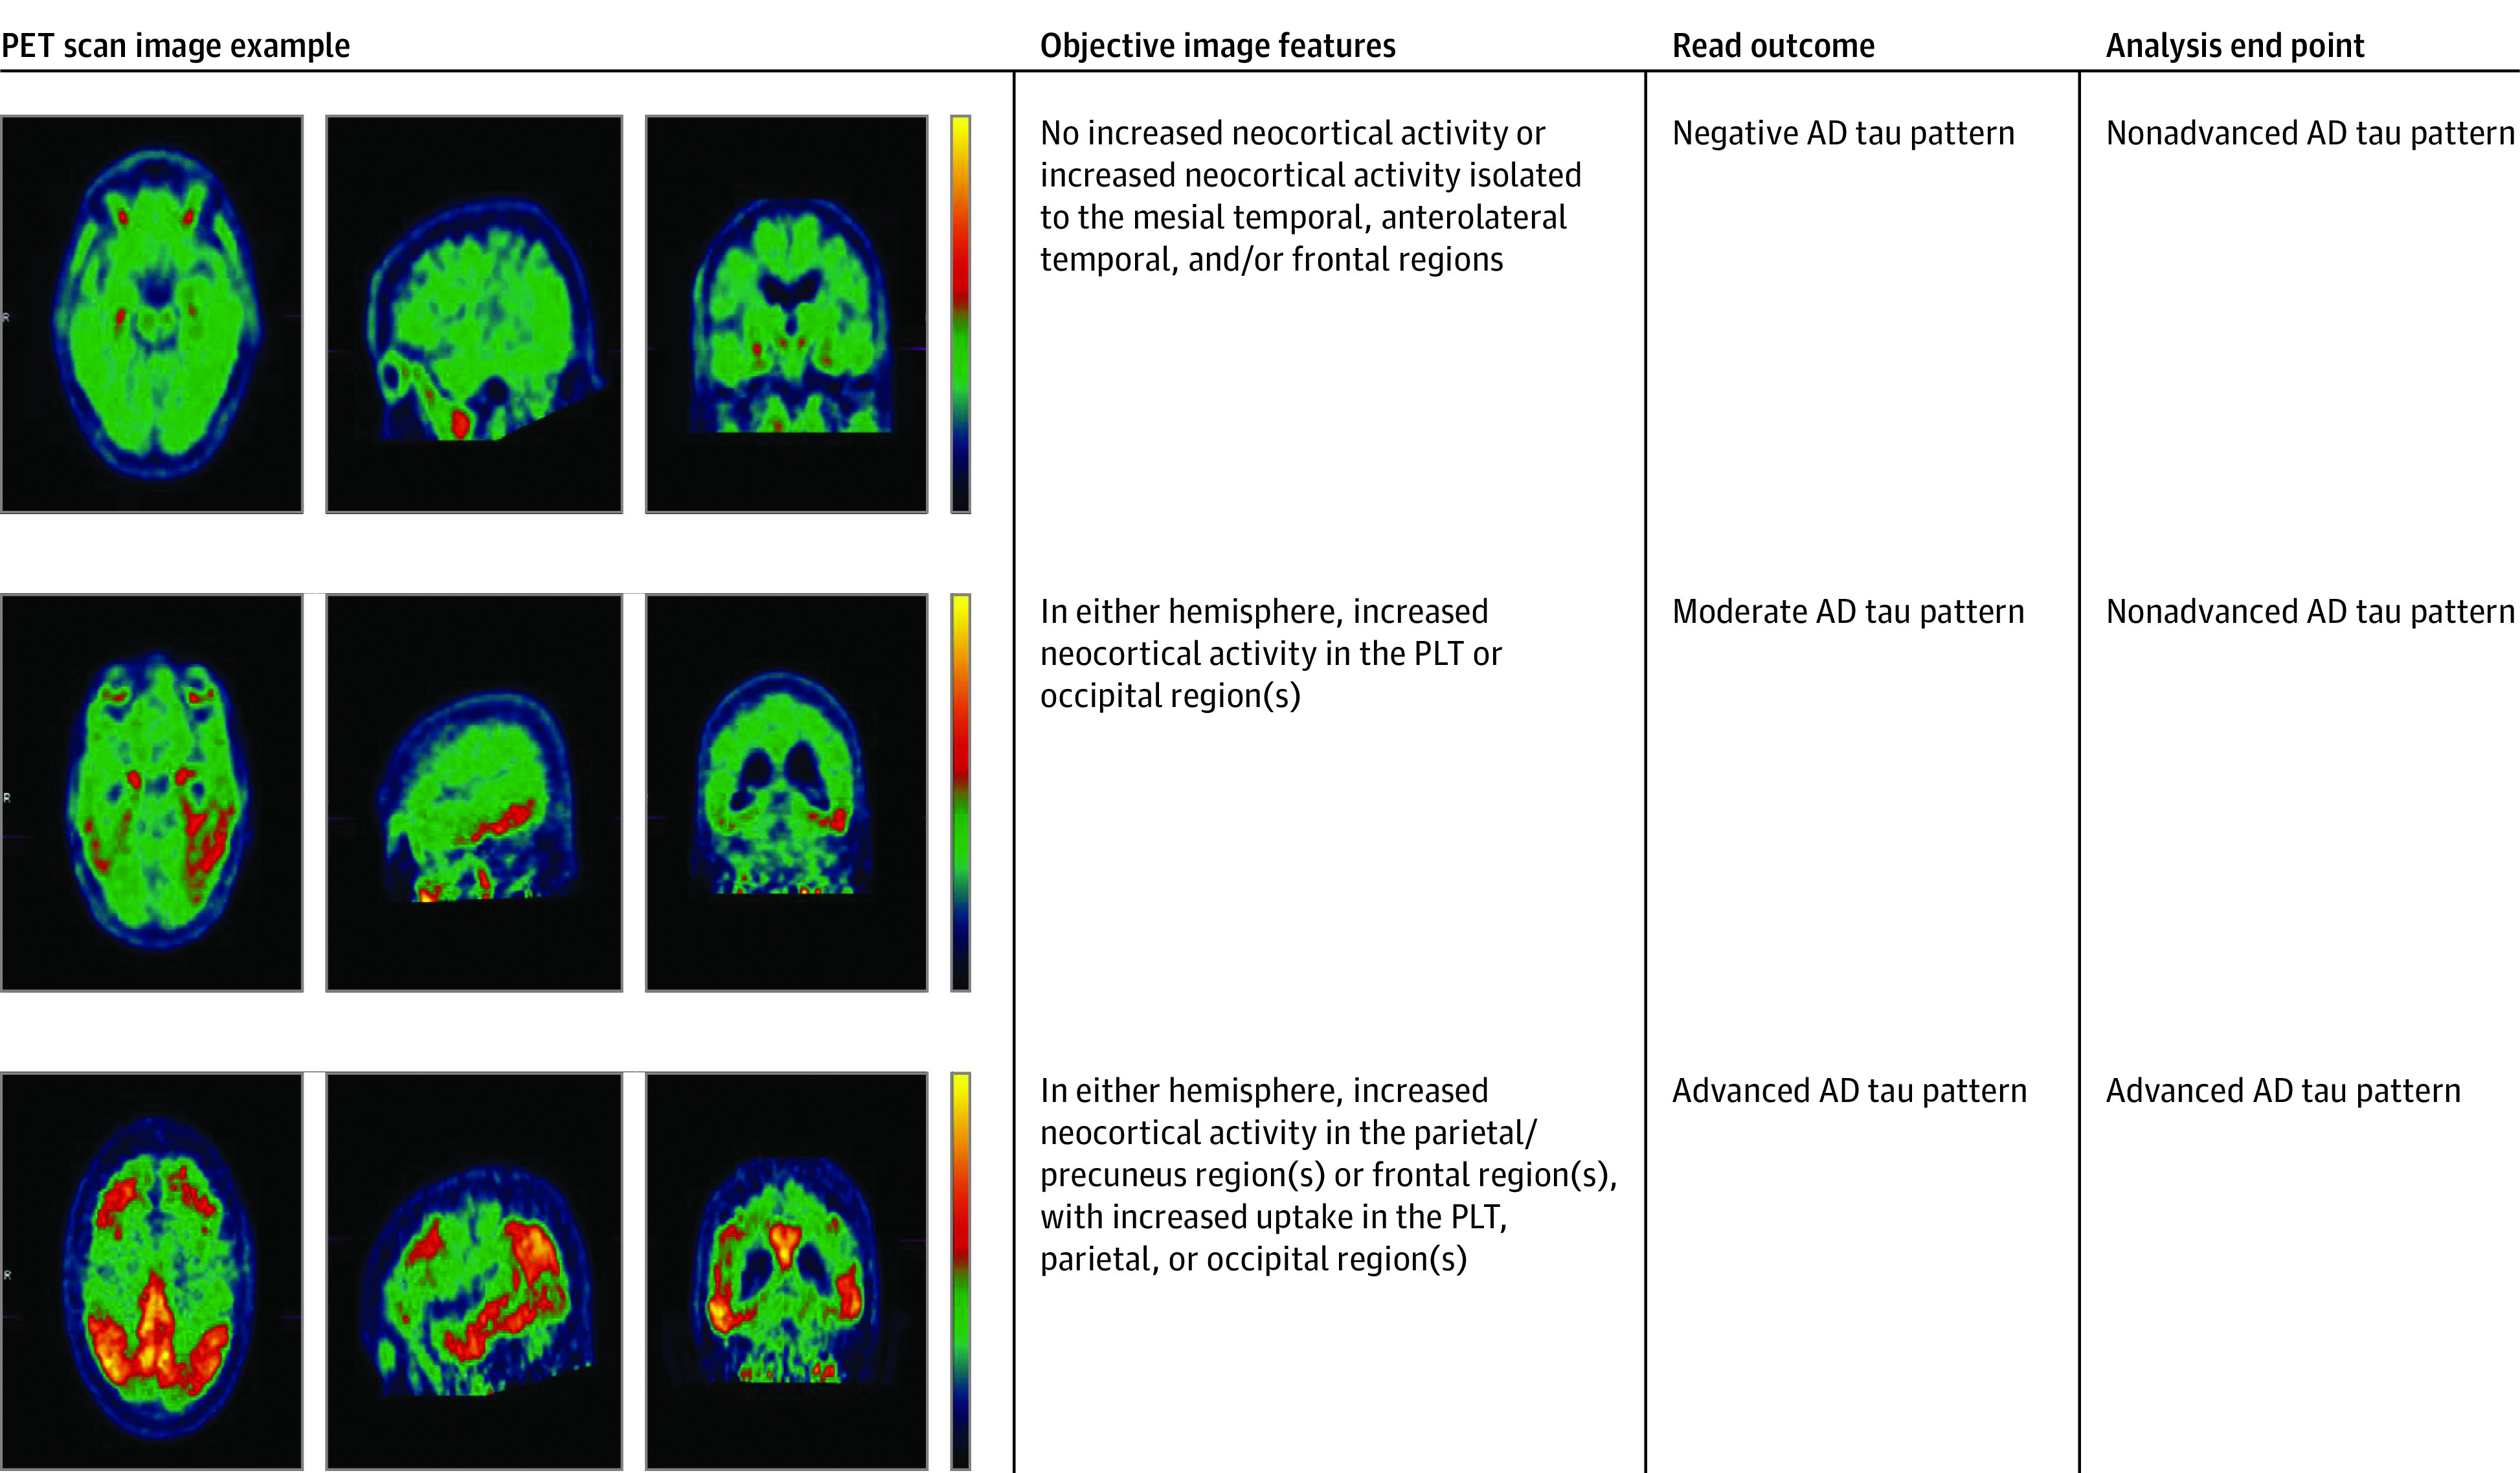
Flortaucipir visual read categories and analysis end point classification. Three cases representing the 3 levels of visual reads and corresponding analysis end point classification.
Cognitive and Functional Assessments
In both studies, participants’ clinical progression was measured with the CDR scale, including both CDR-SB and CDR-Global, the MMSE, 11-item version of the Alzheimer Disease Assessment Scale–Cognitive subscale (ADAS-Cog11), and Functional Activities Questionnaire (FAQ). Assessments were collected at baseline and follow-up visits.
Statistical Analysis
All analyses were independently conducted for each individual study and repeated with pooled study data. For Study 1, baseline, 9-month, and 18-month visit data were used in analyses; for Study 2, baseline, 6-month, 12-month, and 18-month visits were used. Although a subset of Study 2 participants completed 24 months’ follow-up before the study was terminated, 24-month follow-up data was not used in the analyses because sample size was significantly reduced at 24 months owing to early study termination (90 of 205 participants completed 24-month assessments) and because no comparable data are available from Study 1.
Participants’ clinical progression was first assessed using predefined dichotomized outcomes, representing clinically meaningful deteriorations: 1 point or more increase in CDR-SB, any increase in CDR-Global, 4 points or more increase in ADAS-Cog11, 3 points or more decrease in MMSE, and 3 points or more increase in FAQ. The CDR-SB was prespecified as the primary end point for determining study success for both studies. In Study 1, Cox proportional hazard model, adjusting for baseline age, respective baseline cognitive or functional test score, and cognitive reserve (American National Adult Reading Test score [ANART]), was used to evaluate the hazard of progressing to these predefined outcomes. Hazard ratios (HR) were reported to assess the hazard difference between scan patterns. Because Study 2 included only those participants from the AMARANTH trial who had a valid baseline scan and who had completed the 18-month CDR evaluation, it was not necessary to compensate for potential information loss owing to premature discontinuation. Thus, a Poisson regression model was used to estimate the different risks of experiencing the pre-defined outcomes by scan patterns, and the risk ratios (RR) were reported accordingly. The models were adjusted for respective baseline cognitive/functional test scores, age, education, and therapeutic treatment arms from AMARANTH. For the pooled analyses, similar Poisson regression models were applied but adjusted for study identification, baseline age, and respective baseline scores.
Additionally, progression was quantified as mean change from baseline in CDR-SB, MMSE, ADAS, and FAQ, respectively. Mixed models with repeated measures (MMRM) were used to estimate the mean change by scan patterns for each cognitive/functional assessment. Covariates included baseline age, respective baseline cognitive/functional test scores, visit number, scan pattern-by-visit interaction, and baseline ANART for Study 1, or education and treatment arms for Study 2. Adjusted mean change values by scan patterns and their differences were reported along with the 2-tailed P values, with statistical significance declared at .05 level. Pooled data were analyzed with similar models, but adjusted for study identification, respective baseline score, and age. For the pooled analyses, the 6-month and 12-month visits from Study 2 were averaged to approximate the 9-month visit for comparison with the Study 1 nine-month visit.
Results
Participant Characteristics
In Study 1, a total of 159 participants had flortaucipir scans that passed quality control. Of these, 74 were women (47%), 154 were White (97%), and the mean (SD) age was 72.9 (9.6) years (Table 1). Study 1 participants had a mean (SD) baseline MMSE of 24.9 (2.2), CDR-SB of 3.4 (1.9), ADAS-Cog11 of 14.3 (6.1), and FAQ of 8.3 (6.8). Sixty-two (39%) were clinically diagnosed as having dementia, including 5 with a prescan working diagnosis of non-AD dementia (1 vascular, 2 frontotemporal, 1 atypical frontotemporal, and 1 Lewy body dementia; these were grouped with AD for analysis purposes). Sixty-four percent of participants (101 of 159) were Aβ+, 41% were apolipoprotein E (APOE) ε4 carriers, and 78 (49%; 76 Aβ+ and 2 Aβ−) had an advanced, 11 (7%; 9 Aβ+ and 2 Aβ−) had a moderate, and 70 (44%; 16 Aβ+ and 54 Aβ−) had a negative AD pattern. About 70% of participants finished all study visits. Of the 205 AMARANTH participants selected into Study 2, 100 were women (49%), 172 were White (84%), and mean (SD) age was 71 (7.7) years. Study 2 participants were more impaired than those in Study 1: 69% with AD; mean (SD) baseline MMSE, 23.8 (2.6); CDR-SB, 3.7 (1.5); ADAS-Cog11, 17.9 (6.0); and FAQ, 9.7 (6.5). All participants were Aβ+ per AMARANTH enrollment criteria, and 69% were APOE ε4 carriers. In Study 2, 162 participants (79%) had an advanced AD pattern, 15 (7.3%) had a moderate AD pattern, and 28 (13.7%) had a negative AD pattern.
Table 1. Study Participants Demographics and Baseline Characteristics.
| Characteristic | No. (%) | ||
|---|---|---|---|
| Study 1 (n = 159) | Study 2 (n = 205) | Pooled (n = 364) | |
| Age, mean (SD) [range] | 72.9 (9.64) [50-97] | 71 (7.74) [55-85] | 71.8 (8.66) [50-97] |
| Female | 74 (46.5) | 100 (48.8) | 174 (47.8) |
| Race/ethnicity | |||
| Nonwhite | 5 (3.1) | 33 (16.1) | 38 (10.4) |
| White | 154 (96.9) | 172 (83.9) | 326 (89.6) |
| Education | |||
| ≥13 y | 156 (98.1) | 133 (64.9) | 289 (79.4) |
| Otherwise | 3 (1.89) | 72 (35.1) | 75 (20.6) |
| APOE | |||
| ε4 carriers | 62 (41.3) | 142 (69.3) | 204 (57.5) |
| Non ε4 carriers | 88 (58.7) | 63 (30.7) | 151 (42.5) |
| Clinical diagnosis | |||
| AD | 62 (39.0) | 141 (68.8) | 203 (55.8) |
| MCI | 97 (61.0) | 64 (31.2) | 161 (44.2) |
| ADAS-Cog11, mean (SD) [range] | 14.3 (6.14) [4-39] | 17.9 (5.99) [5-33] | 16.4 (6.31) [4-39] |
| CDR-SB, mean (SD) [range] | 3.4 (1.88) [0-12] | 3.7 (1.48) [0.5-8] | 3.6 (1.67) [0-12] |
| FAQ, mean (SD) [range] | 8.3 (6.82) [0-30] | 9.7 (6.48) [0-28] | 9.1 (6.66) [0-30] |
| MMSE, mean (SD) [range] | 24.9 (2.19) [20-30] | 23.8 (2.58) [19-30] | 24.3 (2.48) [19-30] |
| Amyloid status | |||
| Aβ+ | 101 (63.5) | 205 (100) | 306 (84.1) |
| Flortaucipir scan reads | |||
| AD pattern | |||
| Negative | 70 (44.0) | 28 (13.7) | 98 (26.9) |
| Moderate | 11 (6.9) | 15 (7.3) | 26 (7.1) |
| Advanced | 78 (49.1) | 162 (79.0) | 240 (65.9) |
Abbreviations: ADAS-Cog11, Alzheimer Disease Assessment Scale–Cognitive subscale; AD, Alzheimer disease; Aβ: amyloid β; CDR-SB, clinical dementia rating sum of box; FAQ, functional activities questionnaire; MCI, mild cognitive impairment; MMSE, Mini-Mental State Examination.
Risk of Clinical Progression by Flortaucipir PET Scan Patterns
Pooling Study 1 and Study 2 data, 240 participants had an advanced and 124 participants had a nonadvanced AD flortaucipir scan pattern. Participants with an advanced AD scan pattern experienced more predefined clinical meaningful deterioration events than those with a nonadvanced pattern. For example, 70% of advanced vs 46% of nonadvanced pattern participants had CDR-SB 1 point or more increase (RR, 1.40; 95% CI, 1.11-1.76; P = .005). Similar statistically significant RRs were observed for the other assessments (Figure 2). At the 18-month follow-up, adjusted mean changes were CDR-SB, 2.28 vs 0.98 (P <.001); MMSE, −4.13 vs −1.27 (P <.001); FAQ, 6.15 vs 2.10 (P <.001); and ADAS-Cog11, 6.40 vs 2.30 (P <.001) for advanced vs nonadvanced AD patterns respectively(Table 2, Figure 3). All P values remained significant after Bonferroni correction for multiplicity.
Figure 2. Risk for Clinical Progression: Comparing Advanced Alzheimer Disease (AD) Pattern and Nonadvanced AD Pattern Groups.

Advanced: flortaucipir scan advanced AD pattern; nonadvanced: flortaucipir scan nonadvanced AD patterns. Event rate for each scan pattern group: the percentage of participants had a prespecified clinical meaning deterioration event, such as Clinical Dementia Rating sum of box (CDR-SB) 1 point or more increase. ADAS-Cog11 indicates Alzheimer Disease Assessment Scale–Cognitive subscale; FAQ, functional activities questionnaire; MMSE, Mini-Mental State Examination.
Table 2. Cognitive and Functional Measurements at Baseline, and Their Changes at 18 Months by Flortaucipir Scan Status.
| Measurement | Advanced AD pattern | Nonadvanced AD pattern | P valuea | |||
|---|---|---|---|---|---|---|
| No. | Mean (SE) | No. | Mean (SE) | |||
| CDR-SB | ||||||
| Study 1 | Baseline | 78 | 3.77 (0.23) | 80 | 2.99 (0.19) | .009 |
| Change at 18 mo | 48 | 2.09 (0.35) | 62 | 0.66 (0.32) | .003 | |
| Study 2 | Baseline | 162 | 3.80 (0.12) | 43 | 3.28 (0.20) | .04 |
| Change at 18 mo | 162 | 2.22 (0.22) | 43 | 1.31 (0.38) | .03 | |
| Pooled | Baseline | 240 | 3.80 (0.11) | 123 | 3.10 (0.14) | .001 |
| Change at 18 mo | 210 | 2.28 (0.17) | 105 | 0.98 (0.24) | <.001 | |
| MMSE | ||||||
| Study 1 | Baseline | 78 | 24.40 (0.25) | 81 | 25.40 (0.23) | .006 |
| Change at 18 mo | 47 | −3.29 (0.67) | 62 | −0.33 (0.59) | .001 | |
| Study 2 | Baseline | 162 | 23.50 (0.20) | 43 | 24.80 (0.41) | .003 |
| Change at 18 mo | 161 | −4.89 (0.38) | 42 | −2.12 (0.65) | <.001 | |
| Pooled | Baseline | 240 | 23.80 (0.16) | 124 | 25.20 (0.21) | <.001 |
| Change at 18 mo | 208 | −4.13 (0.31) | 104 | −1.27 (0.42) | <.001 | |
| FAQ | ||||||
| Study 1 | Baseline | 78 | 9.41 (0.80) | 80 | 7.14 (0.72) | .04 |
| Change at 18 mo | 48 | 6.93 (0.75) | 62 | 1.78 (0.69) | <.001 | |
| Study 2 | Baseline | 159 | 10.12 (0.51) | 43 | 7.84 (0.93) | .04 |
| Change at 18 mo | 158 | 5.22 (0.54) | 42 | 2.67 (0.90) | .01 | |
| Pooled | Baseline | 237 | 9.89 (0.43) | 123 | 7.38 (0.57) | <.001 |
| Change at 18 mo | 206 | 6.15 (0.40) | 104 | 2.10 (0.55) | <.001 | |
| ADAS-Cog11 | ||||||
| Study 1 | Baseline | 78 | 16.33 (0.71) | 81 | 12.41 (0.60) | <.001 |
| Change at 18 mo | 48 | 6.41 (1.00) | 62 | 2.50 (0.91) | .006 | |
| Study 2 | Baseline | 162 | 18.63 (0.48) | 43 | 15.33 (0.75) | .001 |
| Change at 18 mo | 157 | 6.53 (0.66) | 42 | 1.97 (1.18) | <.001 | |
| Pooled | Baseline | 240 | 17.90 (0.40) | 124 | 13.40 (0.48) | <.001 |
| Change at 18 mo | 205 | 6.40 (0.51) | 104 | 2.30 (0.71) | <.001 | |
Abbreviations: ADAS-Cog11, Alzheimer Disease Assessment Scale–Cognitive subscale; AD, Alzheimer disease; CDR-SB, clinical dementia rating sum of box; FAQ, functional activities questionnaire; MMSE, Mini-Mental State Examination.
P value was from the test comparing advanced AD pattern and nonadvanced AD pattern groups. Baseline mean values between scan pattern groups were compared using a 2-sample t test; change values at 18 months were compared between pattern groups using MMRM models.
Figure 3. Change From Baseline Values at Each Follow-up Visits by Flortaucipir Scan Patterns.
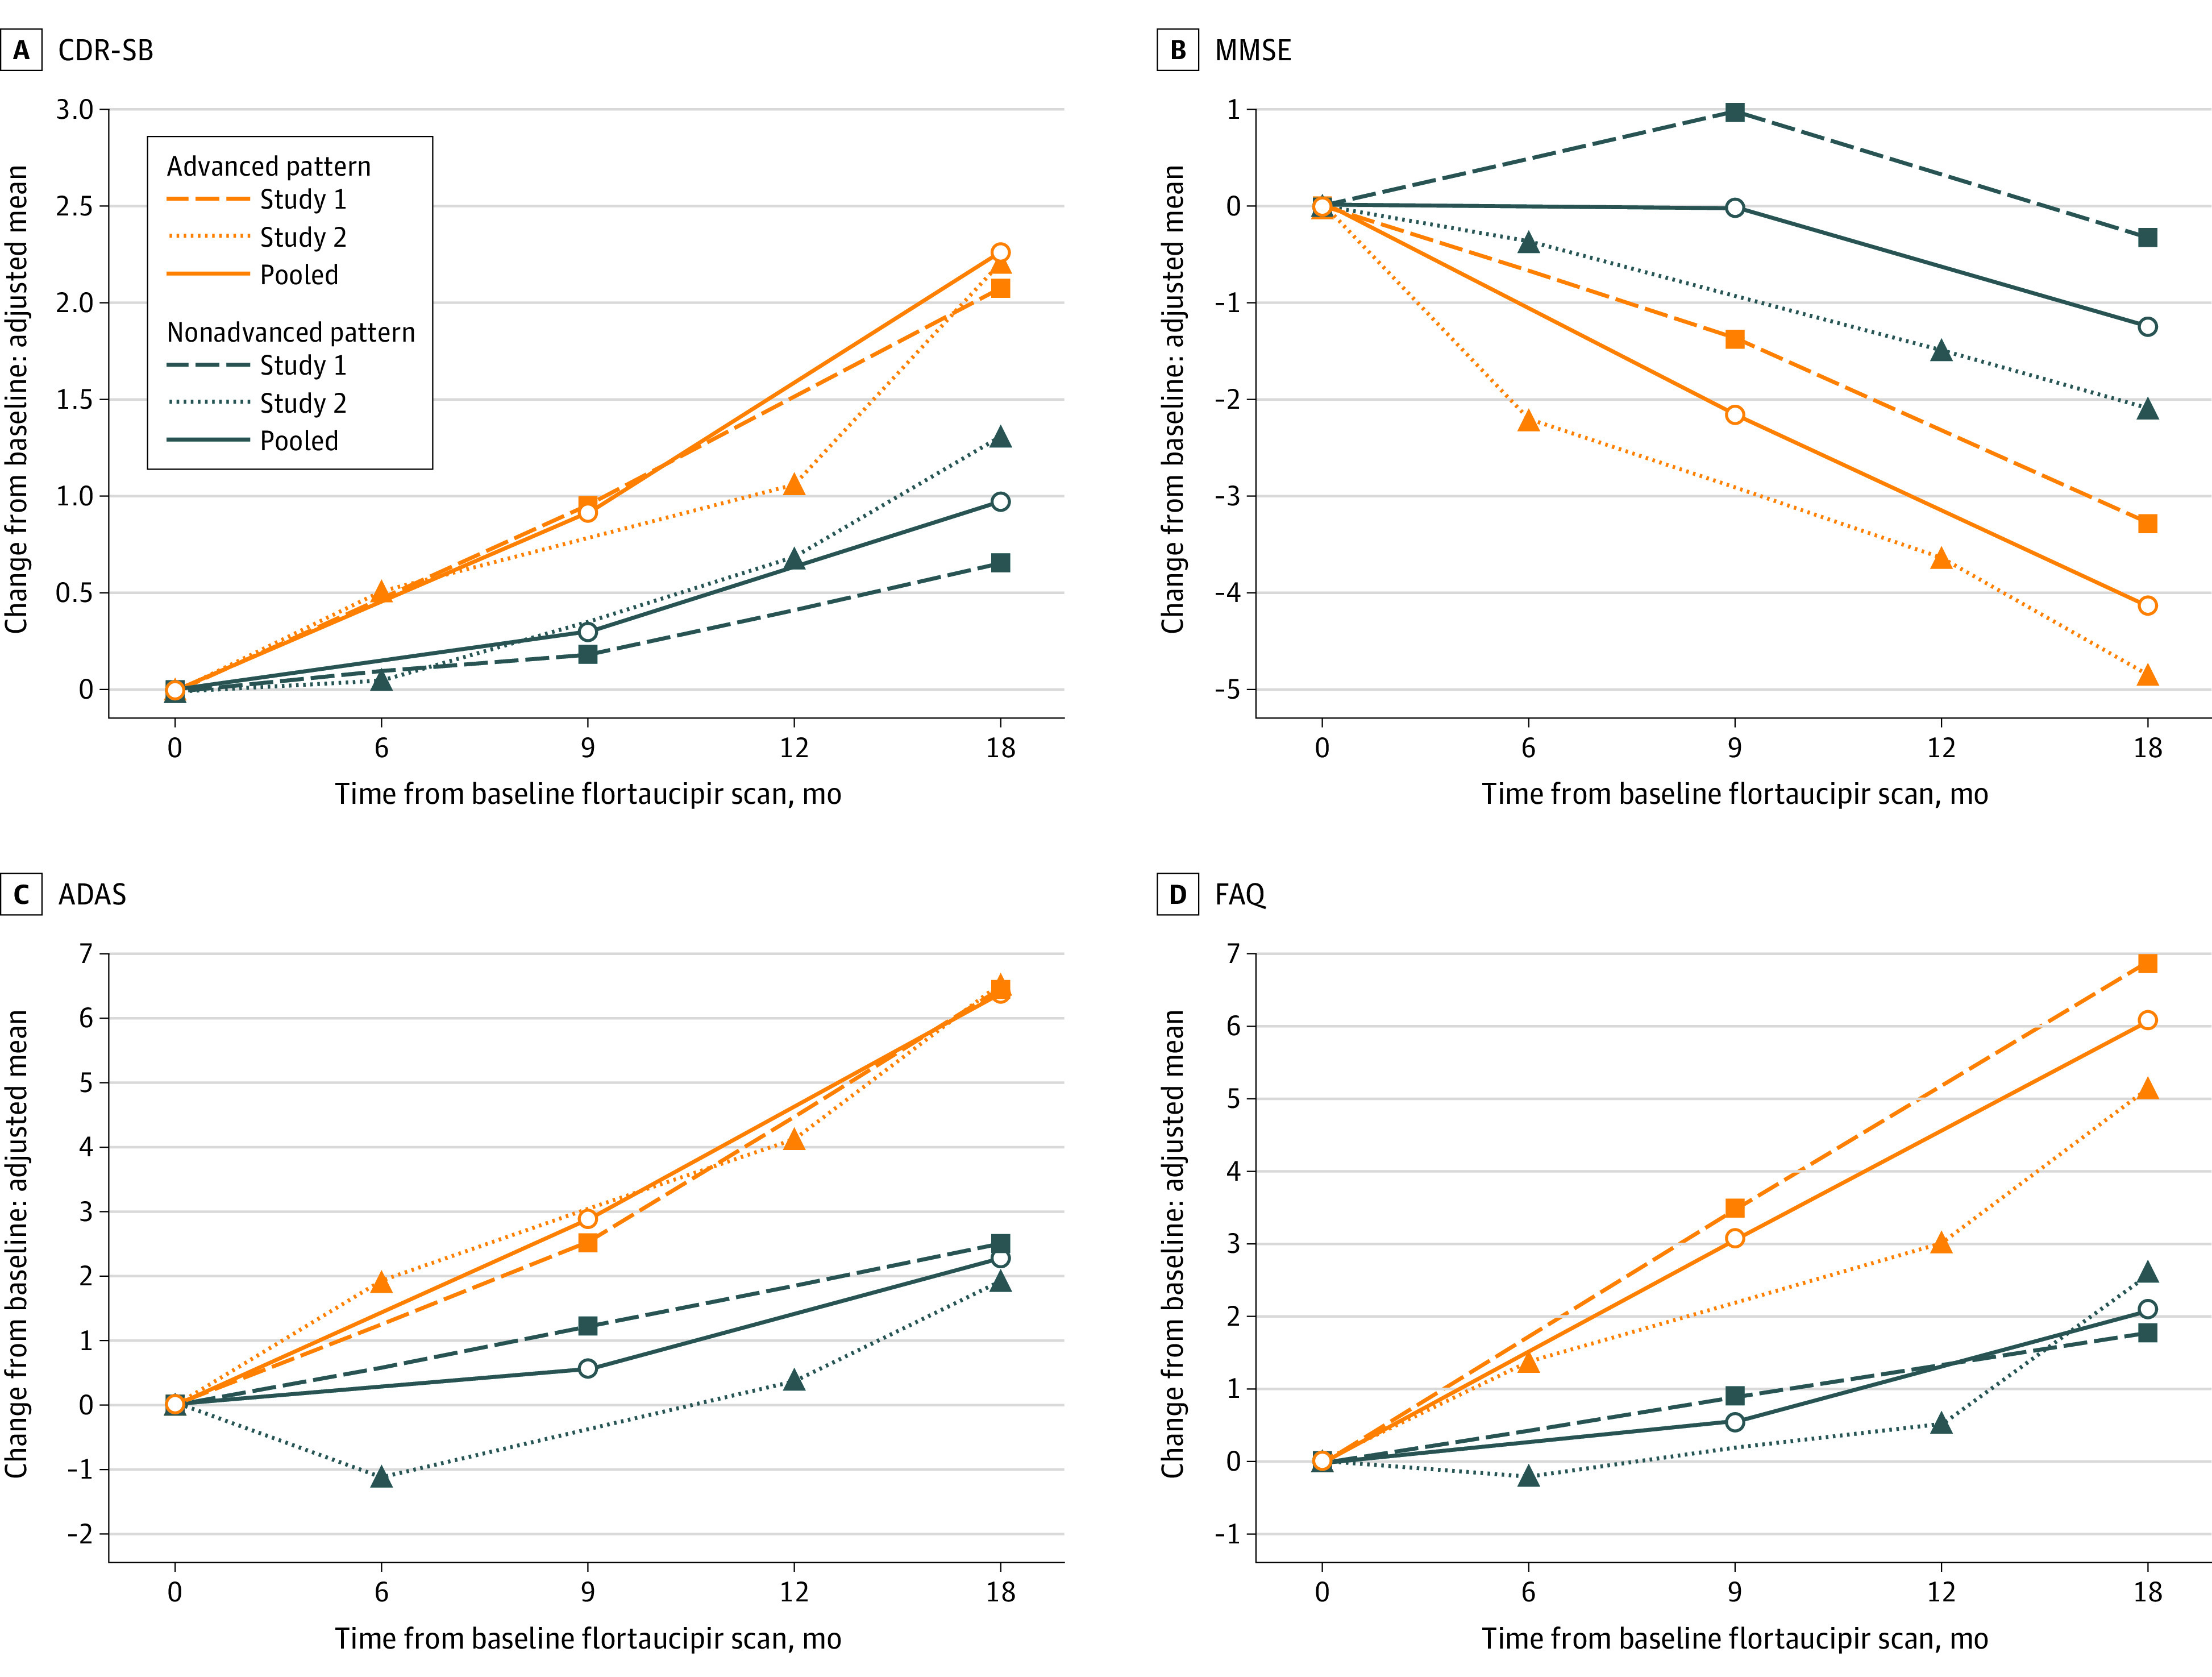
The y-axis represents the adjusted mean changes values from baseline, from mixed models with repeated measures (MMRM) models. The covariates of the models included baseline age, respective baseline cognitive/functional test scores, visit number (used as a categorical variable), tau status-by-visit interaction, and baseline ANART for Study 1, or education and treatment arms for Study 2. For pooled analyses, the covariates included study identification, respective baseline cognitive/functional test score, and age.
Red color lines: advanced AD pattern group; dark blue color lines: non-advanced AD pattern group. Dashed lines: Study 1 population; dotted lines: Study 2 population; solid lines: pooled (Study 1 and 2) population.
Among the 3 different scan patterns, the moderate AD pattern occurred the least frequently in both studies (Table 1). Pooled data revealed an ordinal association of clinical progression by scan patterns (advanced > moderate > negative AD pattern). For example, participants deteriorated 2.3 points (P < .001), 1.7 points (P = .001), and 0.78 points (P = .005) in CDR-SB at the 18-month follow-up, respectively (eFigure 1 in the Supplement). Similar findings were observed for MMSE, ADAS-Cog11, and FAQ. Pairwise comparisons showed that participants with an advanced AD pattern consistently had a statistically significantly larger decline than those with a negative AD pattern, while those with a moderate AD pattern were not consistently different from either advanced or negative pattern participants.
For the individual studies, analyses suggested a greater risk of clinical progression for the advanced AD pattern group, although risk differences did not always meet statistical significance. Study 1 data showed a greater risk of progression in CDR-SB for advanced AD pattern participants: HR, 1.58 (95% CI, 0.97-2.85; P = .07). Statistically significant HRs were observed for other prespecified outcome measures, including CDR-Global (HR, 2.37; 95% CI, 1.32-4.26; P = .004), MMSE (HR, 2.51; 95% CI, 1.29-4.89; P = .007), and FAQ (HR, 2.79; 95% CI, 1.67-4.64; P < .001) but not ADAS-Cog11 (HR, 1.36; 95% CI, 0.77-2.41; P = .29) (Figure 2).
Study 2 yielded a statistically significant RR of 1.36 for CDR-SB (95% CI,1.03-1.79; P = .03). Other RRs for the secondary prespecified outcome measures indicated higher risk for the advanced AD pattern group, reaching statistical significance for ADAS-Cog11 (RR, 1.77; 95% CI, 1.12-2.80; P = .01) but not for CDR-Global (RR, 1.28; 95% CI, 0.82-2.02; P = .28), MMSE (RR, 1.35; 95% CI, 0.96-1.89; P = .08), or FAQ (RR, 1.32; 95% CI, 0.98-1.78; P = .06). In both studies, MMRM analyses demonstrated greater declines for advanced AD pattern participants in all the clinical end points assessments, and comparisons with nonadvanced AD pattern participants were all statistically significant (Table 2; Figure 3).
The interreader consistency for flortaucipir scan visual interpretation was high for both Study 1 and 2 (94.5% and 91.4% agreement rate; eTable 1 in the Supplement). This high consistency level in scan interpretation also resulted in homogeneous findings similar to that observed for majority reads, eg, HR values from the analyses of CDR-SB event ranged from 1.49 to 1.70 for Study 1, and the corresponding RR values ranged from 1.25 to 1.46 for Study 2 (eTable 2 in the Supplement). The mean changes of each end point assessment by visual classification from individual reader’s reads were also similar to those found using majority reads (eTable 3 in the Supplement).
The interaction of amyloid and tau on clinical progression was shown in eFigure 2 in the Supplement. Among Study 1 participants, compared with the Aβ− group, the Aβ+/advanced AD pattern group showed significantly greater CDR-SB progression (mean change, 1.99 vs 0.72; P = .02), whereas the Aβ+/nonadvanced group progressed similarly to the Aβ− group (0.86 vs 0.72; P = .84). The comparison between Aβ+/advanced and Aβ+/nonadvanced group yielded a P value at .10. Similar trends were observed for other end point assessments.
Impairment severity level at baseline was positively associated with participants’ clinical progression. For example, the entire population (regardless of tau status) had CDR-SB deteriorated from 0.51 to 3.61 points ranging from the healthiest to the most impaired MMSE baseline level (eFigure 3 in the Supplement). However, at each MMSE level, participants with an advanced AD pattern on average had a greater deterioration, eg, CDR-SB changed 0.98 to 3.97 points for advanced, whereas −0.20 to 2.02 points for nonadvanced AD group across these MMSE levels. The analysis results with other end point assessments were similar.
Discussion
The association between flortaucipir scan pattern and clinical progression over 18 months was assessed in 2 clinical studies comprising 364 cognitively impaired participants with a range of demographic characteristics, and clinical presentations similar to patients often seen in a clinical practice setting. The results indicated that an advanced AD flortaucipir pattern was associated with increased risk of clinical progression over 18 months, as demonstrated by higher event rates and larger mean deteriorations across all the clinical end point measurements. These were almost always statistically different from the nonadvanced AD pattern group, except for a few end points analyzed at the individual study level.
Risk ratios for pooled data ranged from approximately 1.4 to 1.8. Although this level of risk prediction may seem modest, it must be taken in context of other risk factors patients have for progression and that we studied only 18 months of change in a disease that may have a 20- to 30-year natural history.31 While the flortaucipir scan pattern is an important risk factor, it is likely not the sole determinant of near-term cognitive decline in AD. This is consistent with our understanding of AD, which occurs against a background of genetically and experientially determined cognitive reserve, concomitant diseases, and age-related changes, which may positively or negatively modulate the effects of underlying AD pathology and rates of progression. A diagnosis of AD itself comes with a significant increased risk of long-term cognitive and functional decline.31 Difficulty in predicting an exact outcome for individual patients is not unique to AD. Clinical models of cardiovascular risk assessment demonstrated similar modest levels of risk prediction.32,33,34,35 Therefore, despite relatively modest effect size, flortaucipir scan patterns may provide clinically relevant prognostic information for AD patient management.
Although statistical significance was not met for all tests, data for each study similarly showed that the advanced AD pattern group was at an increased risk of clinical progression. For example, while Study 1 showed a borderline statistical significance for the primary end point assessment, Study 2 met the same prespecified criteria for the primary hypothesis (1 point or more increase in CDR-SB). The sample size difference might contribute to the different level of significance observed (111 vs 205 completers for Studies 1 and 2, respectively). Nevertheless, quantitatively assessed clinical deterioration (Figure 3; Table 2) demonstrated a statistically significantly higher risk associated with an advanced AD scan pattern in all clinical measurements, and from both studies. It is also worth noting that the magnitude of changes observed from the advanced AD pattern group were about 2-fold or larger than the other group.
Although the designs and analyses in Study 1 and Study 2 are similar, there are several important differences. Study 1 was designed to investigate a range of patients similar to those in a real-world clinical practice environment. Therefore, cognitively impaired participants were not required to meet established probable AD diagnosis criteria.29,30 In this study, only 64% of participants were Aβ+, and the dementia participants with a suspected neurodegenerative cause (n = 62) included 5 participants with dementia where AD was part of the differential diagnosis but was not the primary suspected diagnosis. In contrast, Study 2 participants were required to be Aβ+, with either MCI or probable AD. These characteristics together with the additional inclusion criterion of a score 85 or less on the Repeatable Battery for the Assessment of Neuropsychological Status Update memory index, suggest that Study 2 may have been biased toward a more-impaired/more-likely-to-progress population, despite the more liberal MMSE upper limit (30 vs 27 in Study 1). Arguably, Study 2 data, based on a more homogeneous and Aβ+ population, provides a more rigorous estimate of the role of tau in progression in AD-spectrum patients. Nevertheless, flortaucipir scan pattern data showed similar results across both studies in predicting clinical progression.
It is important to understand the interaction between amyloid and tau because they usually coexist in these patients. The Aβ− participants enrolled in Study 1 provided an opportunity to understand this effect. The ordinal association (Aβ+/advanced AD to Aβ+/nonadvanced AD to Aβ− in progression) as shown in eFigure 2 in the Supplement indicated that although amyloid status influences clinical progression, an advanced AD tau pattern may have a more direct association with near-term clinical progression and provides additional information beyond amyloid.
It is also important to consider that 21% of the nonadvanced AD pattern participants (n = 26 of 124) had a moderate AD pattern, and most of them (n = 24 of 26) were Aβ+. Thus, these moderate AD pattern participants likely had both hallmark pathologies of AD and would be expected to show some cognitive deterioration over 18 months. Indeed, in the pooled study data (eFigure 1 in the Supplement), at month 18, all 3 pattern groups had some clinical progression, in the order of advanced AD pattern group, moderate AD pattern group, and negative AD pattern group. Nevertheless, except for the FAQ, mean changes between moderate and negative AD pattern groups were not statistically different. These data appear to support the prespecified hypothesis for both studies, that an advanced AD pattern would be more informative when predicting participants’ near-term clinical progression than other patterns.
Limitations
The study had several limitations. To provide a potentially clinically applicable patient stratification, both the visual interpretation and the primary end points were dichotomized (eg, advanced/nonadvanced AD pattern; CDR-SB worsening 1 point or more). However, AD is a continuous, progressive pathology. Hence, the analyses here may not provide the most precise representation of the associations between baseline tau and cognitive progression. Additionally, as an observational study, only 69% of Study 1 participants (n = 111 of 160) completed the 18-month follow-up. Loss of follow-up may have affected the efficacy evaluation, possibly reflected in the borderline significant P value for the primary analysis. Study 2 participants were selected from AMARANTH trial. Although this study was terminated early and primary efficacy analyses demonstrated no therapeutic effect, there may have been an undetected effect of therapy on cognitive change that could alter the association between baseline tau levels and cognitive change. Treatment was entered as a factor in all Study 2 statistical models, and no significant interactions were found. As a result, the pooled analyses were not adjusted for treatment effect.
Lastly, at baseline, participants with an advanced AD pattern were more cognitively impaired (Table 2). Although the baseline differences are relatively small, and the studies specifically constrained the baseline MMSE range to obtain a more homogeneous sample, it would be expected that more severe patients would deteriorate faster. Thus, analyses were corrected for respective baseline cognitive or functional scores. Statistically significant differences in progression by scan patterns were observed while controlling for this possible confounding effect. In addition, baseline MMSE associated with clinical progression independent of tau pattern, as expected (eFigure 3 in the Supplement). However, at any baseline MMSE level, the advanced AD group consistently had more progression than the nonadvanced AD group. This suggests that flortaucipir scan patterns provided additional information to understand patients’ clinical progression in addition to other clinical data.
Conclusions
In summary, data from 2 independent studies consistently demonstrated that participants with a flortaucipir advanced AD tau pattern are at a higher risk of clinically meaningful deterioration. Thus, flortaucipir PET, interpreted with a clinically applicable visual method, could provide helpful information regarding anticipated clinical decline in the management of patients being assessed for causes of cognitive impairment.
eMethods. PET Imaging Acquisition and Visual Interpretation
eTable 1. Inter-reader Consistency of Flortaucipir Scan Visual Interpretation
eTable 2. Risk for Clinical Progression Based on Individual Reader’s Visual Interpretation Results: Advanced AD Pattern vs. Non-Advanced AD Pattern
eTable 3. Risk for Clinical Progression Based on Individual Reader’s Visual Interpretation Results: Advanced AD Pattern vs. Non-Advanced AD Pattern
eFigure 1. Change from Baseline at 18 Months by Flortaucipir Scan Patterns, Pooled Data from Study 1 and Study 2
eFigure 2. Change from Baseline Values at Each Follow-up Visit by Amyloid-Tau Groups
eFigure 3. Change from Baseline: Adjusted Mean Values at 18 Months by Baseline MMSE, Pooled Data
eFigure 4. Flow Diagram for Subject Enrollment and Disposition
AVID Collaborators
References
- 1.Goedert M, Jakes R. Mutations causing neurodegenerative tauopathies. Biochim Biophys Acta. 2005;1739(2-3):240-250. doi: 10.1016/j.bbadis.2004.08.007 [DOI] [PubMed] [Google Scholar]
- 2.Kidd M. Paired helical filaments in electron microscopy of Alzheimer’s disease. Nature. 1963;197:192-193. doi: 10.1038/197192b0 [DOI] [PubMed] [Google Scholar]
- 3.Masters CL, Simms G, Weinman NA, Multhaup G, McDonald BL, Beyreuther K. Amyloid plaque core protein in Alzheimer disease and Down syndrome. Proc Natl Acad Sci U S A. 1985;82(12):4245-4249. doi: 10.1073/pnas.82.12.4245 [DOI] [PMC free article] [PubMed] [Google Scholar]
- 4.Hyman BT, Phelps CH, Beach TG, et al. National Institute on Aging-Alzheimer’s Association guidelines for the neuropathologic assessment of Alzheimer’s disease. Alzheimers Dement. 2012;8(1):1-13. doi: 10.1016/j.jalz.2011.10.007 [DOI] [PMC free article] [PubMed] [Google Scholar]
- 5.Arriagada PV, Growdon JH, Hedley-Whyte ET, Hyman BT. Neurofibrillary tangles but not senile plaques parallel duration and severity of Alzheimer’s disease. Neurology. 1992;42(3 Pt 1):631-639. doi: 10.1212/WNL.42.3.631 [DOI] [PubMed] [Google Scholar]
- 6.Wilcock GK, Esiri MM. Plaques, tangles and dementia: a quantitative study. J Neurol Sci. 1982;56(2-3):343-356. doi: 10.1016/0022-510X(82)90155-1 [DOI] [PubMed] [Google Scholar]
- 7.Cummings BJ, Pike CJ, Shankle R, Cotman CW. Beta-amyloid deposition and other measures of neuropathology predict cognitive status in Alzheimer’s disease. Neurobiol Aging. 1996;17(6):921-933. doi: 10.1016/S0197-4580(96)00170-4 [DOI] [PubMed] [Google Scholar]
- 8.Braak H, Braak E. Staging of Alzheimer’s disease-related neurofibrillary changes. Neurobiol Aging. 1995;16(3):271-278. doi: 10.1016/0197-4580(95)00021-6 [DOI] [PubMed] [Google Scholar]
- 9.Nelson PT, Braak H, Markesbery WR. Neuropathology and cognitive impairment in Alzheimer disease: a complex but coherent relationship. J Neuropathol Exp Neurol. 2009;68(1):1-14. doi: 10.1097/NEN.0b013e3181919a48 [DOI] [PMC free article] [PubMed] [Google Scholar]
- 10.Berg L, McKeel DW Jr, Miller JP, et al. Clinicopathologic studies in cognitively healthy aging and Alzheimer’s disease: relation of histologic markers to dementia severity, age, sex, and apolipoprotein E genotype. Arch Neurol. 1998;55(3):326-335. doi: 10.1001/archneur.55.3.326 [DOI] [PubMed] [Google Scholar]
- 11.Bennett DA, Schneider JA, Wilson RS, Bienias JL, Arnold SE. Neurofibrillary tangles mediate the association of amyloid load with clinical Alzheimer disease and level of cognitive function. Arch Neurol. 2004;61(3):378-384. doi: 10.1001/archneur.61.3.378 [DOI] [PubMed] [Google Scholar]
- 12.Fleisher AS, Pontecorvo MJ, Devous MD Sr, et al. ; A16 Study Investigators . Positron Emission Tomography Imaging With [18F]flortaucipir and Postmortem Assessment of Alzheimer Disease Neuropathologic Changes. JAMA Neurol. 2020;77(7):829-839. doi: 10.1001/jamaneurol.2020.0528 [DOI] [PMC free article] [PubMed] [Google Scholar]
- 13.Chien DT, Bahri S, Szardenings AK, et al. Early clinical PET imaging results with the novel PHF-tau radioligand [F-18]-T807. J Alzheimers Dis. 2013;34(2):457-468. doi: 10.3233/JAD-122059 [DOI] [PubMed] [Google Scholar]
- 14.Xia CF, Arteaga J, Chen G, et al. [(18)F]T807, a novel tau positron emission tomography imaging agent for Alzheimer’s disease. Alzheimers Dement. 2013;9(6):666-676. doi: 10.1016/j.jalz.2012.11.008 [DOI] [PubMed] [Google Scholar]
- 15.Cho H, Choi JY, Hwang MS, et al. In vivo cortical spreading pattern of tau and amyloid in the Alzheimer disease spectrum. Ann Neurol. 2016;80(2):247-258. doi: 10.1002/ana.24711 [DOI] [PubMed] [Google Scholar]
- 16.Johnson KA, Schultz A, Betensky RA, et al. Tau positron emission tomographic imaging in aging and early Alzheimer disease. Ann Neurol. 2016;79(1):110-119. doi: 10.1002/ana.24546 [DOI] [PMC free article] [PubMed] [Google Scholar]
- 17.Ossenkoppele R, Schonhaut DR, Schöll M, et al. Tau PET patterns mirror clinical and neuroanatomical variability in Alzheimer’s disease. Brain. 2016;139(Pt 5):1551-1567. doi: 10.1093/brain/aww027 [DOI] [PMC free article] [PubMed] [Google Scholar]
- 18.Bejanin A, Schonhaut DR, La Joie R, et al. Tau pathology and neurodegeneration contribute to cognitive impairment in Alzheimer’s disease. Brain. 2017;140(12):3286-3300. doi: 10.1093/brain/awx243 [DOI] [PMC free article] [PubMed] [Google Scholar]
- 19.Maass A, Landau S, Baker SL, et al. ; Alzheimer’s Disease Neuroimaging Initiative . Comparison of multiple tau-PET measures as biomarkers in aging and Alzheimer’s disease. Neuroimage. 2017;157:448-463. doi: 10.1016/j.neuroimage.2017.05.058 [DOI] [PMC free article] [PubMed] [Google Scholar]
- 20.Pontecorvo MJ, Devous MD Sr, Navitsky M, et al. ; 18F-AV-1451-A05 investigators . Relationships between flortaucipir PET tau binding and amyloid burden, clinical diagnosis, age and cognition. Brain. 2017;140(3):748-763. doi: 10.1093/brain/aww334 [DOI] [PMC free article] [PubMed] [Google Scholar]
- 21.Tosun D, Landau S, Aisen PS, et al. ; Alzheimer’s Disease Neuroimaging Initiative . Association between tau deposition and antecedent amyloid-β accumulation rates in normal and early symptomatic individuals. Brain. 2017;140(5):1499-1512. doi: 10.1093/brain/awx046 [DOI] [PubMed] [Google Scholar]
- 22.Maass A, Lockhart SN, Harrison TM, et al. Entorhinal tau pathology, episodic memory decline, and neurodegeneration in aging. J Neurosci. 2018;38(3):530-543. doi: 10.1523/JNEUROSCI.2028-17.2017 [DOI] [PMC free article] [PubMed] [Google Scholar]
- 23.Knopman DS, Lundt ES, Therneau TM, et al. Entorhinal cortex tau, amyloid-β, cortical thickness and memory performance in non-demented subjects. Brain. 2019;142(4):1148-1160. doi: 10.1093/brain/awz025 [DOI] [PMC free article] [PubMed] [Google Scholar]
- 24.Lowe VJ, Bruinsma TJ, Wiste HJ, et al. Cross-sectional associations of tau-PET signal with cognition in cognitively unimpaired adults. Neurology. 2019;93(1):e29-e39. doi: 10.1212/WNL.0000000000007728 [DOI] [PMC free article] [PubMed] [Google Scholar]
- 25.Sperling RA, Mormino EC, Schultz AP, et al. The impact of amyloid-beta and tau on prospective cognitive decline in older individuals. Ann Neurol. 2019;85(2):181-193. doi: 10.1002/ana.25395 [DOI] [PMC free article] [PubMed] [Google Scholar]
- 26.Pontecorvo MJ, Devous MD, Kennedy I, et al. A multicentre longitudinal study of flortaucipir (18F) in normal ageing, mild cognitive impairment and Alzheimer’s disease dementia. Brain. 2019;142(6):1723-1735. doi: 10.1093/brain/awz090 [DOI] [PMC free article] [PubMed] [Google Scholar]
- 27.Cho H, Choi JY, Lee HS, et al. Progressive tau accumulation in Alzheimer disease: 2-year follow-up study. J Nucl Med. 2019;60(11):1611-1621. doi: 10.2967/jnumed.118.221697 [DOI] [PMC free article] [PubMed] [Google Scholar]
- 28.World Medical Association declaration of Helsinki: recommendations guiding physicians in biomedical research involving human subjects. JAMA. 1997;277(11):925-926. doi: 10.1001/jama.1997.03540350075038 [DOI] [PubMed] [Google Scholar]
- 29.Albert MS, DeKosky ST, Dickson D, et al. The diagnosis of mild cognitive impairment due to Alzheimer’s disease: recommendations from the National Institute on Aging-Alzheimer’s Association workgroups on diagnostic guidelines for Alzheimer’s disease. Alzheimers Dement. 2011;7(3):270-279. doi: 10.1016/j.jalz.2011.03.008 [DOI] [PMC free article] [PubMed] [Google Scholar]
- 30.McKhann GM, Knopman DS, Chertkow H, et al. The diagnosis of dementia due to Alzheimer’s disease: recommendations from the National Institute on Aging-Alzheimer’s Association workgroups on diagnostic guidelines for Alzheimer’s disease. Alzheimers Dement. 2011;7(3):263-269. doi: 10.1016/j.jalz.2011.03.005 [DOI] [PMC free article] [PubMed] [Google Scholar]
- 31.Jack CR Jr, Knopman DS, Jagust WJ, et al. Tracking pathophysiological processes in Alzheimer’s disease: an updated hypothetical model of dynamic biomarkers. Lancet Neurol. 2013;12(2):207-216. doi: 10.1016/S1474-4422(12)70291-0 [DOI] [PMC free article] [PubMed] [Google Scholar]
- 32.Skrtic S, Cabrera C, Olsson M, Schnecke V, Lind M. Contemporary risk estimates of three HbA1c variables in relation to heart failure following diagnosis of type 2 diabetes. Heart. 2017;103(5):353-358. doi: 10.1136/heartjnl-2016-309806 [DOI] [PMC free article] [PubMed] [Google Scholar]
- 33.McNeil JJ, Wolfe R, Woods RL, et al. ; ASPREE Investigator Group . Effect of aspirin on cardiovascular events and bleeding in the healthy elderly. N Engl J Med. 2018;379(16):1509-1518. doi: 10.1056/NEJMoa1805819 [DOI] [PMC free article] [PubMed] [Google Scholar]
- 34.Elder RW, Wu FM. Clinical approaches to the patient with a failing fontan procedure. Curr Cardiol Rep. 2016;18(5):44. doi: 10.1007/s11886-016-0716-y [DOI] [PubMed] [Google Scholar]
- 35.Wilson PW, D’Agostino RB, Levy D, Belanger AM, Silbershatz H, Kannel WB. Prediction of coronary heart disease using risk factor categories. Circulation. 1998;97(18):1837-1847. doi: 10.1161/01.CIR.97.18.1837 [DOI] [PubMed] [Google Scholar]
- 36.Thal DR, Rüb U, Orantes M, Braak H. Phases of A beta-deposition in the human brain and its relevance for the development of AD. Neurology. 2002;58(12):1791-1800. doi: 10.1212/WNL.58.12.1791 [DOI] [PubMed] [Google Scholar]
- 37.Duyckaerts C, Uchihara T, Seilhean D, He Y, Hauw JJ. Dissociation of Alzheimer type pathology in a disconnected piece of cortex. Acta Neuropathol. 1997;93(5):501-507. doi: 10.1007/s004010050645 [DOI] [PubMed] [Google Scholar]
- 38.Price JL, Morris JC. Tangles and plaques in nondemented aging and “preclinical” Alzheimer’s disease. Ann Neurol. 1999;45(3):358-368. doi: [DOI] [PubMed] [Google Scholar]
- 39.Crary JF, Trojanowski JQ, Schneider JA, et al. Primary age-related tauopathy (PART): a common pathology associated with human aging. Acta Neuropathol. 2014;128(6):755-766. doi: 10.1007/s00401-014-1349-0 [DOI] [PMC free article] [PubMed] [Google Scholar]
Associated Data
This section collects any data citations, data availability statements, or supplementary materials included in this article.
Supplementary Materials
eMethods. PET Imaging Acquisition and Visual Interpretation
eTable 1. Inter-reader Consistency of Flortaucipir Scan Visual Interpretation
eTable 2. Risk for Clinical Progression Based on Individual Reader’s Visual Interpretation Results: Advanced AD Pattern vs. Non-Advanced AD Pattern
eTable 3. Risk for Clinical Progression Based on Individual Reader’s Visual Interpretation Results: Advanced AD Pattern vs. Non-Advanced AD Pattern
eFigure 1. Change from Baseline at 18 Months by Flortaucipir Scan Patterns, Pooled Data from Study 1 and Study 2
eFigure 2. Change from Baseline Values at Each Follow-up Visit by Amyloid-Tau Groups
eFigure 3. Change from Baseline: Adjusted Mean Values at 18 Months by Baseline MMSE, Pooled Data
eFigure 4. Flow Diagram for Subject Enrollment and Disposition
AVID Collaborators