Abstract
Obstetric patients show an increased risk of developing venous thromboembolism (VTE). Modeling the changes that occur during and after delivery may help determine which patients will develop VTE and when they might be likely to develop this dangerous complication after delivery. Combining a model of blood volume changes with a model of activated clotting factor concentrations, which are both affected during delivery, can identify scenarios that may lead to an increased risk of developing clots in the venous vascular space. This Ordinary Differential Equation (ODE) model recapitulates known phenomena including an elevated coagulation response during delivery and hemorrhage leading to increased clotting factor concentration in the vascular space. The simulation from normal activation without hemorrhage results in a spike in clotting factors in the vascular space to reestablish hemostasis after delivery. With twice the activation rate, simulations show elevated and extended duration of activated clotting factor presence in the vascular space. With response to a hemorrhage with normal activation, the resulting elevation and duration is further increased. This model, when tailored to individual patients, could lead to the development of a VTE risk assessment tool for clinicians to help mitigate and reduce an individual’s risk of developing this deadly complication.
Keywords: Venous Thromboembolism, Obstetrics, Nonlinear Dynamic Modeling, Clotting, Postpartum Hemorrhage
1. INTRODUCTION
Obstetric patients are at an increased risk of venous thromboembolism (VTE) due to the hypercoagulable state observed in this population. This hypercoagulable state normally serves to restore hemostasis after delivery for most patients. However, determining which patients will go on to develop dangerously high thrombosis leading to VTE is a significant problem, as VTE comprises 15.2 percent of maternal deaths reported (Kuriya et al. (2016)). According to James (2009), a number of factors can contribute to clinical decisions regarding preventative anticoagulant therapy including: current thrombosis, history of thrombosis, thrombophilia, and history of poor pregnancy outcome. James (2009) also reports that treatment for increased risk of VTE is currently limited to heparin-based anticoagulants, which are safe during pregnancy, and has shown to improve outcomes for those patients. Diagnosing conditions that lead to increased risk of VTE is often expensive and time consuming (Dresang et al. (2008), Stone and Morris (2004)) motivating faster more cost effective identification methods. It may be possible to identify conditions that predict higher risk of VTE with data from inexpensive, and fast, point-of-care services like the thromboelastogram (TEG), which provides a quick assessment of blood clotting functionality. Together, the insights gained from simulations combined with TEG data may provide enough information to more accurately predict VTE in the obstetric population.
In an effort to address this problem, dynamic models can simulate different known patient conditions which may lead to increased risk of thrombotic complications. Physiological constraints on the simulations are imposed, including total blood volume.
2. METHODS
The work published by Richards et al. (2017) in modeling fluid volume and creatinine dynamics during acute kidney injury and edema, informed the coupled structure of this model. Since procoagulants drive thrombus formation, and are linked to increased risk of VTE (Ozaki and Bartholomew (2012)), our model explicitly couples physiologically-motivated compartments representing blood volume and activated clotting factor concentration. Additional considerations are added for the delivery effect on blood volume, and concentration of activated clotting factors including activation and deactivation rates, as well as the effect of a limited hemorrhage after birth.
2.1. Blood Volume Model
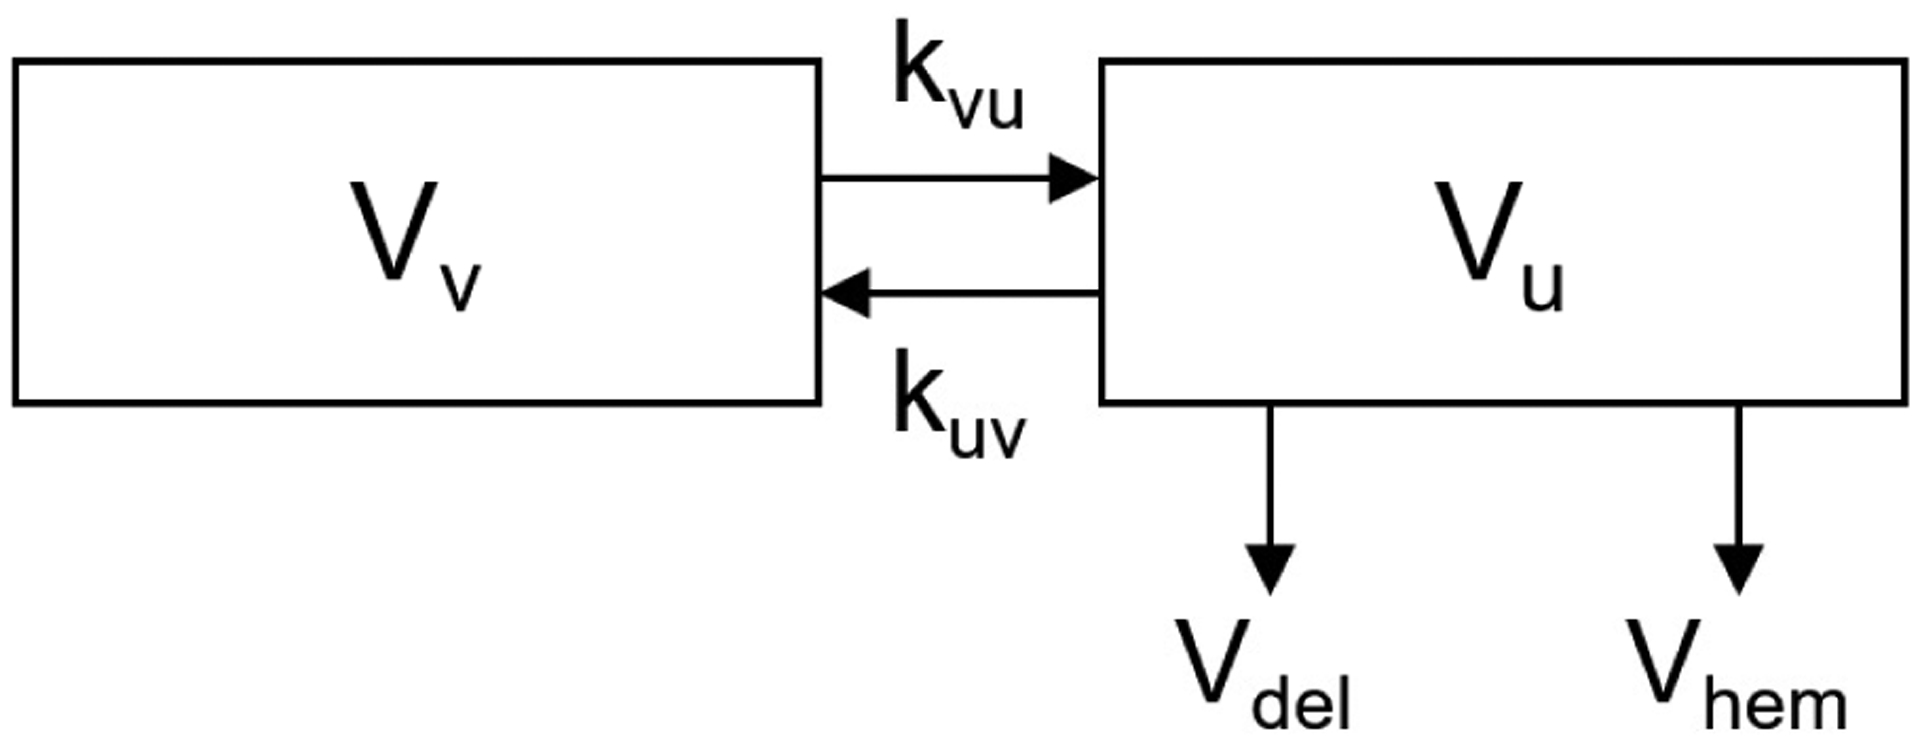
The compartmental model of blood volume is subdivided into a vascular space and a uterine space, as shown in Fig. 1. The rate constants kvu and kuv represent scaled volumetric flow from the vascular to the uterine compartment, and vice versa, respectively. The magnitude range of kvu was first determined via simulation results following physiological response times, and kuv, was subsequently calculated as the product of kvu with the ratio of the vascular volume (6.3 L) to uterine volume (1.2 L), where volumes are reported from Hytten (1985).
Fig. 1.

Volumetric model subscripts: v, indicates vascular space; u, indicates uterine space; del, indicates delivery; and hem, indicates any hemorrhage.
The equations governing the changes in volume are shown below. The ODE model includes two states representing volume: vascular volume (1), uterine volume (2), as follows:
| (1) |
| (2) |
The volume loss during delivery, Vdel, is implemented as a limited loss from the uterine volume compartment. The total loss was specified as 0.3 L (the volume loss from vaginal delivery Clapp (1978)), and was divided over ten minutes representing the final stages of delivery, which takes between 5 and 30 minutes May (2016). The volume loss is implemented mathematically as a rectangular wave, as follows:
| (3) |
In the absence of hemorrhage, Vhem = 0. With hemorrhage, Vhem is represented as equation (4). This hemorrhage is a bleed of 0.5 L (the lower limit on postpartum hemorrhage) over 30 minutes following delivery.
| (4) |
2.2. Activated Clotting Factor Concentration Model
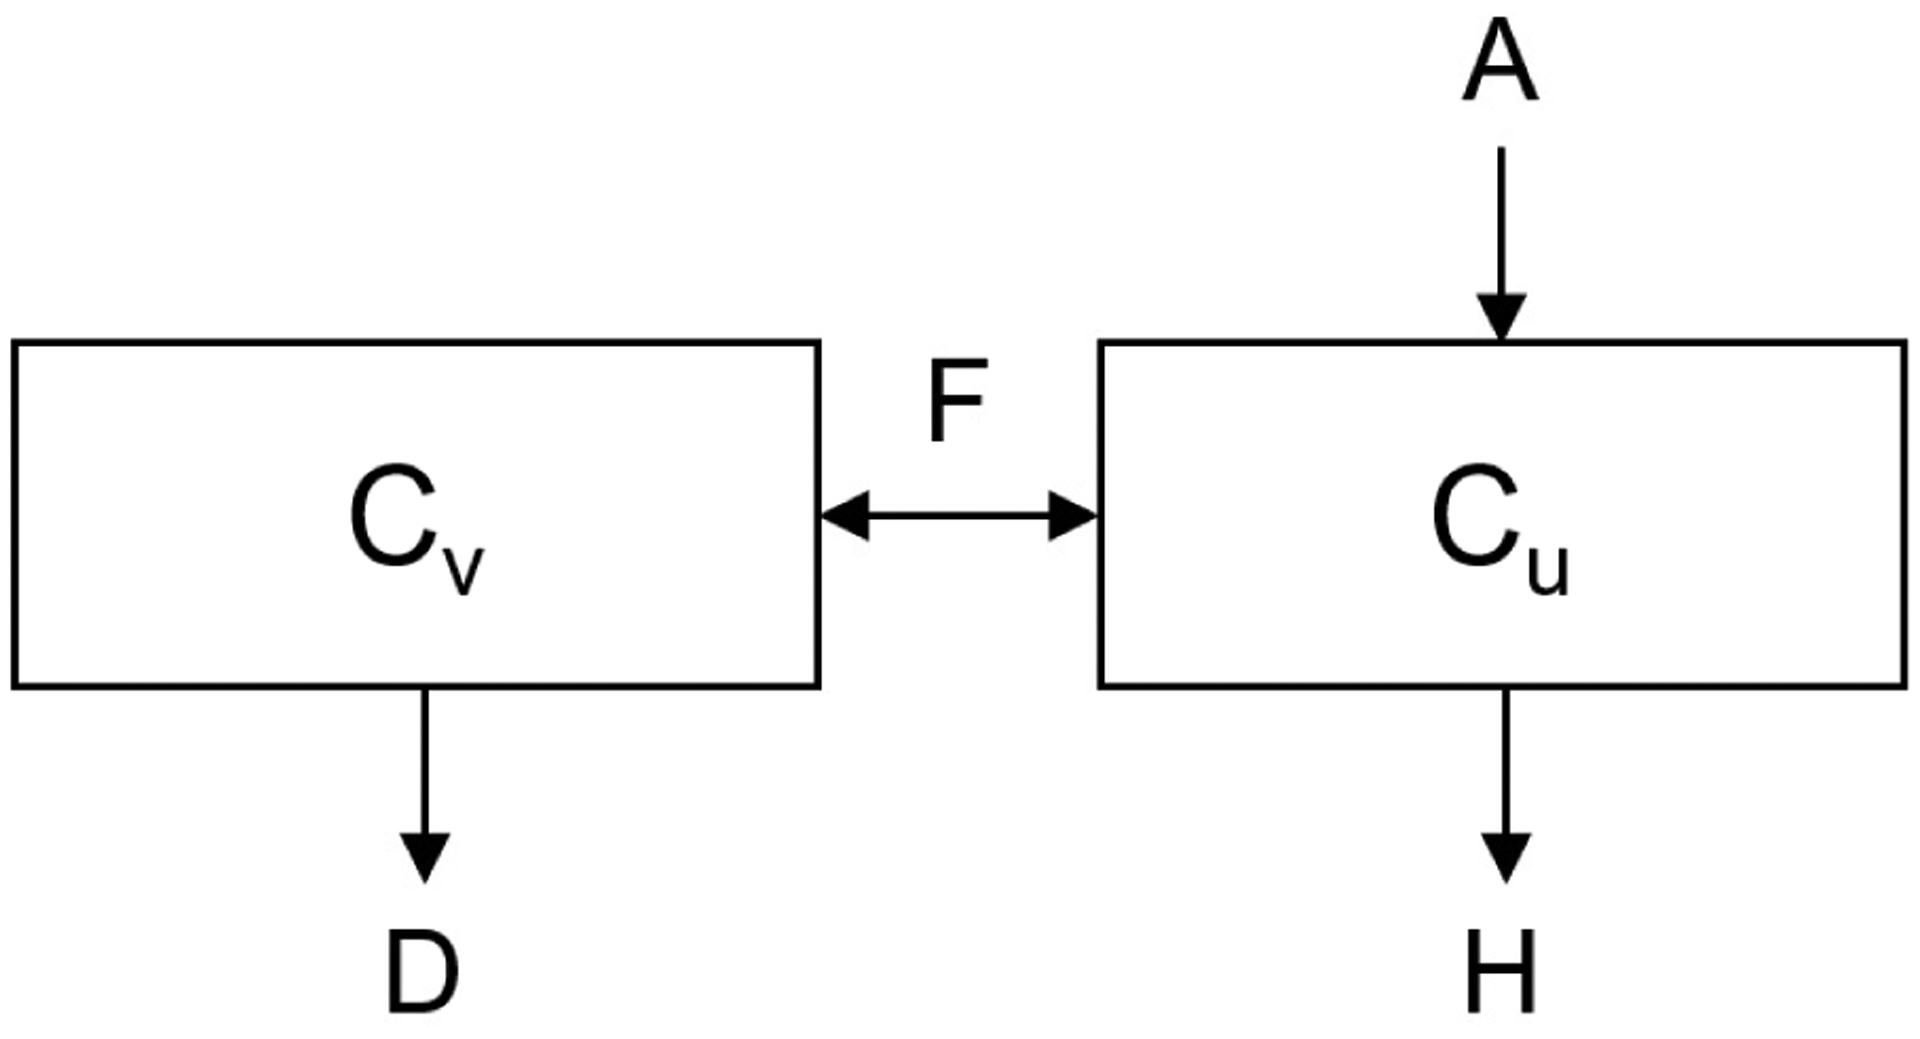
While many different clotting factors are involved in the clotting cascade, this model lumps all of the clotting factors that activate thrombus formation. Clotting factors are modeled in both the vascular space and the uterine space. In Fig. 2, the general model is shown with A representing activation of clotting factors, D representing deactivation of clotting factors, H representing loss of clotting factors from hemorrhage, and F representing the flowrate between the compartments defined from Thaler et al. (1990). Specifically, the activation will be analyzed in a normal and an elevated case, where the elevated case represents a hypercoagulable response. Baseline activated clotting factor concentration was assumed to be zero before delivery.
Fig. 2.

Concentration model: subscript v indicating the vascular space and u indicating uterine space. F: flowrate, H: hemorrhage, A: activation, D: deactivation.
The vascular concentration of clotting factors (5), and uterine concentration of clotting factors (6) follow the following ODE representation:
| (5) |
| (6) |
where variables are represented as described in Fig. 2, and H(t) is capturing the loss of activated clotting factors due to the flowrate out as defined by Vhem in equation (4). The dynamics of the vascular concentration of clotting factors may provide understanding that relates to VTE. For example, elevated concentrations in the vascular compartment may lead to increased risk of VTE, especially when elevated for longer periods of time.
2.3. Simulation
The model was constructed in MATLAB using the SIMULINK toolbox (©2018, The MathWorks), and simulations were ran over 250 minutes after delivery. See Table 1 for parameter values and initial conditions of variables used in simulation.
Table 1.
Parameter values and initial conditions simulated in the model.
| Parameter | Value | Units | Description |
|---|---|---|---|
| k vu | 0.01 | 1/min | Rate constant between V and U |
| k uv | 0.0525 | 1/min | Rate constant between U and V |
| F | 0.342 | L/min | Blood flowrate |
| A | 0.25 (0.5) | CF/min | Normal activation value (high activation) |
| D | 0.01 | CF/min | Deactivation value |
| Initial Conditions | Value | Units | Description |
| Vv0 | 6.3 | L | Vascular volume |
| Vu0 | 1.2 | L | Uterine volume |
| Cv0 | 0 | CF/L | Vascular concentration of clotting factors |
| Cu0 | 0 | CF/L | Uterine concentration of clotting factors |
3. RESULTS
Both the volumetric and concentration results show distinct activated clotting factor concentration and compartment volume profiles.
3.1. Blood Volume Simulations
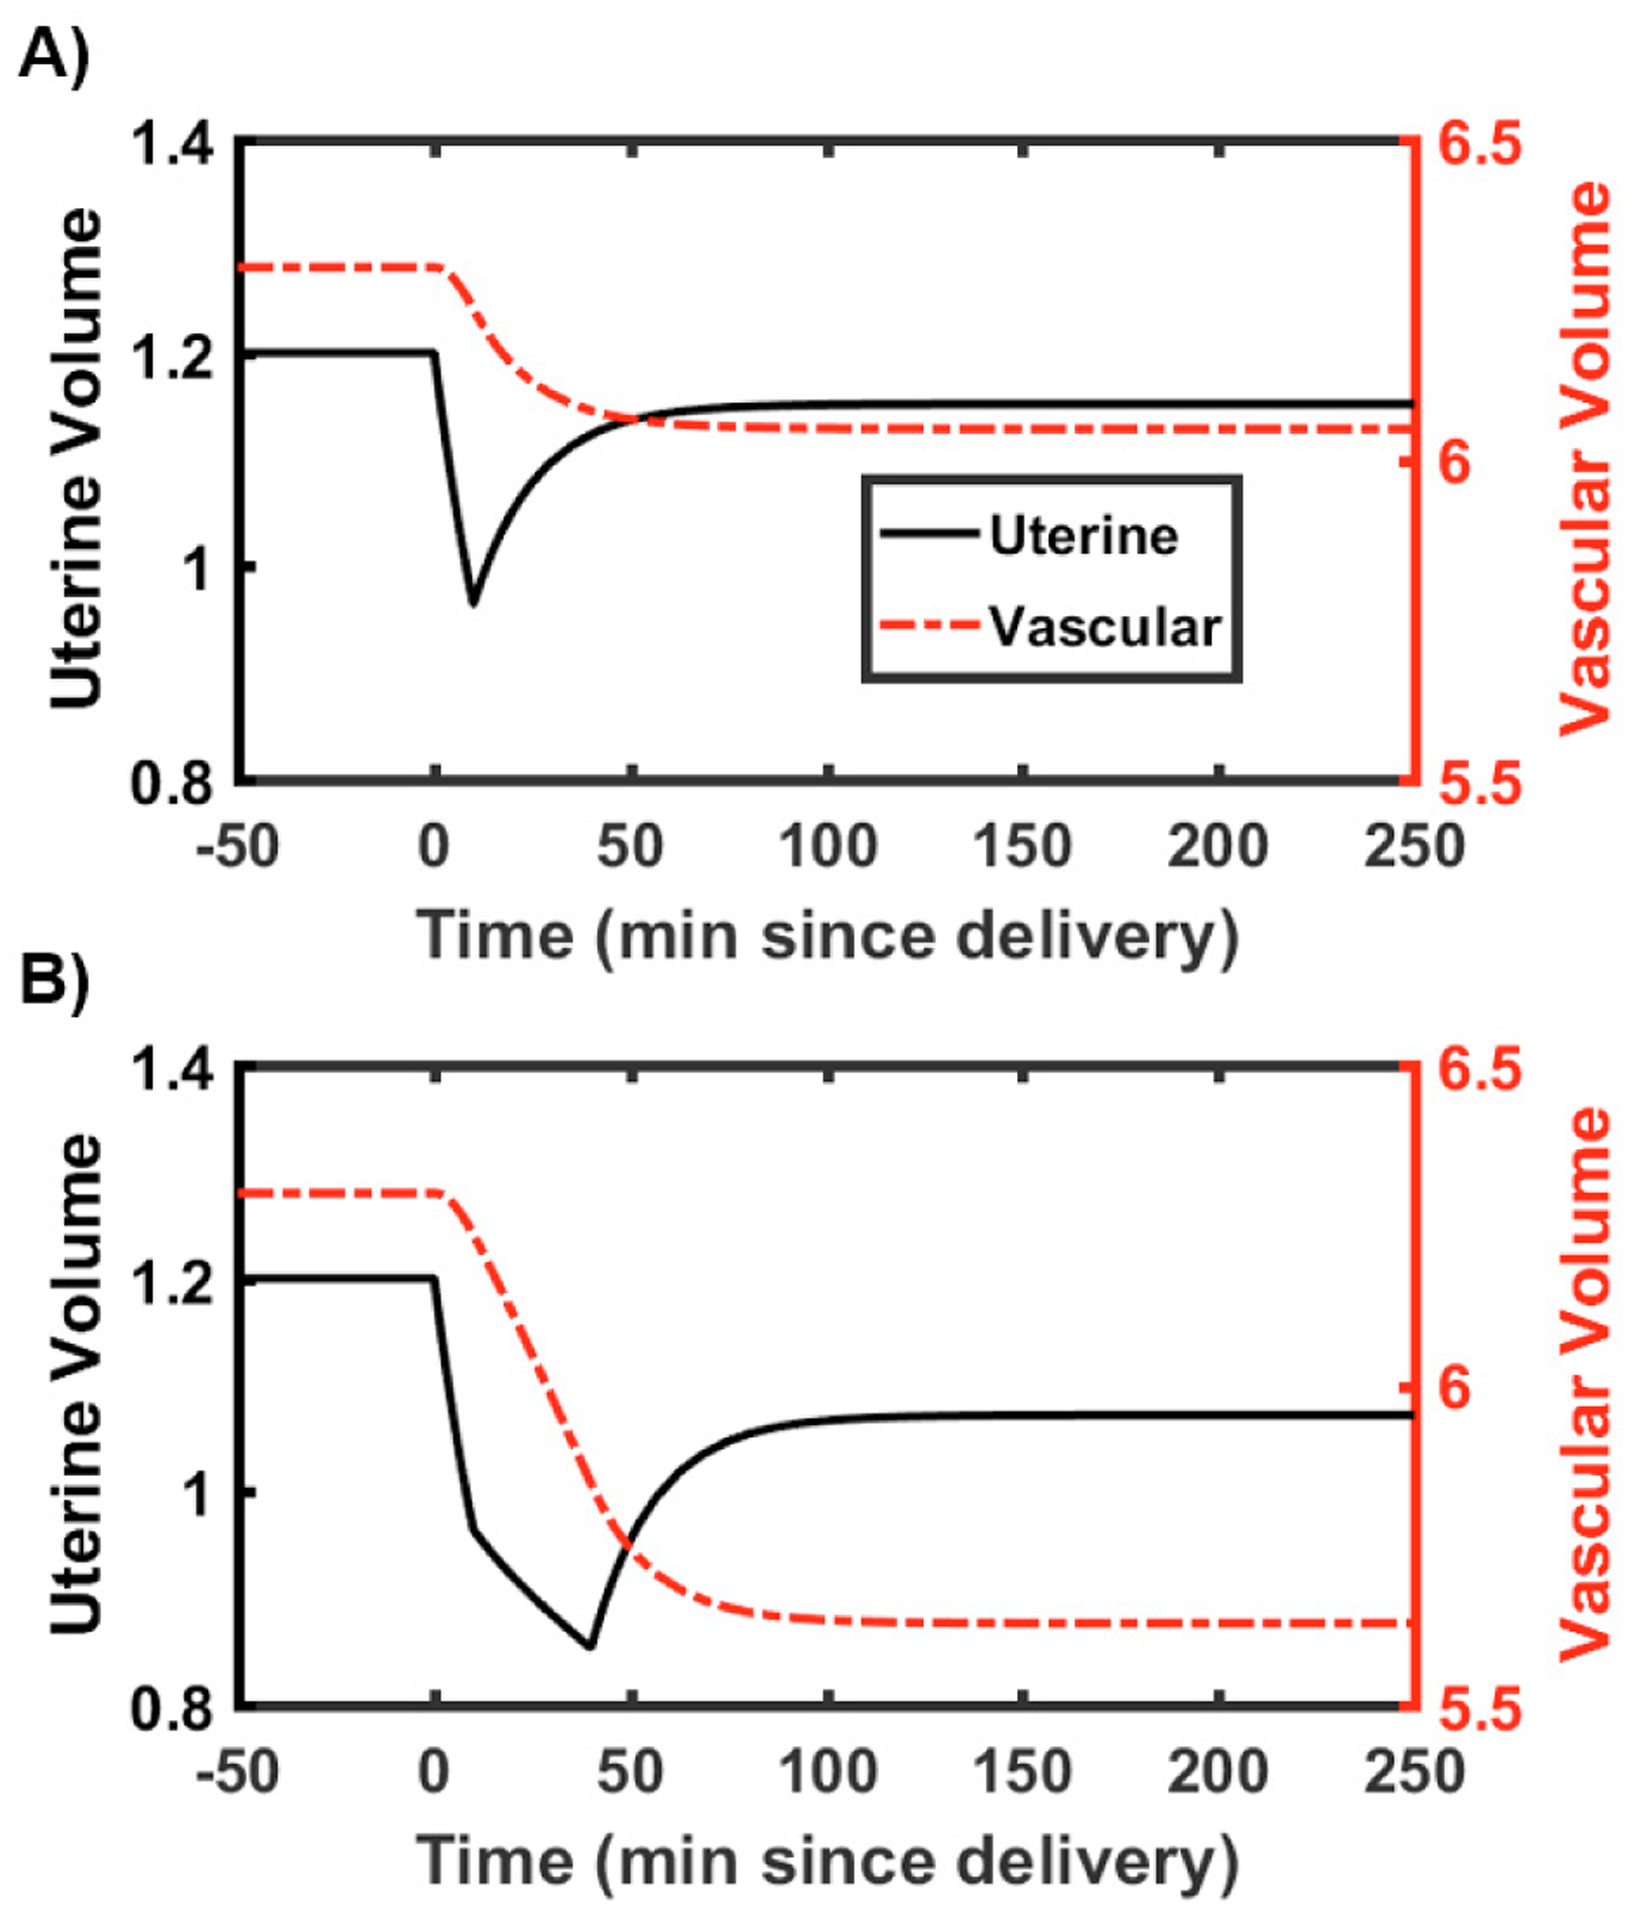
Volumetric simulation results capture the expected loss from delivery with and without hemorrhage. The simulation results are shown in Fig. 3 where A) shows the normal uterine volume decrease due to delivery during the final phase of labor, and B) shows a similar uterine volume decrease from delivery combined with an additional uterine volume decrease due to hemorrhage. The hemorrhage after delivery is seen as a further decrease over the following 30 minutes. During this time, the rate constants kvu and kuv allow for equilibration between the two compartments. The coupled volume-concentration model in the next section captures the expected physiological responses of activated clotting in the presence of systemic volume changes after hemorrhage.
Fig. 3.

Volumetric states shown over the 250 minute simulation for A) without a hemorrhage after delivery, B) with a 0.5 L hemorrhage after delivery. Plots were truncated at 100 minutes (of the total 250 minute simulation) in order to visualize volume change.
3.2. Activated Clotting Factor Concentration Simulations
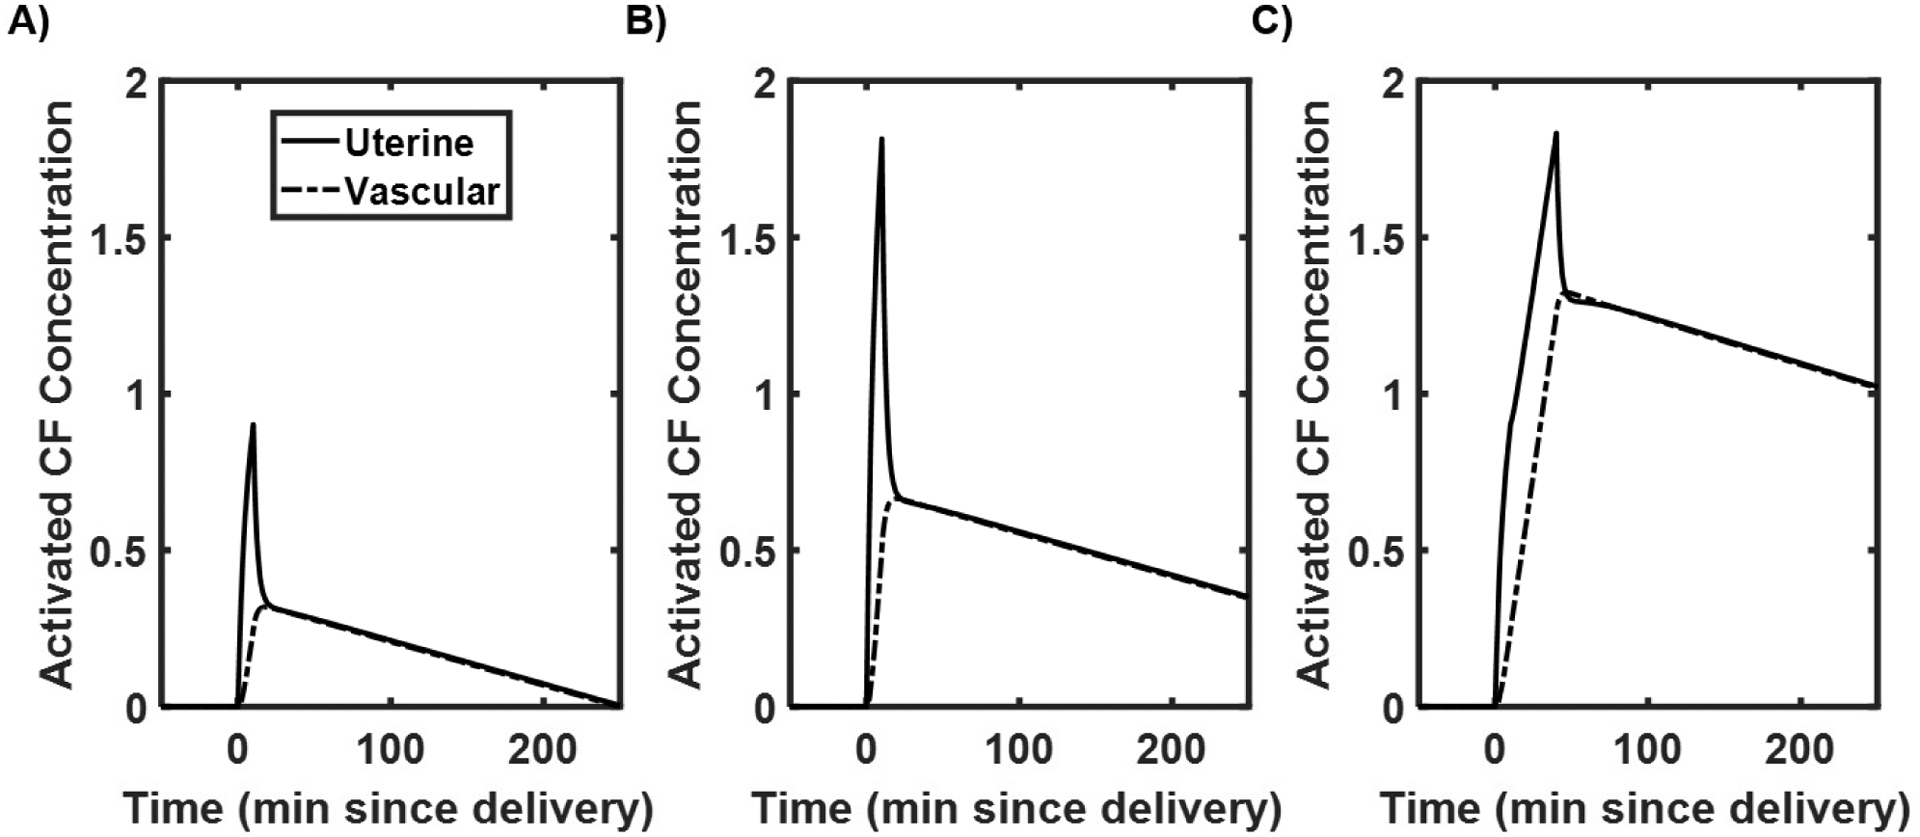
The results from the clotting factor concentration states are shown in Fig. 4, with the units of concentration being generalized and thought of as a change from the baseline state. These plots correspond to the dynamics seen in the volumetric compartments. The different curves show a spike in activated clotting factors in the uterine compartment in all cases. For nominal activation with no additional hemorrhage (Fig. 4A), there is also an increase in clotting factor concentration in the vascular compartment up to a generalized activated clotting factor concentration of 0.25 above baseline. For elevated activation with no additional hemorrhage (Fig. 4B), there is a higher resulting concentration of activated clotting factors in the vascular compartment when compared to the nominal activation case with this generalized concentration of activated clotting factor elevated above 0.5 when compared to baseline. For nominal activation with hemorrhage (Fig. 4C), there is a more dramatic increase in generalized concentration of activated clotting factors in the vascular compartment when compared to the cases without hemorrhage. Only the nominal case returns to baseline by the end of the simulation at 250 minutes.
Fig. 4.

Clotting factor simulation results showing A) normal activation without a hemorrhage after delivery, B) twice the normal rate of activation without a hemorrhage after delivery, C) normal activation with a 0.5 L hemorrhage after delivery.
For these simulations, Fig. 4B may represent an obstetric patient with a hypercoagulatory response, where activation rate, A, is much higher than normal. The magnitudes of response for Fig. 4B results in an increase in magnitude of activated clotting factors along with an increased duration. Fig. 4C, concentrations are elevated even higher; significant elevation in activated clotting factors in the vasculature could be used to indicate an increased risk of developing VTE, as characterized by a threshold (e.g., 0.5 for systemic clotting factor levels leading to VTE).
4. SUMMARY
We provide this simple mathematical structure as a first attempt to model the dynamic response of volume and clotting factors in postpartum women. The volumetric model is derived from physiological flowrates and volumes, while the clotting factor model is generalized to capture the multitude of factors impacting clotting after delivery. The results suggest that simulating a phenomenological model of volumetric changes during and after delivery may contribute to a deeper understanding of elevated risk of VTE. Adding additional physiological and anatomical accuracy is a next step for this model, including partitioning the volume model into arterial and venous spaces, incorporating an extravascular space compartment, closely mapping the clotting cascade factors onto the clotting factor model, and linking the production of clotting factors to clinical events through the model parameterization (e.g. hemorrhage drives A(t) in both magnitude and duration). Furthermore, we look to extend this model by incorporating clinical measurements (TEG) and interventions (e.g., transfusions and administration of blood products). The measurements will inform interpatient variability (as represented by the model parameters), and an individualized model may provide an assessment of VTE risk pre-delivery. This would allow clinicians to be prepared with their available interventions and act in a way that is most likely to decrease VTE risk for the given patient during and after delivery – the long-term goal, to which this work is a first step.
ACKNOWLEDGEMENTS
The author would like to acknowledge Evan Richards for his support in developing coupled-compartmental models.
Financial support for this work is provided by the US Department of Education Graduate Assistance in Areas of National Need fellowship program (P200A150050) and the National Institutes of Health, National Heart, Lung, and Blood Institute (R21-HL-133891).
REFERENCES
- (2016). Labor and delivery, postpartum care. URL https://www.mayoclinic.org/.
- Clapp J (1978). Cardiac output and uterine blood flow in the pregnant ewe. Am J Obstet Gynecol, 130(4), 419–423. [DOI] [PubMed] [Google Scholar]
- Dresang LT, Fontaine P, Leeman L, and King VJ (2008). Venous thromboembolism during pregnancy. American Family Physician, 77(12), 1709–1716. [PubMed] [Google Scholar]
- Hytten F (1985). Blood volume changes in normal pregnancy. Clin Haematol, 14(3), 601–612. [PubMed] [Google Scholar]
- James AH (2009). Venous thromboembolism in pregnancy. Arteriosclerosis, Thrombosis, and Vascular Biology, 29(3), 326–331. [DOI] [PubMed] [Google Scholar]
- Kuriya A, Piedimonte S, Spence A, Czuzoj-Shulman N, Kezouh A, and Abenhaim H (2016). Incidence and causes of maternal mortality in the USA. Journal of Obstetrics and Gynaecology Research, 42(6), 661–668. [DOI] [PubMed] [Google Scholar]
- Ozaki A and Bartholomew JR (2012). Venous Thromboembolism (Deep Venous Thrombosis & Pulmonary Embolism).
- Richards E, Clermont G, and Parker RS (2017). Modeling Fluid Volume and Creatinine Dynamics during Acute Kidney Injury and Edema. IFAC-PapersOnLine, 50(1), 6678–6683. [Google Scholar]
- Stone SE and Morris TA (2004). Pulmonary embolism and pregnancy. Critical Care Clinics, 20(4), 661–677. [DOI] [PubMed] [Google Scholar]
- Thaler I, Manor D, Itskovitz J, Rottem S, Levit N, Timor-Tritsch I, and Brandes J (1990). Changes in uterine blood flow during human pregnancy. Am J Obstet Gynecol, 162(1), 121–5. [DOI] [PubMed] [Google Scholar]


