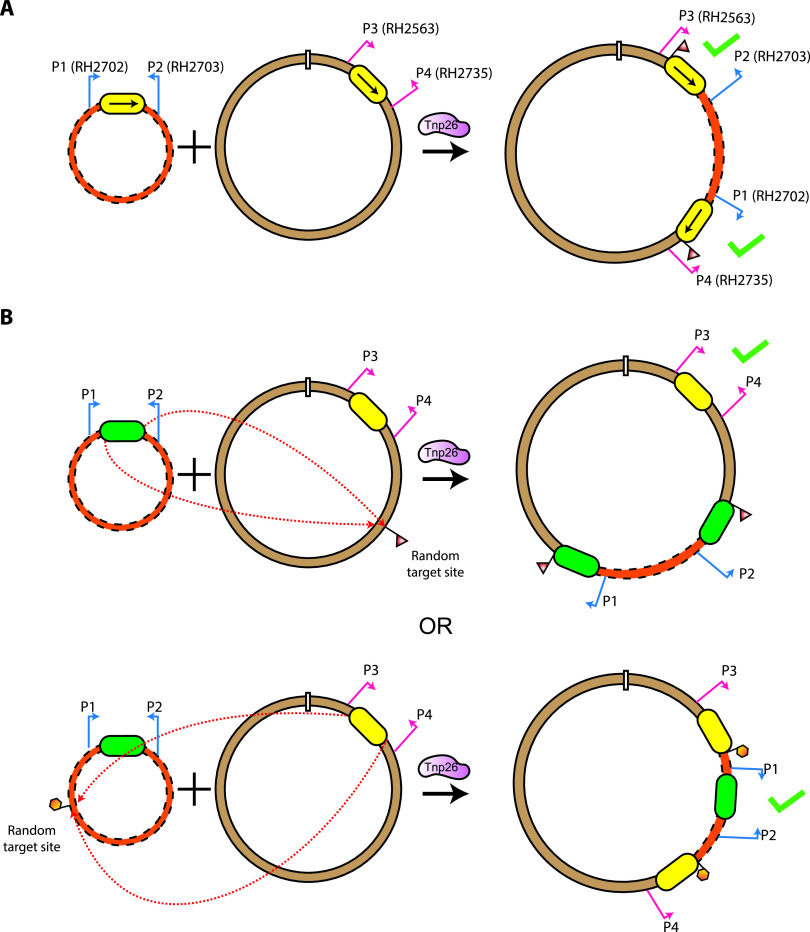
FIG 3.
Cointegrate PCR mapping strategies. (A) Targeted conservative cointegrate formation. The two molecules containing the IS are indicated by a dashed orange line, and a solid brown line, with the IS shown as a yellow box. Primer pairs are denoted by bent arrows and labeled in their original molecule and in the cointegrate. A green check denotes the combination of primers that generate a positive PCR product from targeted cointegrates. (B) Strategy for determining the IS participating in the untargeted copy-in reaction. The molecules containing different IS26 family members are denoted by a dashed orange line, and a solid brown line, with one IS indicated by a green box and the other by a yellow box. Primer pairs that amplify across each of the IS in their original position are indicated by bent arrows: P1 and P2 (blue arrows) and P3 and P4 (red arrows). A random target site and subsequent target site duplication (TSD) are indicated by triangular or hexagonal flags. Primer pairs that would generate an amplicon after cointegrate formation by each IS are indicated by a green tick.

