

Abstract
Background
There is growing evidence for a positive correlation between measures of muscular strength and cognitive abilities. However, the neurophysiological correlates of this relationship are not well understood so far. The aim of this study was to investigate cortical hemodynamics [i.e., changes in concentrations of oxygenated (oxyHb) and deoxygenated hemoglobin (deoxyHb)] as a possible link between measures of muscular strength and cognitive performance.
Methods
In a cohort of younger adults (n = 39, 18–30 years), we assessed (i) handgrip strength by a handhold dynamometer, (ii) short-term working memory performance by using error rates and reaction times in the Sternberg task, and (iii) cortical hemodynamics of the prefrontal cortex (PFC) via functional near-infrared spectroscopy (fNIRS).
Results
We observed low to moderate negative correlations (rp = ~ − 0.38 to − 0.51; p < 0.05) between reaction time and levels of oxyHb in specific parts of the PFC. Furthermore, we noticed low to moderate positive correlations (rp = ~ 0.34 to 0.45; p < 0.05) between reaction times and levels of deoxyHb in distinct parts of the PFC. Additionally, higher levels of oxyHb (rp (35) = 0.401; p = 0.014) and lower levels of deoxyHb (rp (34) = − 0.338; p = 0.043) in specific parts of the PFC were linked to higher percentage of correct answers. We also found low to moderate correlations (p < 0.05) between measures of handgrip strength and levels of oxyHb (rp = ~ 0.35; p < 0.05) and levels of deoxyHb (rp = ~ − 0.25 to − 0.49; p < 0.05) in specific parts of the PFC. However, there was neither a correlation between cognitive performance and handgrip strength nor did cortical hemodynamics in the PFC mediate the relationship between handgrip strength and cognitive performance (p > 0.05).
Conclusion
The present study provides evidence for a positive neurobehavioral relationship between cortical hemodynamics and cognitive performance. Our findings further imply that in younger adults higher levels of handgrip strength positively influence cortical hemodynamics although the latter did not necessarily culminate in better cognitive performance. Future research should examine whether the present findings can be generalized to other cohorts (e.g., older adults).
Keywords: Cognition, Functional near-infrared spectroscopy, Handgrip strength, Cognition, Sternberg paradigm, Muscular fitness
Background
Recent reviews provide evidence that the preservation of muscular strength (e.g., due to regular resistance training) is beneficial to maintain brain health and cognitive functioning [1–4].
In this context, handgrip strength has been considered an important marker of health in general [5–8] and of brain health in particular [9–11]. In line with this assumption, there is accumulating evidence linking measures of handgrip strength to cognitive functioning across the human lifespan. More specifically, it has been observed that in older individuals, higher levels of handgrip strength are associated with lesser cognitive decline during aging [12–19] and with better performance in standardized cognitive tests [20–25]. Moreover, also in younger adults [26] and middle-aged adults [27] higher levels of handgrip strength were linked to higher cognitive performance. Accordingly, these findings suggest that even in younger and middle-aged adults, a certain level of (handgrip) strength is an important factor contributing to cognitive well-functioning. However, based on the low number of available studies incorporating those age groups, additional, arguably more critical investigations, are required before strong conclusions can be drawn with certainty.
Notably, none of the mentioned studies help answering the question why higher levels of handgrip strength are linked to better cognitive performance as those studies did not assess the neurophysiological correlates (e.g., cortical hemodynamics). These neurophysiological correlates (e.g., cortical hemodynamics) might mediate the relationship between handgrip strength and cognitive performance [1, 18]. The assumption that changes in cortical hemodynamics (e.g., changes in oxyHb and deoxyHb) can mediate the relationship between handgrip strength and cognitive performance emerged from studies investigating the relationships between cardiorespiratory fitness, cognitive performance and cortical hemodynamics.
In particular, these previous studies observed (i) that higher levels of cardiorespiratory fitness (e.g., objectified by maximal oxygen uptake []) are associated with better cognitive performance and higher levels of oxyHb in the PFC [28–31] as well as (ii) that cortical hemodynamics (e.g., level of oxyHb concentration) mediate, at least partly, the relationship between cardiorespiratory fitness level and cognitive performance [30–32].
To the best of our knowledge, there is currently no comparable study available that has examined the relationship between muscular strength, cognitive functioning, and cortical hemodynamics [1]. Hence, the current study aims to investigate the possible links between muscular strength (i.e., operationalized by handgrip strength), cognitive functioning (i.e., assessed by reaction times and errors in Sternberg task), and functional cortical hemodynamics (i.e., measured by fNIRS) in younger adults.
Materials and methods
Participants and study design
Thirty-nine healthy right-handed, young adults [13 female/26 male; age 24.0 ± 3.1 years; body height 174.4 ± 9.2 cm; body mass 72.7 ± 14.2 kg; body mass index (BMI) 23.7 ± 3.3 kg/m2] with normal or corrected vision who had no history of self-reported orthopaedic, cardiovascular, psychiatric, and/or neurological diseases participated in this study.
The study was approved by the local ethics committee of the Medical Faculty of the Otto von Guericke University Magdeburg (No. 181/18) and was in accordance with the Declaration of Helsinki (1964). All participants were informed about the study procedures and provided written informed consent to participate. The participants received a compensation fee of 16 EUR.
In this cross-sectional study, the participants were asked to visit our laboratory once to assess their general participants’ characteristics, to complete questionnaires on mental health, sleep quality, and regular physical activity level, to conduct selected neuropsychological tests, and to assess their handedness and maximal isometric handgrip strength. Furthermore, fNIRS was used to record the cortical hemodynamics while the participants solved the Sternberg task. All tests are described below in more detail.
Screening measures and handgrip strength testing
The mental health status was assessed by using the Becks Depression Inventory II (BDI-II) in which higher total scores indicate more serve depressive symptoms [33]. Furthermore, we evaluated sleep quality by using the Pittsburgh Sleep Quality Index (PSQI) [34]. A higher total PSQI score indicates more impaired sleep quality [34].
The regular physical activity level and the regular physical exercise level was objectified by using a German-language questionnaire [‘Bewegungs- und Sportsaktivitätsfragebogen’ (BSA-F)] [35]. To rate the level of regular physical activity and the regular physical exercise, the frequency and duration for each activity or exercise needed to be stated and was added up to a single outcome value (in minutes per week).
The time to complete both parts of the Trail-Making Test (TMT A&B) was used to probe the individual performance in visual search (TMT A) and cognitive flexibility (TMT B) [36, 37]. In addition, we calculate the time difference (TMT B-A) between TMT-B and TMT-A as measure of shifting ability [38].
To determine the handedness of the participant, the Edinburgh Handedness Inventory (EHI) [39] with a cut-off value of ± 50 was used (left hander: < − 50; ambidexter: between ≥ − 50 and ≤ + 50; right hander: > + 50) [40].
Handgrip strength was measured using a handhold dynamometer (DHD-1; Saehan®, South Korea) and following the recommendations provided in the Southampton protocol [41]. Accordingly, the participants were seated in a comfortable chair with their feet flat on the ground. The shoulder of the tested extremity was adducted and neutrally rotated. We advised the participants to flex the elbow of the tested extremity at 90° and maintain a neutral wrist position (i.e., thumb facing upward). The participants were asked to squeeze the hand as hard as they can for 3 s. Each participant performed three trials for each hand and after performing one trial, the hand was changed [41]. The maximal handgrip strength of the three trials of each extremity side was used for further analysis. To account for the influence of body composition, we normalized the maximal handgrip strength to the body mass index (BMI) of the participants by using following equation: normalized handgrip strength (NGS) = absolute handgrip strength (in kg)/BMI (in kg/m2) [42, 43].
Cognitive testing
The Sternberg task which assesses short-term working memory [44] was used in this study because previous publications showed that Sternberg task induces a robust activation of the prefrontal cortex [45–50]. At the beginning of the experiment, each participant was placed in a self-selected comfortable distance to the presentation screen (mean distance to the presentation screen: 67.14 cm; standard deviation: 9.86 cm). We used PsychoPy 2 to present the Sternberg task [51–53]. As shown in Fig. 1, at the beginning of each trial an array of seven letters (i.e., the target memory set) occurred for 1.5 s on the screen and was followed by a retention period with a white fixation cross for 4 s. Afterwards, a probe letter which was flanked by two interrogation marks was shown for no more than 2 s. We asked the subjects to maintain the target memory set over the retention period in mind. When the probe letter occurred, the participants were advised to press the right cursor button (if the presented letter was included in the target memory set) or the left button (if the presented letter was not included in the target memory set) as quickly and accurately as possible.
Fig. 1.

Schematic illustration of a trial of the modified Sternberg task. The trial started with a white fixation cross at the middle of a black screen (first picture: “ + ”) that was presented for a randomly varying period of time between 10 and 12 s. The fixation cross was followed by an encoding period which lasted for 1.5 s. During this period participants had to encode a string of seven letters (second picture: “DUVLASY”). After, a retention period of 4.0 s (third picture: “ + ”) a single probe letter flanked by two questions marks on each side was shown for a maximum duration of 2.0 s (fourth picture: “?? U ??”). At this point, participants were instructed to decide as fast as possible (within the response window of 2 s) whether the probe letter had been included in the encoding period or not. Thereafter, the next trial started with an intertrial interval of 10–12 s (fifth picture: “ + ”)
All participants used the index finger of the right hand to press the left cursor button and middle finger of the right hand to press the right cursor button. Furthermore, after a trial a rest period with a randomized time interval of 10 to 12 s, in which the participants looked at white fix a fixation cross, was included to diminish possible resonance effects [45, 54]. Each participant solved 24 trials and in the half of the trials the target memory set included the probe letter.
During Sternberg task, the behavioral performance for each trial (accuracy and reaction time) and cortical hemodynamics using functional near-infrared spectroscopy were recorded. We averaged accuracy and reaction time across all trials. Accuracy was expressed as accuracy score (percentage of correct answers). In addition, each participant was adequately familiarized with the Sternberg task and solved ten familiarization trials before recording cortical hemodynamics (mean accuracy score: 88.38%; standard deviation: 10.68%, mean reaction time: 1.00 s; standard deviation: 0.25 s).
During the entire duration of the Sternberg task, we measured heart rate signal using a heart rate watch and a chest strap (Polar watch V800® and chest strap H10®, Polar Electro Oy, Kempele, Finland). The heart rate signals were processed using “Kubios HRV” (Biosignal Analysis and Medical Imaging Group, University Kuopio, Finland; Version 3.0.0) [55, 56]. Artefact correction was performed for every participant separately in order to select the optimal threshold for artefact correction [56]. Possible artefacts were removed using a threshold-based filter algorithm which was set to the lowest correction level that cleans all artefacts but does not remove too many normal RR intervals [56]. In the current study, we used a low (35 s) or a medium threshold (0.25 s). Using these thresholds, all values that differ more than 0.25 s (or 0.35 s) from the average value were replaced with interpolated values estimated by a cubic spline interpolation [55–57]. After artefact correction, the HR time series was detrended by applying the smoothness-priors-based detrending approach (smoothing parameter, λ = 500) [55, 56]. For analyzing the frequency bands, the frequency ranges were selected as follows: very low frequency (VLF): 0–0.04 Hz, low frequency (LF): 0.04–0.15 Hz, and high frequency (HF): 0.15–0.4 Hz [55, 56, 58].
Functional near-infrared spectroscopy
fNIRS is a relatively new, non-invasive neuroimaging technique which is based on theory of neurovascular coupling and optical spectroscopy [54, 59, 60]. fNIRS enables the recording of changes in oxygenated hemoglobin (oxyHb) and deoxygenated hemoglobin (deoxyHb) which allows the “indirect” assessment of cortical activation. A higher cortical activation is commonly indicated by an increase on oxyHb and a decrease in deoxyHb [54, 60]. More detailed information on fNIRS can be found in the referenced literature [54, 59–66].
In the current study, we recorded changes in cortical hemodynamics at a frequency of 7.81 Hz by using a portable continuous wave fNIRS system (NIRSport™, NIRx Medical Technologies, Glen Head, New York, USA). Our fNIRS system consists of eight light sources (emitting light at wavelengths of 760 and 850 nm), eight light detectors, and a short-distance detector bundle. The fNIRS optodes were placed according to the 10–20 EEG system [67] using a standardized cap (EasyCap GmbH, Herrsching, Germany). As shown in Fig. 2, our fNIRS setup consists of 22 long source-detector separation channels (LSC; ~ 27 mm to 45 mm) and 8 short source-detector separation channels (SSC; ~ 8 mm). The LSC were used to measure changes in cortical hemodynamics while SSC were used to account for changes in extracerebral blood flow (see “fNIRS data processing”). To assign fNIRS-signals from LSC’s to specific brain regions, we performed a virtual and probabilistic spatial registration using the software fNIRS Optodes’ Location Decider (fOLD) [68] and the Broadmann atlas (BA) [69]. Based on this probabilistic spatial registration, our setup covered the following cortical regions: right dorsolateral prefrontal cortex (BA 9; Channel 1, 5, and 20), right dorsolateral prefrontal cortex (BA 46; Channel 6), left dorsolateral prefrontal cortex (BA 9; Channel 15, 19, and 22), left dorsolateral prefrontal cortex (BA46; Channel 14), right frontopolar area (BA 10; Channel 4, 7, 8, and 9), left frontopolar area (BA 10; Channel 11, 12, 13, and 16), right pars triangularis of Broca’s area (BA 45; Channel 2 and 3), left pars triangularis of Broca’s area (BA 45; Channel 17 and 18), middle frontopolar area (BA 10; Channel 10), and middle dorsolateral prefrontal cortex (BA 9; Channel 21). More detailed information on spatial registration is provided in Additional file 1: Table S1.
Fig. 2.
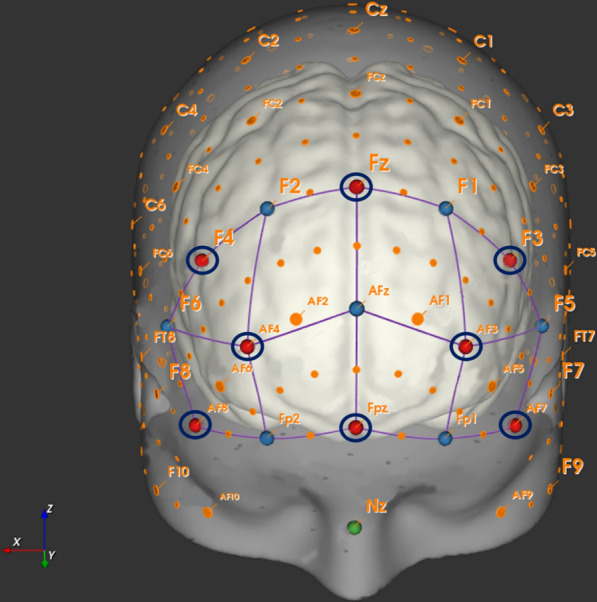
Schematic illustration of the channel setup. The ‘red dots’ represent sources and the ‘blue dots’ represent detectors. A ‘dark blue circle’ around a detector indicates the position of a short-separation channel (SSC; 8 mm). Channels in ‘purple’ are combinations of distinct sources and detectors. The corresponding EEG-positions and the long-separation channel distance (LSC) between sources and detectors result in the following recorded measurement channels: Channel 1 (F4-F2; LSC: 30 mm), Channel 2 (F4-F6; LSC: 30 mm), Channel 3 (AF8-F6; LSC: 33 mm), Channel 4 (AF8-Fp2; LSC: 30 mm), Channel 5 (AF4-F2; LSC: 44 mm), Channel 6 (AF4-F6; LSC: 45 mm), Channel 7 (AF4-Fp2; LSC: 28 mm), Channel 8 (AF4-Afz; LSC: 36 mm), Channel 9 (Fpz-Fp2; LSC: 31 mm), Channel 10 (Fpz-AFz; LSC: 40 mm), Channel 11 (Fpz-Fp1; LSC: 30 mm), Channel 12 (AF3-AFz; LSC: 36 mm), Channel 13 (AF3-Fp1; LSC: 27 mm), Channel 14 (AF3-F5; LSC: 44 mm), Channel 15 (AF3-F1; LSC: 44 mm), Channel 16 (AF7-Fp1; LSC: 30 mm), Channel 17 (AF7-F5; LSC: 33 mm), Channel 18 (F3-F5; LSC: 29 mm), Channel 19 (F3-F1; LSC: 29 mm), Channel 20 (Fz-F2; 29 mm), Channel 21 (Fz-F2; LSC: 40 mm), and Channel 22 (Fz-F1; LSC: 29 mm)
fNIRS data processing
The fNIRS data were preprocessed using the software program Homer 2 (version 2.8) [70] and followed current data processing recommendations [54, 71]. At first, we used enPruneChannels function with a signal-to-noise threshold (SNR thres) of 10 to exclude to noisy channels [coefficient of variation (CV) > 10] from further analyses. In this study 1.5% of channels were excluded because they were considered as to noisy which were on average 0.36 channels per individual. Then, the raw light intensity signals were converted into changes in optical density (using hmrIntensity2OD function) [70]. Afterwards, the fNIRS time series were corrected for motion artefacts [59, 72]. For this purpose, we used the hmrMotionCorrectWavelet filtering function implemented in Homer 2 which is based on the algorithm described by Molavi and Dumont [73]. The threshold of the wavelet filter was set to 1.219 times of interquartile [74–76] that corresponds to the recommend α of 0.1 [72, 73, 77]. Following the motion artefact correction, we used a bandpass filter (hmrBandpassFilt function) with a high-pass cut-off frequency of 0.01 Hz to account for instrumental noise and low frequency drifts and a low-pass cut-off frequency of 0.09 Hz to account for cardiac oscillations and Mayer-waves [71]. Subsequently, preprocessed optical density data of both wavelengths were converted via the modified Beer–Lambert law (MBLL) into concentration changes of oxygenated hemoglobin (oxyHb) and deoxygenated hemoglobin (deoxyHb) by using the hmrOD2Conc function. The differential pathlength factor which is required in the MBLL was calculated for each individual participant using the equation provided by Scholkmann and Wolf [78].
Afterwards, we used the hmrDeconvHRRF_DriftSS function to account for the confounding effects of extracerebral (superficial) blood flow. This function is based on the assumptions that SSC record changes in extracerebral blood flow whereas LSC measures both change in superficial blood flow and cortical brain tissue [54, 79]. Hence, the signals of SSC can be used to regress out signals from extracerebral layers from LSC which result in an improved data quality and help to avoid “false positives” [80]. In the hmrDeconvHRRF_DriftSS function, the hemodynamic response function (HRF) is estimated by using a general linear model approach (GLM) that uses ordinary least squares [81]. As done in several previous publications [82–90], the HRF was modeled with a consecutive sequence of Gaussian functions with a standard deviation of 0.5 s and their means separated by 0.5 s over a specific regression time (used parameters in Homer 2: trange − 2.0 to 20; glmSolveMethod 1; idxBasis 1; paramsBasis 0.5 and 0.5). To account for baseline drift, it was modeled using a third order polynomial fit [84, 89, 91]. Furthermore, we used the nearest SSC as static estimator for regression because the location of the SSC impacts the performance of the regression analysis substantially [92]. Following the SSC regression, we used the hmrBlockAvg function to perform a baseline correction and to calculate the block averages for oxyHb and deoxyHb changes over all trials and for each measurement channel (i.e., each LSC). In order to baseline correct our data, we used a time period of 2 s prior to stimulus onset which is a commonly utilized time period in event-related fNIRS studies (for review see [54]). The entire period of the stimulus phase was used to calculate baseline-corrected block averages (i.e., 0 to 20 s after stimulus onset).
After pre-processing with Homer 2, the baseline-corrected block averages of the time series of oxyHb and deoxyHb were exported and imported into Matlab (The Mathworks®, Natick, Massachusetts, USA). Using the exported block averages and an in-house Matlab software, we calculated the median values of oxyHb and deoxyHb for each fNIRS measurement channel across a period of 0 to 16 s after trial onset. Median values were used for further statistical analyses because they are deemed to be less influenced by potential outliers [54, 59].
Statistical analysis
The statistical analysis was performed using IBM SPSS (Statistical Package for Social Science, Version 26, Chicago, Illinois, USA). To investigate whether cortical hemodynamics (e.g., oxyHb and deoxyHb) mediate the relationship between measures of handgrip strength and measures of cognitive performance (i.e., reaction time in Sternberg task), a mediation analysis was conducted. Thereto, we assessed in the first step, normal distribution using the Shapiro–Wilk test. As the most parameters (especially fNIRS parameters) were not normally distributed, we used non-parametric methods in the subsequent statistical analysis. In the second step, we examined the bivariate relationships (i) between measures of handgrip strength and measures of cognitive performance, (ii) between measures of cognitive performance and measures of cortical hemodynamics, and (iii) between measures of cortical hemodynamics and measures of handgrip strength by calculating non-parametric partial correlations (rp) controlling for age and gender [93, 94]. The correlations were rated as follows: 0 to 0.19: no correlation; 0.2 to 0.39: low correlation, 0.40 to 0.59: moderate correlation; 0.60 to 0.79: moderately high correlation; ≥ 0.80: high correlation [95, 96]. The level of statistical significance was set to α = 0.05 in correlation analysis.
In the third step, we performed a robust mediation analysis using the SPSS extension bundle “robmed” [97] and the calculated mediation model includes a three-output analyses process (Paths A–C′). In this regard, the associations between (i) the independent variable (measures of handgrip strength) and dependent variable (measures of cognitive performance)—Path C, (ii) the independent variable (measures of handgrip strength) and the mediator (measures of cortical hemodynamics)—Path A, and (iii) the mediator (measures of cortical hemodynamics) and the dependent variable (measures of cognitive performance)—Path B, were computed. Afterwards, the direct effect (Path C′) of the independent variable (e.g., measures of handgrip strength) on the dependent variable (e.g., measures of cognitive performance) was estimated by controlling for the mediator (measures of cortical hemodynamics) and the indirect effect (Path AB). To calculate the direct and indirect effects, we computed a robust mediation model [97] with bias-corrected bootstrap 95% confidence intervals (CIs) based on 5000 bootstrap resamples and entered the covariates age and gender [93, 94]. In accordance with the literature, a significant mediation was assumed if the CIs in Path AB did not include zero whereas a partial mediation was indicated if the CIs of Path C′ cross zero [98–100]. Please note a mediation analysis was only computed if two phenomena appeared: firstly, if the non-parametric partial correlation analysis (see “second step” and Tables 2 and 3) exhibited that there was a significant correlation between mediator and independent variable (or dependent variable) and secondly, if there was a correlation of at least rp ≥ 0.2 between mediator and dependent variable (or independent variable). We selected a threshold of rp ≥ 0.2 because this is deemed to be the minimum effect size that represents a “practical” significant effect [101].
Table 2.
Overview of the regional cortical changes in the concentrations of oxygenated hemoglobin (oxyHb) measured during the Sternberg task (ST) and their correlations with measures of handgrip strength and cognitive performance
| Channels | Median ± IQR | Non-parametric partial correlations | ||
|---|---|---|---|---|
| OxyHb (µmol/L) | AHS (left/right) | NHS (left/right) | Reaction time in ST/correct answers in ST | |
| 1 (rt. DLPFC; BA9) | 0.017 ± 0.028 | rp (35) = 0.179; p = 0.288/rp (35) = 0.241; p = 0.151 | rp (35) = 0.145; p = 0.391/rp (35) = 0.190; p = 0.260 | rp (35) = − 0.417; p = 0.010/rp (35) = 0.401; p = 0.014 |
| 2 (rt. Broca; BA 45) | 0.013 ± 0.058 | rp (35) = 0.287; p = 0.085/rp (35) = 0.161; p = 0.340 | rp (35) = 0.210; p = 0.212/rp (35) = 0.134; p = 0.430 | rp (35) = − 0.426; p = 0.009/rp (35) = 0.206; p = 0.222 |
| 3 (rt. Broca; BA 45) | 0.017 ± 0.053 | rp (34) = 0.021; p = 0.905/rp (34) = 0.075; p = 0.663 | rp (34) = 0.036; p = 0.833/rp (34) = 0.108; p = 0.530 | rp (34) = − 0.388; p = 0.019/rp (34) = 0.241; p = 0.156 |
| 4 (rt. FPA; BA 10) | − 0.018 ± 0.073 | rp (35) = − 0.021; p = 0.903/rp (35) = − 0.007; p = 0.968 | rp (35) = − 0.094; p = 0.581/rp (35) = − 0.061; p = 0.719 | rp (35) = − 0.170; p = 0.316/rp (35) = 0.249; p = 0.138 |
| 5 (rt. DLPFC; BA 9) | 0.016 ± 0.052 | rp (32) = 0.359; p = 0.037/rp (32) = 0.257; p = 0.143 | rp (32) = 0.225; p = 0.202/rp (32) = 0.147; p = 0.407 | rp (32) = − 0.404; p = 0.018/rp (32) = 0.177; p = 0.317 |
| 6 (rt. DLPFC; BA 46) | 0.021 ± 0.077 | rp (34) = 0.157; p = 0.360/rp (34) = 0.174; p = 0.310 | rp (34) = 0.087; p = 0.613/rp (34) = 0.161; p = 0.347 | rp (34) = − 0.431; p = 0.009/rp (34) = 0.227; p = 0.182 |
| 7 (rt. FPA; BA 10) | 0.012 ± 0.035 | rp (34) = 0.005; p = 0.979/rp (34) = 0.053; p = 0.759 | rp (34) = − 0.068; p = 0.692/rp (34) = 0.009; p = 0.958 | rp (34) = 0.091; p = 0.598/rp (34) = − 0.160; p = 0.351 |
| 8 (rt. FPA; BA 10) | 0.008 ± 0.049 | rp (35) = 0.142; p = 0.402/rp (35) = 0.128; p = 0.451 | rp (35) = 0.013; p = 0.940/rp (35) = 0.008; p = 0.964 | rp (35) = − 0.299; p = 0.072/rp (35) = 0.145; p = 0.391 |
| 9 (rt. FPA; BA 10) | − 0.037 ± 0.043 | rp (35) = 0.135; p = 0.427/rp (35) = 0.108; p = 0.524 | rp (35) = 0.120; p = 0.481/rp (35) = 0.116; p = 0.494 | rp (35) = − 0.091; p = 0.593/rp (35) = 0.221; p = 0.188 |
| 10 (md. FPA; BA 10) | − 0.004 ± 0.037 | rp (35) = 0.246; p = 0.143/rp (35) = 0.125; p = 0.460 | rp (35) = 0.273; p = 0.102/rp (35) = 0.152; p = 0.370 | rp (35) = − 0.518; p = 0.001/rp (35) = 0.173; p = 0.306 |
| 11 (lt. FPA; BA 10) | − 0.019 ± 0.056 | rp (35) = 0.102; p = 0.546/rp (35) = − 0.018; p = 0.915 | rp (35) = 0.093; p = 0.585/rp (35) = − 0.014; p = 0.934 | rp (35) = − 0.416; p = 0.010/rp (35) = 0.045; p = 0.793 |
| 12 (lt. FPA; BA 10) | 0.004 ± 0.049 | rp (35) = 0.295; p = 0.077/rp (35) = 0.141; p = 0.405 | rp (35) = 0.214; p = 0.205/rp (35) = 0.072; p = 0.672 | rp (35) = − 0.393; p = 0.016/rp (35) = 0.103; p = 0.545 |
| 13 (lt. FPA; BA 10) | − 0.003 ± 0.052 | rp (34) = 0.244; p = 0.152/rp (34) = 0.102; p = 0.555 | rp (34) = 0.152; p = 0.375/rp (34) = 0.017; p = 0.923 | rp (35) = − 0.099; p = 0.566/rp (35) = − 0.088; p = 0.610 |
| 14 (lt. DLPFC; BA 46) | 0.018 ± 0.057 | rp (34) = 0.088; p = 0.609/rp (34) = 0.066; p = 0.704 | rp (34) = 0.048; p = 0.782/rp (34) = 0.088; p = 0.611 | rp (34) = − 0.118; p = 0.492/rp (34) = 0.207; p = 0.225 |
| 15 (lt. DLPFC; BA 9) | 0.002 ± 0.037 | rp (32) = 0.269; p = 0.125/rp (32) = 0.095; p = 0.593 | rp (32) = 0.242; p = 0.169/rp (32) = 0.060; p = 0.736 | rp (32) = − 0.459; p = 0.006/rp (32) = 0.202; p = 0.251 |
| 16 (lt. FPA; BA 10) | − 0.008 ± 0.063 | rp (35) = 0.115; p = 0.498/rp (35) = 0.167; p = 0.322 | rp (35) = 0.115; p = 0.498/rp (35) = 0.171; p = 0.311 | rp (35) = 0.000; p = 1.000/rp (35) = 0.122; p = 0.474 |
| 17 (lt. Broca; BA 45) | 0.019 ± 0.071 | rp (35) = 0.165; p = 0.329/rp (35) = 0.116; p = 0.493 | rp (35) = 0.165; p = 0.329/rp (35) = 0.173; p = 0.306 | rp (35) = − 0.230; p = 0.170/rp (35) = 0.133; p = 0.431 |
| 18 (lt. Broca; BA 45) | 0.013 ± 0.051 | rp (35) = 0.089; p = 0.601/rp (35) = 0.030; p = 0.860 | rp (35) = − 0.014; p = 0.936/rp (35) = 0.007; p = 0.970 | rp (35) = 0.017; p = 0.922/rp (35) = 0.033; p = 0.844 |
| 19 (lt. DLPFC; BA 9) | 0.014 ± 0.035 | rp (34) = 0.109; p = 0.527/rp (34) = 0.020; p = 0.908 | rp (34) = 0.021; p = 0.902/rp (34) = − 0.029; p = 0.868 | rp (34) = − 0.131; p = 0.445/rp (34) = 0.089; p = 0.606 |
| 20 (rt. DLPFC; BA 9) | 0.009 ± 0.031 | rp (35) = 0.241; p = 0.151/rp (35) = 0.288; p = 0.084 | rp (35) = 0.154; p = 0.362/rp (35) = 0.243; p = 0.147 | rp (35) = − 0.042; p = 0.806/rp (35) = 0.234; p = 0.164 |
| 21 (md. DLPFC; BA 9) | 0.003 ± 0.032 | rp (34) = 0. 358; p = 0.032/rp (34) = 0.230; p = 0.178 | rp (34) = 0.228; p = 0.181/rp (34) = 0.088; p = 0.612 | rp (34) = − 0.315; p = 0.061/rp (34) = 0.299; p = 0.076 |
| 22 (lt. DLPFC; BA 9) | 0.001 ± 0.029 | rp (35) = 0.110; p = 0.517/rp (35) = − 0.030; p = 0.860 | rp (35) = 0.092; p = 0.587/rp (35) = − 0.054; p = 0.752 | rp (35) = − 0.389; p = 0.017/rp (35) = 0.248; p = 0.139 |
On the left hand of the table, median ± interquartile range (IQR) of concentrations of oxyHb are displayed. On the right hand of the table, non-parametric correlations (controlled for age and gender) between oxyHb and absolute handgrip strength (AHS), normalized handgrip strength (NHS), reaction time and percentage of correct answers in the ST are shown. Significant correlations are presented in italic
BA broadman area, DLPFC dorsolateral prefrontal cortex, FPA frontopolar area, lt. left, md. middle, rp partial correlation controlling for age and gender, rt. right, ST Sternberg task
Table 3.
Overview of the regional cortical changes in the concentrations of deoxygenated hemoglobin (deoxyHb) measured during the Sternberg task (ST) and their correlations with measures of handgrip strength and cognitive performance
| Channels | Median ± IQR | Non-parametric partial correlations | ||
|---|---|---|---|---|
| DeoxyHb (µmol/L) | AHS (left/right) | NHS (left/right) | Reaction time in ST/correct answers in ST | |
| 1 (rt. DLPFC; BA9) | 0.001 ± 0.005 | rp (35) = − 0.197; p = 0.243/rp (35) = − 0.182; p = 0.280 | rp (35) = − 0.232; p = 0.167/rp (35) = − 0.245; p = 0.144 | rp (35) = 0.198; p = 0.240/rp (35) = − 0.276; p = 0.099 |
| 2 (rt. Broca; BA 45) | 0.000 ± 0.015 | rp (35) = − 0.299; p = 0.072/rp (35) = − 0.180; p = 0.286 | rp (35) = − 0.204; p = 0.225/rp (35) = − 0.133; p = 0.434 | rp (35) = 0.343; p = 0.038/rp (35) = − 0.142; p = 0.401 |
| 3 (rt. Broca; BA 45) | − 0.002 ± 0.011 | rs (34) = − 0.071; p = 0.680/rp (34) = − 0.203; p = 0.234 | rp (34) = − 0.088; p = 0.609/rp (34) = − 0.227; p = 0.183 | rp (34) = 0.262; p = 0.122/rp (35) = − 0.199; p = 0.245 |
| 4 (rt. FPA; BA 10) | 0.000 ± 0.023 | rp (35) = − 0.301; p = 0.070/rp (35) = − 0.191; p = 0.258 | rp (35) = − 0.294; p = 0.077/rp (35) = − 0.224; p = 0.182 | rp (34) = 0.172; p = 0.307/rp (35) = − 0.095; p = 0.574 |
| 5 (rt. DLPFC; BA 9) | 0.000 ± 0.015 | rp (32) = − 0.442; p = 0.009/rp (32) = − 0.385; p = 0.025 | rp (32) = − 0.454; p = 0.007/rp (32) = − 0.390; p = 0.023 | rp (32) = 0.441; p = 0.009/rp (32) = − 0.236; p = 0.179 |
| 6 (rt. DLPFC; BA 46) | − 0.006 ± 0.019 | rp (34) = − 0.040; p = 0.818/rp (34) = − 0.112; p = 0.514 | rp (34) = 0.005; p = 0.977/rp (34) = − 0.088; p = 0.610 | rp (34) = 0.459; p = 0.005/rp (34) = − 0.275; p = 0.105 |
| 7 (rt. FPA; BA 10) | 0.003 ± 0.012 | rp (34) = − 0.379; p = 0.023/rp (34) = − 0.420; p = 0.011 | rp (34) = − 0.339; p = 0.043/rp (34) = − 0.368; p = 0.027 | rp (34) = 0.306; p = 0.070/rp (34) = − 0.177; p = 0.300 |
| 8 (rt. FPA; BA 10) | 0.002 ± 0.013 | rp (35) = − 0.363; p = 0.027/rp (35) = − 0.429; p = 0.008 | rp (35) = − 0.347; p = 0.035/rp (35) = − 0.434; p = 0.007 | rp (35) = 0.150; p = 0.376/rp (35) = − 0.113; p = 0.504 |
| 9 (rt. FPA; BA 10) | 0.002 ± 0.014 | rp (35) = − 0.200; p = 0.234/rp (35) = − 0.199; p = 0.239 | rp (35) = − 0.252; p = 0.133/rp (35) = − 0.218; p = 0.194 | rp (35) = 0.244; p = 0.145/rp (35) = − 0.113; p = 0.507 |
| 10 (md. FPA; BA 10) | 0.001 ± 0.009 | rp (35) = − 0.340; p = 0.039/rp (35) = − 0.306; p = 0.066 | rp (35) = − 0.213; p = 0.205/rp (35) = − 0.188 p = 0.265 | rp (35) = 0.031; p = 0.856/rp (35) = 0.047; p = 0.781 |
| 11 (lt. FPA; BA 10) | 0.002 ± 0.012 | rp (35) = − 0.194; p = 0.251/rp (35) = − 0.132; p = 0.437 | rp (35) = − 0.072; p = 0.670/rp (35) = − 0.021; p = 0.904 | rp (35) = 0.164; p = 0.331/rp (35) = − 0.085; p = 0.618 |
| 12 (lt. FPA; BA 10) | 0.002 ± 0.010 | rp (35) = − 0.390; p = 0.017/rp (35) = − 0.264; p = 0.115 | rp (35) = − 0.263; p = 0.116/rp (35) = − 0.131; p = 0.438 | rp (35) = 0.147; p = 0.385/rp (35) = 0.048; p = 0.776 |
| 13 (lt. FPA; BA 10) | 0.002 ± 0.011 | rp (34) = − 0.436; p = 0.008/rp (34) = − 0.326; p = 0.052 | rp (34) = − 0.396; p = 0.017/rp (34) = − 0.252; p = 0.137 | rp (34) = − 0.163; p = 0.341/rp (34) = 0.018; p = 0.916 |
| 14 (lt. DLPFC; BA 46) | − 0.003 ± 0.025 | rp (34) = − 0.263; p = 0.122/rp (34) = − 0.270; p = 0.112 | rp (34) = − 0.240; p = 0.159/rp (34) = − 0.312; p = 0.064 | rp (34) = 0.101; p = 0.557/rp (34) = − 0.338; p = 0.043 |
| 15 (lt. DLPFC; BA 9) | 0.002 ± 0.017 | rp (32) = − 0.409; p = 0.016/rp (32) = − 0.326; p = 0.060 | rp (32) = − 0.493; p = 0.003/rp (32) = − 0.411; p = 0.016 | rp (32) = 0.127; p = 0.474/rp (32) = − 0.027; p = 0.879 |
| 16 (lt. FPA; BA 10) | 0.001 ± 0.021 | rp (35) = − 0.206; p = 0.222/rp (35) = − 0.207; p = 0.219 | rp (35) = − 0.097; p = 0.570/rp (35) = − 0.073; p = 0.667 | rp (35) = − 0.027; p = 0.872/rp (35) = 0.003; p = 0.986 |
| 17 (lt. Broca; BA 45) | − 0.003 ± 0.017 | rp (35) = − 0.151; p = 0.373/rp (35) = − 0.210; p = 0.213 | rp (35) = − 0.188; p = 0.264/rp (35) = − 0.244; p = 0.145 | rp (35) = 0.020; p = 0.905/rp (35) = − 0.021; p = 0.901 |
| 18 (lt. Broca; BA 45) | 0.002 ± 0.009 | rp (35) = 0.281; p = 0.092/rp (35) = 0.296; p = 0.075 | rp (35) = 0.293; p = 0.078/rp (35) = 0.263; p = 0.116 | rp (35) = − 0.055; p = 0.746/rp (35) = − 0.130; p = 0.445 |
| 19 (lt. DLPFC; BA 9) | 0.001 ± 0.008 | rp (34) = − 0.123; p = 0.474/rp (34) = − 0.181; p = 0.291 | rp (34) = − 0.080; p = 0.645/rp (34) = − 0.168; p = 0.327 | rp (34) = − 0.154; p = 0.371/rp (34) = 0.067; p = 0.698 |
| 20 (rt. DLPFC; BA 9) | 0.000 ± 0.011 | rp (35) = − 0.226; p = 0.179/rp (35) = − 0.277; p = 0.097 | rp (35) = − 0.185; p = 0.272/rp (35) = − 0.328; p = 0.048 | rp (35) = − 0.053; p = 0.756/rp (35) = − 0.022; p = 0.898 |
| 21 (md. DLPFC; BA 9) | 0.003 ± 0.010 | rp (34) = − 0.276; p = 0.103/rp (34) = − 0.230; p = 0.178 | rp (34) = − 0.315; p = 0.061/rp (34) = − 0.325; p = 0.053 | rp (34) = − 0.029; p = 0.869/rp (34) = − 0.113; p = 0.511 |
| 22 (lt. DLPFC; BA 9) | 0.002 ± 0.009 | rp (35) = − 0.155; p = 0.359/rp (35) = − 0.085; p = 0.618 | rp (35) = − 0.144; p = 0.395/rp (35) = − 0.103; p = 0.545 | rp (35) = − 0.073; p = 0.666/rp (35) = 0.003; p = 0.984 |
On the left hand of the table, median ± interquartile range (IQR) of concentrations of deoxyHb are displayed. On the right hand of the table, non-parametric partial correlations (controlled for age and gender) between deoxyHb and absolute handgrip strength (AHS), normalized handgrip strength (NHS), reaction time and percentage of correct answers in the ST are shown. Significant correlations are presented in italic
BA broadman area, DLPFC dorsolateral prefrontal cortex, FPA frontopolar area, lt. left, md. middle, rp partial correlation controlling for the influence of age and gender, rt. right, ST Sternberg task
Results
The general characteristics of the participants are shown in Table 1.
Table 1.
Median and interquartile range of the screening tests in the investigated sample
| Parameters | Median ± interquartile range |
|---|---|
| BDI-II (total score) | 3.0 ± 6.0 |
| Level of education (years) | 15.6 ± 2.4 |
| PSQI (total score) | 4.0 ± 2.0 |
| BSA (min per week) | PA: 236.5 ± 255.0/PE:292.5 ± 350.5 |
| TMT A (s) | 19.4 ± 6.3 |
| TMT B (s) | 42.9 ± 14.4 |
| TMT B-A (s) | 22.9 ± 11.4 |
| EHI (total score) | 83.3 ± 17.3 |
| Mean heart rate during ST (bpm) | 71.8 ± 20.2 |
| LF/HF ratio | 1.43 ± 1.51 |
| Left/Right AHS (kg) | 38.9 ± 26.2/44.1 ± 22.7 |
| Left/Right NHS (A.U.) | 1.67 ± 0.87/1.87 ± 0.78 |
| Reaction time in ST (s) | 0.94 ± 0.37 |
| Correct answers in ST (%) | 87.5 ± 12.5 |
AHS absolute handgrip strength, A.U. arbitrary unit, BDI-II Becks Depression Inventory II (a score of 13 and higher indicates depression [102, 103]), bpm beats per minute, BSA physical activity questionnaire, derived from German ‘Bewegungs- und Sportaktivitätsfragebogen’ (The World Health Organization recommends, at least, 150 min of moderate-intensity physical activity in a week for substantial health benefits [104]), EHI Edinburgh Handedness Inventory (a score of 50 and higher indicates right-handedness [40]), LF/HF ratio low-frequency/high-frequency ratio, kg kilogram, min minutes, NHS normalized handgrip strength (normalized to body-mass-index), PA physical activity, PE physical exercise, s seconds, PSQI Pittsburgh Sleep Quality Index (a score of 6 and higher indicates insomnia [105]), ST Sternberg task, TMT Trail Making Test
Correlations between measures of handgrip strength and cognitive performance in Sternberg task
The non-parametric partial correlations (controlling for the influence of age and gender) between left- and right-hand absolute handgrip strength (AHS) and reaction time in Sternberg task [left AHS: rp (35) = − 0.278; p = 0.096/right AHS: rp (35) = − 0.157; p = 0.354] and between left- and right-hand normalized handgrip strength (NHS) and reaction time in Sternberg task [left NHS: rp (35) = − 0.253; p = 0.131/right NHS: rp (35) = − 0.134; p = 0.431] did not reach statistical significance. Furthermore, we did also not observe statistically significant correlations between left- and right-hand absolute handgrip strength and correct answers in Sternberg task [left AHS: rp (35) = 0.012; p = 0.945/right AHS: rp (35) = − 0.045; p = 0.791] and between left- and right-hand normalized handgrip strength and correct answers in Sternberg task [left NHS: rp (35) = 0.122; p = 0.472/right AHS: rp (35) = 0.091; p = 0.592].
Correlations between measures of handgrip strength, measures of cognitive performance, and measures of cortical hemodynamics
The results of the partial correlation analysis (controlling for the influence of age and gender) between measures of handgrip strength, cognitive performance, and cortical hemodynamics are shown in Table 2 (oxyHb) and Table 3 (deoxyHb).
With regard to oxyHb, we observed a low positive correlation between the level of oxyHb in right dorsolateral prefrontal cortex (DLPFC) and middle DLPFC (Ch. 5 and Ch. 21) and left AHS. Furthermore, we found moderate negative correlations between level of oxyHb in specific channels of frontopolar area (FPA) and DLPFC and reaction time, and a moderate positive correlation between level of oxyHb in right DLPFC (Channel 1) and percentage of correct answers in Sternberg task (for a detailed overview see Table 2). Hence, better cognitive performance (e.g., faster reaction time and higher percentage of correct answers) is linked to higher levels of oxyHb (indicating, in general, a higher cortical activation) in distinct parts of the PFC.
With regard to deoxyHb, we observed low to moderate positive correlations between the level of deoxyHb in right FPA and left and right DLPFC and AHS and NHS (for a detailed overview see Table 3). Furthermore, we found a moderate positive correlation between level of deoxyHb in right Borca area (Channel 2) and right DLPFC (Channel 5 and 6) and reaction time in Sternberg task. In addition, we noticed a low and negative correlation between the level of deoxyHb in left DLPFC (Channel 14) and percentage of correct answers in Sternberg task. Collectively, better cognitive performance (e.g., faster reaction time and higher percentage of correct answers) is associated with lower levels of deoxyHb (indicating, in general, a higher cortical activation) in distinct parts of the PFC.
Mediation analysis
The results of the mediation analysis for the channels which meet our criteria to conduct mediation analysis (see ‘Statistical analysis’) are shown in Table 4.
Table 4.
Mediation models
| Independent variable (x)/mediator (m)/dependent variable (y) | Path A | Path B | Path AB (indirect effect) | Path C (direct effect) |
|---|---|---|---|---|
| oxyHb | ||||
| Right AHS/Ch. 1/CA in ST |
β = 0.000 (0.000); z (39) = 1.828; p = 0.068 |
β = 64.051 (52.713); z (39) = 1.498; p = 0.134 |
β = 0.025; CI [− 0.008 to 0.095] | β = − 0.003 (0.075); z (39) = − 0.234; p = 0.815 |
| Left AHS/Ch. 2/RT in ST |
β = 0.001 (0.000); z (39) = 2.189; p = 0.029 |
β = − 1.854 (0.636); z (39) = − 2.948; p = 0.003 |
β = − 0.002; CI [− 0.005 to 0.000] | β = − 0.004 (0.002); z (39) = − 2.175; p = 0.030 |
| Left NHS/Ch. 2/RT in ST |
β = 0.016 (0.011); z (39) = 1.537; p = 0.124 |
β = − 1.954 (0.710); z (39) = − 2.801; p = 0.005 |
β = − 0.032; CI [− 0.097 to 0.003] | β = − 0.082 (0.050); z (39) = − 1.862; p = 0.063 |
| Left AHS/Ch. 5/RT in ST |
β = 0.001 (0.000); z (36) = 1.694; p = 0.090 |
β = − 3.004 (1.158); z (36) = − 2.523; p = 0.012 |
β = − 0.002; CI [− 0.007 to 0.000] | β = − 0.002 (0.003); z (36) = − 0.680; p = 0.497 |
| Left NHS/Ch. 5/RT in ST |
β = 0.014 (0.011); z (36) = 1.271; p = 0.204 |
β = − 3.076 (1.056); z (36) = − 2.857; p = 0.004 |
β = − 0.042; CI [− 0.150 to 0.012] | β = − 0.038 (0.061); z (36) = − 0.661; p = 0.509 |
| Left AHS/Ch. 10/RT in ST |
β = 0.000 (0.000); z (39) = 1.315; p = 0.188 |
β = − 4.091 (1.362); z (39) = − 3.008; p = 0.003 |
β = − 0.002; CI [− 0.007 to 0.001] | β = − 0.003 (0.003); z (39) = − 1.230; p = 0.219 |
| Left NHS/Ch. 10/RT in ST |
β = 0.010 (0.010); z (39) = 1.237; p = 0.216 |
β = − 4.087 (1.290); z (39) = − 3.190; p = 0.001 |
β = − 0.041; CI [− 0.170 to 0.016] | β = − 0.062 (0.062); z (39) = − 0.998; p = 0.318 |
| Left AHS/Ch. 12/RT in ST |
β = 0.001 (0.000); z (39) = 1.445; p = 0.148 |
β = − 1.949 (1.757); z (39) = − 1.213; p = 0.225 |
β = − 0.001; CI [− 0.005 to 0.001] | β = − 0.004 (0.003); z (39) = − 1.157; p = 0.247 |
| Left NHS/Ch. 12/RT in ST |
β = 0.009 (0.009); z (39) = 0.661; p = 0.509 |
β = − 2.101 (1.747); z (39) = − 1.310; p = 0.190 |
β = − 0.018; CI [− 0.101 to 0.010] | β = − 0.075 (0.066); z (39) = − 1.211; p = 0.226 |
| Left AHS/Ch. 15/RT in ST |
β = 0.001 (0.000); z (36) = 1.557; p = 0.119 |
β = − 2.227 (1.656); z (36) = − 1.587; p = 0.112 |
β = − 0.002; CI [− 0.007 to 0.000] | β = − 0.002 (0.003); z (36) = − 0.533; p = 0.594 |
| Left NHS/Ch. 15/RT in ST |
β = 0.018 (0.009); z (36) = 1.761; p = 0.078 |
β = − 2.253 (1.592); z (36) = − 1.685; p = 0.092 |
β = − 0.041; CI [− 0.135 to 0.005] | β = − 0.040 (0.075); z (36) = − 0.553; p = 0.580 |
| Left AHS/Ch. 21/RT in ST |
β = 0.000 (0.000); z (38) = 1.758; p = 0.079 |
β = − 1.781 (1.357); z (38) = − 1.473; p = 0.141 |
β = − 0.001; CI [− 0.003 to 0.000] | β = − 0.004 (0.003); z (38) = − 1.483; p = 0.138 |
| Left NHS/Ch. 21/RT in ST |
β = 0.007 (0.006); z (38) = 0.987; p = 0.324 |
β = − 1.878 (1.461); z (38) = − 1.389; p = 0.165 |
β = − 0.013; CI [− 0.065 to 0.012] | β = − 0.082 (0.069); z (38) = − 1.285; p = 0.199 |
| deoxyHb | ||||
| Left AHS/Ch. 2/RT in ST |
β = 0.000 (0.000); z (39) = − 1.581; p = 0.114 |
β = 6.522 (5.036); z (39) = 1.562; p = 0.118 |
β = − 0.001; CI [− 0.006 to 0.000] | β = − 0.005 (0.002); z (39) = − 2.369; p = 0.018 |
| Left NHS/Ch. 2/RT in ST |
β = − 0.003 (0.003); z (39) = − 1.189; p = 0.235 |
β = 6.710 (6.091); z (39) = 1.362; p = 0.173 |
β = − 0.019; CI [− 0.134 to 0.010] | β = − 0.098 (0.049); z (39) = − 2.083; p = 0.037 |
| Left AHS/Ch. 5/RT in ST |
β = 0.000 (0.000); z (36) = − 1.944; p = 0.052 |
β = 6.349 (3.104); z (36) = 2.037; p = 0.042 |
β = − 0.002; CI [− 0.006 to 0.000] | β = − 0.002 (0.003); z (36) = − 0.662; p = 0.508 |
| Right AHS/Ch. 5/RT in ST |
β = 0.000 (0.000); z (36) = − 1.480; p = 0.139 |
β = 6.989 (2.621); z (36) = 2.689; p = 0.007 |
β = − 0.002; CI [− 0.006 to 0.000] | β = − 0.001 (0.003); z (36) = − 0.198; p = 0.843 |
| Left NHS/Ch. 5/RT in ST |
β = − 0.007 (0.005); z (36) = − 1.626; p = 0.104 |
β = 6.473 (3.060); z (36) = 2.183; p = 0.029 |
β = − 0.042; CI [− 0.169 to 0.011] | β = − 0.046 (0.031); z (36) = − 0.415; p = 0.678 |
| Right NHS/Ch. 5/RT in ST |
β = − 0.005 (0.005); z (36) = − 1.417; p = 0.156 |
β = 6.965 (2.587); z (36) = 2.788; p = 0.005 |
β = − 0.034; CI [− 0.147 to 0.009] | β = − 0.028 (0.064); z (36) = − 0.083; p = 0.934 |
| Left AHS/Ch. 5/CA in ST |
β = 0.000 (0.000); z (36) = − 1.922; p = 0.055 |
β = − 133.058 (117.670); z (36) = − 1.223; p = 0.222 |
β = 0.039; CI [− 0.022 to 0.198] | β = 0.001 (0.089); z (36) = − 0.202; p = 0.840 |
| Right AHS/Ch. 5/CA in ST |
β = 0.000 (0.000); z (36) = − 1.483; p = 0.138 |
β = − 136.131 (119.154); z (36) = − 1.262; p = 0.207 |
β = 0.030; CI [− 0.019 to 0.170] | β = − 0.006 (0.091); z (36) = − 0.410; p = 0.682 |
| Left NHS/Ch. 5/CA in ST |
β = − 0.007 (0.005); z (36) = − 1.609; p = 0.108 |
β = − 113.039 (115.465); z (36) = − 1.047; p = 0.295 |
β = 0.737; CI [− 0.752 to 4.501] | β = 0.912 (1.683); z (36) = 0.520; p = 0.603 |
| Right NHS/Ch. 5/CA in ST |
β = − 0.005 (0.005); z (36) = − 1.400; p = 0.161 |
β = − 117.697 (117.911); z (36) = − 1.064; p = 0.287 |
β = 0.568; CI [− 0.669 to 3.706] | β = 0.691 (1.649); z (36) = − 0.345; p = 0.730 |
| Left AHS/Ch. 7/RT in ST |
β = 0.000 (0.000); z (38) = − 2.180; p = 0.029 |
β = 4.306 (11.759); z (38) = 0.416; p = 0.677 |
β = − 0.001; CI [− 0.009 to 0.006] | β = − 0.005 (0.004); z (38) = − 1.147; p = 0.251 |
| Left NHS/Ch. 7/RT in ST |
β = − 0.005 (0.004); z (38) = − 1.841; p = 0.066 |
β = 5.213 (7.642); z (38) = 0.739; p = 0.460 |
β = − 0.026; CI [− 0.174 to 0.070] | β = − 0.091 (0.065); z (38) = − 1.507; p = 0.132 |
| Left AHS/Ch. 14/CA in ST |
β = 0.000 (0.000); z (38) = − 1.535; p = 0.125 |
β = − 160.626 (75.764); z (38) = − 2.060; p = 0.039 |
β = 0.065; CI [− 0.008 to 0.262] | β = 0.015 (0.072); z (38) = 0.237; p = 0.813 |
| Left NHS/Ch. 14/CA in ST |
β = − 0.007 (0.007); z (38) = − 1.327; p = 0.185 |
β = − 154.613 (75.744); z (38) = − 1.994; p = 0.046 |
β = 1.151; CI [− 0.384 to 5.134] | β = 0.945 (1.521); z (38) = 0.851; p = 0.395 |
Significant paths are presented in italic
AHS absolute handgrip strength, CA in ST percentage of correct answers in Sternberg task, Ch. channel, CI 95% confidence intervals, deoxyHb deoxygenated haemoglobin, NHS normalized handgrip strength (normalized to body-mass-index), RT reaction time in Sternberg task, ST Sternberg task
Regarding Path A, we found that left AHS significantly predict [β = 0.001 (0.000); z (39) = 2.189; p = 0.029] the amplitude of oxyHb in Channel 2 (right Broca; BA 45) and that left AHS significantly predict [β = 0.000 (0.000); z (38) = − 2.180; p = 0.029] the amplitude of deoxyHb in Channel 7 (right FPA; BA 10), although the beta coefficient are very small (i.e., tending towards zero). As shown in Table 4, all other regressions of Path A did not reach statistical significance (p ≥ 0.05).
Regarding the B path, we observed that level of oxyHb in Channel 2 (right Broca; BA 45), Channel 5 (right DLPFC; BA 9), and Channel 10 (middle FPA; BA 10) significantly predict reaction time in Sternberg task (for detailed overview see Table 4). Furthermore, the level of deoxyHb in Channel 5 (right DLPFC; BA 9) predict the reaction time in Sternberg task, whereas level of deoxyHb in Channel 14 (left DLPFC; BA 46) predict the percentage of correct answers in Sternberg task. The other regressions of Path B, which are shown in Table 4, did not reach statistical significance (p ≥ 0.05).
Regarding path AB and C, we found a significant direct effect of left AHS on reaction time in Sternberg task [β = − 0.004 (0.002); z (39) = − 2.175; p = 0.030; oxyHb—Channel 2], although the beta coefficient is very small. However, as the 95% CI for the indirect path included zero, a full mediation effect of the level of oxyHb of Channel 2 (right Broca; BA 45) could not be assumed. Furthermore, we observed a statistically significant direct effect of left AHS [β = − 0.005 (0.002); z (39) = − 2.369; p = 0.018; deoxyHb—Channel 2] and left NHS [β = − 0.098 (0.049); z (39) = − 2.083; p = 0.037; deoxyHb—Channel 2] on reaction time in Sternberg task, but with very small beta coefficients. A full mediation effect of deoxyHb of Channel 2 (right Broca; BA 45) could not be assumed because the 95% CI crossed zero. No other direct or indirect effects were observed to be statistically significant (for detailed overview see Table 4). Taken together, neither oxyHb nor deoxyHb can be considered significant mediators of the relationship between measures of handgrip strength and cognitive performance.
Discussion
The current study investigated the relationship between measures of handgrip strength, cognitive performance, and cortical hemodynamics. Thereto, we assessed handgrip strength via a handheld dynamometer and recorded cortical hemodynamics during a standardized cognitive test (Sternberg task) using fNIRS.
We observed that a higher cortical activation (objectified by higher level of oxyHb and lower levels of deoxyHb) of distinct parts of the PFC (e.g., FPA and DLPFC; see Tables 2 and 3) is associated with better cognitive performance. This finding is in accordance with the literature reporting that, at least in older adults, a higher level of oxyHb in the PFC during the cognitive testing is associated with better cognitive performance [106]. In this regard, it was also observed that after an acute bout of physical exercise [107–110] and during physical exercise [111], higher levels of oxyHb in distinct parts the PFC (e.g., FPA and DLPFC) are linked to better cognitive performance. In line with these previous observations, our findings buttress the assumption of a positive neurobiobehavioural relationship between cortical hemodynamics and cognitive performance.
Furthermore, we noticed that a higher level of handgrip strength is linked to a higher level of cortical activation (objectified by higher level of oxyHb and lower levels of deoxyHb) in distinct parts of the PFC (see Tables 2 and 3). In the literature, it was observed that a higher level of cardiorespiratory fitness is positively correlated with the magnitude of the oxyHb in the PFC in older adults [112] and negatively correlated with magnitude of deoxyHb in right and left PFC in younger adults [113]. Consequently, our finding supports the general notion that a certain level of muscular strength (e.g., achieved by a regular resistance training) is beneficial for brain health (e.g., cortical hemodynamics) in younger adults [1, 2]. Whether a training-induced increase in (handgrip) strength of younger adults can improve brain health remains speculative because the majority of the available studies in this field of research has focused on older adults [1–3]. By saying that, there is also some evidence available suggesting that training interventions have a limited ability to change measures of handgrip strength in adults [114, 115] although this finding is not universal [116]. Moreover, it is hypothesized that baseline values of (handgrip) strength (e.g., obtained prior to a resistance training) might be a more appropriate indicator regarding health-related outcomes as compared to training-induced changes [117, 118]. Hence, the practical implications of our findings are currently not fully clear which, in turn, calls for further research broaden our knowledge in this direction.
We did not find statistical indices providing compelling evidence that in our cohort of younger adults measures of cortical hemodynamics mediate the relationship between handgrip strength and cognitive performance (see Table 4). The absence of a mediation effect could be related to the absence of a significant correlation between measures of handgrip strength and cognitive performance. The lack of such a correlation contradicts the findings of a previous study [26]. Presumably, these contrary findings are related to the different cognitive tests which have been used. In the study of Choudhary et al. [26], a simple reaction time task was employed whereas we have probed short-term working memory performance with the Sternberg task [44, 45] which is well-established in the field of exercise-cognition science [119–124]. Hence, our findings suggest that handgrip strength is associated with measures of cortical hemodynamics, but that this relationship might not strictly culminate in a superior cognitive performance, at least in our cohort of younger adults. In turn, the absence of a relationship between level of handgrip strength and cognitive functioning suggests that in younger adults, there might be other factors than the level of handgrip strength being important for superior cognitive performance.
Given that previous studies have reported that cortical hemodynamics (e.g., level of oxyHb) are a significant mediator of the relationship between cardiorespiratory fitness and cognition in older adults [30–32], it seems to be promising to investigate if measures of cortical hemodynamics mediate the relationship between handgrip strength and cognitive performance in a cohort of older individuals. This idea is supported by the findings suggesting an association between higher levels of handgrip strength and lesser cognitive decline in older age [12–18]. In this regard, it is also recommended that future studies should aim to assess further fitness dimensions (e.g., muscular fitness, cardiorespiratory fitness, and motor fitness) because it was observed that changes in different fitness dimensions influence the brain differently [125–127].
Limitations
Despite our presented findings are interesting, this study has limitations which warrant further discussion. Firstly, even if we have account for the confounding influence of superficial blood flow by a short-separation channel regression, it is recommended that future studies should consider to quantify additional physiological parameters (e.g., blood pressure, respiration rate, skin conductance) to assess the influence of systemic physiological changes more comprehensively (also referred to as ‘systemic physiological augmented fNIRS’ [128–133]) which, in turn, can reduce the risk of ‘false positive’ findings in fNIRS studies [80]. Secondly, although the sample size in the current study is in the range of comparable investigations [30], it is relatively small. In this context, it is also important to acknowledge that our findings are not generalizable because we only included young right-handed individuals in order to avoid laterality effects. Thirdly, we did not perform multiple comparison adjustments. However, there is an ongoing discussion about when and how it would be necessary to adjust for multiple comparisons [134–136] and it is stated that in exploratory studies, multiple comparison adjustments are not strictly required [135]. Fourthly, as the findings of our cross-sectional study are based on correlational analyses, it is not possible to derive strong (causal) conclusions. Cognizant of these limitations, further cross-sectional and interventional studies with a larger sample size are necessary to confirm (or rebut) our findings and to investigate whether those are generalizable to other cohorts (e.g., older adults without and with cognitive impairments).
Conclusion
In summary, our findings show promising evidence for a positive neurobehavioral relationship between cortical hemodynamics and cognitive performance. Moreover, we complement the existing literature by adding that in younger adults higher levels of handgrip strength are linked to more pronounced cortical hemodynamics which imply that muscular strength influences brain health positively. However, our work also showed that in younger adults such a positive effect on a parameter of brain health does not necessarily benefit cognitive performance as we did not find convincing evidence for a relationship between handgrip strength and cognitive performance or that cortical hemodynamics mediate this relationship. Considering that such relationships might change as function of age and disease, further research should aim to investigate whether our findings are also generalizable to different cohorts (e.g., older adults) and whether different fitness dimensions influence cognitive performance and cortical hemodynamics differently.
Supplementary Information
Additional file 1: Table S1. Detailed overview of the probe placement which shows the exact position of the sources and detectors in the 10–20 EEG system, the MNI coordinates (X, Y, Z), the corresponding anatomical landmarks (e.g., dorsolateral prefrontal cortex) and the distance between sources and detectors. Please note that this output was generated by using the fOLD-software [68]
Acknowledgements
We would like to thank all volunteers who have participated in this study.
Abbreviations
- AHS
Absolute handgrip strength
- A.U.
Arbitrary unit
- BA
Broadman area
- bpm
Beats per minute
- BDI-II
Becks Depression Inventory II
- BMI
Body mass index
- BSA-F
“Bewegungs- und Sportaktivitätsfragebogen”
- CA
Correct answers
- Ch.
Channel
- CI
Confidence interval
- cm
Centimeter
- CRF
Cardiorespiratory fitness level
- CV
Coefficient of variation
- deoxyHb
Deoxygenated hemoglobin
- DLPFC
Dorsolateral prefrontal cortex
- EEG
Electroencephalography
- EHI
Edinburgh Handedness Inventory
- fNIRS
Functional near-infrared spectroscopy
- fOLD
FNIRS Optodes’ Location Decider
- FPA
Frontopolar area
- GLM
General linear model
- HF
High frequency
- HRF
Hemodynamic response function
- IQR
Interquartile range
- kg
Kilogram
- LF
Low frequency
- LSC
Long-separation channel
- lt.
Left
- MBLL
Modified Beer–Lambert law
- md.
Middle
- mm
Millimeter
- NHS
Normalized handgrip strength
- oxyHb
Oxygenated hemoglobin
- PA
Physical activity
- PE
Physical exercise
- PFC
Prefrontal cortex
- PSQI
Pittsburgh Sleep Quality Index
- rp
Partial correlation coefficient
- RT
Reaction time
- s
Seconds
- SSC
Short-separation channels
- ST
Sternberg task
- TMT
Trail Making Test
- VLF
Very low frequency
Maximal oxygen uptake
Authors’ contributions
Conceptualization: FH; methodology: FH; software: FH and TB; validation: FH and TB; formal analysis: FH; investigation; FH and TB; resources: NGM and LS; data curation: FH and TB; writing—original draft: FH; writing—review and editing: FH, TB, AT, DH, NGM, and LS; visualization: FH; supervision: NGM and LS; project administration: FH and TB. All authors read and approved the final manuscript.
Funding
Open Access funding enabled and organized by Projekt DEAL.
Availability of data and materials
The public sharing of the data from this trial has been restricted by the local Research Ethics Committee in order to protect participants’ privacy. Data are therefore only available on reasonable request from the corresponding author.
Ethics approval and consent to participate
The study was approved by the local ethics committee of the Medical Faculty of the Otto von Guericke University Magdeburg (181/18) and it was in accordance with the Declaration of Helsinki (1964). All participants were informed about the study procedures and provided written informed consent to participate.
Consent for publication
Not applicable.
Competing interests
The authors declare that they have no competing interests.
Footnotes
Publisher's Note
Springer Nature remains neutral with regard to jurisdictional claims in published maps and institutional affiliations.
Notger G. Müller and Lutz Schega share the senior authorship
Supplementary Information
The online version contains supplementary material available at 10.1186/s12868-021-00615-6.
References
- 1.Herold F, Törpel A, Schega L, Müller NG. Functional and/or structural brain changes in response to resistance exercises and resistance training lead to cognitive improvements—a systematic review. Eur Rev Aging Phys Act. 2019;16:1676. doi: 10.1186/s11556-019-0217-2. [DOI] [PMC free article] [PubMed] [Google Scholar]
- 2.Marston KJ, Brown BM, Rainey-Smith SR, Peiffer JJ. Resistance exercise-induced responses in physiological factors linked with cognitive health. J Alzheimers Dis. 2019 doi: 10.3233/JAD-181079. [DOI] [PubMed] [Google Scholar]
- 3.Landrigan J-F, Bell T, Crowe M, Clay OJ, Mirman D. Lifting cognition: a meta-analysis of effects of resistance exercise on cognition. Psychol Res. 2019 doi: 10.1007/s00426-019-01145-x. [DOI] [PubMed] [Google Scholar]
- 4.Soga K, Masaki H, Gerber M, Ludyga S. Acute and long-term effects of resistance training on executive function. J Cogn Enhanc. 2018;56:729. doi: 10.1007/s41465-018-0079-y. [DOI] [Google Scholar]
- 5.McGrath R, Johnson N, Klawitter L, Mahoney S, Trautman K, Carlson C, et al. What are the association patterns between handgrip strength and adverse health conditions? A topical review. SAGE Open Med. 2020;8:2050312120910358. doi: 10.1177/2050312120910358. [DOI] [PMC free article] [PubMed] [Google Scholar]
- 6.McGrath RP, Kraemer WJ, Snih SA, Peterson MD. Handgrip strength and health in aging adults. Sports Med. 2018 doi: 10.1007/s40279-018-0952-y. [DOI] [PubMed] [Google Scholar]
- 7.Soysal P, Hurst C, Demurtas J, Firth J, Howden R, Yang L, et al. Handgrip strength and health outcomes: umbrella review of systematic reviews with meta-analyses of observational studies. J Sport Health Sci. 2020 doi: 10.1016/j.jshs.2020.06.009. [DOI] [PMC free article] [PubMed] [Google Scholar]
- 8.Bohannon RW. Grip strength: an indispensable biomarker for older adults. CIA. 2019;14:1681–1691. doi: 10.2147/CIA.S194543. [DOI] [PMC free article] [PubMed] [Google Scholar]
- 9.Carson RG. Get a grip: individual variations in grip strength are a marker of brain health. Neurobiol Aging. 2018;71:189–222. doi: 10.1016/j.neurobiolaging.2018.07.023. [DOI] [PubMed] [Google Scholar]
- 10.Fritz NE, McCarthy CJ, Adamo DE. Handgrip strength as a means of monitoring progression of cognitive decline—a scoping review. Ageing Res Rev. 2017;35:112–123. doi: 10.1016/j.arr.2017.01.004. [DOI] [PubMed] [Google Scholar]
- 11.Shaughnessy KA, Hackney KJ, Clark BC, Kraemer WJ, Terbizan DJ, Bailey RR, McGrath R. A narrative review of handgrip strength and cognitive functioning: bringing a new characteristic to muscle memory. J Alzheimers Dis. 2020 doi: 10.3233/JAD-190856. [DOI] [PMC free article] [PubMed] [Google Scholar]
- 12.Alfaro-Acha A, Al Snih S, Raji MA, Kuo Y-F, Markides KS, Ottenbacher KJ. Handgrip strength and cognitive decline in older Mexican Americans. J Gerontol Ser A Biol Sci Med Sci. 2006;61:859–865. doi: 10.1093/gerona/61.8.859. [DOI] [PMC free article] [PubMed] [Google Scholar]
- 13.McGrath R, Robinson-Lane SG, Cook S, Clark BC, Herrmann S, O’Connor ML, Hackney KJ. Handgrip strength is associated with poorer cognitive functioning in aging Americans. J Alzheimers Dis. 2019 doi: 10.3233/JAD-190042. [DOI] [PMC free article] [PubMed] [Google Scholar]
- 14.Sternäng O, Reynolds CA, Finkel D, Ernsth-Bravell M, Pedersen NL, Dahl Aslan AK. Grip strength and cognitive abilities: associations in old age. J Gerontol B Psychol Sci Soc Sci. 2016;71:841–848. doi: 10.1093/geronb/gbv017. [DOI] [PMC free article] [PubMed] [Google Scholar]
- 15.McGrath R, Vincent BM, Hackney KJ, Robinson-Lane SG, Downer B, Clark BC. The longitudinal associations of handgrip strength and cognitive function in aging Americans. J Am Med Dir Assoc. 2019 doi: 10.1016/j.jamda.2019.08.032. [DOI] [PMC free article] [PubMed] [Google Scholar]
- 16.Chou M-Y, Nishita Y, Nakagawa T, Tange C, Tomida M, Shimokata H, et al. Role of gait speed and grip strength in predicting 10-year cognitive decline among community-dwelling older people. BMC Geriatr. 2019;19:186. doi: 10.1186/s12877-019-1199-7. [DOI] [PMC free article] [PubMed] [Google Scholar]
- 17.Kim KH, Park SK, Lee DR, Lee J. The relationship between handgrip strength and cognitive function in elderly Koreans over 8 years: a prospective population-based study using Korean longitudinal study of ageing. Korean J Fam Med. 2019;40:9–15. doi: 10.4082/kjfm.17.0074. [DOI] [PMC free article] [PubMed] [Google Scholar]
- 18.Viscogliosi G, Di Bernardo MG, Ettorre E, Chiriac IM. Handgrip strength predicts longitudinal changes in clock drawing test performance. An observational study in a sample of older non-demented adults. J Nutr Health Aging. 2017;21:593–596. doi: 10.1007/s12603-016-0816-9. [DOI] [PubMed] [Google Scholar]
- 19.McGrath R, Cawthon PM, Cesari M, Al Snih S, Clark BC. Handgrip strength asymmetry and weakness are associated with lower cognitive function: a panel study. J Am Geriatr Soc. 2020 doi: 10.1111/jgs.16556. [DOI] [PubMed] [Google Scholar]
- 20.Firth J, Firth JA, Stubbs B, Vancampfort D, Schuch FB, Hallgren M, et al. Association between muscular strength and cognition in people with major depression or bipolar disorder and healthy controls. JAMA Psychiatry. 2018 doi: 10.1001/jamapsychiatry.2018.0503. [DOI] [PMC free article] [PubMed] [Google Scholar]
- 21.Firth J, Stubbs B, Vancampfort D, Firth JA, Large M, Rosenbaum S, et al. Grip strength is associated with cognitive performance in schizophrenia and the general population: a UK biobank study of 476559 participants. Schizophr Bull. 2018;44:728–736. doi: 10.1093/schbul/sby034. [DOI] [PMC free article] [PubMed] [Google Scholar]
- 22.Jang JY, Kim J. Association between handgrip strength and cognitive impairment in elderly Koreans: a population-based cross-sectional study. J Phys Ther Sci. 2015;27:3911–3915. doi: 10.1589/jpts.27.3911. [DOI] [PMC free article] [PubMed] [Google Scholar]
- 23.Pedrero-Chamizo R, Albers U, Tobaruela JL, Meléndez A, Castillo MJ, González-Gross M. Physical strength is associated with mini-mental state examination scores in Spanish institutionalized elderly. Geriatr Gerontol Int. 2013;13:1026–1034. doi: 10.1111/ggi.12050. [DOI] [PubMed] [Google Scholar]
- 24.Ukegbu U, Maselko J, Malhotra R, Perera B, Ostbye T. Correlates of handgrip strength and activities of daily living in elderly Sri Lankans. J Am Geriatr Soc. 2014;62:1800–1801. doi: 10.1111/jgs.13000. [DOI] [PMC free article] [PubMed] [Google Scholar]
- 25.Zammit AR, Piccinin AM, Duggan EC, Koval A, Clouston S, Robitaille A, et al. A coordinated multi-study analysis of the longitudinal association between handgrip strength and cognitive function in older adults. J Gerontol B Psychol Sci Soc Sci. 2019 doi: 10.1093/geronb/gbz072. [DOI] [PMC free article] [PubMed] [Google Scholar]
- 26.Choudhary AK, Jiwane R, Alam T, Kishanrao SS. Grip strength and impact on cognitive function in healthy kitchen workers. Achiev Life Sci. 2016;10:168–174. doi: 10.1016/j.als.2016.11.008. [DOI] [Google Scholar]
- 27.Adamo DE, Anderson T, Koochaki M, Fritz NE. Declines in grip strength may indicate early changes in cognition in healthy middle-aged adults. PLoS ONE. 2020;15:e0232021. doi: 10.1371/journal.pone.0232021. [DOI] [PMC free article] [PubMed] [Google Scholar]
- 28.Agbangla NF, Audiffren M, Pylouster J, Albinet C. Working memory, cognitive load and cardiorespiratory fitness: testing the CRUNCHModel with near-infrared spectroscopy. Brain Sci. 2019 doi: 10.3390/brainsci9020038. [DOI] [PMC free article] [PubMed] [Google Scholar]
- 29.Dupuy O, Gauthier CJ, Fraser SA, Desjardins-Crepeau L, Desjardins M, Mekary S, et al. Higher levels of cardiovascular fitness are associated with better executive function and prefrontal oxygenation in younger and older women. Front Hum Neurosci. 2015;9:66. doi: 10.3389/fnhum.2015.00066. [DOI] [PMC free article] [PubMed] [Google Scholar]
- 30.Albinet CT, Mandrick K, Bernard PL, Perrey S, Blain H. Improved cerebral oxygenation response and executive performance as a function of cardiorespiratory fitness in older women: a fNIRS study. Front Aging Neurosci. 2014;6:273185. doi: 10.3389/fnagi.2014.00272. [DOI] [PMC free article] [PubMed] [Google Scholar]
- 31.Hyodo K, Dan I, Kyutoku Y, Suwabe K, Byun K, Ochi G, et al. The association between aerobic fitness and cognitive function in older men mediated by frontal lateralization. NeuroImage. 2016;125:291–300. doi: 10.1016/j.neuroimage.2015.09.062. [DOI] [PubMed] [Google Scholar]
- 32.Mekari S, Dupuy O, Martins R, Evans K, Kimmerly DS, Fraser S, Neyedli HF. The effects of cardiorespiratory fitness on executive function and prefrontal oxygenation in older adults. Geroscience. 2019 doi: 10.1007/s11357-019-00128-5. [DOI] [PMC free article] [PubMed] [Google Scholar]
- 33.Beck AT, Steer RA, Brown GK. Manual for the Beck depression inventory-II. San Antonio: Psychological Corporation; 1996. [Google Scholar]
- 34.Buysse DJ, Reynolds CF, Monk TH, Berman SR, Kupfer DJ. The Pittsburgh Sleep Quality Index: a new instrument for psychiatric practice and research. Psychiatry Res. 1989;28:193–213. doi: 10.1016/0165-1781(89)90047-4. [DOI] [PubMed] [Google Scholar]
- 35.Fuchs R, Klaperski S, Gerber M, Seelig H. Messung der Bewegungs- und Sportaktivität mit dem BSA-Fragebogen. Zeitschrift für Gesundheitspsychologie. 2015;23:60–76. doi: 10.1026/0943-8149/a000137. [DOI] [Google Scholar]
- 36.Bowie CR, Harvey PD. Administration and interpretation of the trail making test. Nat Protoc. 2006;1:2277–2281. doi: 10.1038/nprot.2006.390. [DOI] [PubMed] [Google Scholar]
- 37.Crowe SF. The differential contribution of mental tracking, cognitive flexibility, visual search, and motor speed to performance on parts A and B of the trail making test. J Clin Psychol. 1998;54:585–591. doi: 10.1002/(SICI)1097-4679(199808)54:5<585::AID-JCLP4>3.3.CO;2-M. [DOI] [PubMed] [Google Scholar]
- 38.Corrigan JD, Hinkeldey NS. Relationships between parts A and B of the trail making test. J Clin Psychol. 1987;43:402–409. doi: 10.1002/1097-4679(198707)43:4<402::AID-JCLP2270430411>3.0.CO;2-E. [DOI] [PubMed] [Google Scholar]
- 39.Oldfield RC. The assessment and analysis of handedness: the Edinburgh inventory. Neuropsychologia. 1971;9:97–113. doi: 10.1016/0028-3932(71)90067-4. [DOI] [PubMed] [Google Scholar]
- 40.Dragovic M. Categorization and validation of handedness using latent class analysis. Acta Neuropsychiatr. 2004;16:212–218. doi: 10.1111/j.0924-2708.2004.00087.x. [DOI] [PubMed] [Google Scholar]
- 41.Roberts HC, Denison HJ, Martin HJ, Patel HP, Syddall H, Cooper C, Sayer AA. A review of the measurement of grip strength in clinical and epidemiological studies: towards a standardised approach. Age Ageing. 2011;40:423–429. doi: 10.1093/ageing/afr051. [DOI] [PubMed] [Google Scholar]
- 42.McGrath R, Hackney KJ, Ratamess NA, Vincent BM, Clark BC, Kraemer WJ. Absolute and body mass index normalized handgrip strength percentiles by gender, ethnicity, and hand dominance in Americans. Adv Geriatr Med Res. 2020 doi: 10.20900/agmr20200005. [DOI] [PMC free article] [PubMed] [Google Scholar]
- 43.Cawthon PM, Travison TG, Manini TM, Patel S, Pencina KM, Fielding RA, et al. Establishing the link between lean mass and grip strength cut-points with mobility disability and other health outcomes: proceedings of the sarcopenia definition and outcomes consortium conference. J Gerontol Ser A. 2019 doi: 10.1093/gerona/glz081. [DOI] [PMC free article] [PubMed] [Google Scholar]
- 44.Sternberg S. Memory-scanning: mental processes revealed by reaction-time experiments. Am Sci. 1969;57:421–457. [PubMed] [Google Scholar]
- 45.Holper L, Scholkmann F, Wolf M. The relationship between sympathetic nervous activity and cerebral hemodynamics and oxygenation: a study using skin conductance measurement and functional near-infrared spectroscopy. Behav Brain Res. 2014;270:95–107. doi: 10.1016/j.bbr.2014.04.056. [DOI] [PubMed] [Google Scholar]
- 46.Altamura M, Elvevag B, Blasi G, Bertolino A, Callicott JH, Weinberger DR, et al. Dissociating the effects of Sternberg working memory demands in prefrontal cortex. Psychiatry Res. 2007;154:103–114. doi: 10.1016/j.pscychresns.2006.08.002. [DOI] [PubMed] [Google Scholar]
- 47.D’Esposito M, Postle BR, Rypma B. Prefrontal cortical contributions to working memory: evidence from event-related fMRI studies. Exp Brain Res. 2000;133:3–11. doi: 10.1007/s002210000395. [DOI] [PubMed] [Google Scholar]
- 48.Rypma B, Berger JS, D’Esposito M. The influence of working-memory demand and subject performance on prefrontal cortical activity. J Cogn Neurosci. 2002;14:721–731. doi: 10.1162/08989290260138627. [DOI] [PubMed] [Google Scholar]
- 49.Rypma B, D’Esposito M. Isolating the neural mechanisms of age-related changes in human working memory. Nat Neurosci. 2000;3:509–515. doi: 10.1038/74889. [DOI] [PubMed] [Google Scholar]
- 50.Shah AM, Grotzinger H, Kaczmarzyk JR, Powell LJ, Yücel MA, Gabrieli JDE, Hubbard NA. Fixed and flexible: dynamic prefrontal activations and working memory capacity relationships vary with memory demand. Cogn Neurosci. 2019 doi: 10.1080/17588928.2019.1694500. [DOI] [PMC free article] [PubMed] [Google Scholar]
- 51.Peirce J, Gray JR, Simpson S, MacAskill M, Höchenberger R, Sogo H, et al. PsychoPy2: experiments in behavior made easy. Behav Res Methods. 2019;51:195–203. doi: 10.3758/s13428-018-01193-y. [DOI] [PMC free article] [PubMed] [Google Scholar]
- 52.Peirce JW. PsychoPy—psychophysics software in Python. J Neurosci Methods. 2007;162:8–13. doi: 10.1016/j.jneumeth.2006.11.017. [DOI] [PMC free article] [PubMed] [Google Scholar]
- 53.Peirce JW. Generating stimuli for neuroscience using PsychoPy. Front Neuroinform. 2008;2:10. doi: 10.3389/neuro.11.010.2008. [DOI] [PMC free article] [PubMed] [Google Scholar]
- 54.Herold F, Wiegel P, Scholkmann F, Müller NG. Applications of functional near-infrared spectroscopy (fNIRS) neuroimaging in exercise-cognition science: a systematic, methodology-focused review. J Clin Med. 2018 doi: 10.3390/jcm7120466. [DOI] [PMC free article] [PubMed] [Google Scholar]
- 55.Tarvainen MP, Niskanen J-P, Lipponen JA, Ranta-Aho PO, Karjalainen PA. Kubios HRV—heart rate variability analysis software. Comput Methods Programs Biomed. 2014;113:210–220. doi: 10.1016/j.cmpb.2013.07.024. [DOI] [PubMed] [Google Scholar]
- 56.Tarvainen MP, Lipponen JA, Niskanen J-P, Ranta-Aho PO. Kubios HRV: user’s guide. 2017.
- 57.de Sousa TLW, Di Ostoli TLVP, Sperandio EF, Arantes RL, Gagliardi ARDT, Romiti M, et al. Dose-response relationship between very vigorous physical activity and cardiovascular health assessed by heart rate variability in adults: cross-sectional results from the EPIMOV study. PLoS ONE. 2019;14:e0210216. doi: 10.1371/journal.pone.0210216. [DOI] [PMC free article] [PubMed] [Google Scholar]
- 58.Task Force of The European Society of Cardiology and The North American Society of Pacing and Electrophysiology Heart rate variability. Eur Heart J. 1996;17:28–29. doi: 10.1093/eurheartj/17.suppl_2.28. [DOI] [PubMed] [Google Scholar]
- 59.Herold F, Wiegel P, Scholkmann F, Thiers A, Hamacher D, Schega L. Functional near-infrared spectroscopy in movement science: a systematic review on cortical activity in postural and walking tasks. Neurophoton. 2017;4:41403. doi: 10.1117/1.NPh.4.4.041403. [DOI] [PMC free article] [PubMed] [Google Scholar]
- 60.Scholkmann F, Kleiser S, Metz AJ, Zimmermann R, Mata Pavia J, Wolf U, Wolf M. A review on continuous wave functional near-infrared spectroscopy and imaging instrumentation and methodology. NeuroImage. 2014;85:6–27. doi: 10.1016/j.neuroimage.2013.05.004. [DOI] [PubMed] [Google Scholar]
- 61.Scholkmann F, Wolf M. Measuring brain activity using functional near infrared spectroscopy: a short review. Spectrosc Eur. 2012;24:6–10. [Google Scholar]
- 62.Pinti P, Tachtsidis I, Hamilton A, Hirsch J, Aichelburg C, Gilbert S, Burgess PW. The present and future use of functional near-infrared spectroscopy (fNIRS) for cognitive neuroscience. Ann NY Acad Sci. 2018 doi: 10.1111/nyas.13948. [DOI] [PMC free article] [PubMed] [Google Scholar]
- 63.Agbangla NF, Audiffren M, Albinet CT. Use of Near-infrared Spectroscopy in the investigation of brain activation during cognitive aging: a systematic review of an emerging area of research. Ageing Res Rev. 2017 doi: 10.1016/j.arr.2017.07.003. [DOI] [PubMed] [Google Scholar]
- 64.Perrey S. Non-invasive NIR spectroscopy of human brain function during exercise. Methods. 2008;45:289–299. doi: 10.1016/j.ymeth.2008.04.005. [DOI] [PubMed] [Google Scholar]
- 65.Ekkekakis P. Illuminating the black box: investigating prefrontal cortical hemodynamics during exercise with near-infrared spectroscopy. J Sport Exerc Psychol. 2009;31:505–553. doi: 10.1123/jsep.31.4.505. [DOI] [PubMed] [Google Scholar]
- 66.Fantini S, Ruesch A, Kainerstorfer JM. Neurophotonics and biomedical spectroscopy. Amsterdam: Elsevier; 2019. Noninvasive optical studies of the brain; pp. 25–52. [Google Scholar]
- 67.Jurcak V, Tsuzuki D, Dan I. 10/20, 10/10, and 10/5 systems revisited: their validity as relative head-surface-based positioning systems. NeuroImage. 2007;34:1600–1611. doi: 10.1016/j.neuroimage.2006.09.024. [DOI] [PubMed] [Google Scholar]
- 68.Zimeo Morais GA, Balardin JB, Sato JR. fNIRS Optodes’ location decider (fOLD): a toolbox for probe arrangement guided by brain regions-of-interest. Sci Rep. 2018;8:3341. doi: 10.1038/s41598-018-21716-z. [DOI] [PMC free article] [PubMed] [Google Scholar]
- 69.Rorden C, Brett M. Stereotaxic display of brain lesions. Behav Neurol. 2000;12:191–200. doi: 10.1155/2000/421719. [DOI] [PubMed] [Google Scholar]
- 70.Huppert TJ, Diamond SG, Franceschini MA, Boas DA. HomER: a review of time-series analysis methods for near-infrared spectroscopy of the brain. Appl Opt. 2009;48:98. doi: 10.1364/AO.48.00D280. [DOI] [PMC free article] [PubMed] [Google Scholar]
- 71.Pinti P, Scholkmann F, Hamilton A, Burgess P, Tachtsidis I. Current status and issues regarding pre-processing of fNIRS neuroimaging data: an investigation of diverse signal filtering methods within a general linear model framework. Front Hum Neurosci. 2019;12:43704. doi: 10.3389/fnhum.2018.00505. [DOI] [PMC free article] [PubMed] [Google Scholar]
- 72.Brigadoi S, Ceccherini L, Cutini S, Scarpa F, Scatturin P, Selb J, et al. Motion artifacts in functional near-infrared spectroscopy: a comparison of motion correction techniques applied to real cognitive data. NeuroImage. 2014;85:181–191. doi: 10.1016/j.neuroimage.2013.04.082. [DOI] [PMC free article] [PubMed] [Google Scholar]
- 73.Molavi B, Dumont GA. Wavelet-based motion artifact removal for functional near-infrared spectroscopy. Physiol Meas. 2012;33:259–270. doi: 10.1088/0967-3334/33/2/259. [DOI] [PubMed] [Google Scholar]
- 74.Seidel O, Carius D, Roediger J, Rumpf S, Ragert P. Changes in neurovascular coupling during cycling exercise measured by multi-distance fNIRS: a comparison between endurance athletes and physically active controls. Exp Brain Res. 2019;11:e0165226. doi: 10.1007/s00221-019-05646-4. [DOI] [PMC free article] [PubMed] [Google Scholar]
- 75.Carius D, Hörnig L, Ragert P, Kaminski E. Characterizing cortical hemodynamic changes during climbing and its relation to climbing expertise. Neurosci Lett. 2019 doi: 10.1016/j.neulet.2019.134604. [DOI] [PubMed] [Google Scholar]
- 76.Herold F, Aye N, Hamacher D, Schega L. Towards the neuromotor control processes of steady-state and speed-matched treadmill and overground walking. Brain Topogr. 2019 doi: 10.1007/s10548-019-00699-8. [DOI] [PubMed] [Google Scholar]
- 77.Wiggins IM, Hartley DEH. A synchrony-dependent influence of sounds on activity in visual cortex measured using functional near-infrared spectroscopy (fNIRS) PLoS ONE. 2015;10:e0122862. doi: 10.1371/journal.pone.0122862. [DOI] [PMC free article] [PubMed] [Google Scholar]
- 78.Scholkmann F, Wolf M. General equation for the differential pathlength factor of the frontal human head depending on wavelength and age. J Biomed Opt. 2013;18:105004. doi: 10.1117/1.JBO.18.10.105004. [DOI] [PubMed] [Google Scholar]
- 79.Yücel MA, Selb JJ, Huppert TJ, Franceschini MA, Boas DA. Functional near infrared spectroscopy: enabling routine functional brain imaging. Curr Opin Biomed Eng. 2017;4:78–86. doi: 10.1016/j.cobme.2017.09.011. [DOI] [PMC free article] [PubMed] [Google Scholar]
- 80.Tachtsidis I, Scholkmann F. False positives and false negatives in functional near-infrared spectroscopy: issues, challenges, and the way forward. Neurophotonics. 2016;3:30401. doi: 10.1117/1.NPh.3.3.030401. [DOI] [PMC free article] [PubMed] [Google Scholar]
- 81.Ye JC, Tak S, Jang KE, Jung J, Jang J. NIRS-SPM: statistical parametric mapping for near-infrared spectroscopy. NeuroImage. 2009;44:428–447. doi: 10.1016/j.neuroimage.2008.08.036. [DOI] [PubMed] [Google Scholar]
- 82.Gagnon L, Perdue K, Greve DN, Goldenholz D, Kaskhedikar G, Boas DA. Improved recovery of the hemodynamic response in diffuse optical imaging using short optode separations and state-space modeling. NeuroImage. 2011;56:1362–1371. doi: 10.1016/j.neuroimage.2011.03.001. [DOI] [PMC free article] [PubMed] [Google Scholar]
- 83.Nemani A, Yücel MA, Kruger U, Gee DW, Cooper C, Schwaitzberg SD, et al. Assessing bimanual motor skills with optical neuroimaging. Sci Adv. 2018;4:eaat3807. doi: 10.1126/sciadv.aat3807. [DOI] [PMC free article] [PubMed] [Google Scholar]
- 84.Jahani S, Fantana AL, Harper D, Ellison JM, Boas DA, Forester BP, Yücel MA. fNIRS can robustly measure brain activity during memory encoding and retrieval in healthy subjects. Sci Rep. 2017;7:9533. doi: 10.1038/s41598-017-09868-w. [DOI] [PMC free article] [PubMed] [Google Scholar]
- 85.Yücel MA, Selb J, Aasted CM, Lin P-Y, Borsook D, Becerra L, Boas DA. Mayer waves reduce the accuracy of estimated hemodynamic response functions in functional near-infrared spectroscopy. Biomed Opt Express. 2016;7:3078–3088. doi: 10.1364/BOE.7.003078. [DOI] [PMC free article] [PubMed] [Google Scholar]
- 86.Yücel MA, Selb J, Aasted CM, Petkov MP, Becerra L, Borsook D, Boas DA. Short separation regression improves statistical significance and better localizes the hemodynamic response obtained by near-infrared spectroscopy for tasks with differing autonomic responses. Neurophotonics. 2015;2:35005. doi: 10.1117/1.NPh.2.3.035005. [DOI] [PMC free article] [PubMed] [Google Scholar]
- 87.Aasted CM, Yücel MA, Steele SC, Peng K, Boas DA, Becerra L, Borsook D. Frontal lobe hemodynamic responses to painful stimulation: a potential brain marker of nociception. PLoS ONE. 2016;11:e0165226. doi: 10.1371/journal.pone.0165226. [DOI] [PMC free article] [PubMed] [Google Scholar]
- 88.Yücel MA, Aasted CM, Petkov MP, Borsook D, Boas DA, Becerra L. Specificity of hemodynamic brain responses to painful stimuli: a functional near-infrared spectroscopy study. Sci Rep. 2015;5:9469. doi: 10.1038/srep09469. [DOI] [PMC free article] [PubMed] [Google Scholar]
- 89.von Lühmann A, Li X, Müller K-R, Boas DA, Yücel MA. Improved physiological noise regression in fNIRS: a multimodal extension of the general linear model using temporally embedded canonical correlation analysis. NeuroImage. 2019;208:116472. doi: 10.1016/j.neuroimage.2019.116472. [DOI] [PMC free article] [PubMed] [Google Scholar]
- 90.Broscheid K-C, Hamacher D, Lamprecht J, Sailer M, Schega L. Inter-session reliability of functional near-infrared spectroscopy at the prefrontal cortex while walking in multiple sclerosis. Brain Sci. 2020;10:643. doi: 10.3390/brainsci10090643. [DOI] [PMC free article] [PubMed] [Google Scholar]
- 91.Jahani S, Setarehdan SK, Boas DA, Yücel MA. Motion artifact detection and correction in functional near-infrared spectroscopy: a new hybrid method based on spline interpolation method and Savitzky–Golay filtering. Neurophotonics. 2018;5:15003. doi: 10.1117/1.NPh.5.1.015003. [DOI] [PMC free article] [PubMed] [Google Scholar]
- 92.Gagnon L, Cooper RJ, Yücel MA, Perdue KL, Greve DN, Boas DA. Short separation channel location impacts the performance of short channel regression in NIRS. NeuroImage. 2012;59:2518–2528. doi: 10.1016/j.neuroimage.2011.08.095. [DOI] [PMC free article] [PubMed] [Google Scholar]
- 93.Kwee IL, Nakada T. Dorsolateral prefrontal lobe activation declines significantly with age—functional NIRS study. J Neurol. 2003;250:525–529. doi: 10.1007/s00415-003-1028-x. [DOI] [PubMed] [Google Scholar]
- 94.Gao C, Sun J, Yang X, Gong H. Gender differences in brain networks during verbal Sternberg tasks: a simultaneous near-infrared spectroscopy and electro-encephalography study. J Biophotonics. 2017 doi: 10.1002/jbio.201700120. [DOI] [PubMed] [Google Scholar]
- 95.Zhu W. Sadly, the earth is still round (p < 0.05) J Sport Health Sci. 2012;1:9–11. doi: 10.1016/j.jshs.2012.02.002. [DOI] [Google Scholar]
- 96.Zhu W. p < 0.05, < 0.01, < 0.001, < 0.0001, < 0.00001, < 0.000001, or < 0.0000001 …. J Sport Health Sci. 2016 doi: 10.1016/j.jshs.2016.01.019. [DOI] [PMC free article] [PubMed] [Google Scholar]
- 97.Alfons A, Ates N, Groenen PJF. A robust bootstrap test for mediation analysis. SSRN J. 2018 doi: 10.2139/ssrn.3227731. [DOI] [Google Scholar]
- 98.Kaushal N, Rhodes RE, Meldrum JT, Spence JC. Mediating mechanisms in a physical activity intervention: a test of habit formation. J Sport Exerc Psychol. 2018;40:101–110. doi: 10.1123/jsep.2017-0307. [DOI] [PubMed] [Google Scholar]
- 99.Hayes AF, Rockwood NJ. Regression-based statistical mediation and moderation analysis in clinical research: observations, recommendations, and implementation. Behav Res Ther. 2016 doi: 10.1016/j.brat.2016.11.001. [DOI] [PubMed] [Google Scholar]
- 100.Hayes AF. Beyond Baron and Kenny: statistical mediation analysis in the new millennium. Commun Monogr. 2009;76:408–420. doi: 10.1080/03637750903310360. [DOI] [Google Scholar]
- 101.Ferguson CJ. An effect size primer: a guide for clinicians and researchers. Prof Psychol Res Pract. 2009;40:532–538. doi: 10.1037/a0015808. [DOI] [Google Scholar]
- 102.von Glischinski M, von Brachel R, Hirschfeld G. How depressed is “depressed”? a systematic review and diagnostic meta-analysis of optimal cut points for the Beck depression inventory revised (BDI-II) Qual Life Res. 2019;28:1111–1118. doi: 10.1007/s11136-018-2050-x. [DOI] [PubMed] [Google Scholar]
- 103.Dozois DJA, Dobson KS, Ahnberg JL. A psychometric evaluation of the Beck depression inventory-II. Psychol Assess. 1998;10:83–89. doi: 10.1037/1040-3590.10.2.83. [DOI] [Google Scholar]
- 104.Bull FC, Al-Ansari SS, Biddle S, Borodulin K, Buman MP, Cardon G, et al. World Health Organization 2020 guidelines on physical activity and sedentary behaviour. Br J Sports Med. 2020;54:1451–1462. doi: 10.1136/bjsports-2020-102955. [DOI] [PMC free article] [PubMed] [Google Scholar]
- 105.Backhaus J, Junghanns K, Broocks A, Riemann D, Hohagen F. Test–retest reliability and validity of the Pittsburgh Sleep Quality Index in primary insomnia. J Psychosom Res. 2002;53:737–740. doi: 10.1016/S0022-3999(02)00330-6. [DOI] [PubMed] [Google Scholar]
- 106.Bierre KL, Lucas SJE, Guiney H, Cotter JD, Machado L. Cognitive difficulty intensifies age-related changes in anterior frontal hemodynamics: novel evidence from near-infrared spectroscopy. J Gerontol A Biol Sci Med Sci. 2017;72:181–188. doi: 10.1093/gerona/glw061. [DOI] [PubMed] [Google Scholar]
- 107.Yanagisawa H, Dan I, Tsuzuki D, Kato M, Okamoto M, Kyutoku Y, Soya H. Acute moderate exercise elicits increased dorsolateral prefrontal activation and improves cognitive performance with Stroop test. NeuroImage. 2010;50:1702–1710. doi: 10.1016/j.neuroimage.2009.12.023. [DOI] [PubMed] [Google Scholar]
- 108.Hyodo K, Dan I, Suwabe K, Kyutoku Y, Yamada Y, Akahori M, et al. Acute moderate exercise enhances compensatory brain activation in older adults. Neurobiol Aging. 2012;33:2621–2632. doi: 10.1016/j.neurobiolaging.2011.12.022. [DOI] [PubMed] [Google Scholar]
- 109.Byun K, Hyodo K, Suwabe K, Ochi G, Sakairi Y, Kato M, et al. Positive effect of acute mild exercise on executive function via arousal-related prefrontal activations: an fNIRS study. NeuroImage. 2014;98:336–345. doi: 10.1016/j.neuroimage.2014.04.067. [DOI] [PubMed] [Google Scholar]
- 110.Kujach S, Byun K, Hyodo K, Suwabe K, Fukuie T, Laskowski R, et al. A transferable high-intensity intermittent exercise improves executive performance in association with dorsolateral prefrontal activation in young adults. NeuroImage. 2017 doi: 10.1016/j.neuroimage.2017.12.003. [DOI] [PubMed] [Google Scholar]
- 111.Mekari S, Fraser S, Bosquet L, Bonnery C, Labelle V, Pouliot P, et al. The relationship between exercise intensity, cerebral oxygenation and cognitive performance in young adults. Eur J Appl Physiol. 2015;115:2189–2197. doi: 10.1007/s00421-015-3199-4. [DOI] [PubMed] [Google Scholar]
- 112.Fabiani M, Gordon BA, Maclin EL, Pearson MA, Brumback-Peltz CR, Low KA, et al. Neurovascular coupling in normal aging: a combined optical, ERP and fMRI study. NeuroImage. 2014;85(Pt 1):592–607. doi: 10.1016/j.neuroimage.2013.04.113. [DOI] [PMC free article] [PubMed] [Google Scholar]
- 113.Goenarjo R, Dupuy O, Fraser S, Perrochon A, Berryman N, Bosquet L. Cardiorespiratory fitness, blood pressure, and cerebral oxygenation during a dual-task in healthy young males. Behav Brain Res. 2019 doi: 10.1016/j.bbr.2019.112422. [DOI] [PubMed] [Google Scholar]
- 114.Tieland M, Verdijk LB, de Groot LCPGM, van Loon LJC. Handgrip strength does not represent an appropriate measure to evaluate changes in muscle strength during an exercise intervention program in frail older people. Int J Sport Nutr Exerc Metab. 2015;25:27–36. doi: 10.1123/ijsnem.2013-0123. [DOI] [PubMed] [Google Scholar]
- 115.Rhodes EC, Martin AD, Taunton JE, Donnelly M, Warren J, Elliot J. Effects of one year of resistance training on the relation between muscular strength and bone density in elderly women. Br J Sports Med. 2000;34:18–22. doi: 10.1136/bjsm.34.1.18. [DOI] [PMC free article] [PubMed] [Google Scholar]
- 116.Labott BK, Bucht H, Morat M, Morat T, Donath L. Effects of exercise training on handgrip strength in older adults: a meta-analytical review. Gerontology. 2019 doi: 10.1159/000501203. [DOI] [PubMed] [Google Scholar]
- 117.Buckner SL, Dankel S, Bell ZW, Abe T, Loenneke J. The association of hand grip strength and mortality: what does it tell us and what can we do with it? Rejuvenation Res. 2018 doi: 10.1089/rej.2018.2111. [DOI] [PubMed] [Google Scholar]
- 118.Buckner SL, Dankel SJ, Mouser JG, Mattocks KT, Jessee MB, Loenneke JP. Chasing the top quartile of cross-sectional data: is it possible with resistance training? Med Hypotheses. 2017;108:63–68. doi: 10.1016/j.mehy.2017.08.009. [DOI] [PubMed] [Google Scholar]
- 119.Tsujii T, Komatsu K, Sakatani K. Acute effects of physical exercise on prefrontal cortex activity in older adults: a functional near-infrared spectroscopy study. Adv Exp Med Biol. 2013;765:293–298. doi: 10.1007/978-1-4614-4989-8_41. [DOI] [PubMed] [Google Scholar]
- 120.Moriya M, Aoki C, Sakatani K. Effects of physical exercise on working memory and prefrontal cortex function in post-stroke patients. Adv Exp Med Biol. 2016;923:203–208. doi: 10.1007/978-3-319-38810-6_27. [DOI] [PubMed] [Google Scholar]
- 121.Hsieh S-S, Chang Y-K, Hung T-M, Fang C-L. The effects of acute resistance exercise on young and older males’ working memory. Psychol Sport Exerc. 2016;22:286–293. doi: 10.1016/j.psychsport.2015.09.004. [DOI] [PubMed] [Google Scholar]
- 122.Pontifex MB, Hillman CH, Fernhall B, Thompson KM, Valentini TA. The effect of acute aerobic and resistance exercise on working memory. Med Sci Sports Exerc. 2009;41:927–934. doi: 10.1249/MSS.0b013e3181907d69. [DOI] [PubMed] [Google Scholar]
- 123.Quelhas Martins A, Kavussanu M, Willoughby A, Ring C. Moderate intensity exercise facilitates working memory. Psychol Sport Exerc. 2013;14:323–328. doi: 10.1016/j.psychsport.2012.11.010. [DOI] [Google Scholar]
- 124.Ludyga S, Gerber M, Kamijo K, Brand S, Pühse U. The effects of a school-based exercise program on neurophysiological indices of working memory operations in adolescents. J Sci Med Sport. 2018 doi: 10.1016/j.jsams.2018.01.001. [DOI] [PubMed] [Google Scholar]
- 125.Voelcker-Rehage C, Godde B, Staudinger UM. Cardiovascular and coordination training differentially improve cognitive performance and neural processing in older adults. Front Hum Neurosci. 2011;5:26. doi: 10.3389/fnhum.2011.00026. [DOI] [PMC free article] [PubMed] [Google Scholar]
- 126.Voelcker-Rehage C, Godde B, Staudinger UM. Physical and motor fitness are both related to cognition in old age. Eur J Neurosci. 2010;31:167–176. doi: 10.1111/j.1460-9568.2009.07014.x. [DOI] [PubMed] [Google Scholar]
- 127.Voelcker-Rehage C, Niemann C. Structural and functional brain changes related to different types of physical activity across the life span. Neurosci Biobehav Rev. 2013;37:2268–2295. doi: 10.1016/j.neubiorev.2013.01.028. [DOI] [PubMed] [Google Scholar]
- 128.Yücel MA, Lühmann AV, Scholkmann F, Gervain J, Dan I, Ayaz H, et al. Best practices for fNIRS publications. Neurophoton. 2021 doi: 10.1117/1.NPh.8.1.012101. [DOI] [PMC free article] [PubMed] [Google Scholar]
- 129.Herold F, Gronwald T, Scholkmann F, Zohdi H, Wyser D, Müller NG, Hamacher D. New directions in exercise prescription: is there a role for brain-derived parameters obtained by functional near-infrared spectroscopy? Brain Sci. 2020 doi: 10.3390/brainsci10060342. [DOI] [PMC free article] [PubMed] [Google Scholar]
- 130.Metz AJ, Klein SD, Scholkmann F, Wolf U. Continuous coloured light altered human brain haemodynamics and oxygenation assessed by systemic physiology augmented functional near-infrared spectroscopy. Sci Rep. 2017;7:10027. doi: 10.1038/s41598-017-09970-z. [DOI] [PMC free article] [PubMed] [Google Scholar]
- 131.Scholkmann F, Hafner T, Metz AJ, Wolf M, Wolf U. Effect of short-term colored-light exposure on cerebral hemodynamics and oxygenation, and systemic physiological activity. Neurophoton. 2017;4:1. doi: 10.1117/1.NPh.4.4.045005. [DOI] [PMC free article] [PubMed] [Google Scholar]
- 132.Zohdi H, Scholkmann F, Wolf U. Frontal cerebral oxygenation asymmetry: intersubject variability and dependence on systemic physiology, season, and time of day. Neurophoton. 2020;7:1. doi: 10.1117/1.NPh.7.2.025006. [DOI] [PMC free article] [PubMed] [Google Scholar]
- 133.Zohdi H, Scholkmann F, Wolf U. Individual differences in hemodynamic responses measured on the head due to a long-term stimulation involving colored light exposure and a cognitive task: a SPA-fNIRS study. Brain Sci. 2021;11:54. doi: 10.3390/brainsci11010054. [DOI] [PMC free article] [PubMed] [Google Scholar]
- 134.Rothman KJ. No adjustments are needed for multiple comparisons. Epidemiology. 1990;1:43–46. doi: 10.1097/00001648-199001000-00010. [DOI] [PubMed] [Google Scholar]
- 135.Bender R, Lange S. Adjusting for multiple testing—when and how? J Clin Epidemiol. 2001;54:343–349. doi: 10.1016/S0895-4356(00)00314-0. [DOI] [PubMed] [Google Scholar]
- 136.Perneger TV. What’s wrong with Bonferroni adjustments. BMJ. 1998;316:1236–1238. doi: 10.1136/bmj.316.7139.1236. [DOI] [PMC free article] [PubMed] [Google Scholar]
Associated Data
This section collects any data citations, data availability statements, or supplementary materials included in this article.
Supplementary Materials
Additional file 1: Table S1. Detailed overview of the probe placement which shows the exact position of the sources and detectors in the 10–20 EEG system, the MNI coordinates (X, Y, Z), the corresponding anatomical landmarks (e.g., dorsolateral prefrontal cortex) and the distance between sources and detectors. Please note that this output was generated by using the fOLD-software [68]
Data Availability Statement
The public sharing of the data from this trial has been restricted by the local Research Ethics Committee in order to protect participants’ privacy. Data are therefore only available on reasonable request from the corresponding author.